

Market Minds Advisory
Flight Inspection Market

Flight Inspection Market: Shrinking Beacon Estates, Procedure Validation and Aircraft Repurposed Mid-Cycle

An industry whose aircraft were built to calibrate radio transmitters and now spend their time validating approaches with no ground equipment at all, as the beacons they were bought to check disappear.

Lead Analyst

Published

September 2026

Make Smarter Decisions with Customized Research Insights

Request a free sample report and evaluate market opportunities, growth trends, and competitive dynamics relevant to your business needs.

2025 MARKET VALUE$1.4BMarket Size 2025
2036 FORECAST VALUE$2.7BBase Case , 2026 to 2036
CAGR 2026 TO 20366.2 %Bull 7.4% / Bear 5.0%
INCREMENTAL OPPORTUNITY$1.2BNet 10- year value creation
EXPANSION MULTIPLE1.83x2036 value over 2026 base
Strategic Levers
M&A Pipeline
Regional Outlook
Country Rankings
Competitive Intelligence
Segmental Deep-dive
Call-Us : 91 93563 13602

Executive Snapshot and Market Trajectory

Flight inspection exists because a state cannot publish an instrument approach until somebody has flown it and measured what the crew will actually receive. That obligation is written into international standards, not into any commercial argument, and it does not ever simply go away.
The revenue base underneath it is inverting. Conventional beacons are being withdrawn at roughly 3.1% a year as states retire navigation networks built for a different era, taking periodic recalibration revenue with them. What replaces it is procedure validation, already 38% of revenue, where the approach depends on satellite signals and there is no transmitter to calibrate at all. The obstacle environment still has to be checked from an actual aircraft in flight.
So the fleet is being repurposed rather than replaced. Roughly 310 equipped aircraft operate worldwide carrying receivers bought to measure ground stations, now flying missions that validate airspace instead. East Asia holds the largest regional share because China is building airports faster than anywhere else, and satellite augmentation work grows fastest at 9.3%. The equipment fitted on board was mostly specified for the work that is now disappearing.
Market Definition
Revenue from airborne inspection, calibration and validation of navigation aids, instrument flight procedures, surveillance systems and visual aids, comprising contracted inspection services, flight inspection system supply and integration, and associated procedure design and validation work. Excludes ground navaid manufacture and maintenance, air traffic management systems, airport construction, and aerial survey work unconnected to navigation certification.
Base Year Value
$1.4B in 2025 (MMA Primary Research Dataset, August 2026)
Forecast Period
2026 to 2036, eleven discrete annual values
CAGR
6.2% base case. Bull 7.4%. Bear 5.0%.
Fastest Growth Segment
Satellite and Ground-Based Augmentation: 9.3% CAGR
Fastest Growth Country
India: 8.2% CAGR
Fastest Growth Region
South Asia and Pacific: 8.2% CAGR
Largest Region
East Asia: 29% of 2025 global value
Market Leaders
Aerodata AG, Norwegian Special Mission, Flight Calibration Services, Thales and Indra Sistemas lead on inspection revenue and installed system base. Source: company annual reports and MMA Primary Research Dataset, July 2026.
Primary Survey
n=3,800 procurement and R&D decision-makers, Q4 2025, six countries
Methodology
Demand-side build-up, cross-validated against public data, 47 expert interviews

Flight Inspection Market Forecast Scenarios

flight-inspection-market-size-forecast-scenario-1787982855544
The 2020 to 2025 period was distorted at both ends. Traffic collapsed in 2020 but inspection intervals are set by calendar rather than by movements, so the work continued while the authorities funding it lost revenue, and several states deferred what they could. Recovery then coincided with large airport construction programmes across Asia. Revenue compounded near 5.2%, held back by beacon withdrawals running the other way.
Three mechanisms carry the base case forward. Procedure proliferation continues as states meet performance-based navigation obligations, and every published approach requires flight validation before use. Airport construction across Asia adds new navigation infrastructure and new procedures simultaneously. And the existing inspection fleet is ageing enough that recapitalisation demand for systems and aircraft integration arrives regardless of how the service market develops from here. That demand is independent of everything else.
The bull catalyst is wider ground-based augmentation deployment, since each installation requires commissioning and periodic checks at a fee level well above conventional work. The bear risk is unmanned inspection maturing faster than expected: if authorities accept drone-based checks for the routine portion of the workload, the aircraft fleet loses its volume base while keeping every fixed cost it carries.

Measuring What The Crew Will Actually Receive

The governing document is an international standards manual on testing radio navigation aids, and it prescribes what must be measured, how often and to what tolerance. States implement it through national regulation. That makes flight inspection a compliance activity rather than a discretionary one, and demand is set by a published calendar rather than by traffic or economics. Movements can halve and the schedule does not move.
MARKET CONCENTRATION CR563%Share of inspection revenue held by leading providers
AVERAGE INSPECTION INTERVAL180 daysPeriod between required checks on a precision approach
FLIGHT HOUR COSTUSD 4,200Direct operating cost for an equipped inspection aircraft
AIRCRAFT FLEET SIZE310Purpose equipped inspection aircraft currently operating worldwide today
PROCEDURE VALIDATION SHARE38%Revenue derived from checking approaches without ground transmitters
NAVAID DECOMMISSIONING RATE3.1%Conventional ground beacons withdrawn from service each year
What has changed is what gets inspected. Conventional beacons are disappearing at roughly 3.1% annually as states retire networks designed around ground transmitters, with the American minimum operational network programme the clearest example and European rationalisation following comparable logic. Each withdrawal removes a recurring inspection from somebody's schedule permanently. That is a shrinking base and it used to be the whole business.
Procedure validation replaced it, and the work is genuinely different. A satellite-based approach has no transmitter to calibrate, so what an inspection aircraft measures instead is signal reception through the actual obstacle environment, terrain masking, and whether the procedure flies as designed. Roughly 38% of revenue now comes from that work. The aircraft and the crews transferred across; the receivers and the software largely did not.
"This industry bought aircraft to check transmitters and now uses them to check airspace. The equipment on board is the wrong equipment for the work that is growing, and almost nobody has finished replacing it."
Director, Air Navigation Services Practice · MMA Aerospace and Defence Services Practice · August 2026

Market Trends

Conventional Beacon Networks Shrink On Published Schedules

States are retiring conventional navigation beacons on programmes announced years in advance, keeping a reduced network for contingency rather than for primary navigation. The American minimum operational network is the most documented case, cutting a fleet of ground stations by roughly a third while retaining coverage for aircraft losing satellite navigation. Each retirement removes a recurring inspection obligation permanently, and the schedules are public, so providers can see the revenue disappearing several years before it does. Very few have restructured their cost base against that visibility. The schedules are entirely public.
Market Impact: Adds 4 procedures per runway

Unmanned Platforms Enter The Routine Inspection Workload

Several air navigation service providers have trialled unmanned aircraft for signal measurement on landing systems, and the technical case is straightforward: a small platform carrying a receiver can fly a repeatable profile at a fraction of the hourly cost of a twin turboprop. Regulatory acceptance is the constraint, since inspection results carry legal weight and authorities want demonstrated equivalence before changing anything. The routine periodic portion of the workload is most exposed. Commissioning and complex procedure validation are considerably harder to move. Authorities are testing this, not merely discussing it any more.
Market Impact: Adds 30 new airport estates

Market Opportunities and Growth Drivers

Performance-Based Navigation Obligations Multiply Published Procedures

European regulation requires instrument runways to implement performance-based navigation approaches on a defined timetable, and comparable obligations apply through international commitments elsewhere. Every published procedure requires flight validation before use and periodic review afterwards. Because a single runway can carry several procedures where it previously carried one, the count grows faster than the airport count does. This is the clearest growth mechanism in the market, it is written into regulation rather than into any commercial case, and it runs for another decade at least. Nothing about that mechanism depends on traffic growth.
Market Impact: Retains 44% of work in-house

Asian Airport Construction Creates Entirely New Estates

China's civil aviation authority has published targets implying hundreds of certified transport airports by the mid-2030s, and India is expanding regional connectivity on a comparable trajectory. Each new airport arrives with landing systems, lighting, procedures and surveillance requiring commissioning inspection before any traffic operates, then joins the periodic schedule permanently. This is the only place in the world where the inspected estate is growing rather than shrinking. Providers without regional presence or an approved status there capture none of it whatsoever. Approval status decides who gets to bid, long before anybody prices anything.
Market Impact: Leaves 38% of work underserved

Market Restraints and Challenges

State Operated Fleets Remove Work From The Merchant Market

Many aviation authorities operate their own inspection aircraft rather than contracting the work, so a substantial share of global activity never reaches a commercial provider at all. The root cause is that inspection results carry regulatory weight and states have historically preferred to hold that capability themselves. Commercially it caps the addressable market well below the activity level. Providers mitigate by selling flight inspection systems and aircraft integration to those states instead of services, by winning contingency and overflow contracts, and by targeting authorities without the budget to operate fleets.
Market Impact: Removes 3.1% of beacons yearly

Equipment Fitted Measures The Wrong Things Increasingly

Inspection systems installed a decade ago were specified to measure ground transmitter performance, which is precisely the work that is shrinking. The root cause is a fifteen year equipment life against a market that changed inside five. Validating satellite procedures needs different receivers, different processing and different reporting, and retrofitting an aircraft costs real money against contracts already priced. Providers mitigate by phasing upgrades at scheduled maintenance, by specifying modular systems on new integrations, and by pricing procedure validation separately to fund the transition. Fifteen year equipment life against a five year market shift.
Market Impact: Cuts hourly cost by 70%
3 additional market trends, 4 additional growth drivers, and 2 additional restraints and challenges are covered in the full report. Contact sales@marketmindsadvisory.com to access the complete intelligence.

Segment CAGR and Growth Architecture

Segmentation follows the asset being inspected, since that determines the equipment required on board, the tolerance the check must demonstrate and the fee the work commands. Six asset types describe the market completely, from the landing systems that anchor most schedules through to the satellite augmentation work that carries no ground transmitter of any kind whatsoever.
flight-inspection-market-market-share-analysis-1787982856076

Satellite and Ground-Based Augmentation

The fastest asset type grows at 9.3%, half again the market rate of 6.2%, and it grows because augmentation systems are being installed while conventional beacons are being removed. Ground-based augmentation serving precision approaches requires commissioning inspection covering signal integrity across the whole coverage volume, then periodic verification afterwards, and the work is considerably more demanding than checking a single landing system localiser. Satellite augmentation validation adds regional signal quality assessment across large service areas. Fee levels sit well above conventional work because few providers hold the receivers, the analysis capability or the approvals to perform it properly at all. Very few operators hold all three, and that shortage is what sustains the pricing.
CAGR 9.3%

Performance-Based Navigation Procedures

Procedure validation grows at 8.1% and has already reached 38% of market revenue, which most descriptions of this industry still fail to reflect. There is no transmitter involved. What the aircraft measures is whether the designed procedure is actually flyable, whether terrain and obstacles intrude on the protected surfaces, and whether satellite reception holds through the approach in real conditions rather than in a database. European regulation obliges instrument runways to publish these procedures on a timetable, and a runway that once carried one approach may now carry four. Each requires initial validation and periodic review afterwards, permanently. An aircraft is still required, and no database check substitutes for flying the procedure.
CAGR 8.1%
Full segment breakdown across 6 segments available in the complete report.

Regional Architecture and Country Demand Map

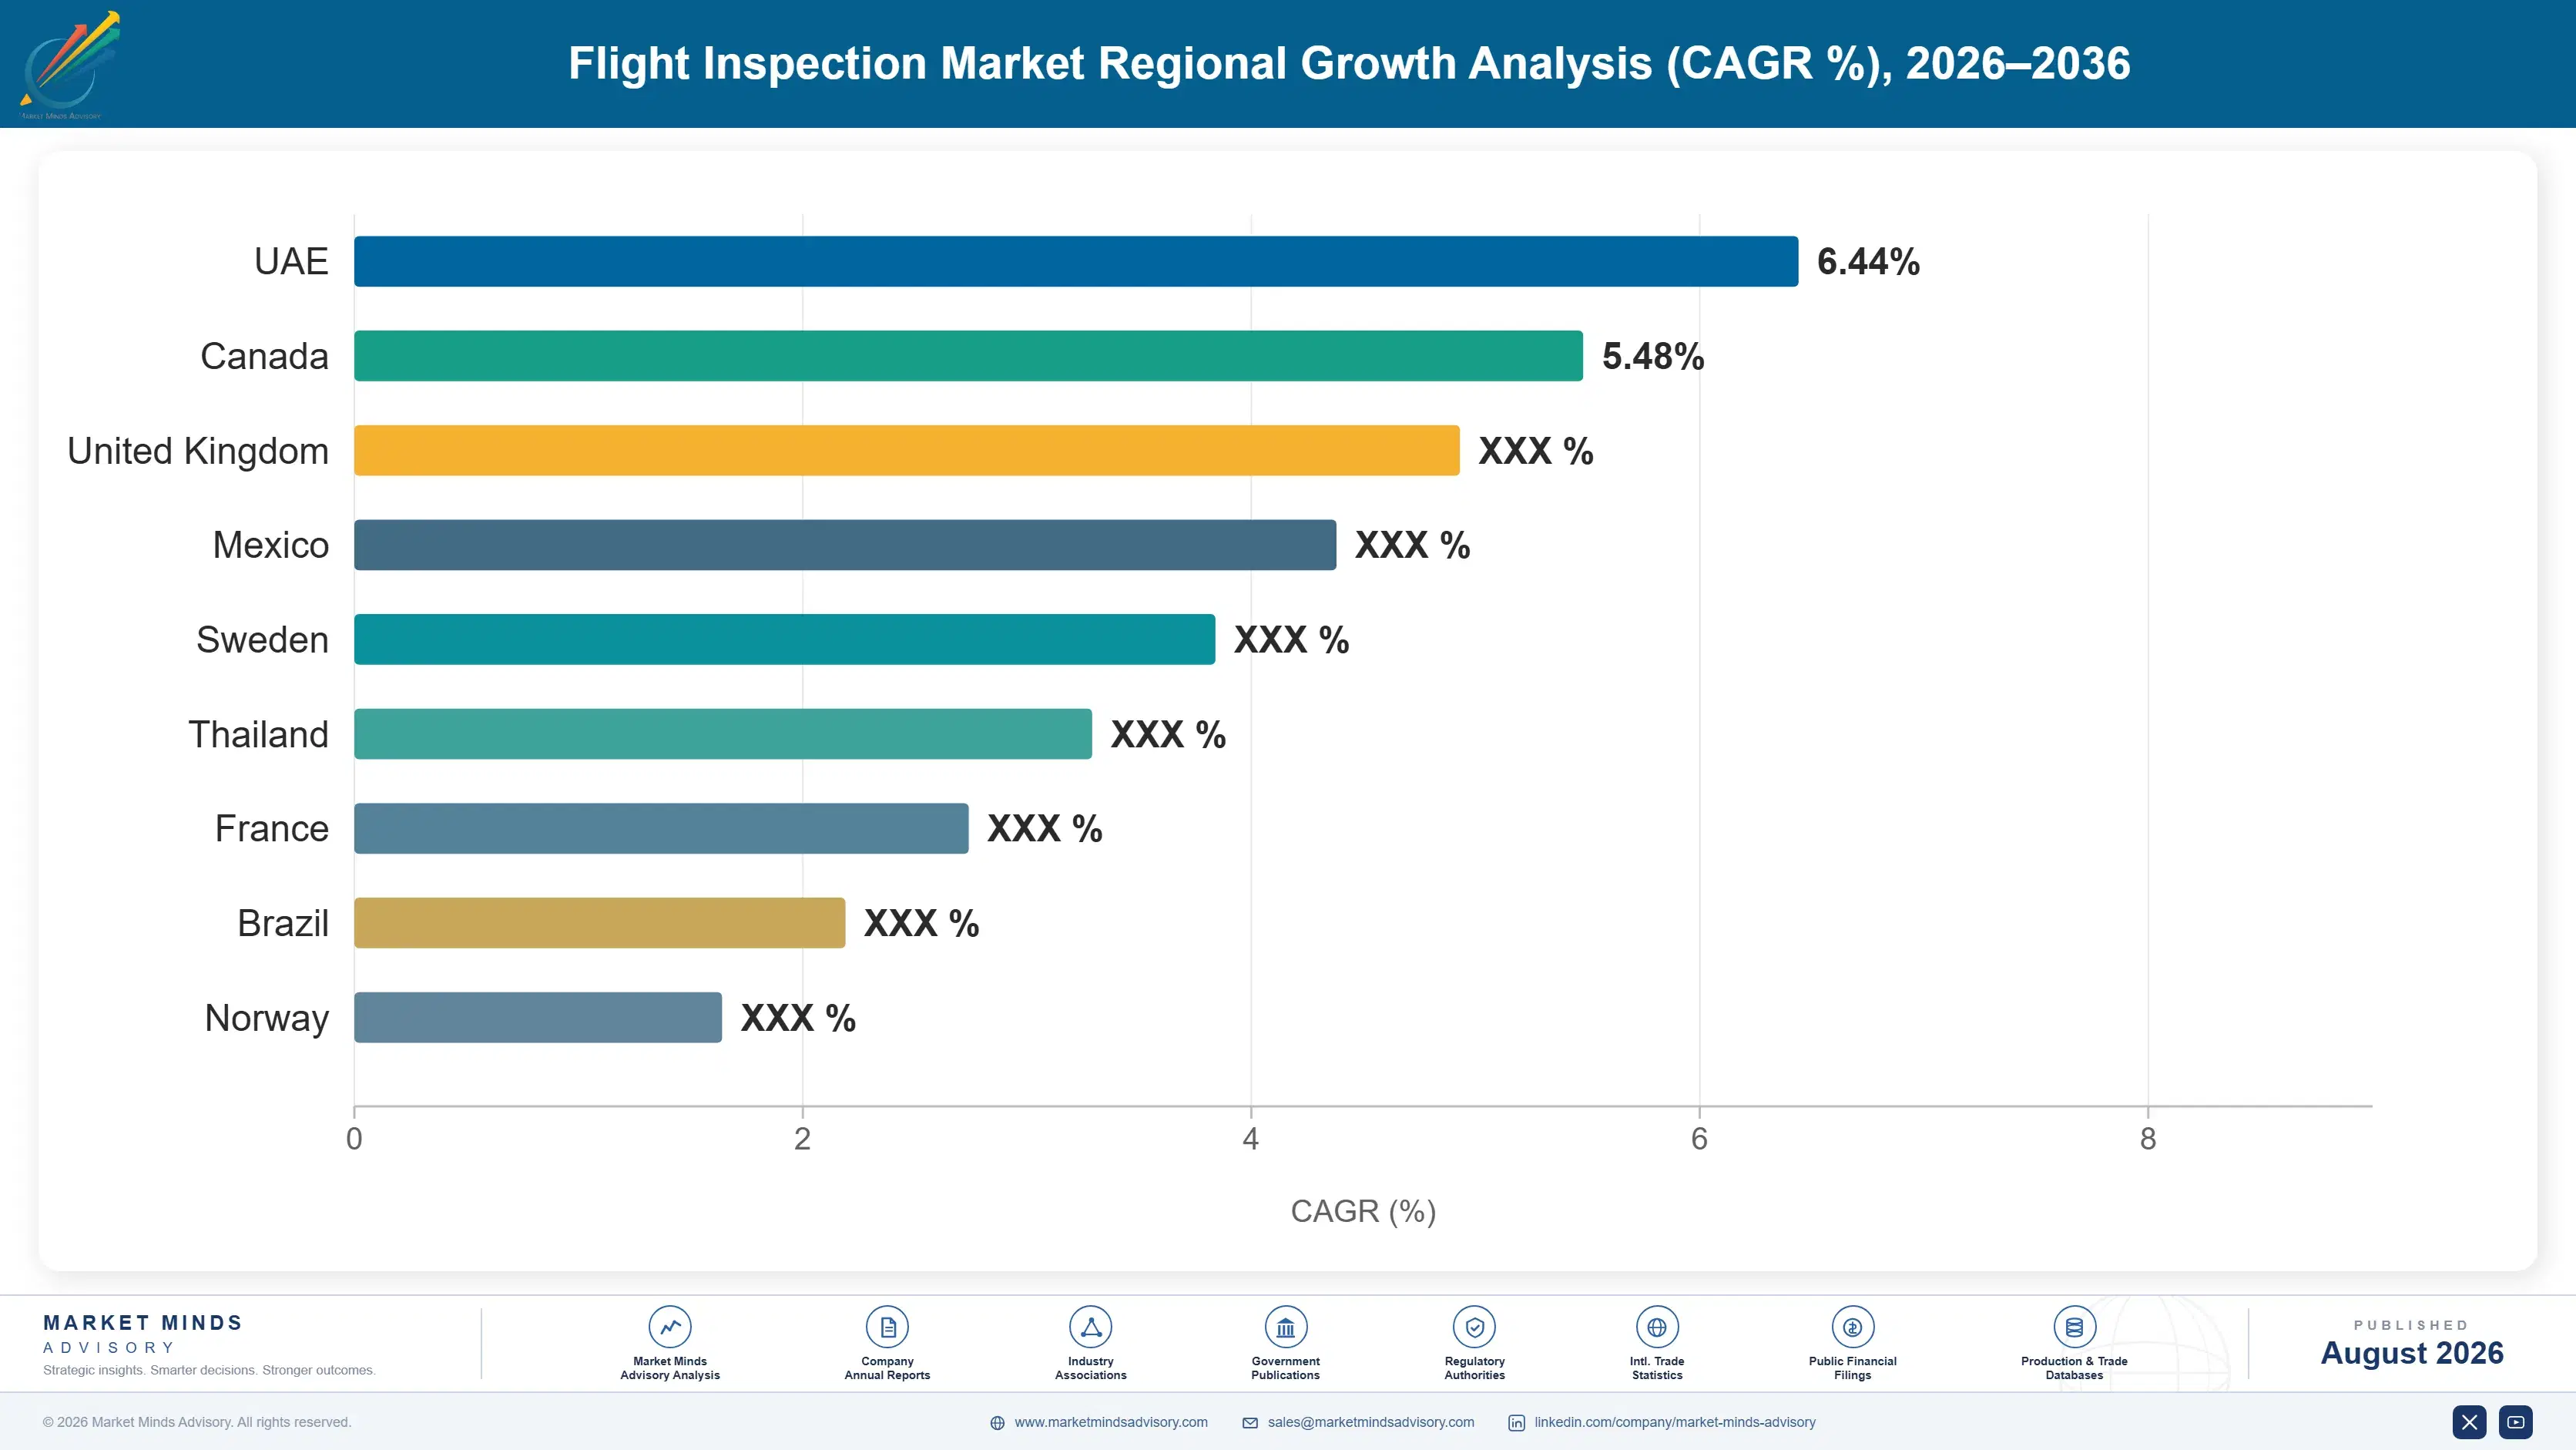
Flight inspection activity follows navigation infrastructure, so the market is genuinely distributed across every region operating instrument runways. East Asia holds the largest share because it is the only region where the inspected estate is expanding rapidly, with North America and Western Europe holding large but slowly contracting beacon networks.

North America

The second largest pool sits here on the strength of an estate that remains the world's most extensive even as it contracts. The Federal Aviation Administration operates its own inspection fleet, which removes most of the work from any merchant provider, and its minimum operational network programme is retiring conventional beacons on a published schedule while keeping a contingency network intact. Canadian and Mexican authorities run comparable arrangements. Growth here therefore comes almost entirely from procedure validation and augmentation commissioning rather than from anything involving a ground transmitter. A provider hoping to sell services into this region is competing against a state fleet that does not price its own work at all.
Share: 27% | CAGR: 5.4% (2026 to 2036)

Western Europe

A dense estate of instrument runways and a regulatory obligation to publish performance-based navigation approaches on a defined timetable together sustain this region's position. Several providers here are genuinely commercial rather than state operated, and the region hosts most of the world's flight inspection system manufacture, with German and Norwegian suppliers between them equipping a large share of the global fleet. Beacon rationalisation is proceeding on logic comparable to the American programme. The region exports capability considerably more successfully than it grows its own inspected estate. That export position is the region's genuine commercial asset, and it depends on fleet numbers worldwide rather than on anything happening at European aerodromes.
Share: 22% | CAGR: 4.6% (2026 to 2036)
Regional intelligence for 5 additional markets available in the complete report: East Asia, South Asia and Pacific, Latin America, Middle East and Africa, Eastern Europe. Contact sales@marketmindsadvisory.com.
flight-inspection-market-country-cagr-analysis-1787982856603

Where Inspection Margin Is Actually Earned

Four levers work on equipment fit, geography and contract structure rather than on flight hour pricing, which authorities benchmark aggressively and rarely allow to move. Receiver upgrades, Asian approvals, system supply to state fleets and unmanned partnership each address something a provider controls before any tender is issued at all. Hourly rate is not among them.

Refit Receivers For Procedure Work Not Beacon Work

Inspection systems specified a decade ago measure ground transmitter performance, which is the shrinking 62% of the market, while validating satellite procedures needs different receivers, processing and reporting entirely. Providers refitting at scheduled maintenance rather than as a separate programme cut the cost of conversion by roughly 40% and avoid taking aircraft out of service twice. The equipment pays back within about eighteen months on procedure validation rates. Providers waiting for contracts to demand it will be refitting while better prepared competitors are already bidding. Timing decides the cost, not the equipment.
Market Impact: Cuts the equipment conversion cost by around 40%

Obtain Asian Approvals Before The Airports Open

Essentially all growth in the inspected estate sits in East Asia and South Asia, where airport construction adds landing systems, lighting and procedures needing commissioning before traffic operates. Approval as an accepted inspection provider takes two to three years of documentation, demonstration flights and regulatory engagement. Providers holding that status win commissioning work at fee levels 30% to 45% above periodic inspection, because the work is time critical and the alternatives are few. Providers starting the approval process when a tender appears have already lost it. The clock starts long before the tender does.
Market Impact: Earns around 38% above the standard periodic rates

Sell Systems To States That Will Never Contract Services

Around 44% of global inspection activity is performed by authorities operating their own aircraft, and no service proposition reaches them. Selling flight inspection systems, aircraft integration, software and recurrent training converts an inaccessible customer into an accessible one. System and integration revenue carries margins comparable to services without any aircraft ownership, crew cost or utilisation risk attached to it. The relationship also produces recurring upgrade and support revenue across a fifteen year equipment life, which is considerably steadier than winning tenders repeatedly. No tender has to be won twice for the same customer.
Market Impact: Reaches into the 44% of previously closed work

Partner On Unmanned Inspection Rather Than Resisting It

Unmanned platforms can fly repeatable signal measurement profiles at roughly 30% of the hourly cost of a twin turboprop, and authorities are trialling them for routine periodic checks. Providers treating that as a threat will lose the routine workload to somebody else and keep every fixed cost. Providers offering it themselves protect the customer relationship, retain the commissioning and complex validation work that unmanned platforms cannot perform, and shift roughly 25% of flight hours to a cheaper platform while defending overall revenue. Resisting it protects nothing and costs the relationship as well.
Market Impact: Moves around 25% of hours onto cheaper platforms

Who Controls the Margin Pool

Concentration is high at around 63% across the five largest participants, reflecting a narrow supplier base rather than any consolidation. Aerodata and Norwegian Special Mission between them equip a large share of the global inspection fleet, giving them positions in system supply that service competitors cannot approach. Below them sit regional providers, aircraft integrators and state authorities that occasionally sell capacity.
Competition runs on three dimensions. Regulatory acceptance is first and decisive: an authority will not accept results from a provider it has not approved, and approval takes years. Equipment fit is second, separating providers able to validate satellite procedures from those configured for beacon work. Geographic presence is third, since commissioning is time critical and cannot be flown from another continent.

Pressure arrives from two directions at once. Unmanned platforms threaten routine periodic work at a third of the hourly cost, and authorities are running trials rather than discussing them. The beacon estate meanwhile keeps shrinking in the two regions holding most of it. Rankings shift against providers holding neither Asian approvals nor procedure validation equipment, since both point at the same shrinking base.
flight-inspection-market-company-positioning-matrix-1787982857132

Competitive Moat and Risk Dimensions

AERODATA AG

Moat: Installed system base and approvals

Aerodata equips a substantial share of the world's inspection aircraft with its systems, which produces recurring upgrade, support and training revenue independent of any given service contract. That installed base also gives it visibility into requirements across dozens of authorities simultaneously. Displacing an installed inspection system means requalifying results with the national authority, which few operators undertake voluntarily.
AERODATA AG

Risk: Exposure to contracting fleet numbers

System revenue scales with the number of inspection aircraft operating worldwide, and that fleet grows slowly while beacon estates contract in the largest regions. Unmanned platforms entering routine work would reduce demand for conventionally equipped aircraft further. A supplier whose revenue depends on fleet size faces an uncomfortable question about that fleet's future direction.
NORWEGIAN SPECIAL MISSION

Moat: Aircraft integration and mission systems

Norwegian Special Mission combines mission system capability with aircraft modification and integration, so it delivers a completed inspection aircraft rather than equipment somebody else must install. That reduces programme risk for an authority buying capability for the first time, which describes most of the growth in this market. Assembling both requires airframe modification approvals equipment suppliers do not hold.
NORWEGIAN SPECIAL MISSION

Risk: Programme concentration among few buyers

Complete inspection aircraft are bought by a small number of authorities on long intervals, so revenue arrives in large irregular programmes rather than as a steady base. A deferred national procurement moves a full year of results. Building a services business alongside would smooth that pattern, but it competes directly with the authorities who are also the customers.

Players Tracked

Prominent Players

Aerodata AG
Norwegian Special Mission
Flight Calibration Services
Thales
Indra Sistemas

Other Key Players

Leonardo
Honeywell Aerospace
Collins Aerospace
Textron Aviation
Bombardier
Field Aviation
Cobham Aviation Services
DFS Aviation Services
NAV CANADA
Airservices Australia
ENAV
ENAIRE
NATS
Airports Authority of India
CAAC Flight Inspection Center

Recent Developments

JANUARY 2024

European performance-based navigation deadlines advanced across member states

Implementation milestones under European navigation regulation obliged instrument runways to publish satellite-based approach procedures on a defined timetable, multiplying the number of procedures requiring flight validation. This was regulatory implementation by European authorities rather than any commercial arrangement between inspection providers or their customers anywhere.
Signal: Procedure counts rose faster than runway counts, which changes what an inspection fleet is actually for.
MARCH 2025

Unmanned landing system measurement trials extended by European providers

Several European air navigation service providers extended trials using unmanned aircraft to perform signal measurement on instrument landing systems, seeking demonstrated equivalence with conventional methods. These were technical evaluation programmes conducted by service providers, not any merger, acquisition or joint venture between any market participants.
Signal: Routine periodic checks are the exposed workload, and authorities are testing rather than merely discussing alternatives.
JUNE 2024

Chinese aviation authority confirmed expanded airport construction targets

Civil aviation planning documents confirmed targets implying several hundred certified transport airports by the middle of the next decade, each requiring commissioning inspection of landing systems, lighting, surveillance and procedures. This reflected national planning by a state authority rather than any transaction between commercial participants in this market.
Signal: The only genuinely expanding inspected estate anywhere sits in a region most providers cannot currently serve.

What An Inspection Flight Hour Costs

Cost divides into four components across a typical inspection operation. Aircraft ownership, maintenance and fuel absorb roughly 38% of operating cost and run whether the aircraft flies or not. Flight and inspection crew account for near 27%, mission equipment with software support near 19%, and regulatory approvals, documentation and quality assurance carry the remaining 16% for a provider holding multiple national acceptances.
The 2020 traffic collapse demonstrated how badly this cost base handles a demand shock, and also how little demand actually moved. Inspection intervals are set by calendar rather than by movements, so the schedule continued while the authorities funding it lost revenue and deferred what they could. Thales and Leonardo both discussed constrained air navigation customer spending across that period in their annual reporting. Fixed aircraft and crew cost did not reduce.

Exposure varies by fleet structure and by approvals held, and that variation decides who wins tenders. Providers owning aircraft carry that cost against utilisation they cannot always fill; system suppliers carry none. Providers holding acceptances across many authorities spread the 16% approvals cost widely, while single-country providers carry it against one stream. State fleets carry every cost and measure none commercially.
flight-inspection-market-cost-volatility-analysis-1787982857328

Multi-authority approvals spreading regulatory overhead

Holding accepted provider status with several national authorities spreads documentation, audit and quality assurance cost across many revenue streams rather than loading it onto one. Each additional approval takes two to three years to obtain and comparatively little to maintain afterwards. Providers approved in a single country carry the full overhead against whatever that country happens to tender.

Modular mission equipment upgraded at scheduled maintenance

Specifying modular inspection systems allows receiver and processing upgrades during scheduled airframe maintenance rather than as separate downtime, which cuts conversion cost sharply and avoids removing an aircraft from service twice. Fixed architecture systems force a dedicated programme instead. The specification decision is made years before the upgrade need becomes obvious to anybody at all.

Unmanned platforms absorbing routine periodic profiles

Moving repeatable periodic measurement onto unmanned platforms at roughly 30% of the twin turboprop hourly cost protects margin on work that authorities will otherwise tender aggressively. Commissioning and complex procedure validation stay with crewed aircraft. Providers offering both defend the relationship rather than losing that routine volume to somebody else entirely and quite permanently.

Portfolio Architecture for Margin Defence

The portfolio separates by whether the work is routine and tenderable or complex and effectively sole sourced. Periodic checks on conventional navigation aids form the volume layer: predictable, scheduled, priced against a published hourly rate and increasingly exposed to unmanned platforms that can fly the same profile far cheaper. Providers hold this work because it fills utilisation between higher value tasks, not because the rate itself is attractive.
Margin concentrates in commissioning and complex validation. A new landing system or a procedure through demanding terrain requires judgement, analysis and reporting that no routine profile replicates, and the customer is buying an outcome rather than flight hours. Fee levels run well above periodic rates. The tension is that commissioning work arrives with construction programmes, so it is inherently lumpy and concentrated wherever airports are being built rather than wherever providers happen to be based.

The highest value pool is augmentation commissioning, and very few providers can perform it. Ground-based augmentation requires signal integrity assessment across an entire coverage volume rather than along a single approach path, needing receivers, analysis capability and approvals that most operators simply do not hold at present.

Volume / Commodity-Adjacent

Periodic scheduled checks on conventional navigation aids and lighting. Range spans six points because utilisation differs enormously between providers filling a fleet and those flying occasional contracts against the same fixed ownership cost.
Gross Margin: 12-18%

Premium / Certified

Landing system commissioning and complex procedure validation through demanding terrain. Range spans eight points because obstacle environment difficulty and reporting depth vary considerably between a coastal runway and an Andean aerodrome.
Gross Margin: 24-32%

Sustainability / Regulatory / Next-Generation

Satellite and ground-based augmentation commissioning plus system supply to state operated fleets. Range spans ten points because system supply carries no aircraft ownership cost while augmentation service work carries all of it.
Gross Margin: 30-40%
flight-inspection-market-portfolio-architecture-1787982857834

High-value Sub-segments and Strategic Watch-out

Satellite and Ground Augmentation

High value and high growth at 9.3%, requiring coverage volume signal assessment rather than single approach measurement. The eight point range separates the few providers holding the receivers and approvals from those subcontracting the analysis entirely. Approvals are the real barrier here, not the aircraft.
Gross Margin: 32-40%

Procedure Validation Work

High value with moderate growth at 8.1%, already 38% of market revenue and still rising as regulation multiplies published approaches. The eight point range reflects terrain complexity, which changes the analysis burden far more than the flying does. Flying the procedure is the easy part.
Gross Margin: 28-36%

Instrument Landing System Checks

The volume core anchoring most inspection schedules worldwide. Commissioning earns well and periodic checks earn considerably less, and unmanned platforms are being trialled specifically against the periodic portion of exactly this workload. That exposure is entirely visible and has been largely unaddressed by anybody so far.
Gross Margin: 22-28%

Conventional Navigation Aids

The strategic watch-out rather than a growth pool. Beacons are being withdrawn at roughly 3.1% annually on schedules published years ahead, so the revenue decline is entirely visible and almost nobody has restructured cost against it. The withdrawal schedules were all published years ago already.
Gross Margin: Variable

Why The Calendar Never Stops

Inspection demand is set by published intervals rather than by traffic, economics or anybody's preference, which produces the most predictable revenue base in aviation services. A precision approach requires checking roughly every 180 days regardless of whether an aircraft has used it. That obligation sits in international standards implemented through national regulation, so it survives traffic collapses, budget pressure and management changes without moving at all, as 2020 demonstrated conclusively.
Stickiness varies by how the relationship is structured rather than by how well the work is done. An approved provider holding national acceptance is extremely difficult to displace, because a replacement must complete its own approval before an authority can use its results. Contracts therefore renew far more often than they change hands. State fleets are the ultimate expression: work that never enters the market and never leaves it.

Customer profiles are shifting toward buyers who have never bought before. Authorities across South Asia, Africa and Southeast Asia are commissioning instrument runways at aerodromes that previously had none, and they arrive without in-house capability or established supplier relationships. Established providers are configured for authorities that already know what they want. Very few have adapted to customers who genuinely do not.
flight-inspection-market-end-use-penetration-index-1787982858324

Where Inspection Providers Should Move

These are among the four positions where our research anticipates prominent divergence between winners and laggards over the coming forecast period. Each is grounded in the demand model, the regulatory perimeter, and the announced capacity pipeline.
01 / MISSION EQUIPMENT REFIT

Fit receivers for the work that is growing

Systems specified a decade ago measure ground transmitter performance, which is the shrinking 62% of this market, while validating satellite procedures needs entirely different receivers, processing and reporting capability. Refitting during scheduled airframe maintenance rather than as a separate programme cuts conversion cost by roughly 40% and avoids removing an aircraft from service twice over. The equipment repays within about eighteen months at procedure validation rates, and providers waiting for a contract to demand it will be refitting while competitors bid.
02 / ASIAN APPROVAL POSITIONING

Approvals take three years, tenders take three months

Essentially all growth in the inspected estate sits across East Asia and South Asia, where airport construction adds landing systems, lighting and procedures requiring commissioning before any traffic operates at all. Acceptance as an approved provider takes two to three years of documentation, demonstration flights and regulatory engagement with the national authority. Providers holding that status win commissioning at fee levels 30% to 45% above periodic rates, and providers starting the process when a tender appears have already lost it.
03 / STATE FLEET SYSTEM SUPPLY

Sell equipment to the authorities that never contract services

Around 44% of global inspection activity is performed by authorities operating their own aircraft, and no service proposition ever reaches those customers however good that proposition happens to be. Selling inspection systems, aircraft integration, software and recurrent training converts an entirely inaccessible customer into an accessible one immediately. System revenue carries margins comparable to services with no aircraft ownership, crew cost or utilisation risk attached at all, and generates recurring support across a fifteen year equipment life afterwards as well.
04 / UNMANNED PLATFORM PARTNERSHIP

Offer the cheaper platform before an authority finds one

Unmanned aircraft fly repeatable signal measurement profiles at roughly 30% of the twin turboprop hourly operating cost, and authorities are running equivalence trials rather than merely discussing the idea in principle any longer. Providers treating this as a threat will lose the routine periodic workload and still retain every fixed cost they currently carry. Offering it directly protects the customer relationship, keeps the commissioning and complex validation work, and shifts roughly 25% of flight hours onto a considerably cheaper platform.

Engagement Snapshot From the Field

A live engagement with an industry participant carrying material or product regulatory and market exposure ahead of a defining policy shift, showing how our research translates into a defensible multi-year portfolio strategy.
MARKET MINDS ADVISORY · CLIENT ENGAGEMENT SUMMARY
Flight Inspection Producer Strategic Portfolio Review and Transition Roadmap 2026·Investment Scenario on Flight Inspection Exposure Evaluation 2025-26
CLIENT PROFILE
A European commercial flight inspection provider operating a small fleet of equipped turboprops under accepted provider status with four national authorities, serving both state customers and airport operators. The business had held revenue broadly flat for five years while its cost base rose, and management attributed the stagnation to competitive pricing pressure rather than to anything about the work it was configured to perform.
STRATEGIC CHALLENGE
The board needed to understand why revenue was static while published procedure counts across its markets were rising sharply, and whether its mission equipment could perform the work that was actually growing. It also faced unmanned inspection trials at two of its four customer authorities, with no internal view on whether to resist, ignore or participate in them.
MMA APPROACH
MMA decomposed five years of revenue by inspected asset type, separating conventional beacon work from procedure validation and commissioning, and assessed the fitted mission equipment against the measurement requirements of satellite-based procedures. Expert interviews with authority technical staff, system suppliers and unmanned trial participants established what equipment and approvals were genuinely required and obtainable.
KEY FINDINGS
  1. Conventional beacon work still generated 71% of revenue against a market pattern nearer 62%, and the client's customer authorities had published withdrawal schedules covering the next eight years.
  2. Fitted receivers could not perform the signal quality measurement that satellite procedure validation requires, so the client was subcontracting analysis on 26% of the procedure work it won.
  3. No approvals were held anywhere in Asia, where the only expanding inspected estate exists, and no application had ever been started with any authority in the region.
  4. Utilisation ran at 54% of available aircraft hours, so ownership cost was being carried against a schedule that could have absorbed considerably more work than it did.
CLIENT PROFILE
A European commercial flight inspection provider operating a small fleet of equipped turboprops under accepted provider status with four national authorities, serving both state customers and airport operators. The business had held revenue broadly flat for five years while its cost base rose, and management attributed the stagnation to competitive pricing pressure rather than to anything about the work it was configured to perform.
STRATEGIC CHALLENGE
The board needed to understand why revenue was static while published procedure counts across its markets were rising sharply, and whether its mission equipment could perform the work that was actually growing. It also faced unmanned inspection trials at two of its four customer authorities, with no internal view on whether to resist, ignore or participate in them.
MMA APPROACH
MMA decomposed five years of revenue by inspected asset type, separating conventional beacon work from procedure validation and commissioning, and assessed the fitted mission equipment against the measurement requirements of satellite-based procedures. Expert interviews with authority technical staff, system suppliers and unmanned trial participants established what equipment and approvals were genuinely required and obtainable.
KEY FINDINGS
  1. Conventional beacon work still generated 71% of revenue against a market pattern nearer 62%, and the client's customer authorities had published withdrawal schedules covering the next eight years.
  2. Fitted receivers could not perform the signal quality measurement that satellite procedure validation requires, so the client was subcontracting analysis on 26% of the procedure work it won.
  3. No approvals were held anywhere in Asia, where the only expanding inspected estate exists, and no application had ever been started with any authority in the region.
  4. Utilisation ran at 54% of available aircraft hours, so ownership cost was being carried against a schedule that could have absorbed considerably more work than it did.
RECOMMENDED STRATEGY
Phase 1: Phase one: specify and fit modular receivers capable of satellite procedure measurement during the next scheduled airframe maintenance on each aircraft. Phase 2: Phase two: begin approved provider applications with two Asian authorities immediately, accepting that acceptance will take between two and three years. Phase 3: Phase three: partner with an unmanned platform operator to bid routine periodic work jointly rather than conceding it at the next tender.
OUTCOME
The client reported procedure validation revenue rising from 22% to 37% of the total within six quarters (client-reported, unverified by MMA), with subcontracted analysis eliminated entirely after the refit. Utilisation improved to 68% of available hours. One Asian approval application reached demonstration flight stage within the review period.

Frequently Asked Questions

Foundational context covering the market sizes, CAGR, scope, country, region and competition that inform every finding below. This section is provided to cover basics and most often pre-purchase conversations, answered from the MMA Primary Research Dataset.

What is the current size of the Flight Inspection Market?

The market is valued at USD 1.4 billion in 2025, measured as revenue from airborne inspection, calibration and validation of navigation aids, procedures and visual aids worldwide.

How large will the Flight Inspection Market be by 2036?

MMA forecasts USD 2.72 billion by 2036, up from USD 1.49 billion in 2026. That represents incremental revenue of USD 1.23 billion and an expansion multiple of 1.83 times.

What is the CAGR for the Flight Inspection Market 2026 to 2036?

The base case CAGR is 6.2%, with a bull case of 7.4% and a bear case of 5.0%. Procedure proliferation and Asian airport construction supply most of that growth.

Which segment is growing fastest?

Satellite and ground-based augmentation grows at 9.3%, half again the market rate of 6.2%. Augmentation systems are being installed while conventional beacons are being withdrawn.

Who are the major companies in the Flight Inspection Market?

Aerodata AG, Norwegian Special Mission, Flight Calibration Services, Thales and Indra Sistemas lead on inspection revenue and installed system base, holding around 63% between them.

Which country is growing fastest?

India grows fastest at 8.2%, driven by regional connectivity expansion adding instrument runways and by satellite augmentation deployment. East Asia holds the largest regional share overall.

Report Segmentation Architecture

The full report scope spans multiple orthogonal segmentation dimensions, with cross-tabulated demand data provided for each dimension pair. Coverage extends further to regional breakdowns, trend trajectories, and the competitive detail needed to support segment-level decision-making.

By Inspected Asset

  • Instrument Landing Systems
  • Conventional Navigation Aids
  • Performance-Based Navigation Procedures
  • Surveillance Radar and Surface Systems
  • Airfield Lighting and Visual Aids
  • Satellite and Ground-Based Augmentation

By End-Use Industry

  • Civil Aviation Authorities
  • Air Navigation Service Providers
  • Commercial Airport Operators
  • Military Air Forces
  • Offshore and Heliport Operators
  • Airport Construction Programmes

By Commercial Dimension

  • State Operated In-House Fleets
  • Contracted Service Provision
  • Flight Inspection System Supply
  • Aircraft Integration and Modification
  • Procedure Design Services
  • Training and Certification Support

By Region

  • North America
  • Western Europe
  • East Asia
  • South Asia and Pacific
  • Latin America
  • Middle East and Africa
  • Eastern Europe

Scope, Methodology, and Coverage

Every figure in this report is reproducible from documented input assumptions. The scope below maps the historical period, the forecast horizon, the segmentation dimensions, and the countries covered, alongside the underlying primary and qualitative methodology.
Historical Period
2020 to 2025
Forecast Period
2026 to 2036
Base Year
2025 (USD billions; MMA Primary Research Dataset, August 2026)
Market Definition
Revenue from airborne inspection, calibration and validation of navigation aids, instrument flight procedures, surveillance systems and visual aids, spanning instrument landing systems, conventional beacons, performance-based navigation procedures, radar and surface systems, airfield lighting, and satellite or ground-based augmentation. Contracted inspection services, flight inspection system supply, aircraft integration, procedure design and training are included. Ground navaid manufacture and maintenance, air traffic management systems, airport construction and unrelated aerial survey work are excluded.
Quantitative Units
USD billions, inspection service and system revenue
Segmentation Dimensions
Inspected asset type, end-use customer industry, commercial provision dimension, region
Regions Covered
North America, Western Europe, East Asia, South Asia and Pacific, Latin America, Middle East and Africa, Eastern Europe
Countries Covered
United States, Germany, Norway, United Kingdom, Spain, Italy, China, Japan, South Korea, India, Australia, Brazil, United Arab Emirates
Key Companies Profiled
Aerodata AG, Norwegian Special Mission, Flight Calibration Services, Thales, Indra Sistemas, Leonardo, Honeywell Aerospace, Textron Aviation, DFS Aviation Services, Airservices Australia
Quantitative Methodology
Primary survey, n=3,800 respondents, Q4 2025, six countries; demand-side model with trade association cross-validation
Qualitative Methodology
47 expert interviews, Q4 2025; applied to validate demand model assumptions, identify emerging dynamics, and assess competitive positioning
Report Format
PDF and XLSX data workbook (Word format preview document)
Publisher
Market Minds Advisory
Report Code
MMA-2026-CON-181
Published
August 2026
Contact
sales@marketmindsadvisory.com | www.marketmindsadvisory.com

Purchase the full Flight Inspection Market Report (2026 to 2036).

The full report treats flight inspection as a compliance obligation with an inverting revenue base, and shows where the work is moving. It quantifies the decline in conventional beacon inspection against published withdrawal schedules, models the growth in procedure validation now reaching 38% of revenue, and assesses which fitted mission equipment can actually perform satellite-based measurement. Segment analysis covers all six inspected asset types, with particular attention to augmentation commissioning as the highest value work in the market. Competitive assessment ranks twenty participants on inspection revenue and installed system base across every operating region.
Six inspected asset segmentation with growth rates
Beacon withdrawal schedules mapped against revenue exposure
Twenty participant assessment on inspection revenue
Mission equipment capability against procedure validation requirements
Unmanned platform cost comparison by mission profile
Approval timelines by national aviation authority

Built For The People Who Decide

From boardroom strategy to bench-side execution, this report is read cover-to-cover by leaders shaping the next decade of their industry, turning demand scenarios, market dynamics and valuation benchmarks into decisions.
CXOs/ Presidents/ VPs/ Managers
M&A and Corporate Development
Strategy Teams and R&D Heads
Procurement and Product Directors
Regulatory and Compliance Leaders
Investor Relations and Equity Analysts