Market Minds Advisory
Flight Information Display System Market

Flight Information Display System Market: Flight Information Display Systems: A Data Integrity Market Selling Itself as a Screen Business

The screen is a commodity and the promise is not: what an airport buys is that a gate change reaches every display within about four seconds of somebody entering it.

Lead Analyst

Published

September 2026

Make Smarter Decisions with Customized Research Insights

Request a free sample report and evaluate market opportunities, growth trends, and competitive dynamics relevant to your business needs.

2025 MARKET VALUE$1.9BMarket Size 2025
2036 FORECAST VALUE$4.3BBase Case , 2026 to 2036
CAGR 2026 TO 20367.8 %Bull 9.0% / Bear 6.6%
INCREMENTAL OPPORTUNITY$2.3BNet 10- year value creation
EXPANSION MULTIPLE2.12x2036 value over 2026 base
Strategic Levers
M&A Pipeline
Regional Outlook
Country Rankings
Competitive Intelligence
Segmental Deep-dive
Call-Us : 91 93563 13602

Executive Snapshot and Market Trajectory.

Nobody buys a flight information system for the panels. They buy an assurance that a gate change entered in the operational database appears on every screen within about four seconds, and the failure mode everybody remembers is a display that was right five minutes ago. Panels are the easy part.
Advertising and commercial display integration grows at 11.7%, half again the market rate of 7.8%, as airports sell roughly 23% of screen time and hand system ownership to commercial revenue teams. Content management and data integration software follows at 10.2%. East Asia takes 28% of value and South Asia and Pacific 22%, because terminal construction is overwhelmingly Asian now. Managed service and maintenance contracts follow at 8.6% across the installed base.
Concentration sits near 43% across the top five on measured system, software and service revenue. Three renewal rhythms run inside one installation: panels fail around 7 years, software renews annually, and the terminal itself is refurbished about every 14. Integrators selling only the installation miss two of them. Latency under load is the only figure genuinely separating one supplier from another here. Tenders rarely mention it.
Market Definition
This market covers systems that present operational flight and airport information to passengers and staff, spanning advertising and commercial display integration, content management and data integration software, departure and arrival display hardware, gate and boarding area displays, baggage and wayfinding displays, and managed service and maintenance contracts. Revenue is measured as hardware, software, integration and attributable service value at supplier level. Airport operational databases sold separately, air traffic control systems, baggage handling machinery, self-service check-in kiosks, and advertising media sales revenue itself are excluded.
Base Year Value
$1.9B in 2025 (MMA Primary Research Dataset, September 2026)
Forecast Period
2026 to 2036, eleven discrete annual values
CAGR
7.8% base case. Bull 9.0%. Bear 6.6%.
Fastest Growth Segment
Advertising and Commercial Display Integration: 11.7% CAGR
Fastest Growth Country
India: 11.4% CAGR
Fastest Growth Region
South Asia and Pacific: 10.0% CAGR
Largest Region
East Asia: 28% of 2025 global value
Market Leaders
Amadeus, SITA, Daktronics, INFAX and Collins Aerospace lead on measured system, software and service revenue. Source: MMA Primary Research Dataset, July 2026.
Primary Survey
n=3,800 procurement and R&D decision-makers, Q4 2025, six countries
Methodology
Demand-side build-up, cross-validated against public data, 47 expert interviews

Flight Information Display System Market Forecast Scenarios

flight-information-display-system-market-size-forecast-scenario-1788454941027
Growth ran at 6.4% from 2020 to 2025 across a period that began with airports cancelling everything and ended with the largest terminal construction programme in aviation history. Replacement work resumed slowly, since a system nobody was looking at could wait. What changed the market's character was advertising: airports discovered that screens paid for themselves and moved ownership accordingly.
The base case at 7.8% rests on three mechanisms. Terminal construction across India, Southeast Asia and the Gulf installs complete systems where none existed, at a scale European and American markets have not seen in decades. Commercial display integration lets an airport sell around 23% of screen time, which changes the funding conversation entirely. Third, panels reaching the end of a 7 year service life generate replacement demand that continues regardless of whether anything is being built.
The bull case at 9.0% assumes announced terminal programmes proceed on schedule, which would concentrate an unusual amount of installation work into a few years. The bear case at 6.6% is that advertising integration reaches its practical limit once passengers and regulators object to operational information competing with commercial content during disruption, which is precisely when the screens matter most.

The Screen Is Not the Product

Every tender describes screens, and screens are the part that matters least. Panels are commodity displays and any competent integrator can hang them. What an airport is actually purchasing is a guarantee that a gate change typed into the operational database appears everywhere within about four seconds, and that it holds on the worst day of the year rather than a quiet Tuesday.
TOP FIVE CONCENTRATION43%Moderately concentrated among airport systems and display vendors
DATA REFRESH LATENCY4 secondsDelay between operational database change and screen update
DISPLAY REPLACEMENT CYCLE7 yearsPeriod before panel failure rates force hardware refresh
TERMINAL REFURBISHMENT INTERVAL14 yearsPeriod between major terminal system replacement programmes overall
ADVERTISING REVENUE SHARE23%Screen time sold commercially rather than showing flight data
DISRUPTION DAY QUERY RISE310%Increase in passenger information demand during major disruption
That distinction only becomes visible during disruption. Passenger information demand rises roughly 310% when weather or a systems failure disrupts a schedule, which is exactly when database updates arrive fastest and a display five minutes stale sends hundreds of people to the wrong place. Systems are specified against normal operation and judged against the exceptions, which is a familiar mismatch in infrastructure procurement.
Advertising has changed who owns these systems and created a genuine tension. Airports now sell around 23% of screen time, which funds installations operations teams struggled to justify and moves the system into commercial revenue management. The conflict appears during disruption, when a commercial slot occupies a screen that passengers need for flight information. Most airports have not written that priority rule down, and those that have did so after an incident.
"An airport specifies this system against a normal Tuesday and is judged on the day a storm closes the airfield. The only figure that matters is latency under load, and I have read tenders running to two hundred pages that never mention it once."
Director, Airport Systems and Passenger Infrastructure Practice · MMA Technology Practice · September 2026

Market Trends

Commercial Revenue Teams Take Ownership of the Screens

Airports selling roughly 23% of screen time for advertising have moved these systems out of operations and into commercial revenue management, because the screens now generate income rather than only consuming budget. That funds installations and refresh programmes that operational cases struggled to justify on their own. It also creates a priority conflict during disruption, when a commercial slot occupies a display passengers urgently need for flight information. Very few airports have written down which content wins in that moment. Operations lost the budget and kept the responsibility, which is an uncomfortable arrangement.
Market Impact: Demand rises 310% in disruption
Asian Terminal Construction Rewrites the Demand Map

India, Southeast Asia and the Gulf are building terminal capacity at a scale European and American aviation has not seen in decades, and each new terminal installs a complete system rather than replacing part of one. That makes installation revenue lumpy, geographically concentrated and considerably larger per project than refresh work in mature markets. India is the fastest-growing country at 11.4% on that programme alone. Suppliers without regional delivery presence are watching the largest opportunities pass to those who have it. Project values run several times what a mature market refresh is worth.
Market Impact: Replaces panels every 7 years

Market Opportunities and Growth Drivers

Disruption Is When the System Is Actually Judged

Passenger information demand rises around 310% during weather events, systems failures and industrial action, which is simultaneously when the operational database changes fastest and when a stale display does the most damage. Airports that have experienced a disruption with a lagging system specify latency explicitly in the next tender, and those that have not specify screen sizes. That difference in specification is visible across the market and it correlates almost perfectly with whether the airport has had a bad day. Latency under load is measurable, warrantable and almost never actually tendered. That is the gap.
Market Impact: Replaces systems every 14 years

Panels Fail on a Cycle Nobody Can Defer

Commercial displays operating continuously in terminal conditions reach unacceptable failure rates at around 7 years, which generates replacement demand independent of construction cycles or airport investment appetite. Backlight degradation, image retention and power supply failure all arrive on a predictable schedule. That gives suppliers a forecastable revenue stream between terminal programmes and gives airports a cost they cannot postpone indefinitely without visible consequences. It is the least discussed and most dependable demand in this market. A failed display in a terminal is visible to every passenger walking past it, which forces the replacement regardless of budget.
Market Impact: Occupies 23% during 310% demand

Market Restraints and Challenges

Airports Buy This Once Every Fourteen Years

Major terminal system replacement happens roughly every 14 years, which means the addressable population in any given year is a small fraction of the world's airports and no commercial effort changes that timing. The root cause is that display systems are replaced during terminal refurbishment rather than on their own schedule. Commercially this makes new system revenue lumpy and geographically unpredictable. Suppliers mitigate through panel replacement at 7 years and software subscription, both of which recur inside the long cycle. Nothing a supplier does moves a terminal refurbishment programme forward by a year.
Market Impact: Sells 23% of screen time

Commercial Content Competes With Operational Information

Screen time sold for advertising at around 23% occupies displays that passengers need most during exactly the periods when disruption pushes information demand up 310%. The root cause is that commercial and operational priorities sit with different airport departments and the arbitration rule is rarely written. Commercially this exposes suppliers to blame for a policy decision they did not make. Mitigation runs through configurable priority rules that suspend commercial content automatically during declared disruption, which airports adopt after an incident. The supplier is blamed for a policy decision made in another department entirely.
Market Impact: Grows fastest at 11.4% India
4 additional market trends, 3 additional growth drivers, and 2 additional restraints and challenges are covered in the full report. Contact sales@marketmindsadvisory.com to access the complete intelligence.

Segment CAGR and Growth Architecture

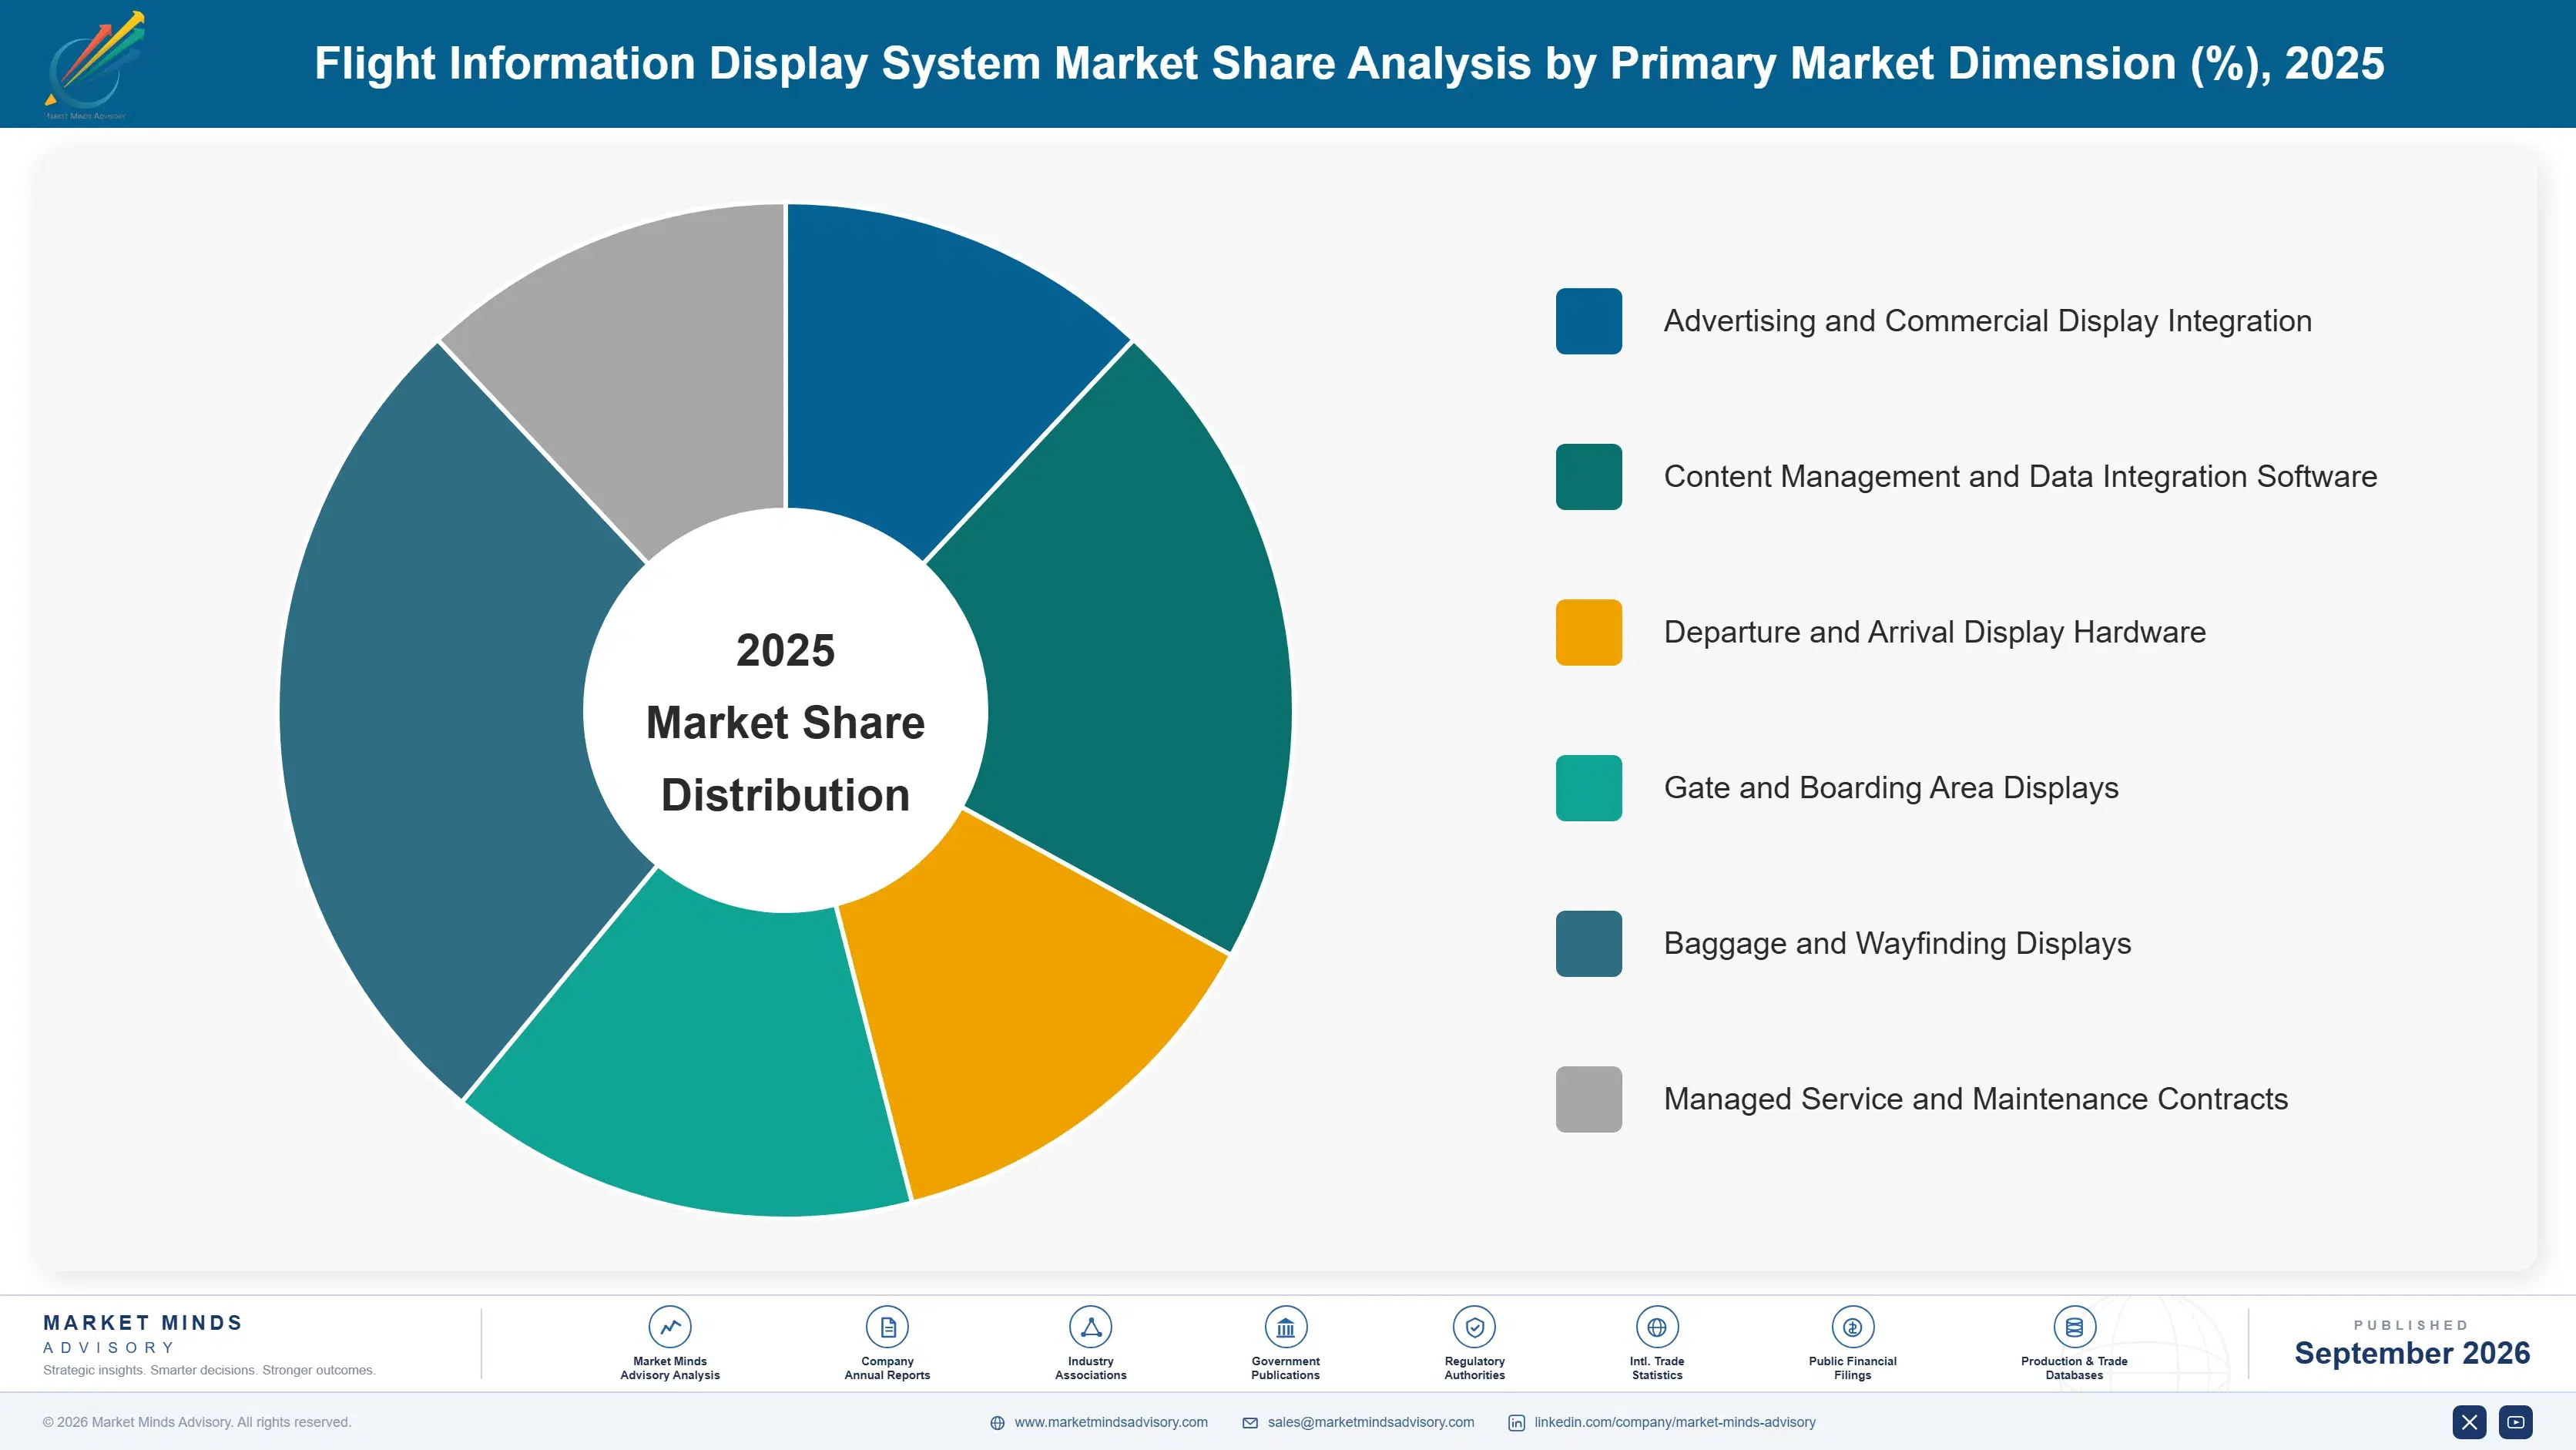
Segmentation follows what the system component actually does, because that determines who inside the airport pays for it and how often. Operations funds the displays, commercial revenue funds the advertising integration, and information technology funds the software, and those three budgets renew on entirely different rhythms inside one physical installation. Nobody coordinates the three of them.
flight-information-display-system-market-market-share-analysis-1788454941558

Advertising and Commercial Display Integration

Commercial integration grows at 11.7%, half again the market rate of 7.8%, because airports selling around 23% of screen time have turned a cost centre into a revenue one and funded refresh programmes operations could never justify alone. The buyer is commercial revenue management rather than airport operations, which changes the sales conversation completely and generally shortens it. The unresolved question is priority during disruption, when advertising occupies screens passengers need as information demand rises 310%. Airports that have written that rule down almost always did so after an incident rather than before one. Digital signage vendors understand yield per screen minute considerably better than airport systems companies do, and they are arriving.
CAGR 11.7%

Content Management and Data Integration Software

Integration software grows at 10.2% because a modern display draws on operational databases, airline systems, baggage handling, border processing and security queue feeds, each updating differently and failing differently. Presenting that coherently within about four seconds is software engineering rather than screen management, and the burden grew while the display itself did not change. This is also the only part of the system carrying a genuine subscription rhythm rather than a replacement cycle. Suppliers treating it as a presentation layer consistently underestimate the work and lose money discovering that during delivery. It is also the component least likely to be replaced at refurbishment, since reconnecting every data feed to a new platform is work nobody volunteers for.
CAGR 10.2%
Full segment breakdown across 6 segments available in the complete report.

Regional Architecture and Country Demand Map

Demand follows terminal construction and passenger growth rather than existing airport count, which is why the map looks nothing like it did fifteen years ago. Refresh demand distributes differently, following installed base rather than building activity. Airport count predicts almost nothing about where this money is spent.

East Asia

East Asia holds 28% on Chinese airport construction that has added more terminal capacity in a decade than most regions hold in total, alongside Japanese and Korean refresh programmes running on mature installed bases. Chinese projects generally specify domestic suppliers and domestic display manufacture, which makes the region large and only partly addressable for international vendors. Japanese airports are among the most demanding on latency and disruption behaviour, having operated through typhoon disruption repeatedly. Regional display manufacturing supplies panels worldwide, which is a separate business from the systems themselves. Advertising integration is well developed at the largest Chinese and Japanese hubs, though commercial priority rules during disruption are handled more conservatively than in Western markets.
Share: 28% | CAGR: 8.8% (2026 to 2036)

South Asia and Pacific

The region holds 22%, well above the regional band, because India is running the largest airport construction programme in the world and each new terminal installs a complete system rather than replacing part of one. India is the fastest-growing country at 11.4% on that alone. Southeast Asian terminal building across Indonesia, Vietnam and the Philippines adds substantial further installation demand. Australian airports refresh on mature cycles resembling European practice. Regional delivery presence rather than product capability determines which suppliers reach the largest opportunities here. Advertising integration is being designed into new terminals from the outset here rather than retrofitted, which avoids the ownership conflicts mature markets acquired by adding it later. Latency specification is inconsistent across programmes.
Share: 22% | CAGR: 10.0% (2026 to 2036)
Regional intelligence for 5 additional markets available in the complete report: North America, Western Europe, Middle East and Africa, Latin America, Eastern Europe. Contact sales@marketmindsadvisory.com.
flight-information-display-system-market-country-cagr-analysis-1788454942082

Selling Latency Rather Than Panels

Tenders describe screens because screens are easy to describe. The system is judged on how it behaves when the airfield closes, funded increasingly by commercial revenue teams, and renewed on three separate rhythms. Every lever that works exploits one of those three facts rather than arguing about display specification. The panels are not the argument.

Specify and Warrant Latency Under Disruption Load

Systems are tendered against normal operation and judged during events that raise information demand roughly 310%, when database updates arrive fastest and a stale screen misdirects hundreds of people. Suppliers offering contractual latency guarantees under peak load, held at around four seconds, differentiate on the only dimension that matters and win against lower-priced bids at roughly 2 times the rate. It requires architecture built for burst rather than average. Competitors quoting panel specifications are answering a question the airport has not yet learned to ask. Airports that have had a bad day understand this immediately.
Market Impact: Wins at roughly 2 times the usual rate

Sell to Commercial Revenue, Not Only Operations

Airports selling around 23% of screen time have moved system ownership toward commercial revenue management, where budgets are funded by income the screens generate rather than by operational necessity. Proposals framed around advertising yield and refresh funding reach that buyer, and they approve at roughly 3 times the rate of operational business cases. It requires understanding airport concession economics rather than display technology. Suppliers still presenting to operations are addressing the department that increasingly no longer holds the budget. Concession economics rather than display technology is the only language reaching this buyer. Very few speak it.
Market Impact: Approves at roughly 3 times the usual rate

Attach to All Three Renewal Rhythms

Panels fail at around 7 years, software renews annually and terminals refurbish about every 14, which means an installation contains three revenue streams on different clocks. Suppliers capturing all three earn roughly 2.4 times the lifetime value of those selling installation alone and leaving panel replacement and software renewal to somebody else. It requires maintaining service presence and software capability rather than project delivery only. Integrators built around construction projects consistently forfeit the two streams that recur. An installation is a decade-long relationship or a single project, and the supplier decides which by how it staffs afterwards.
Market Impact: Earns roughly 2.4 times the lifetime installation value

Build Delivery Presence Where Terminals Are Rising

Terminal construction has moved decisively to India, Southeast Asia and the Gulf, and each project installs a complete system worth several times a refresh in a mature market. Suppliers with regional delivery and support presence win those programmes; those flying teams in for tenders generally do not. Regional presence raises win rates on construction projects by around 45%. It costs money against work that has not yet been awarded, which is why several suppliers keep deciding against it and keep losing. The largest opportunities in this market are no longer where the incumbents live.
Market Impact: Raises construction win rates by around 45% overall

Who Controls the Margin Pool

Concentration sits near 43% across the top five on measured system, software and service revenue, and participants divide into airport systems companies who understand operational data, display specialists who understand hardware, and integrators who assemble both. The airport systems group holds the strongest position, because latency and data integration are where the difficulty actually sits and where an airport's confidence is either earned or lost during disruption.
Competition runs on three dimensions. Data integration and latency performance is first and rarely specified explicitly, which paradoxically favours suppliers who raise it themselves during a tender. Second is regional delivery presence, since terminal construction has concentrated in markets where flying teams in does not win work. Third is commercial integration capability, now that advertising funds a growing share of these systems.

Two pressures will move positions. Asian and Gulf construction rewards suppliers with local delivery capability regardless of their standing in mature markets, which is redistributing share toward firms with regional operations. Meanwhile advertising integration is bringing digital signage vendors into a market they previously ignored, and those firms understand commercial screen management considerably better than they understand a gate change.
flight-information-display-system-market-company-positioning-matrix-1788454942604

Competitive Moat and Risk Dimensions

AMADEUS

Moat: Operational data integration depth

Amadeus connects display systems to the airport operational databases, airline systems and passenger processing platforms it also supplies, which places the latency problem inside one supplier's control rather than across an integration boundary. That is where disruption performance is actually determined. Long relationships with airport operators renew across terminal programmes measured in decades rather than in contract terms.
AMADEUS

Risk: Commercial screen positioning

Advertising integration grows at 11.7% and sells to commercial revenue management through concession economics rather than operational data arguments, which is a different buyer and a different conversation. Digital signage vendors entering the market understand that side considerably better. The company's strength in operational integration does not automatically transfer to a department measuring yield per screen minute.
SITA

Moat: Airport community infrastructure

SITA operates shared airport infrastructure across many operators and airlines, which gives it data connections and operating relationships that a display supplier would need years to establish independently. Its presence across airport processes means display information draws from systems it already runs. Multi-airport operating experience produces disruption behaviour knowledge that single-project integrators cannot accumulate.
SITA

Risk: Construction market delivery

Terminal construction has concentrated in India, Southeast Asia and the Gulf, where regional delivery presence rather than global capability wins programmes and local integrators compete effectively on cost. Those projects install complete systems worth several times a mature market refresh. Building sufficient regional delivery capacity requires committing cost against work that has not yet been awarded to anybody.

Players Tracked

Prominent Players

Amadeus
SITA
Daktronics
INFAX
Collins Aerospace

Other Key Players

Samsung Electronics
LG Electronics
Sharp NEC Display Solutions
Panasonic
Siemens
Indra Sistemas
Thales
IER
Embross
Elbit Systems
RESA Airport Data Systems
Vanderlande
Materna IPS
Ultra Electronics
Rapiscan Systems

Recent Developments

MARCH 2025

Airports write disruption priority rules for commercial screen content

Operators introduced automatic suspension of advertising content during declared disruption events, after commercial slots occupied displays during incidents when passenger information demand was at its highest. Most of those rules were written following an incident rather than in anticipation of one. Passenger complaints had made the omission visible.
Signal: Priority between commercial and operational content is a policy decision that airports keep making only retrospectively.
JULY 2025

Asian terminal programmes award complete system installations at scale

Airport construction across India, Southeast Asia and the Gulf awarded full display system contracts covering entire new terminals, at project values several times typical mature market refresh work. Regional delivery presence featured heavily in evaluation criteria alongside technical capability. Product capability alone no longer decided those awards.
Signal: Construction demand has moved to markets where local delivery presence decides awards more than product capability does.
NOVEMBER 2025

Tenders begin specifying refresh latency under peak load conditions

Airport operators with recent disruption experience added contractual latency requirements measured during peak information demand rather than under normal operating conditions. Suppliers quoting only display specifications were unable to respond to those clauses meaningfully. Panel specification alone had dominated tender documents for two decades beforehand.
Signal: Airports that have had a bad day specify latency, and those that have not specify screen sizes instead.

What a Terminal System Costs

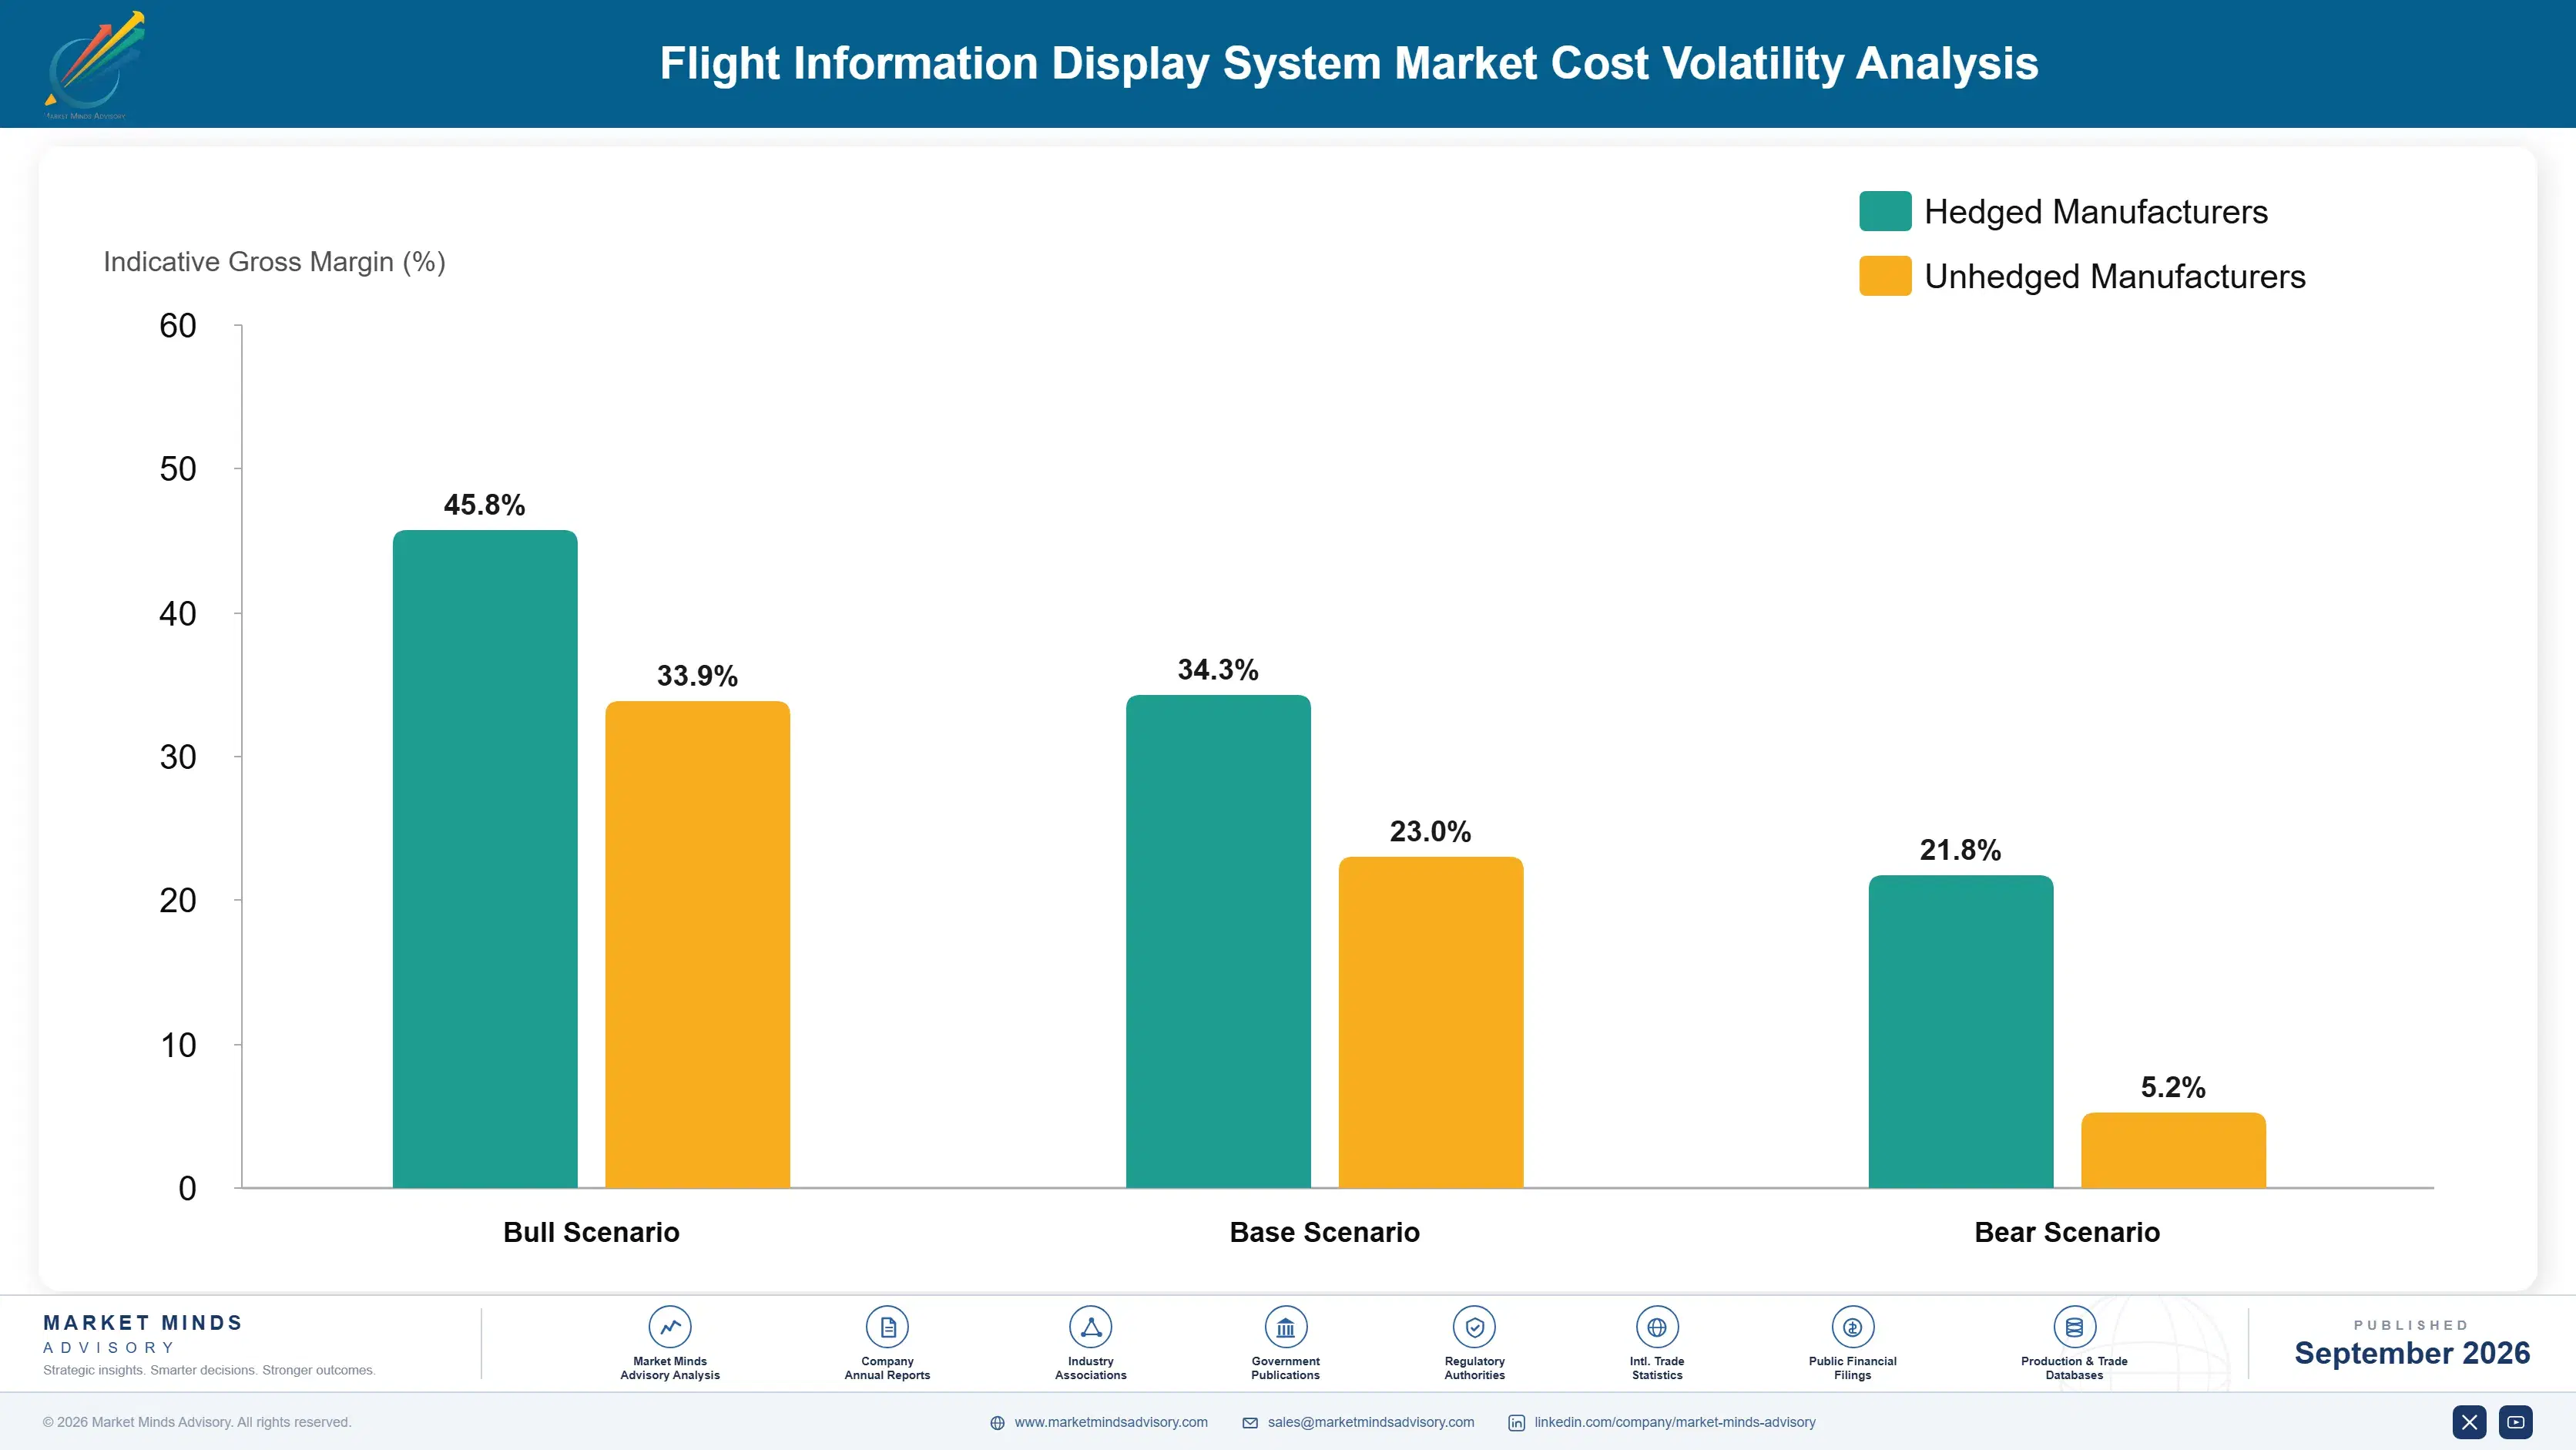
Cost structure divides between hardware nobody controls and integration everybody underestimates. Display panels, mounting, media players and cabling together account for roughly 46% of an installation, and panel pricing follows commercial display markets driven by volumes this industry does not influence. Integration engineering, data interface development, testing and commissioning consume most of the remainder and routinely overrun, because every airport's operational database behaves slightly differently.
Display panel pricing has moved favourably. Large format commercial panel costs fell through 2024 and 2025 as manufacturing capacity expanded ahead of demand across the wider signage market, which improved installation margins without any supplier doing anything. Samsung Electronics and Daktronics both referenced display component and pricing conditions in recent annual reporting. Integration labour moved the other way, and it is the larger and less predictable half of any project.

Exposure varies by project type rather than by scale. New terminal installations carry integration risk against a database that is itself being commissioned, which compounds uncertainty considerably. Refresh projects integrate against a working system and are far more predictable. Suppliers weighted to construction carry the volatility; those weighted to refresh and panel replacement carry a steadier and smaller business than construction currently offers.
flight-information-display-system-market-cost-volatility-analysis-1788454942798

Price integration against database maturity, not screen count

Integration effort depends entirely on how well documented and how stable the airport's operational database is, and screen count predicts almost nothing about it. Pricing against a short assessment of the data environment before commitment converts a fixed price gamble into a scoped engagement. Suppliers quoting per display on new terminal projects are pricing the one variable they cannot see.

Specify panels from mainstream commercial signage volumes

Display pricing follows a signage market whose volumes dwarf aviation entirely, so specifying mainstream panels rather than aviation-specific variants captures cost movements this industry has no influence over. Availability is better and replacement at the 7 year cycle is considerably simpler. Aviation-specific panel specifications are usually habit rather than requirement, and challenging them during design review is worth the conversation.

Build disruption testing into commissioning deliberately

Systems are commissioned under normal operating conditions and judged during events raising information demand around 310%, so the acceptance test measures the wrong thing entirely. Load testing against simulated disruption before handover finds latency failures while somebody can still fix them cheaply. Airports rarely request it, which is why offering it distinguishes a supplier who has thought about the problem.

Portfolio Architecture for Margin Defence

Margin architecture separates on whether the work is hardware or assurance. Display supply and installation earn thin margins against panel pricing set in a much larger signage market, and any competent integrator can perform the work. Integration software and latency assurance earn considerably more, because that is where disruption performance is determined and where an airport's confidence resides after it has had a difficult day.
The tension runs between construction volume and recurring revenue. New terminal installations are large, lumpy, geographically concentrated in Asia and the Gulf, and carry integration risk against databases being commissioned simultaneously. Panel replacement at 7 years and software subscription recur steadily inside a 14 year terminal cycle and earn better per unit of effort. Suppliers weighted entirely to construction ride a wave; those weighted entirely to service miss the wave altogether.

High-value revenue concentrates in integration software and in commercial display management. Integration is defended by latency performance that competitors cannot demonstrate without an installation. Commercial management is defended by understanding concession economics rather than display technology. Panel supply is the volume base, funding presence at an airport that the higher-value work is then sold into over the following decade.

Volume / Commodity-Adjacent

Display panel supply, mounting and physical installation work available from any competent integrator. The range separates suppliers buying at mainstream signage volumes from those specifying aviation variants. Panel pricing is set in a market this industry does not influence.
Gross Margin: 16-29%

Premium / Certified

System integration, commissioning and managed service contracts across an installed estate. Margin depends on database maturity at the airport rather than on anything the supplier controls. Refresh projects are considerably more predictable than new terminal work.
Gross Margin: 28-46%

Sustainability / Regulatory / Next-Generation

Content management software, latency assurance and commercial display integration sold on subscription. The widest range in the portfolio, reflecting integration depth and commercial yield capability. Highest margin and the only genuinely recurring revenue here.
Gross Margin: 48-72%
flight-information-display-system-market-portfolio-architecture-1788454943299

High-value Sub-segments and Strategic Watch-out

Commercial Display Integration

High value with the fastest growth at 11.7%, funded by advertising income rather than operational budgets and sold to commercial revenue management. The range reflects yield capability and concession structure. Its exposure is the unwritten priority rule during disruption, which airports keep addressing only after an incident.
Gross Margin: 50-72%

Integration Software Subscription

High value with strong growth at 10.2%, carrying the only genuine subscription rhythm in a market otherwise built on replacement cycles. The range reflects data feed complexity by airport. Latency performance cannot be demonstrated without an installation, which protects incumbents considerably here. That is unusual in signage.
Gross Margin: 48-69%

Panel Replacement and Service

The dependable core, recurring at around 7 years regardless of construction activity or airport investment appetite. The range reflects service network density and contract terms. It is the least discussed demand in this market and the one suppliers can actually forecast reliably. Nobody markets it.
Gross Margin: 27-45%

New Terminal Installation Contracts

The strategic watch-out, carrying integration risk against operational databases being commissioned at the same time as the displays. Fixed price commitments here produce most of the losses in this market. Suppliers quoting per screen are pricing the one variable they cannot possibly see beforehand at all.
Gross Margin: 0-18%

Three Clocks, One Installation

Recurrence runs on three separate rhythms inside a single system. Panels fail at around 7 years and are replaced regardless of anything else happening at the airport. Software renews annually and grows with data feed complexity. The terminal itself is refurbished roughly every 14 years, which is when the whole system changes and a supplier either keeps the airport for another decade or loses it. Very few suppliers are positioned for all three.
Adoption depth varies with how far the system reaches into airport operations. A display estate drawing only from a flight database can be replaced by any integrator at the next refresh. One feeding from baggage, border processing, security queue measurement and commercial yield management has become part of how the airport runs, and replacing it means reconnecting all of that. Airports with deeper integration change supplier far less often.

The buyer has moved and split. Operations specified these systems for decades against passenger information requirements. Commercial revenue teams now hold a growing share of the budget because advertising funds the screens, and information technology holds the software relationship. Suppliers addressing only operations are presenting to one of three parties, and increasingly not the one signing.
flight-information-display-system-market-end-use-penetration-index-1788454943785

What Airports Actually Buy

These are among the four positions where our research anticipates prominent divergence between winners and laggards over the coming forecast period. Each is grounded in the demand model, the regulatory perimeter, and the announced capacity pipeline.
01 / LATENCY ASSURANCE SELLING

Warrant the four seconds, not the screen specification

Systems are tendered against normal operation and judged during disruption events that raise passenger information demand roughly 310%, when database updates arrive fastest and a stale display misdirects several hundred people at once. Suppliers offering contractual latency guarantees under peak load, held at around four seconds, differentiate on the only dimension that genuinely matters and win against cheaper bids at roughly 2 times the rate. Competitors quoting panel specifications are answering a question the airport has not yet learned to ask.
02 / COMMERCIAL BUDGET ACCESS

Present to revenue management, not to operations

Airports now sell around 23% of screen time, which has moved system ownership toward commercial revenue management where budgets are funded by income the displays themselves generate rather than by operational necessity. Proposals framed around advertising yield and refresh funding reach that buyer and approve at roughly 3 times the rate of operational business cases put to the same airport. It requires understanding concession economics rather than display technology, which is a capability most system suppliers have never needed before.
03 / THREE RHYTHM COVERAGE

Hold the panel, the software and the terminal cycle

Panels fail at around 7 years, software renews annually and terminals refurbish roughly every 14 years, so a single installation contains three revenue streams running on entirely separate clocks inside one system. Suppliers capturing all three earn roughly 2.4 times the lifetime value of those selling the installation alone and leaving replacement and renewal to somebody else entirely afterwards. It requires maintaining a service presence and software capability rather than project delivery alone, which construction-oriented integrators consistently decline to build for themselves.
04 / CONSTRUCTION MARKET PRESENCE

Be resident where the terminals are actually rising

Terminal construction has moved decisively to India, Southeast Asia and the Gulf, where each project installs a complete system worth several times a refresh in a mature market and regional delivery presence appears in evaluation criteria. Suppliers with local delivery and support capability raise win rates on those programmes by around 45% against competitors flying teams in for tenders. It costs money against work not yet awarded, which is exactly why several suppliers keep deciding against it and keep losing.

Engagement Snapshot From the Field

A live engagement with an industry participant carrying material or product regulatory and market exposure ahead of a defining policy shift, showing how our research translates into a defensible multi-year portfolio strategy.
MARKET MINDS ADVISORY · CLIENT ENGAGEMENT SUMMARY
Flight Information Display System Producer Strategic Portfolio Review and Transition Roadmap 2026·Investment Scenario on Flight Information Display System Exposure Evaluation 2025-26
CLIENT PROFILE
An international hub airport handling approximately 38 million passengers annually across three terminals (client-reported, unverified by MMA). The existing display system was fourteen years old, panels were failing at increasing rates, and a major weather disruption the previous winter had produced sustained complaints about displays showing superseded gate information for extended periods. Nobody had measured why.
STRATEGIC CHALLENGE
A replacement tender had been drafted around screen count, panel specification and mounting requirements, with an estimated value near USD 24 million (client-reported, unverified by MMA). Nothing in the document addressed refresh latency or behaviour under peak load. The winter disruption had been attributed to staff communication rather than to the display system itself.
MMA APPROACH
MMA reconstructed the winter disruption from operational database logs and display update records rather than from incident reports, which described consequences rather than causes. We measured actual screen latency during the event, interviewed 24 operations, commercial and technology staff, and assessed what the drafted tender would and would not have prevented.
KEY FINDINGS
  1. Screen updates during the disruption lagged the operational database by up to eleven minutes at peak, against roughly four seconds under normal conditions.
  2. The lag originated in the integration layer under update volume rather than in the panels the tender was principally concerned with specifying.
  3. Advertising content had continued displaying throughout the disruption, since no priority rule existed to suspend it automatically at any point during the event.
  4. Commercial revenue from screen advertising exceeded the annual system maintenance budget, and neither department had ever discussed the relationship between those two figures.
CLIENT PROFILE
An international hub airport handling approximately 38 million passengers annually across three terminals (client-reported, unverified by MMA). The existing display system was fourteen years old, panels were failing at increasing rates, and a major weather disruption the previous winter had produced sustained complaints about displays showing superseded gate information for extended periods. Nobody had measured why.
STRATEGIC CHALLENGE
A replacement tender had been drafted around screen count, panel specification and mounting requirements, with an estimated value near USD 24 million (client-reported, unverified by MMA). Nothing in the document addressed refresh latency or behaviour under peak load. The winter disruption had been attributed to staff communication rather than to the display system itself.
MMA APPROACH
MMA reconstructed the winter disruption from operational database logs and display update records rather than from incident reports, which described consequences rather than causes. We measured actual screen latency during the event, interviewed 24 operations, commercial and technology staff, and assessed what the drafted tender would and would not have prevented.
KEY FINDINGS
  1. Screen updates during the disruption lagged the operational database by up to eleven minutes at peak, against roughly four seconds under normal conditions.
  2. The lag originated in the integration layer under update volume rather than in the panels the tender was principally concerned with specifying.
  3. Advertising content had continued displaying throughout the disruption, since no priority rule existed to suspend it automatically at any point during the event.
  4. Commercial revenue from screen advertising exceeded the annual system maintenance budget, and neither department had ever discussed the relationship between those two figures.
RECOMMENDED STRATEGY
Phase 1: Rewrite the tender around contractual latency under simulated peak load, since the failure was integration performance rather than display hardware. Phase 2: Establish an automatic priority rule suspending commercial content during declared disruption, which no supplier will ever propose unprompted during a tender process. Phase 3: Fund the replacement partly from advertising revenue, which already exceeds maintenance cost and sits with a department never previously consulted.
OUTCOME
The retendered system was awarded at roughly USD 21 million with contractual latency clauses and disruption load testing included (client-reported, unverified by MMA). Commercial revenue funded about a third of the programme, and measured latency during a subsequent disruption event held under nine seconds against eleven minutes previously.

Frequently Asked Questions

Foundational context covering the market sizes, CAGR, scope, country, region and competition that inform every finding below. This section is provided to cover basics and most often pre-purchase conversations, answered from the MMA Primary Research Dataset.

What is the current size of the Flight Information Display System Market?

The market was worth USD 1.9 billion in 2025 and reaches USD 2.05 billion in 2026. Airports now sell roughly 23% of display screen time commercially.

How large will the Flight Information Display System Market be by 2036?

MMA forecasts USD 4.34 billion by 2036, an expansion of 2.12 times over the forecast period. That represents USD 2.29 billion of incremental annual revenue against 2026.

What is the CAGR for the Flight Information Display System Market 2026 to 2036?

The base case is 7.8% compound annual growth, with a bull case at 9.0% and a bear case at 6.6%. Terminal construction timing separates the scenarios most clearly.

Which segment is growing fastest?

Advertising and commercial display integration grows at 11.7%, half again the market rate of 7.8%. Selling screen time turned a cost centre into a revenue one.

Who are the major companies in the Flight Information Display System Market?

Amadeus, SITA, Daktronics, INFAX and Collins Aerospace lead on measured system, software and service revenue. Together they hold roughly 43% across three quite distinct supplier types.

Which country is growing fastest?

India grows fastest at 11.4%, on the largest airport construction programme in the world, where each new terminal installs a complete system rather than replacing one.

Report Segmentation Architecture

The full report scope spans multiple orthogonal segmentation dimensions, with cross-tabulated demand data provided for each dimension pair. Coverage extends further to regional breakdowns, trend trajectories, and the competitive detail needed to support segment-level decision-making.

By Primary Market Dimension

  • Advertising and Commercial Display Integration
  • Content Management and Data Integration Software
  • Departure and Arrival Display Hardware
  • Gate and Boarding Area Displays
  • Baggage and Wayfinding Displays
  • Managed Service and Maintenance Contracts

By End-Use Industry

  • International Hub Airports
  • Regional and Domestic Airports
  • Low Cost Carrier Terminals
  • Airline Operated Facilities
  • Ground Handling Operations
  • Rail and Multimodal Transport Hubs

By Commercial Dimension

  • New Terminal Programmes
  • Refurbishment and Refresh Projects
  • Panel Replacement Contracts
  • Software Subscription Agreements
  • Concession and Advertising Partnerships
  • Managed Service Arrangements

By Region

  • East Asia
  • South Asia and Pacific
  • North America
  • Western Europe
  • Middle East and Africa
  • Latin America
  • Eastern Europe

Scope, Methodology, and Coverage

Every figure in this report is reproducible from documented input assumptions. The scope below maps the historical period, the forecast horizon, the segmentation dimensions, and the countries covered, alongside the underlying primary and qualitative methodology.
Historical Period
2020 to 2025
Forecast Period
2026 to 2036
Base Year
2025 (USD billions; MMA Primary Research Dataset, September 2026)
Market Definition
This market covers systems that present operational flight and airport information to passengers and staff, spanning advertising and commercial display integration, content management and data integration software, departure and arrival display hardware, gate and boarding area displays, baggage and wayfinding displays, and managed service and maintenance contracts. Revenue is measured as hardware, software, integration and attributable service value at supplier level across new installation, refurbishment and replacement work. Airport operational databases sold separately, air traffic control and airfield systems, baggage handling machinery, self-service check-in and bag drop kiosks, security screening equipment, and advertising media sales revenue itself are excluded from scope.
Quantitative Units
USD billions, hardware, software, integration and attributable service revenue at supplier level
Segmentation Dimensions
System function, airport type, commercial arrangement, region
Regions Covered
East Asia, South Asia and Pacific, North America, Western Europe, Middle East and Africa, Latin America, Eastern Europe
Countries Covered
China, Japan, South Korea, Taiwan, Hong Kong, India, Indonesia, Vietnam, Philippines, Thailand, Malaysia, Singapore, Australia, United States, Canada, Mexico, Brazil, Chile, Colombia, United Kingdom, Germany, France, Netherlands, Spain, Italy, Poland, Romania, Czechia, United Arab Emirates, Saudi Arabia, Qatar, Turkey, Kenya, South Africa
Key Companies Profiled
Amadeus, SITA, Daktronics, INFAX, Collins Aerospace, Samsung Electronics, LG Electronics, Sharp NEC Display Solutions, Panasonic, Siemens, Indra Sistemas, Thales, IER, Embross, Elbit Systems, RESA Airport Data Systems, Vanderlande, Materna IPS, Ultra Electronics, Rapiscan Systems
Quantitative Methodology
Primary survey, n=3,800 respondents, Q4 2025, six countries; demand-side model with trade association cross-validation
Qualitative Methodology
47 expert interviews, Q4 2025; applied to validate demand model assumptions, identify emerging dynamics, and assess competitive positioning
Report Format
PDF and XLSX data workbook (Word format preview document)
Publisher
Market Minds Advisory
Report Code
MMA-2026-TEC-201
Published
September 2026
Contact
sales@marketmindsadvisory.com | www.marketmindsadvisory.com

Purchase the full Flight Information Display System Market Report (2026 to 2036).

The full MMA report treats flight information display as a data integrity problem rather than a screen purchase, and explains why systems specified against normal operation are judged during disruption. It sizes the market to 2036 across six system functions, seven regions and 34 countries, with segment growth rates and regional demand mechanisms detailed. Competitive analysis covers 20 suppliers assessed on measured system, software and service revenue, with moat and risk assessment for the two leaders. The report quantifies installation cost structure, advertising integration economics and margin architecture across three portfolio tiers. It closes with four verdicts and an anonymised hub airport engagement.
Six system functions sized through 2036
Seven regions with demand mechanism analysis
Twenty suppliers on consistent revenue basis
Latency, refresh cycle and advertising benchmarks
Margin architecture across three portfolio tiers
Anonymised hub airport display replacement engagement

Built For The People Who Decide

From boardroom strategy to bench-side execution, this report is read cover-to-cover by leaders shaping the next decade of their industry, turning demand scenarios, market dynamics and valuation benchmarks into decisions.
CXOs/ Presidents/ VPs/ Managers
M&A and Corporate Development
Strategy Teams and R&D Heads
Procurement and Product Directors
Regulatory and Compliance Leaders
Investor Relations and Equity Analysts