Market Minds Advisory
Fish Can Market

Fish Can Market: Compliance and Premiumization Reshape a Commodity Category

Thailand's export-scale tuna canning industry and steady demand for shelf-stable protein keep fish can volume resilient, but tightening tinplate cost and BPA-free lining rules are forcing smaller can makers to consolidate or exit lower-margin contracts.

Lead Analyst

Bilal Shaikh

Published

September 2026

Make Smarter Decisions with Customized Research Insights

Request a free sample report and evaluate market opportunities, growth trends, and competitive dynamics relevant to your business needs.

2025 MARKET VALUE$4.2BMarket Size 2025
2036 FORECAST VALUE$7.8BBase Case , 2026 to 2036
CAGR 2026 TO 20365.8 %Bull 7.0% / Bear 4.5%
INCREMENTAL OPPORTUNITY$3.4BNet 10- year value creation
EXPANSION MULTIPLE1.76x2036 value over 2026 base
Strategic Levers
M&A Pipeline
Regional Outlook
Country Rankings
Competitive Intelligence
Segmental Deep-dive
Call-Us : 91 93563 13602

Executive Snapshot and Market Trajectory

Fish can demand tracks global canned seafood consumption closely, and Thailand's export-scale tuna canning industry alone anchors a meaningful share of worldwide can procurement volume, sustaining steady baseline demand even as individual processor contracts shift between competing can suppliers across the category and its various sub-segments today.
Salmon cans are the fastest growing category as premiumization lifts canned salmon consumption in North America and Western Europe, while East Asia commands the largest regional share on the strength of concentrated can manufacturing capacity and proximity to Southeast Asia's dominant tuna processing hubs, a geographic advantage no other region can currently replicate at comparable manufacturing scale, shipping cost, or overall production efficiency nationwide, regionally, and increasingly well beyond its own established borders today.
A handful of multinational can makers supply the bulk of branded seafood processor demand through long-term supply contracts, while regional manufacturers in China and Southeast Asia compete aggressively on price for smaller processor accounts across the broader industry today and going forward. BPA-free lining regulation and tinplate cost volatility are increasingly separating well-capitalized suppliers from smaller regional competitors unable to absorb compliance investment costs.
Market Definition
The fish can market covers rigid metal, primarily tinplate steel and aluminum, can packaging manufactured for canned fish and seafood products including tuna, sardines, salmon, mackerel, and pet food applications, sold to seafood processors and canners. It excludes flexible pouch and retort packaging, glass jars, and cans manufactured for non-seafood food and beverage applications.
Base Year Value
$4.2B in 2025 (MMA Primary Research Dataset, August 2026)
Forecast Period
2026 to 2036, eleven discrete annual values
CAGR
5.8% base case. Bull 7.0%. Bear 4.5%.
Fastest Growth Segment
Salmon Cans: 8.2% CAGR
Fastest Growth Country
Thailand: 8.1% CAGR
Fastest Growth Region
South Asia and Pacific: 8.1% CAGR
Largest Region
East Asia: 29% of 2025 global value
Market Leaders
Crown Holdings Inc, Silgan Holdings Inc, Ardagh Group S.A., Toyo Seikan Group Holdings Ltd, CANPACK Group. Source: MMA Analysis based on company annual reports and investor filings.
Primary Survey
n=3,800 procurement and R&D decision-makers, Q4 2025, six countries
Methodology
Demand-side build-up, cross-validated against public data, 47 expert interviews

Fish Can Market Forecast Scenarios

fish-can-market-size-forecast-scenario-1787298080396
Fish can demand grew steadily from 2020 as canned seafood consumption rose during pandemic era pantry stocking and remained elevated afterward given its shelf-stable, affordable protein positioning across most major consumer markets. Thailand's tuna canning export volume expanded further through 2023 and 2024. The market grew at a historical rate of roughly 5.1% annually across this period.
The base case rests on three mechanisms: rising global protein demand sustaining baseline canned seafood consumption across both mature and rapidly developing consumer markets simultaneously, premiumization lifting demand for higher-value canned salmon and specialty fish categories across North America and Western Europe specifically, and BPA-free lining conversion driving replacement demand for existing can manufacturing lines across major processor accounts globally throughout the full ten-year forecast period that lies directly ahead.
The bull case rests on faster than expected canned seafood consumption growth in South Asia and Pacific as rising incomes expand affordable protein access across the region. The bear case centers on continued flexible pouch and retort packaging substitution eroding can volume in convenience-oriented product categories, particularly among younger consumers in mature Western markets who prioritize different attributes.

A Commodity Category Sorting Into Compliance Tiers

Fish cans occupy a genuinely stable corner of protein packaging, since canned seafood's shelf-stability and affordability keep it insulated from many of the demand swings that affect fresher, more perishable protein categories across most consumer markets worldwide. Tuna dominates unit volume by a wide margin, but salmon and specialty categories are increasingly where processors and can makers concentrate premium investment and packaging innovation efforts today.
MARKET CONCENTRATION48% (CR5)Concentrated base spans global multinational and regional Asian can manufacturers
AVERAGE CAN PRICING$0.08-$0.32Reflects tinplate cost and can size across product categories
TOP PRODUCING COUNTRYChina, 24% shareLargest single manufacturing hub tied to regional processing proximity
BPA-FREE LINING ADOPTION54%Share of production now converted to BPA-free lining technology
INPUT COST SHARE46% of COGSReflects tinplate steel and coating costs relative to total spend
THAI EXPORT VOLUME SHARE20% of global tradeReflects export volume tied to global tuna canning trade
Demand concentrates wherever canning and processing capacity are strongest across a given regional supply chain. East Asia generates the largest can procurement volume given its manufacturing proximity to Southeast Asia's dominant tuna processing hubs, while North America and Western Europe sustain premium pricing through branded salmon and specialty fish can categories sold at retail rather than through commodity export contracts nationwide.
Over the next decade, BPA-free lining compliance and tinplate cost management will matter more than raw manufacturing scale alone, since regulatory transition cost genuinely separates well-capitalized suppliers from smaller regional competitors across the broader industry. Can makers able to demonstrate lining compliance and secure long-term processor contracts are positioned to capture disproportionate share as smaller competitors struggle with conversion costs and financing.
"Nobody thinks about the can until it fails a compliance audit or a steel contract renews at a bad price. Those two things now decide more about who wins processor business than brand loyalty ever did."
Director, Metal Packaging and Food Containers Practice · MMA Metal Packaging and

Market Trends

BPA-Free Lining Conversion Reshapes Manufacturing Investment

Regulatory restrictions on bisphenol-A in food-contact packaging across the European Union, several US states, and increasingly parts of Asia are pushing can makers to convert existing manufacturing lines to BPA-free lining technology, a capital-intensive transition that favors well-capitalized multinational suppliers over smaller regional competitors operating on thinner margins. Processors are increasingly specifying BPA-free lining as a standard procurement requirement rather than a premium option, converting what was once an optional upgrade into baseline compliance across most major retail and export markets. Smaller can makers unable to fund this conversion risk losing processor contracts to better-capitalized competitors.
Market Impact: Adds 2.1 billion cans annually

Premium Salmon Can Categories Expand Retail Shelf Space

Growing consumer preference for premium, sustainably sourced canned salmon is expanding retail shelf space and packaging investment in North America and Western Europe, converting what was historically a commodity tuna-dominated category into one with genuine premium sub-segments commanding higher can pricing and specialty labeling requirements. Retailers are increasingly dedicating shelf space to branded, traceable salmon can offerings that differentiate on sourcing certification rather than price alone, a shift that rewards can makers able to support smaller production runs and specialty printing. Suppliers with flexible manufacturing capability are capturing disproportionate share of this premium demand.
Market Impact: Supports exports worth $2.8 billion annually

Market Opportunities and Growth Drivers

Rising Global Protein Demand Sustains Baseline Volume

Growing global population and rising demand for affordable, shelf-stable protein sources are sustaining baseline canned seafood consumption across both mature and developing markets, particularly in regions where refrigeration infrastructure remains limited and canned protein offers genuine practical advantages over fresh alternatives. Each processor expanding canning capacity to meet this demand represents a recurring, multi-year can procurement relationship, since can supply contracts typically span several years once a processor standardizes on a manufacturing partner. Can makers with established processor relationships and reliable supply chains are capturing disproportionate share of this steady, recurring demand pool.
Market Impact: Cuts convenience segment share by 8%

Thailand's Tuna Export Industry Anchors Demand

Thailand's position as the world's largest tuna canning export hub anchors substantial, concentrated can procurement volume that shapes regional manufacturing investment decisions across the broader Southeast Asian can supply chain and its many linked economies. Each expansion in Thai tuna processing capacity represents a meaningful, immediate increase in regional can demand, since export-oriented processors typically require rapid scaling of can supply to meet international retailer contracts on tight delivery timelines. Can makers with established Thai and Southeast Asian manufacturing presence are capturing disproportionate share of this export-anchored demand pool relative to distant import-dependent competitors.
Market Impact: Compresses margins 4 to 6 points

Market Restraints and Challenges

Flexible Pouch Packaging Erodes Convenience Segment Volume

Flexible retort pouches and stand-up bags are increasingly displacing traditional cans in convenience-oriented seafood categories, particularly among younger consumers who value the pouches' lighter weight, easier opening, and perceived freshness relative to traditional canned formats. The root cause is that pouch packaging requires less material and shipping weight than metal cans while offering comparable shelf stability for many seafood products, giving retailers and processors a genuine cost and marketing incentive to switch formats. This erodes can volume specifically in convenience and premium snacking categories. Can makers are responding by emphasizing recyclability advantages that pouches cannot match as easily.
Market Impact: Lifts BPA-free lining share to 54%

Tinplate Steel Price Volatility Compresses Manufacturer Margins

Tinplate steel, the primary raw material in fish can manufacturing, experiences significant price volatility tied to global steel market cycles and tin coating cost fluctuations, compressing manufacturer margins during periods of rising input cost that cannot always be passed through to processor customers under existing contracts. The root cause is that most can supply agreements lock in pricing for twelve to twenty-four month periods, leaving manufacturers exposed to steel cost increases during the contract term without recourse to renegotiate. This limits profitability during volatile steel pricing cycles. Manufacturers are responding by negotiating shorter contract terms with built-in cost pass-through clauses.
Market Impact: Expands premium salmon share to 18%
3 additional market trends, 4 additional growth drivers, and 2 additional restraints and challenges are covered in the full report. Contact sales@marketmindsadvisory.com to access the complete intelligence.

Segment CAGR and Growth Architecture

MMA segments the fish can market by fish product application, the classification that most directly determines can sizing, lining specification, and processor relationship structure across tuna, sardine and small pelagic, salmon, mackerel and herring, anchovy and specialty, and pet food fish can categories, rather than a material or construction based split across the industry entirely.
fish-can-market-market-share-analysis-1787298080925

Salmon Cans

Salmon cans are growing fastest, at roughly 8.2% annually, as premiumization lifts canned salmon consumption in North America and Western Europe, where consumers increasingly pay a meaningful premium for sustainably sourced, traceable salmon relative to commodity tuna alternatives sold at lower price points nationwide. Adoption concentrates among branded processors serving retail grocery channels rather than export-oriented bulk canners, since premium salmon packaging typically requires specialty printing and smaller production runs than commodity tuna can manufacturing. Pricing runs meaningfully higher than standard tuna cans, reflecting both the specialty labeling requirements and the smaller, more customized production runs premium salmon processors typically demand. Can makers with flexible manufacturing capability are positioned to capture disproportionate share of this expanding premium category.
CAGR 8.2%

Pet Food (Fish-Based) Cans

Pet food fish cans are growing at roughly 7.1% annually, driven by expanding global pet ownership and rising demand for premium, fish-based wet pet food formulations across North America, Western Europe, and increasingly urban East Asian markets nationwide today. Demand concentrates among pet food manufacturers expanding fish-based product lines to meet growing consumer preference for protein diversity and perceived health benefits relative to traditional meat-based formulations sold at comparable price points. This segment commands steady, predictable can specifications relative to human food categories, since pet food regulatory requirements differ from human consumption standards, sustaining recurring, high-volume can procurement relationships between pet food manufacturers and their established can supply partners nationwide.
CAGR 7.1%
Full segment breakdown across 6 segments available in the complete report.

Regional Architecture and Country Demand Map

East Asia holds the largest regional share given its manufacturing proximity to Southeast Asia's dominant tuna processing hubs, while South Asia and Pacific grows fastest on rising incomes and expanding processing capacity. North America and Western Europe sustain premium pricing through branded salmon and specialty can categories nationwide.

North America

North America's demand is anchored by the United States, where established canned tuna and growing premium salmon categories sustain steady can procurement volume across major branded processors and private label retail suppliers nationwide and quite considerably well beyond its own domestic borders and existing markets today. Retailer demand for BPA-free lining and sustainability certification is pushing can specification requirements considerably higher than in most export-oriented Asian markets currently serving bulk commodity contracts at scale. Canada's smaller market contributes steady secondary demand concentrated in similar branded retail categories at comparable specification standards. Mexico's growing canning industry adds incremental demand skewed toward standard tuna and sardine categories rather than premium salmon offerings.
Share: 22% | CAGR: 6.7% (2026 to 2036)

Western Europe

Western Europe's demand centers on Spain, France, and the UK, where established canned seafood consumption habits and strict BPA-free lining regulation sustain steady, compliance-driven can procurement volume across the region's branded processors and private label retail suppliers nationwide and increasingly beyond. The region grows the slowest of the seven given its canned seafood consumption is already comparatively mature, limiting new demand growth relative to faster expanding Asian and South Asian markets currently under active development and expansion. Spanish and Portuguese processors maintain deep export relationships supplying can-packaged sardines and tuna across the entire continent and beyond. Nordic countries contribute smaller but steadily growing demand concentrated in premium salmon categories nationwide.
Share: 18% | CAGR: 4.4% (2026 to 2036)
Regional intelligence for 5 additional markets available in the complete report: East Asia, South Asia and Pacific, Latin America, Middle East and Africa, Eastern Europe. Contact sales@marketmindsadvisory.com.
fish-can-market-country-cagr-analysis-1787298081439

Moving Beyond the Commodity Can Sale

Base tuna can pricing faces steady downward pressure from regional Asian manufacturers competing aggressively on export volume contracts. Suppliers that build BPA-free lining capability, secure premium salmon processor relationships, and expand Southeast Asian manufacturing presence capture considerably better lifetime value than those competing purely on unit price across every major seafood packaging market and distribution channel today.

Building BPA-Free Lining Manufacturing Capability Broadly

Suppliers investing in BPA-free lining conversion capture disproportionate share of a demand pool commanding pricing 12 to 18% above legacy lined cans, where regulatory compliance directly determines whether a manufacturer can win processor contracts now specifying BPA-free lining as a mandatory procurement requirement across major retail and export channels worldwide today. This conversion investment typically requires twelve to eighteen months of capital and validation work, but suppliers that complete it successfully capture durable, multi year processor contracts that persist across a customer's full procurement cycle and well beyond initial adoption.
Market Impact: Commands pricing 12 to 18% above legacy cans

Securing Dedicated Premium Salmon Processor Relationships

Suppliers securing dedicated premium salmon processor relationships capture meaningful recurring revenue worth an estimated 20 to 30% above standard tuna can pricing, converting a commodity export relationship into a captive specialty packaging partnership tied to a processor's branded retail growth across its multi year product development lifecycle and considerably expanding category strategy. This specialty relationship, difficult for commodity can sellers to replicate without flexible manufacturing and specialty printing capability, creates durable processor dependency that extends the commercial relationship well beyond the initial contract into years of recurring premium can supply.
Market Impact: Adds 20 to 30% above standard can pricing

Expanding Southeast Asian Can Manufacturing Capacity

Suppliers building dedicated manufacturing capacity in Thailand and Vietnam are capturing disproportionate share of the region's rapidly expanding export-oriented can demand pool worth an estimated 310 million dollars, positioning closer to Thailand's dominant tuna canning export volume rather than serving the market purely through imports carrying longer lead times and considerably higher landed costs today and going forward. This regional capacity investment requires meaningful capital commitment but positions suppliers to capture recurring, multi year export contracts as regional processors scale operations alongside expanding global seafood trade volume across many countries region wide.
Market Impact: Captures a growing $310M regional demand segment now

Securing Long-Term Processor Supply Agreements Broadly

Suppliers securing long-term processor supply agreements are capturing disproportionate share of a demand pool worth an estimated 280 million dollars tied to steady branded canned seafood volume across North America and Western Europe, a segment offering predictable, multi year procurement volume that spot market export sales rarely provide at comparable scale. This supply agreement relationship requires meaningful pricing and quality investment but positions suppliers to capture recurring, contract anchored procurement across a multi year agreement cycle, a relationship considerably more durable than typical spot market transactions negotiated purely on price.
Market Impact: Captures a growing $280M supply contract demand pool

Who Controls the Margin Pool

The fish can market is moderately concentrated, with a CR5 of roughly 48%. Crown Holdings and Silgan Holdings lead a group of multinational can makers with a meaningful gap over the next tier of regional Asian manufacturers and smaller processors competing across export and branded retail channels simultaneously in the current market environment.
Competitive activity concentrates on three fronts: BPA-free lining investment tied to tightening regulatory requirements, premium salmon processor relationship expansion that deepens revenue beyond standard tuna can sales, and Southeast Asian manufacturing expansion tied to Thailand's export-anchored demand. Multinational can makers defend positions through decades of accumulated processor relationships and manufacturing scale that smaller regional competitors cannot easily replicate quickly.

Emerging pressure comes from regional Chinese and Southeast Asian manufacturers building genuine cost and proximity advantages that established multinational can makers are racing to match through regional joint ventures rather than pure price competition. Rankings could shift meaningfully if a regional manufacturer successfully wins a major branded processor's global supply contract, demonstrating credible quality and scale that has historically been the primary advantage of established diversified multinational can makers with broad manufacturing footprints.
fish-can-market-company-positioning-matrix-1787298081959

Competitive Moat and Risk Dimensions

CROWN HOLDINGS INC

Moat: Broad Multinational Processor Relationships

Crown Holdings's extensive global manufacturing footprint and its long-term supply relationships with major branded seafood processors allow it to serve customers across multiple regions from a single coordinated account relationship, giving multinational processors a consistency of supply that smaller, single-region can makers typically cannot match at comparable scale.
CROWN HOLDINGS INC

Risk: Exposure to Commoditized Export Pricing

A meaningful share of Crown Holdings's fish can revenue remains tied to standard export tuna categories facing sustained price competition from regional Asian manufacturers, requiring continued mix shift investment toward premium salmon and BPA-free lined segments to offset this margin pressure over time and across future budget cycles.
SILGAN HOLDINGS INC

Moat: Deep US Food Can Scale

Silgan Holdings's dense North American manufacturing network and its established relationships with major branded and private label food processors give it a durable regional cost and logistics advantage that import-dependent competitors serving the same retail channels cannot easily replicate given shipping cost and delivery timeline constraints.
SILGAN HOLDINGS INC

Risk: Limited Southeast Asian Manufacturing Presence

Silgan Holdings's manufacturing footprint remains concentrated in North America, leaving it more exposed to Thailand and Southeast Asia's export-anchored demand growth than competitors with established regional manufacturing presence, a gap that could limit its share of the fastest-growing segment of global fish can demand over time.

Players Tracked

Prominent Players

Crown Holdings Inc
Silgan Holdings Inc
Ardagh Group S.A.
Toyo Seikan Group Holdings Ltd
CANPACK Group

Other Key Players

CPMC Holdings Limited
Kingcan Holdings Limited
Nampak Ltd
Massilly Group
Trivium Packaging B.V.
Ball Metalpack LLC
ORG Packaging (Guangdong) Co Ltd
Baosteel Packaging Co Ltd
Envases Universales de Mexico S.A. de C.V.
HUBER Packaging Group GmbH
Colep Packaging S.A.
American Canning LLC
Nussbaum Matzingen AG
DS Containers Inc
Hindustan Tin Works Limited

Recent Developments

FEBRUARY 2025

Crown Holdings Completes BPA-Free Lining Conversion

Crown Holdings completed a multi-year BPA-free lining conversion across several of its major seafood can manufacturing lines, aimed at branded processors seeking a single compliant supplier able to meet European Union and California regulatory requirements without any additional product substitution across their retail distribution networks nationwide.
Signal: Signals established multinational can makers are increasingly completing regulatory conversion ahead of tightening compliance deadlines broadly.
JUNE 2025

Silgan Holdings Expands Premium Salmon Can Capacity

Silgan Holdings announced an expansion of its premium salmon can manufacturing capacity at a North American facility, aimed at branded processors seeking flexible production runs and specialty printing capability to support growing retail demand for premium, sustainably sourced canned salmon products across major grocery chains nationwide.
Signal: Signals established food can leaders are increasingly prioritizing premium capacity ahead of continued category growth broadly.
OCTOBER 2025

CPMC Holdings Expands Southeast Asian Manufacturing

CPMC Holdings announced a new manufacturing facility in Vietnam to serve growing regional tuna canning export demand, aimed at export-oriented processors seeking regionally manufactured cans with considerably shorter delivery lead times than imports arriving from more distant Chinese or Western manufacturing facilities nationwide and beyond.
Signal: Signals regional Asian manufacturers are increasingly scaling capacity to capture Thailand-adjacent export demand directly and quickly.

Tinplate Steel and Coating Sourcing Risk

Tinplate steel, sourced primarily from specialized steel manufacturers in China, Japan, and Western Europe, accounts for roughly 42 to 50% of operating cost, given the coating consistency and food-contact safety standards fish can manufacturing requires throughout production. Tin coating and interior lining materials contribute a further 12 to 16% of total operating cost across the manufacturing portfolio.
Global tinplate steel prices spiked meaningfully during 2021 and 2022 amid pandemic related supply chain disruption and rising energy costs affecting steel producers industry wide, pushing input costs up by more than 26% within several months, according to operating cost disclosures in Crown Holdings's 2022 annual report. The disruption prompted several manufacturers to diversify steel sourcing across multiple regional suppliers and qualify backup mills to reduce future dependency.

Smaller regional can makers without long term steel supply agreements face greater cost exposure than larger diversified players like Crown Holdings and Silgan Holdings, who negotiate volume based contracts directly with steel mills. Manufacturers dependent on single source tinplate suppliers face additional exposure to regional steel capacity constraints, a limitation vertically integrated can makers do not share to the same degree.
fish-can-market-cost-volatility-analysis-1787298082153

Diversifying Tinplate Steel Suppliers Across Regions

Larger manufacturers are increasingly qualifying multiple specialized steel mills across different geographic regions to reduce dependence on any single supplier relationship, a meaningful undertaking given the strict coating consistency and food-contact safety standards tinplate steel always requires before formal regulatory clearance for use in active, ongoing food packaging applications nationwide and across export markets.

Negotiating Volume-Based Steel Supply Agreements

Larger manufacturers are increasingly negotiating volume based tinplate steel supply agreements directly with specialized mills, reducing per unit cost exposure and building predictable pricing structures that protect margin during periods of broader steel price volatility affecting fish can manufacturing costs across the industry more broadly and consistently over multiple future fiscal years and budget cycles.

Building Regional Manufacturing to Cut Freight Cost

Several manufacturers have established regional production facilities closer to major processing hubs, reducing dependence on long-distance tinplate shipping and building shorter, more resilient supply chains that remain genuinely valuable relative to growing industry wide demand for reliable can supply across multiple concurrent processor relationships, geographic markets, and expanding export corridors today and going forward.

Portfolio Architecture for Margin Defence

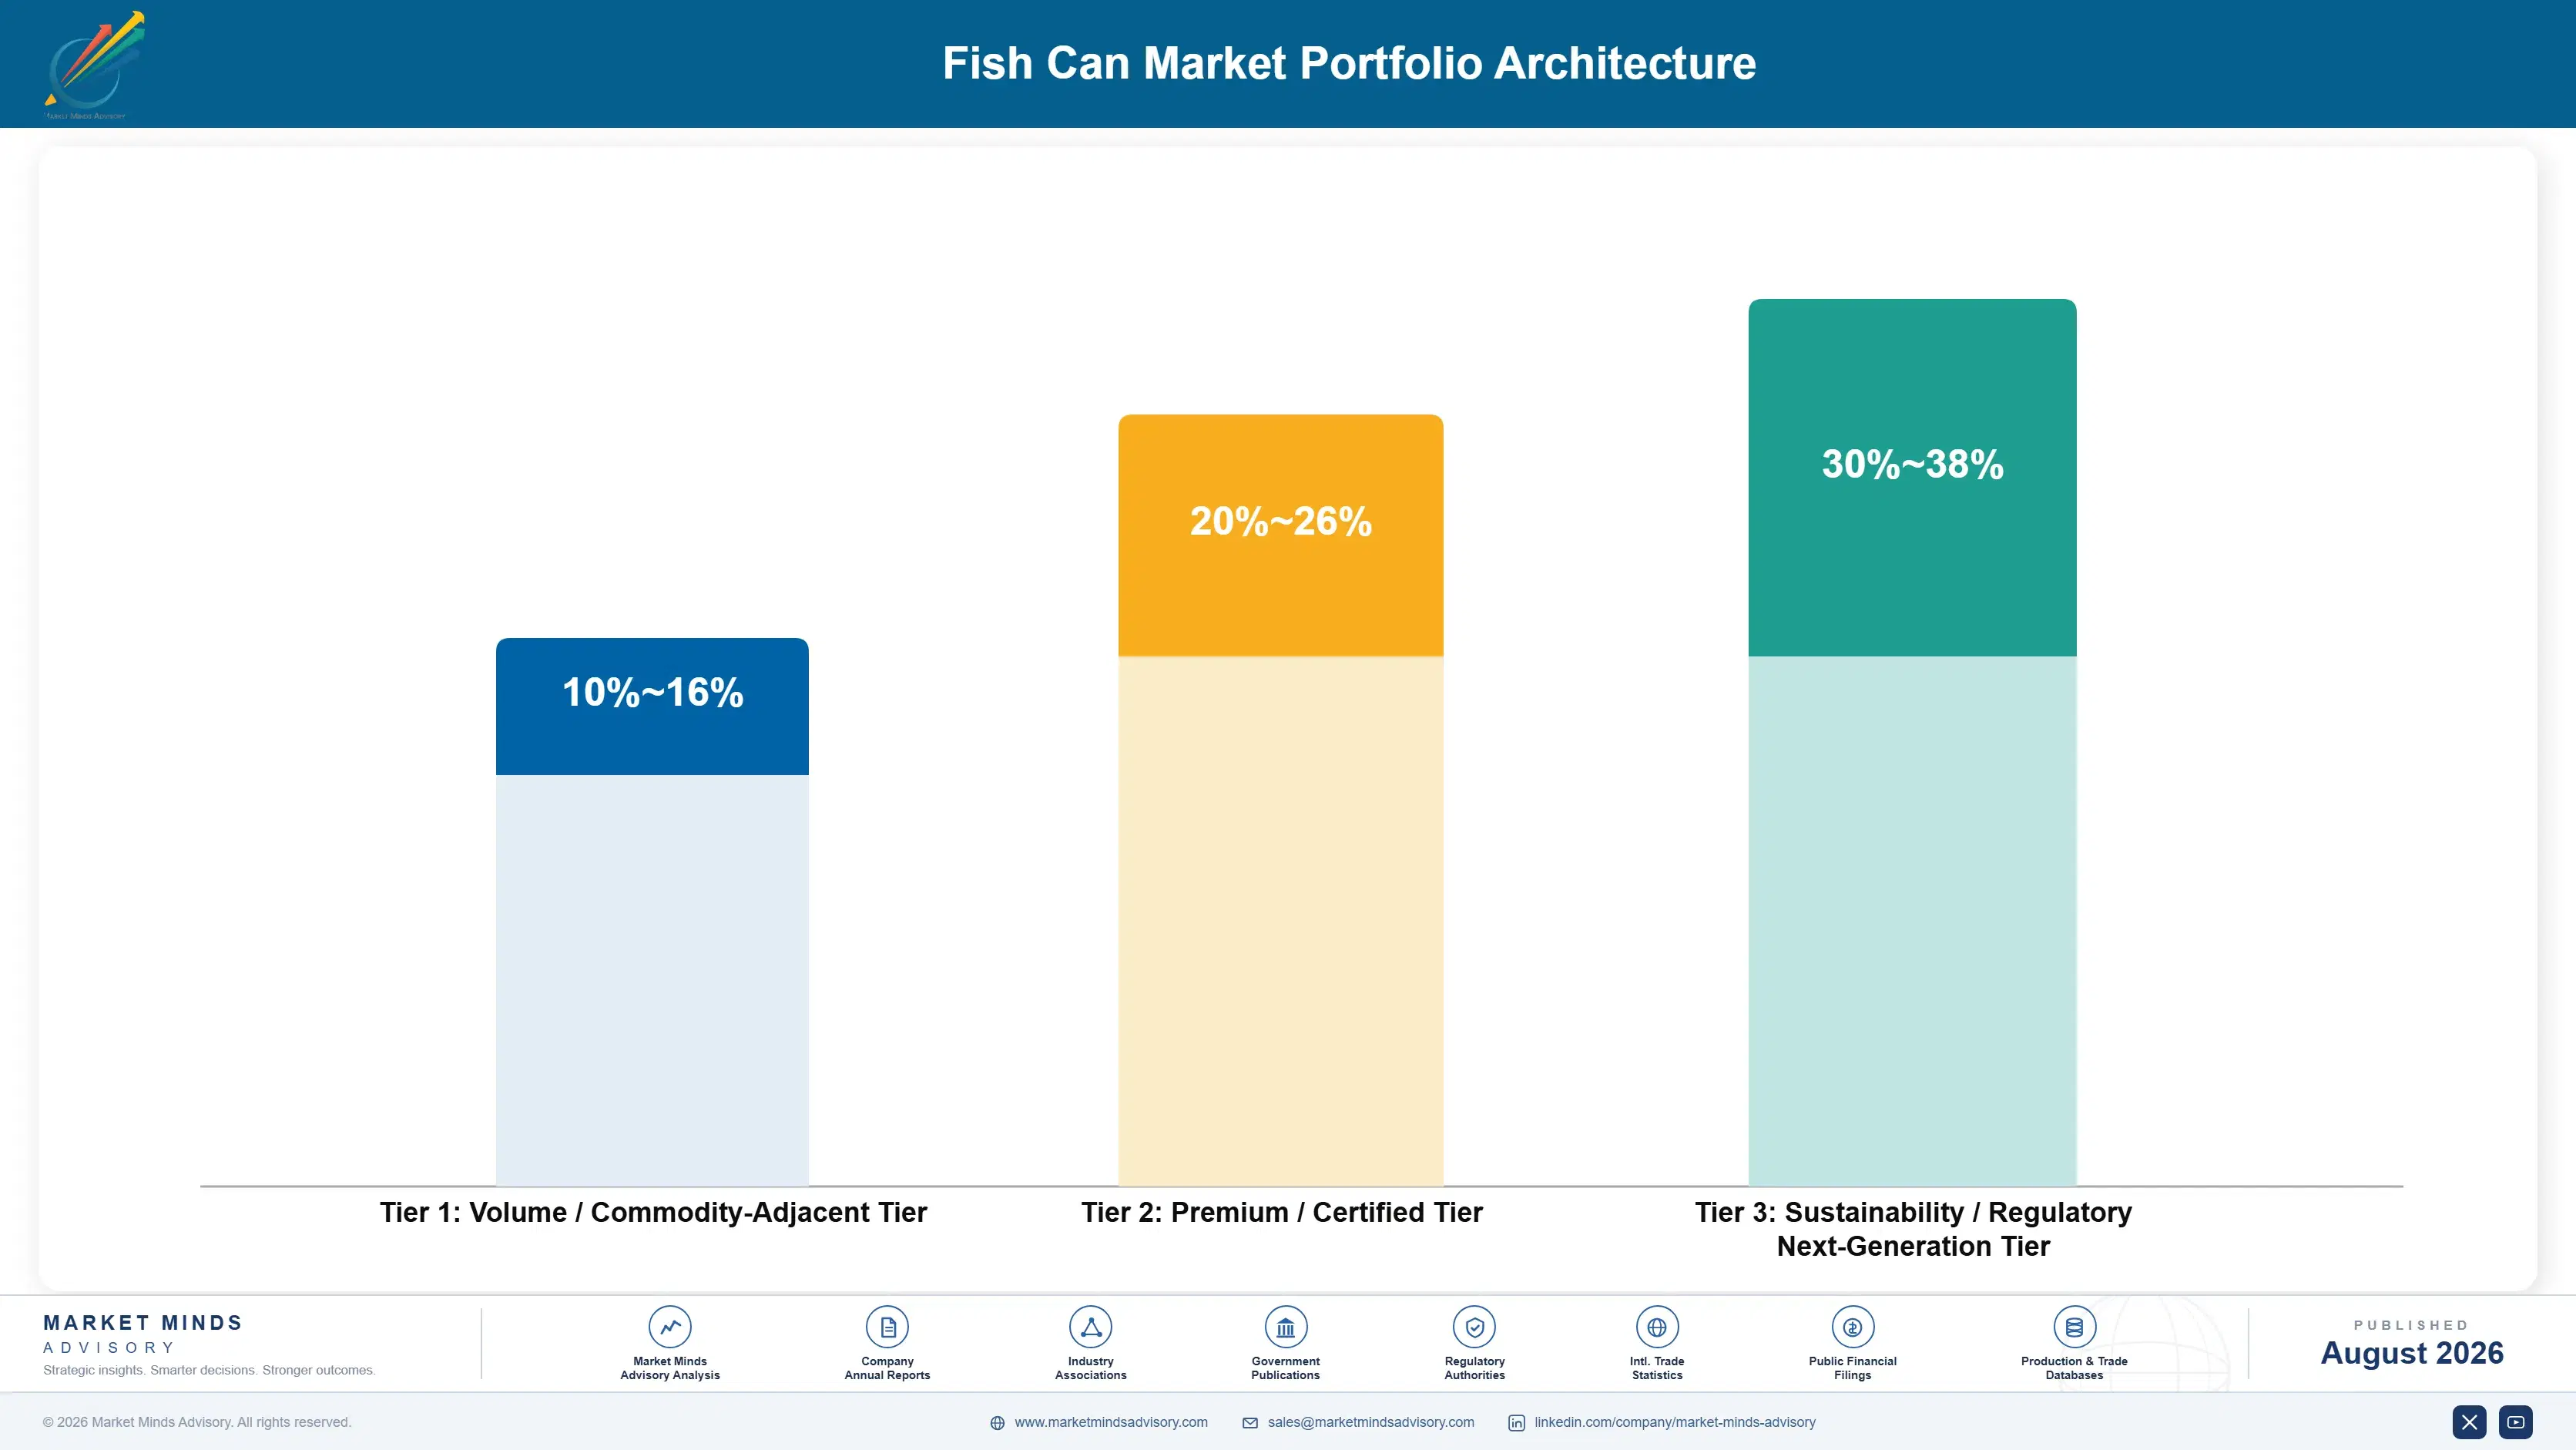
The market splits into three tiers running from commodity export tuna cans to premium salmon and specialty systems bundled with sustainability certification and branded retail partnerships. Margin concentrates heavily at the top: premium systems paired with lining compliance and specialty printing earn gross margins 18 to 26 percentage points above commodity export products, reflecting both regulatory investment and branded retail pricing power across the full commercial lifecycle.
Volume and premium tiers pull manufacturers in different strategic directions simultaneously across the industry today. Regional Asian manufacturers are pushing aggressively into standard export tuna categories, compressing margin in segments where established multinational manufacturers historically earned steady returns, forcing incumbents to defend premium salmon and BPA-free lined segments more aggressively through compliance and distribution differentiation rather than pricing alone.

High value margin pools concentrate among manufacturers serving branded processors through combined lining compliance, specialty printing, and long-term supply relationships, since these accounts generate recurring revenue across multiple product categories and expanding retail shelf presence simultaneously, far exceeding the value of a single export transaction and remaining the primary target of every major supplier's account strategy and growth planning today.

Volume / Commodity-Adjacent Tier

Standard commodity export tuna cans sold primarily into price sensitive Asian and Latin American export markets, competing on price against a fragmented regional manufacturer base offering comparable products, with thin margins persisting.
Gross Margin: 10-16%

Premium / Certified Tier

BPA-free lined cans and sardine or mackerel categories sold with regulatory documentation into branded retail and export markets, capturing better margin through demonstrated compliance credentials and broadening retail shelf presence.
Gross Margin: 20-26%

Sustainability / Regulatory / Next-Generation Tier

Premium salmon and specialty fish cans sold with sustainability certification and branded retail partnerships, commanding the highest margin as premiumization becomes a baseline competitive requirement across expanding North American and European retail markets.
Gross Margin: 30-38%
fish-can-market-portfolio-architecture-1787298082657

High-value Sub-segments and Strategic Watch-out

Premium Salmon Cans With Retail Partnerships

Premium salmon can systems generating recurring revenue through multi year branded retail partnership relationships, growing fastest as premiumization makes sustainability certification and specialty printing a contractual condition for shelf placement across multiple retail chains, distribution programs, and rapidly expanding North American and European grocery categories worldwide today.
Gross Margin: 30-38%

Pet Food Fish Can Manufacturing Programs

Pet food fish can supply tied to expanding premium wet pet food demand, expanding steadily as pet ownership grows and requires increasingly sophisticated can specifications tailored to each manufacturer's specific product formulation and packaging requirements across multiple concurrent regional programs and expanding retail distribution networks worldwide.
Gross Margin: 22-28%

Standard Commodity Export Tuna Cans

The largest unit volume segment, serving export processors globally that need proven standard cans without the highest tier's full compliance and specialty printing cost, forming the steady revenue backbone of most manufacturers' order books across mature and emerging export markets alike worldwide and across many distribution channels.
Gross Margin: 10-16%

Tinplate Steel Supply Facing Persistent Volatility

Constrained specialized tinplate steel and coating manufacturing capacity facing sustained demand growth from expanding BPA-free lining conversion, a segment strategic watchers should track closely as material cost volatility intensifies production cost faster than some manufacturers' capacity expansion plans currently anticipate or have adequately prepared for.
Gross Margin: 18-24%

From Commodity Sale to Processor Partnership

Fish can demand is shifting from a transactional commodity sale toward an ongoing processor partnership as lining compliance, specialty printing, and multi year supply agreements increasingly extend a supplier's commercial relationship across a processor's evolving product portfolio rather than a single export order, particularly among suppliers that have successfully bundled compliance and design capability into their core offering rather than selling standard cans entirely alone.
Adoption depth varies sharply by end-use vertical. Branded processors navigating retail sustainability requirements and lining compliance engage most deeply with premium supplier partnerships, given the direct brand and regulatory consequences of can selection at their retail scale. Export-oriented bulk processors adopt more transactionally, often purchasing whatever can meets minimum specification at the lowest delivered cost rather than committing to the deeper vendor relationships that characterize branded retail accounts nationwide.

A generational shift in buyer profile is underway as sustainability officers and packaging engineers, increasingly focused on lining compliance and recyclability data, join traditional procurement staff in institutional decisions, a change reshaping which supplier capabilities actually win processor contracts across facilities of all sizes and export relationships nationwide and increasingly beyond.
fish-can-market-end-use-penetration-index-1787298083184

Where Fish Can Suppliers Focus Next

These are among the four positions where our research anticipates prominent divergence between winners and laggards over the coming forecast period. Each is grounded in the demand model, the regulatory perimeter, and the announced capacity pipeline.
01 / LINING COMPLIANCE INVESTMENT

Build BPA-free lining capability before mandates outpace supply

Expanding BPA-free lining mandates across major retail and export markets are driving substantial demand for compliant can systems that legacy manufacturers cannot supply without dedicated conversion investment, converting this capability from a specialized niche into an increasingly central procurement requirement across processor contracts. Suppliers still concentrated in legacy lining risk losing processor contracts to compliant competitors already established in this fast growing segment. Moving now, ahead of the point where compliant lining becomes table stakes, allows suppliers to capture premium positioning before competition intensifies meaningfully further.
02 / PREMIUM SALMON PARTNERSHIP STRATEGY

Build salmon processor relationships ahead of premiumization expansion

Branded processors increasingly seek suppliers capable of flexible manufacturing and specialty printing for premium salmon categories that commodity can sellers cannot supply without dedicated investment, creating genuine differentiation opportunity for suppliers willing to build specialty production capability across multiple retail and reimbursement channels. Suppliers building dedicated premium partnerships now are positioned to capture disproportionate share of branded shelf space as premiumization continues expanding across major retail markets. Waiting until premium capability becomes a universal expectation risks ceding this differentiation opportunity to competitors already investing in specialty manufacturing.
03 / SOUTHEAST ASIAN MANUFACTURING EXPANSION

Build Thailand capacity ahead of export volume growth

Thailand's tuna canning export industry continues scaling as global seafood trade volume grows, creating substantial near term demand for regionally manufactured cans tied to this export growth across the country's major processing hubs and expanding secondary manufacturing centers. Suppliers building dedicated regional manufacturing capacity now are positioned to capture disproportionate share as regional export demand accelerates over the coming several years. Waiting until regional demand growth peaks to build this capacity risks ceding early mover advantage to competitors already embedded in ongoing processor relationships and export contracts.
04 / LONG-TERM SUPPLY CONTRACT DEVELOPMENT

Pursue branded supply agreements ahead of consolidation cycles

Branded seafood processors continue consolidating procurement decisions across North America and Western Europe as retailers seek predictable, multi year can supply volume that standalone export sales rarely match at comparable scale or consistency across most private label markets. Suppliers investing in long-term supply relationships and compliance documentation are positioned to capture disproportionate share of this durable, contract backed demand pool. This relationship investment requires meaningful upfront cost, but the alternative is continued reliance on less predictable spot market sales cycles and volumes.

Engagement Snapshot From the Field

A live engagement with an industry participant carrying material or product regulatory and market exposure ahead of a defining policy shift, showing how our research translates into a defensible multi-year portfolio strategy.
MARKET MINDS ADVISORY · CLIENT ENGAGEMENT SUMMARY
Fish Can Producer Strategic Portfolio Review and Transition Roadmap 2026·Investment Scenario on Fish Can Exposure Evaluation 2025-26
CLIENT PROFILE
The client is a mid-sized branded seafood processor operating three canning facilities and generating roughly 310 million dollars in annual revenue (client-reported, unverified by MMA) across its tuna and salmon product lines. The processor had historically sourced cans from four regional suppliers without a standardized BPA-free lining specification, and leadership was evaluating whether consolidating procurement under fewer compliant vendors would reduce cost and regulatory risk.
STRATEGIC CHALLENGE
Management needed to decide whether consolidating can procurement under fewer BPA-free compliant vendors justified transitioning away from established regional supplier relationships, given genuine uncertainty about whether fewer vendors could match existing pricing while also meeting the processor's tightening retail sustainability compliance requirements across all three canning facilities and product lines.
MMA APPROACH
MMA benchmarked five BPA-free lining vendors against the processor's current supplier pricing and compliance documentation, modeled projected procurement cost under consolidated volume contracts across all three canning facilities, and assessed each vendor's regional manufacturing proximity against the processor's facility locations, delivery timeline requirements, and existing overall capital budget constraints and priorities.
KEY FINDINGS
  1. Consolidated volume pricing under two vendor contracts showed a projected 11 to 16% procurement cost reduction across all three facilities and product lines.
  2. Compliance documentation gaps under the prior four vendor model represented meaningful retail sustainability audit risk across several product lines currently in active distribution.
  3. The selected vendors' BPA-free lining portfolios met all applicable European Union and California compliance requirements without requiring any additional costly product substitution.
  4. Staff training requirements were manageable within existing procurement operations, though a dedicated compliance coordinator role was recommended going forward to sustain the program.
CLIENT PROFILE
The client is a mid-sized branded seafood processor operating three canning facilities and generating roughly 310 million dollars in annual revenue (client-reported, unverified by MMA) across its tuna and salmon product lines. The processor had historically sourced cans from four regional suppliers without a standardized BPA-free lining specification, and leadership was evaluating whether consolidating procurement under fewer compliant vendors would reduce cost and regulatory risk.
STRATEGIC CHALLENGE
Management needed to decide whether consolidating can procurement under fewer BPA-free compliant vendors justified transitioning away from established regional supplier relationships, given genuine uncertainty about whether fewer vendors could match existing pricing while also meeting the processor's tightening retail sustainability compliance requirements across all three canning facilities and product lines.
MMA APPROACH
MMA benchmarked five BPA-free lining vendors against the processor's current supplier pricing and compliance documentation, modeled projected procurement cost under consolidated volume contracts across all three canning facilities, and assessed each vendor's regional manufacturing proximity against the processor's facility locations, delivery timeline requirements, and existing overall capital budget constraints and priorities.
KEY FINDINGS
  1. Consolidated volume pricing under two vendor contracts showed a projected 11 to 16% procurement cost reduction across all three facilities and product lines.
  2. Compliance documentation gaps under the prior four vendor model represented meaningful retail sustainability audit risk across several product lines currently in active distribution.
  3. The selected vendors' BPA-free lining portfolios met all applicable European Union and California compliance requirements without requiring any additional costly product substitution.
  4. Staff training requirements were manageable within existing procurement operations, though a dedicated compliance coordinator role was recommended going forward to sustain the program.
RECOMMENDED STRATEGY
Phase 1: Phase 1 (Months 1 to 3): Select the two consolidated vendors and finalize facility wide procurement contract terms and pricing. Phase 2: Phase 2 (Months 4 to 8): Transition all three facilities to the standardized BPA-free lined can portfolio and train staff. Phase 3: Phase 3 (Months 9 to 14): Complete compliance audit documentation and establish the ongoing compliance coordinator role permanently across facilities.
OUTCOME
The processor completed procurement consolidation across all three facilities within eleven months, ahead of the original fourteen month projection (client-reported, unverified by MMA). Procurement cost declined meaningfully following contract consolidation, and the processor passed its subsequent retail sustainability compliance audit without any lining related findings.

Frequently Asked Questions

Foundational context covering the market sizes, CAGR, scope, country, region and competition that inform every finding below. This section is provided to cover basics and most often pre-purchase conversations, answered from the MMA Primary Research Dataset.

What is the current size of the Fish Can Market?

The global fish can market was valued at approximately $4.2 billion in 2025. Growth is being driven by Thailand's tuna export industry and premium salmon demand.

How large will the Fish Can Market be by 2036?

The market is projected to reach approximately $7.81 billion by 2036, up from $4.44 billion in 2026. This represents nearly double the market size over the ten-year forecast window.

What is the CAGR for the Fish Can Market 2026 to 2036?

The market is forecast to grow at a CAGR of 5.8% between 2026 and 2036. Bull and bear scenarios range from roughly 4.5% to 7.0%.

Which segment is growing fastest?

Salmon cans are the fastest-growing segment, expanding at approximately 8.2% annually as retail premiumization accelerates across major markets. This is roughly 1.41 times the overall market growth rate.

Who are the major companies in the Fish Can Market?

Leading companies in this space include Crown Holdings, Silgan Holdings, Ardagh Group, Toyo Seikan, and CANPACK. Together these five hold roughly 48% of global market share.

Which country is growing fastest?

Thailand is currently the fastest-growing single country, reflecting its world-leading tuna canning export industry and scale. Expanding Southeast Asian processing capacity is accelerating this growth further.

Report Segmentation Architecture

The full report scope spans multiple orthogonal segmentation dimensions, with cross-tabulated demand data provided for each dimension pair. Coverage extends further to regional breakdowns, trend trajectories, and the competitive detail needed to support segment-level decision-making.

By Fish Product Application

  • Tuna Cans
  • Sardine and Small Pelagic Fish Cans
  • Salmon Cans
  • Mackerel and Herring Cans
  • Anchovy and Specialty Fish Cans
  • Pet Food (Fish-Based) Cans

By End-Use Industry

  • Branded Retail Seafood Processors
  • Export-Oriented Bulk Canners
  • Private Label Retail Suppliers
  • Pet Food Manufacturers

By Commercial Dimension

  • Standard Export Volume Contracts
  • Branded Retail Supply Agreements
  • BPA-Free Compliance Partnerships
  • Long-Term Processor Supply Contracts

By Region

  • North America
  • Western Europe
  • East Asia
  • South Asia and Pacific
  • Latin America
  • Middle East and Africa
  • Eastern Europe

Scope, Methodology, and Coverage

Every figure in this report is reproducible from documented input assumptions. The scope below maps the historical period, the forecast horizon, the segmentation dimensions, and the countries covered, alongside the underlying primary and qualitative methodology.
Historical Period
2020 to 2025
Forecast Period
2026 to 2036
Base Year
2025 (USD billions; MMA Primary Research Dataset, August 2026)
Market Definition
The fish can market covers rigid metal, primarily tinplate steel and aluminum, can packaging manufactured for canned fish and seafood products including tuna, sardines, salmon, mackerel, and pet food applications, sold to seafood processors and canners. It excludes flexible pouch and retort packaging, glass jars, and cans manufactured for non-seafood food and beverage applications.
Quantitative Units
USD billions (current prices); unit volume where disclosed
Segmentation Dimensions
By Fish Product Application; By End-Use Industry; By Commercial Dimension; By Region
Regions Covered
North America, Western Europe, East Asia, South Asia and Pacific, Latin America, Middle East and Africa, Eastern Europe
Countries Covered
USA, Canada, Mexico, Spain, France, UK, Sweden, China, Japan, South Korea, Thailand, India, Vietnam, Indonesia, Australia, Ecuador, Peru, Colombia, Morocco, South Africa, Saudi Arabia, UAE, Nigeria, Turkey, Poland, Russia, Netherlands, Italy, Germany, Portugal, and additional markets relevant to this sector
Key Companies Profiled
Crown Holdings Inc, Silgan Holdings Inc, Ardagh Group S.A., Toyo Seikan Group Holdings Ltd, CANPACK Group, CPMC Holdings Limited, Kingcan Holdings Limited, Nampak Ltd, Massilly Group, Trivium Packaging B.V., Ball Metalpack LLC, ORG Packaging (Guangdong) Co Ltd, Baosteel Packaging Co Ltd, Envases Universales de Mexico S.A. de C.V., HUBER Packaging Group GmbH, Colep Packaging S.A., American Canning LLC, Nussbaum Matzingen AG, DS Containers Inc, Hindustan Tin Works Limited
Quantitative Methodology
Primary survey, n=3,800 respondents, Q4 2025, six countries; demand-side model with trade association cross-validation
Qualitative Methodology
47 expert interviews, Q4 2025; applied to validate demand model assumptions, identify emerging dynamics, and assess competitive positioning
Report Format
PDF and XLSX data workbook (Word format preview document)
Publisher
Market Minds Advisory
Report Code
MMA-2026-PAC-341
Published
August 2026
Contact
sales@marketmindsadvisory.com | www.marketmindsadvisory.com

Purchase the full Fish Can Market Report (2026 to 2036).

The full report provides a comprehensive assessment of the global fish can market, including detailed segmentation by fish product application, end-use industry, and commercial dimension across all seven world regions. It profiles twenty leading and emerging can manufacturers, benchmarking BPA-free lining capability, premium salmon partnerships, and Southeast Asian manufacturing presence. The analysis includes ten-year forecasts through 2036 under base, bull, and bear scenarios, alongside primary research findings drawn from MMA's survey of 3,800 respondents and 47 expert interviews conducted in the fourth quarter of 2025. A dedicated input cost section examines tinplate steel exposure across major manufacturing markets.
Detailed segment-level ten-year forecasts through 2036
Profiles of twenty leading and emerging can manufacturers
Regional analysis spanning all seven world regions
Input cost and supply chain risk assessment
Competitive benchmarking on moats and vulnerabilities
Primary survey and expert interview data appendix

Built For The People Who Decide

From boardroom strategy to bench-side execution, this report is read cover-to-cover by leaders shaping the next decade of their industry, turning demand scenarios, market dynamics and valuation benchmarks into decisions.
CXOs/ Presidents/ VPs/ Managers
M&A and Corporate Development
Strategy Teams and R&D Heads
Procurement and Product Directors
Regulatory and Compliance Leaders
Investor Relations and Equity Analysts