Market Minds Advisory
Firearm Lubricants Market

Firearm Lubricants Market: Round Count Economics, Solvent Reformulation, and Shelf Space Nobody Gives Back

Demand follows rounds fired rather than firearms sold, which means ammunition pricing governs this market far more directly than any political cycle or retail sales figure ever manages to do on its own.

Lead Analyst

Bilal Shaikh

Published

September 2026

Make Smarter Decisions with Customized Research Insights

Request a free sample report and evaluate market opportunities, growth trends, and competitive dynamics relevant to your business needs.

2025 MARKET VALUE$0.9BMarket Size 2025
2036 FORECAST VALUE$1.5BBase Case , 2026 to 2036
CAGR 2026 TO 20364.8 %Bull 6.0% / Bear 3.6%
INCREMENTAL OPPORTUNITY$0.6BNet 10- year value creation
EXPANSION MULTIPLE1.60x2036 value over 2026 base
Strategic Levers
M&A Pipeline
Regional Outlook
Country Rankings
Competitive Intelligence
Segmental Deep-dive
Call-Us : 91 93563 13602

Executive Snapshot and Market Trajectory

Everybody in this business watches firearm sales figures and the wrong number is being watched. Maintenance chemistry gets consumed when somebody shoots, and what governs that is the price of ammunition rather than how many rifles left the shop last quarter. The gap between the two is large.
Commercial advantage sits with brands holding retail shelf space and military specification approval, because neither can be bought quickly and both survive the price comparison that ruins everything else here. Dry film and PTFE-based lubricants grow fastest at 8.4%, roughly 1.75 times the market. North America holds 52% of value, far above the standard band, because American civilian ownership has no comparable equivalent anywhere else.
Concentration runs at roughly 42% for the top five, held by brand recognition and distribution rather than by chemistry anybody could not replicate. Around 58% of consumer volume moves through physical retail, where facings are genuinely scarce. Emission rules are forcing reformulation at roughly 340,000 dollars per product for compliance work. Single-product brands cannot spread that across a portfolio, and several have simply discontinued rather than fund any of the testing at all.
Market Definition
The market comprises chemistry formulated for firearm maintenance and supplied to consumer, commercial, and defence users, covering cleaning solvents and bore cleaners, lubricating oils, greases and heavy lubricants, combination cleaner-lubricant-protectant products, dry film and PTFE-based lubricants, and corrosion inhibitors for long-term storage. Value is measured at manufacturer level. Firearms and ammunition, cleaning tools, brushes and patches sold separately, gun safes and storage cabinets, industrial and automotive lubricants, and general-purpose household penetrating oils fall outside scope.
Base Year Value
$0.9B in 2025 (MMA Primary Research Dataset, August 2026)
Forecast Period
2026 to 2036, eleven discrete annual values
CAGR
4.8% base case. Bull 6.0%. Bear 3.6%.
Fastest Growth Segment
Dry Film and PTFE-Based Lubricants: 8.4% CAGR
Fastest Growth Country
Philippines: 7.6% CAGR
Fastest Growth Region
South Asia and Pacific: 6.8% CAGR
Largest Region
North America: 52% of 2025 global value
Market Leaders
Vista Outdoor, Safariland Group, Otis Technology, Lucas Oil Products, and WD-40 Company lead on firearm maintenance chemistry revenue. Source: company annual reports and MMA Analysis, July 2026.
Primary Survey
n=3,800 procurement and R&D decision-makers, Q4 2025, six countries
Methodology
Demand-side build-up, cross-validated against public data, 47 expert interviews

Firearm Lubricants Market Forecast Scenarios

firearm-lubricants-market-trend-size-forecast-scenario-1787551349097
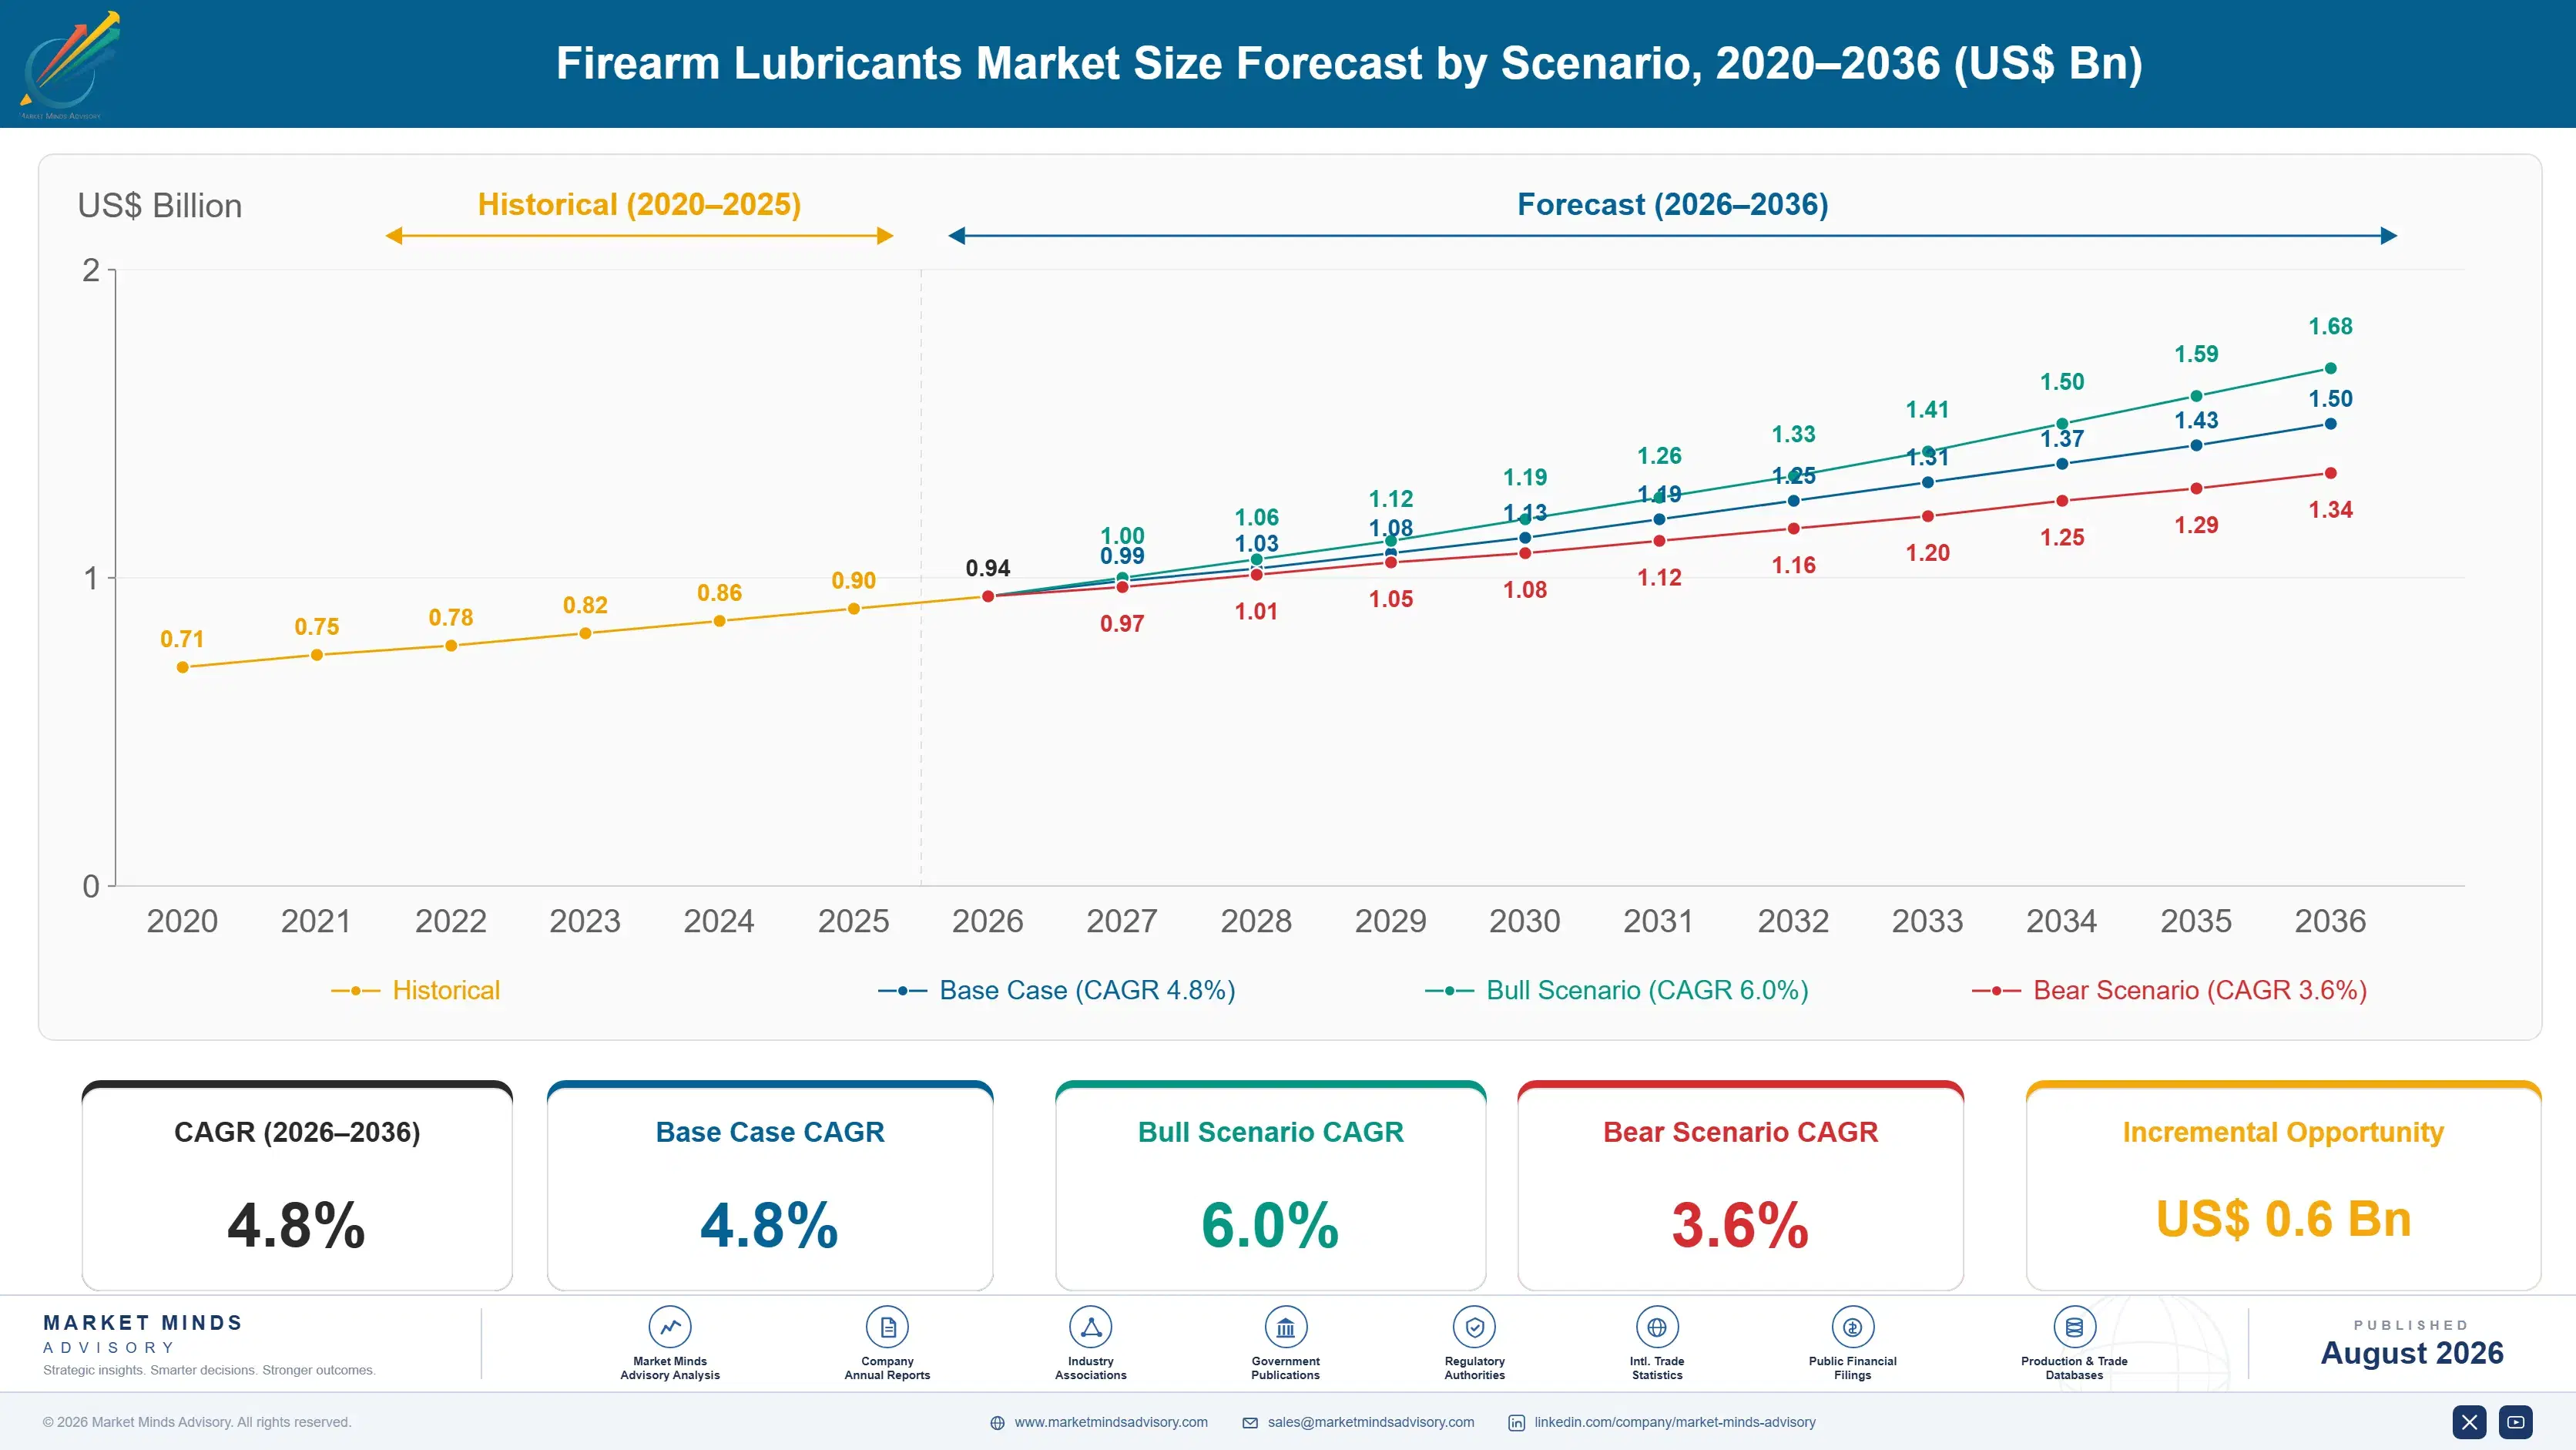
Between 2020 and 2025 the private installed base expanded considerably while shooting volume moved differently. Ammunition shortages and price increases through the early part of the period cut range time sharply, and chemistry consumption fell with it even as ownership rose. The two curves separated in a way that surprised everybody. The 4.0% historical rate reflects base growth offset by reduced consumption per owner.
The 4.8% base case rests on three mechanisms. Ammunition supply and pricing have normalised, which restores round count and the consumption that follows it. Suppressor ownership continues expanding in markets where regulation permits it, and suppressed firearms run hotter and dirtier, requiring different chemistry more often. And a large installed base is ageing into long-term storage where corrosion protection rather than lubrication is what owners buy. None of the three depends on firearm sales volumes.
The 6.0% bull case assumes ammunition pricing stays affordable while shooting sports participation grows across newer markets. The 3.6% bear case reflects ammunition cost rising again and cutting range time, reformulation costs under tightening emission rules squeezing smaller brands, and retail consolidation reducing the shelf facings that carry most consumer discovery. Ammunition pricing sits under both cases as the governing variable.

Consumption Follows Rounds, Not Rifles

The demand mechanism here is frequently misread. A firearm bought and stored consumes almost nothing beyond an occasional wipe of corrosion protectant. A firearm taken to a range every fortnight consumes solvent, lubricant, and patches steadily. So the number that matters is rounds fired, and the variable that governs rounds fired is what a box of ammunition costs that month. That distinction governs almost every planning error in this industry.
TOP-FIVE CONCENTRATION42%Combined share of maintenance chemistry sales held by leading brands
AVERAGE RETAIL PRICE POINTUSD 11.40Typical shelf price for a consumer bottle unit
ANNUAL CONSUMPTION PER OWNERUSD 26Average yearly maintenance chemistry spend by an individual owner
MILITARY SPECIFICATION SHARE19%Portion of volume supplied against defence and law enforcement specifications
RETAIL CHANNEL SHARE58%Portion of consumer volume sold through physical retail outlets
REFORMULATION COMPLIANCE COSTUSD 340,000Typical spend to bring one product within emission limits
Distribution decides most competitive outcomes. Around 58% of consumer volume moves through physical retail, where a brand either holds a facing or does not exist for the majority of buyers who never research a purchase at all. Those facings turn over slowly and retailers consolidate them rather than expanding. Online channels reward reputation and review volume, which is a different asset built over years.
Military and law enforcement supply is a separate business inside the same factory. Defence specification approval takes years, restricts formulation, and delivers volume at 19% of the market against contracts that renew predictably. Brands holding those approvals rarely lose them, which makes the qualification cost a barrier rather than a hurdle for anybody arriving later. Nobody arriving later gets to skip that queue.
"Manufacturers plan production off firearm sales data and then wonder why the forecast missed. The gun goes in a safe. The consumption happens at the range, and when ammunition doubled in price, the range emptied out while the sales charts kept climbing."
Practice Director, Specialty Lubricants and Consumer Chemistry · MMA Specialty Lubricants and Maintenance Chemistry Practice · August 2026

Market Trends

Suppressor Adoption Changes What Chemistry Gets Bought

Suppressed firearms run considerably hotter and return far more fouling into the action than unsuppressed ones, which shortens maintenance intervals and shifts demand toward high-temperature and dry film products that resist carbon build-up. Ownership has expanded steadily in jurisdictions permitting it, and each suppressor effectively increases the maintenance chemistry a firearm consumes. Dry film and PTFE-based products grow at 8.4%, fastest here. Manufacturers who formulated for conventional operating temperatures are finding those products perform poorly under this duty. Manufacturers who never tested at suppressed operating temperatures are learning this from customer complaints rather than from laboratory work.
Market Impact: North America holds 52% of value
Emission Rules Force Solvent Reformulation Across Portfolios

Volatile organic compound limits in California and across European member states have restricted the solvent chemistry that bore cleaners traditionally relied on, and chlorinated compounds face further restriction. Reformulation to water-based or low-emission systems costs roughly 340,000 dollars per product in development, testing, and registration. Larger manufacturers absorb that across a portfolio while single-product brands frequently cannot. The rules are also spreading beyond their original jurisdictions, which makes compliance a portfolio question rather than a regional one. Several smaller brands have discontinued affected products rather than fund the work at all.
Market Impact: Storage protectants grow at 6.2%

Market Opportunities and Growth Drivers

American Civilian Ownership Anchors Global Consumption

Private firearm ownership in the United States exceeds the rest of the world combined by a wide margin, and the shooting sports culture around it generates consumption per owner near 26 dollars annually that no other market approaches. That single fact puts 52% of global value in North America, far outside the standard regional band, and nothing in the forecast period changes it. Retail infrastructure, competitive shooting participation, and hunting seasons all reinforce a consumption pattern built over generations. No policy change under discussion alters that arithmetic within the forecast period.
Market Impact: Consumption falls 30% in shortages

Ageing Installed Base Shifts Demand Toward Storage Protection

A large share of privately owned firearms are fired rarely or never, and those owners buy corrosion inhibitors and long-term storage protectants rather than bore solvent or high-temperature lubricant. Humid climates make that requirement genuinely serious rather than optional. The corrosion protection segment grows at 6.2% against a market rate of 4.8%, and it is far less exposed to ammunition pricing than anything driven by round count. Manufacturers weighted entirely toward active shooting consumption miss it. Vapour phase inhibitors, wax coatings, and treated storage materials all compete for a buyer who visits a range perhaps twice a year.
Market Impact: Retail carries 58% of consumer volume

Market Restraints and Challenges

Ammunition Pricing Governs Consumption Volume Directly

When a box of ammunition doubles in price, range attendance falls and maintenance chemistry consumption falls immediately behind it, regardless of how many firearms have been sold. The root cause is that this is a consumable attached to an activity rather than to an asset. Manufacturers mitigate by building corrosion protection and storage products that serve owners who are not shooting, by selling into military and law enforcement volume that follows training budgets instead, and by pricing to hold shelf position through downturns. None of that reconnects consumption to the ownership figures manufacturers keep watching.
Market Impact: Dry film products grow at 8.4%

Retail Shelf Consolidation Squeezes Smaller Brands Out

Around 58% of consumer volume moves through physical retail and large chains are reducing rather than expanding the facings allocated to maintenance chemistry, which favours brands already holding position. The root cause is category management economics: a slow-turning eleven-dollar bottle competes for space against faster-moving goods. Smaller brands mitigate through direct online sales, through range and club channels retailers do not reach, and by targeting specialised applications where buyers search deliberately rather than browsing a shelf. Recovering a lost facing takes several planogram cycles and evidence the brand usually has no way of producing after the fact.
Market Impact: Reformulation costs USD 340,000 each
3 additional market trends, 4 additional growth drivers, and 2 additional restraints and challenges are covered in the full report. Contact sales@marketmindsadvisory.com to access the complete intelligence.

Segment CAGR and Growth Architecture

Segmentation follows product function, because each function answers a different maintenance problem, carries a distinct regulatory position under emission rules, and reaches a different buyer within the same ownership base. Six functions cover commercial supply, and the divide between products consumed by shooting and products bought for storage matters far more than any difference in base chemistry.
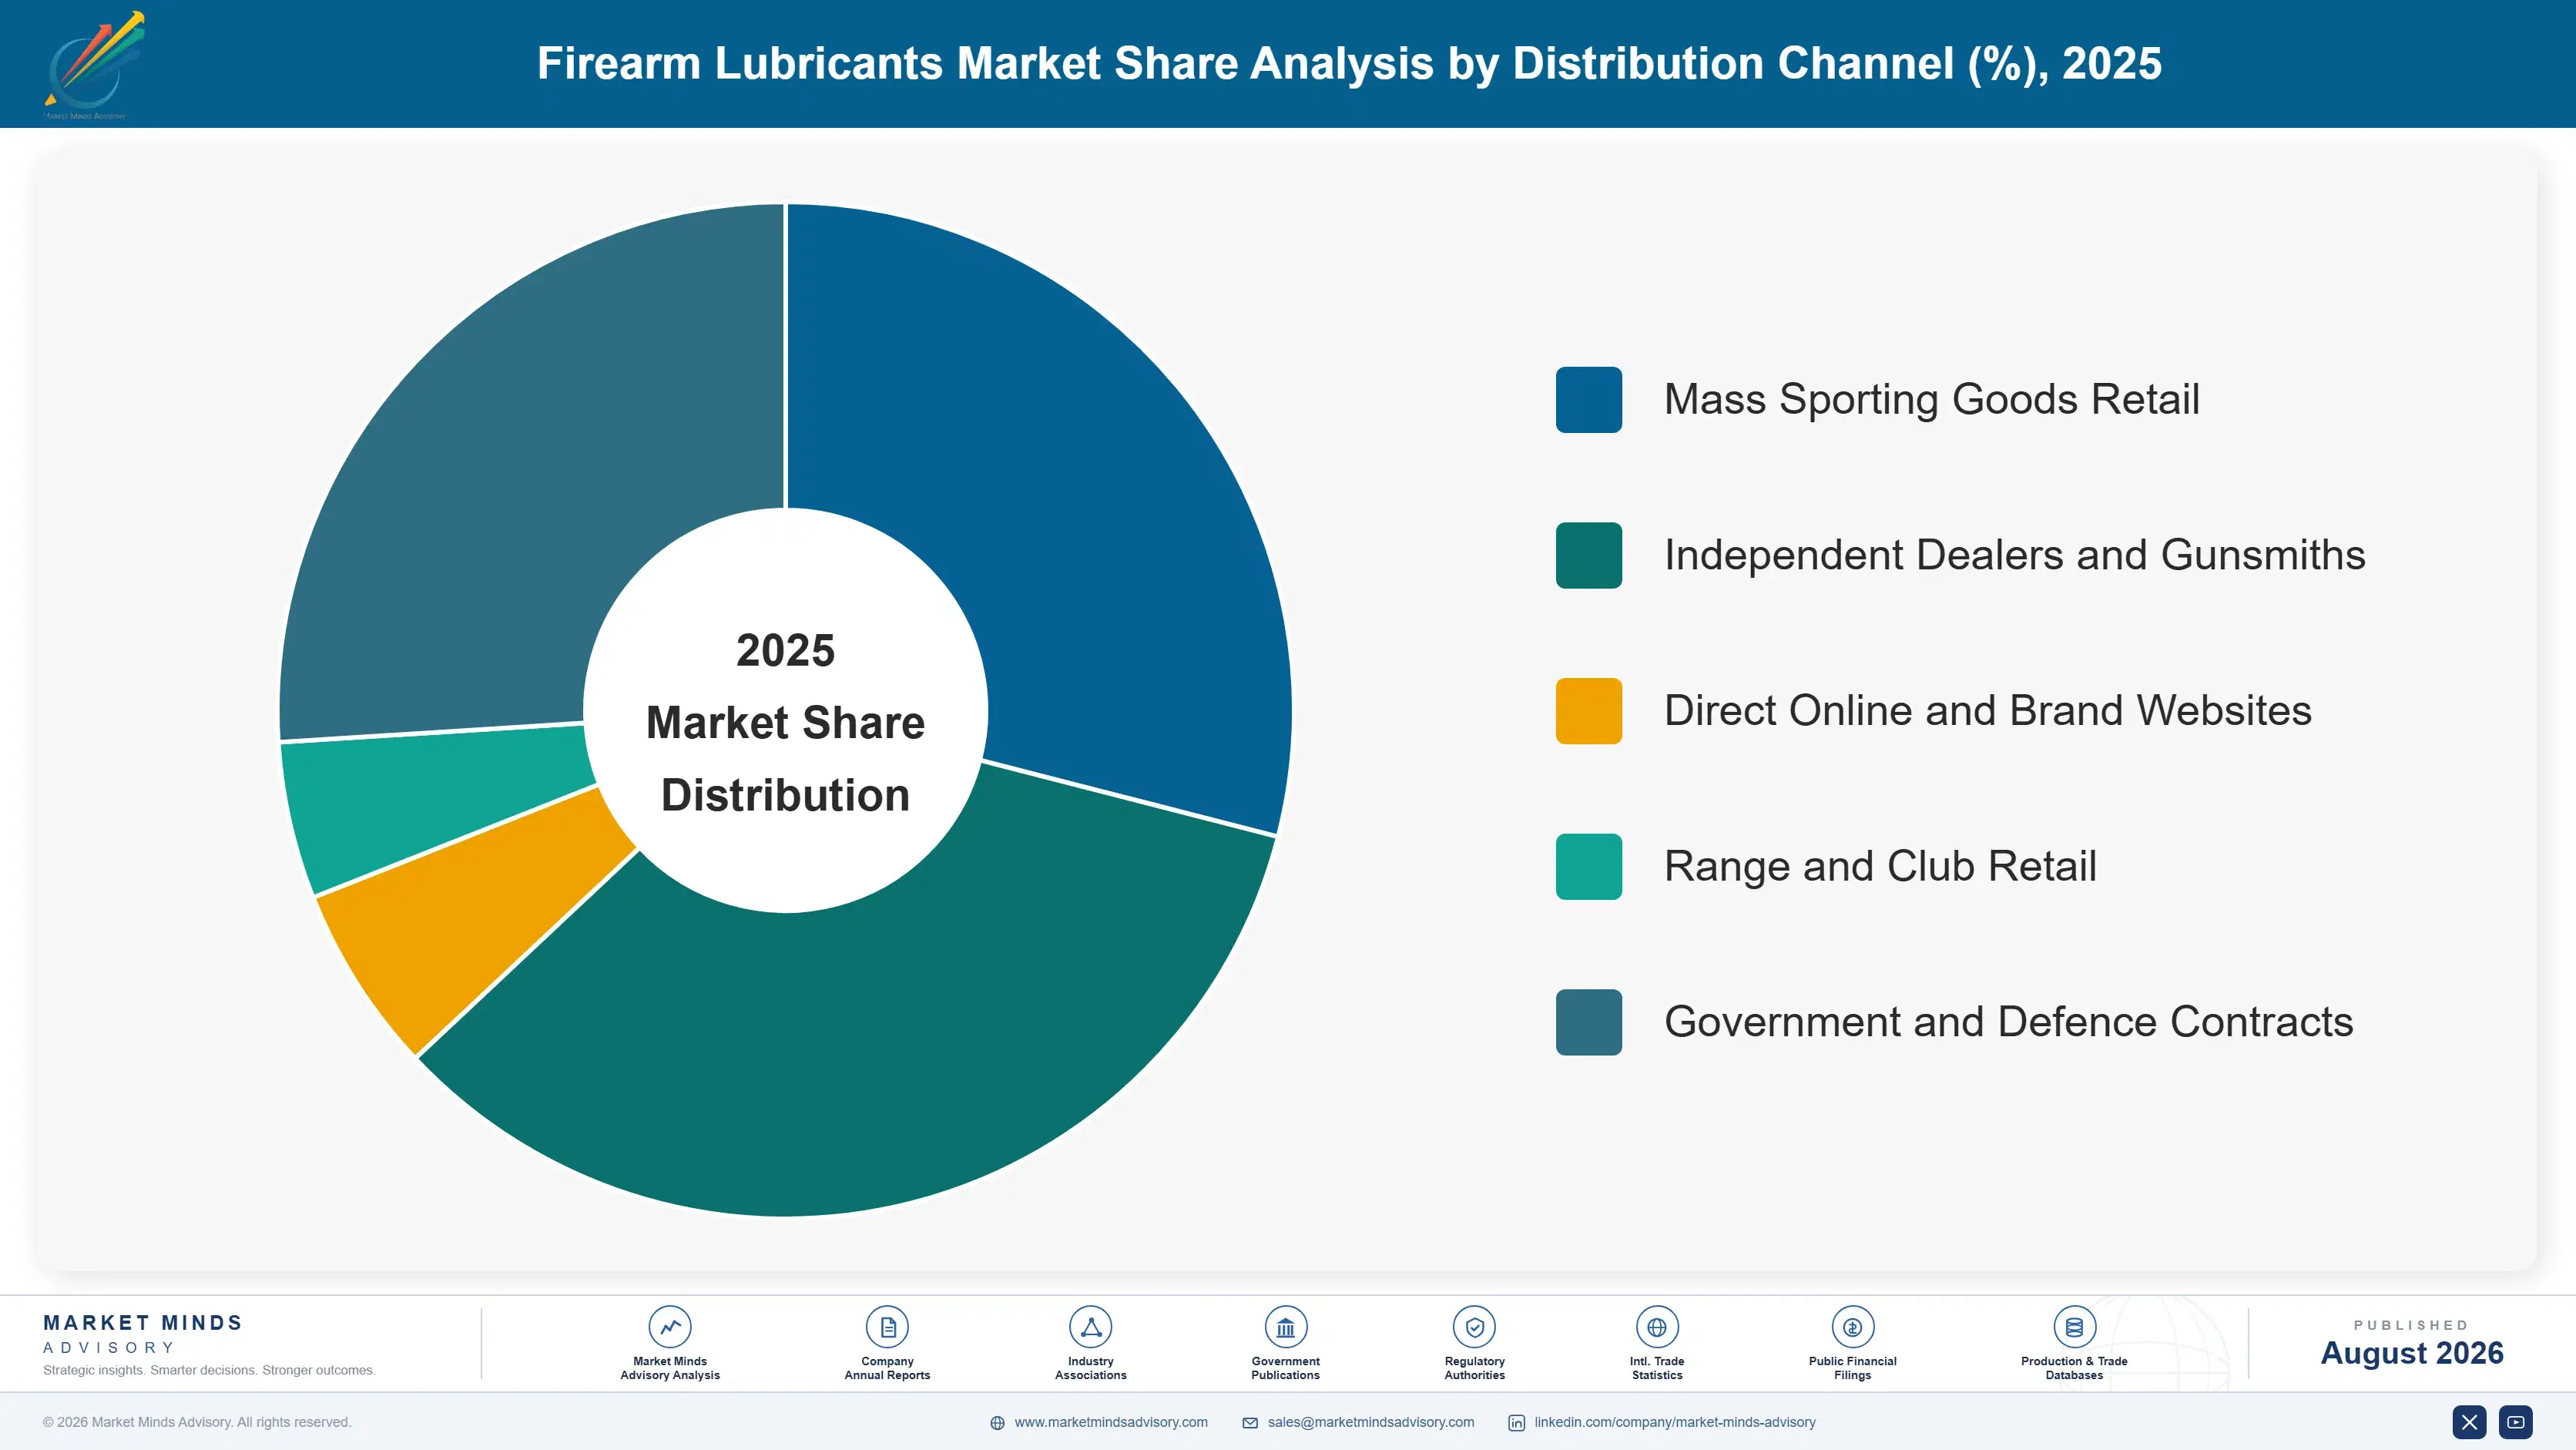
firearm-lubricants-market-trend-market-share-analysis-1787551349628

Dry Film and PTFE-Based Lubricants

The fastest function at 8.4%, roughly 1.75 times the market, driven by suppressor adoption and by users operating in dusty or sandy conditions where wet lubricant attracts fouling. Dry films leave a bonded coating rather than a liquid layer, which resists carbon build-up at the higher temperatures suppressed firearms generate. Application is less forgiving than oil, requiring surface preparation and cure time that some users get wrong. Pricing sits well above conventional lubricating oil and the products consume slowly, so revenue per owner grows less than the segment rate alone suggests. Suppressor ownership regulation varies enormously between jurisdictions, which makes this the segment whose growth depends most directly on policy rather than on any product development.
CAGR 8.4%

Corrosion Inhibitors and Storage Protectants

Second fastest at 6.2%, and almost entirely disconnected from how much anybody actually shoots, which makes it the steadiest demand in this market. A large share of privately held firearms are fired rarely, and their owners still need protection against humidity, salt air, and long storage in conditions that promote surface rust. Vapour phase inhibitors, wax-based coatings, and treated storage materials all compete here. Humid coastal and tropical markets buy disproportionately. Products consume slowly, but the buyer base is far larger than the active shooting population anywhere. Manufacturers treating this as an afterthought frequently discover it is the highest-margin line they sell and the only one that held through the last ammunition shortage.
CAGR 6.2%
Full segment breakdown across 6 segments available in the complete report.

Regional Architecture and Country Demand Map

Regional shares follow civilian firearm ownership and shooting participation rather than population or economic size, and the resulting distribution is extremely lopsided. Three regions sit outside the standard bands for a single reason stated in the paragraphs below. The imbalance is worth stating plainly rather than smoothing over.

North America

At 52% this sits far above the standard band, because private firearm ownership in the United States exceeds the rest of the world combined and the standard range was drawn for markets where that is not true. Consumption per owner near 26 dollars annually reflects a shooting sports culture with competitive disciplines, hunting seasons, and range infrastructure at a density found nowhere else. Vista Outdoor, Safariland, Otis, and Lucas Oil hold the retail shelf positions that carry most consumer discovery. Growth of 4.6% tracks ammunition affordability and range participation rather than firearm sales figures. Reformulation under state emission rules has already removed several long-established solvent products from the market entirely.
Share: 52% | CAGR: 4.6% (2026 to 2036)

Western Europe

At 14% this sits below the standard band, because civilian ownership is restricted to licensed hunters and sport shooters across most member states, which is a small fraction of the American base. Consumption per owner is nonetheless high, since licensed shooters are typically active participants rather than occasional owners. Ballistol, Brunox, and Napier hold strong regional brand positions with long heritage. Emission regulation is tightest here and has already forced reformulation across several product lines. Growth of 3.4% is the slowest anywhere, limited by a licensed base that expands very slowly. Distribution runs through specialist dealers and hunting suppliers rather than general retail, which changes how a brand builds visibility here entirely.
Share: 14% | CAGR: 3.4% (2026 to 2036)
Regional intelligence for 5 additional markets available in the complete report: East Asia, South Asia and Pacific, Latin America, Middle East and Africa, Eastern Europe. Contact sales@marketmindsadvisory.com.
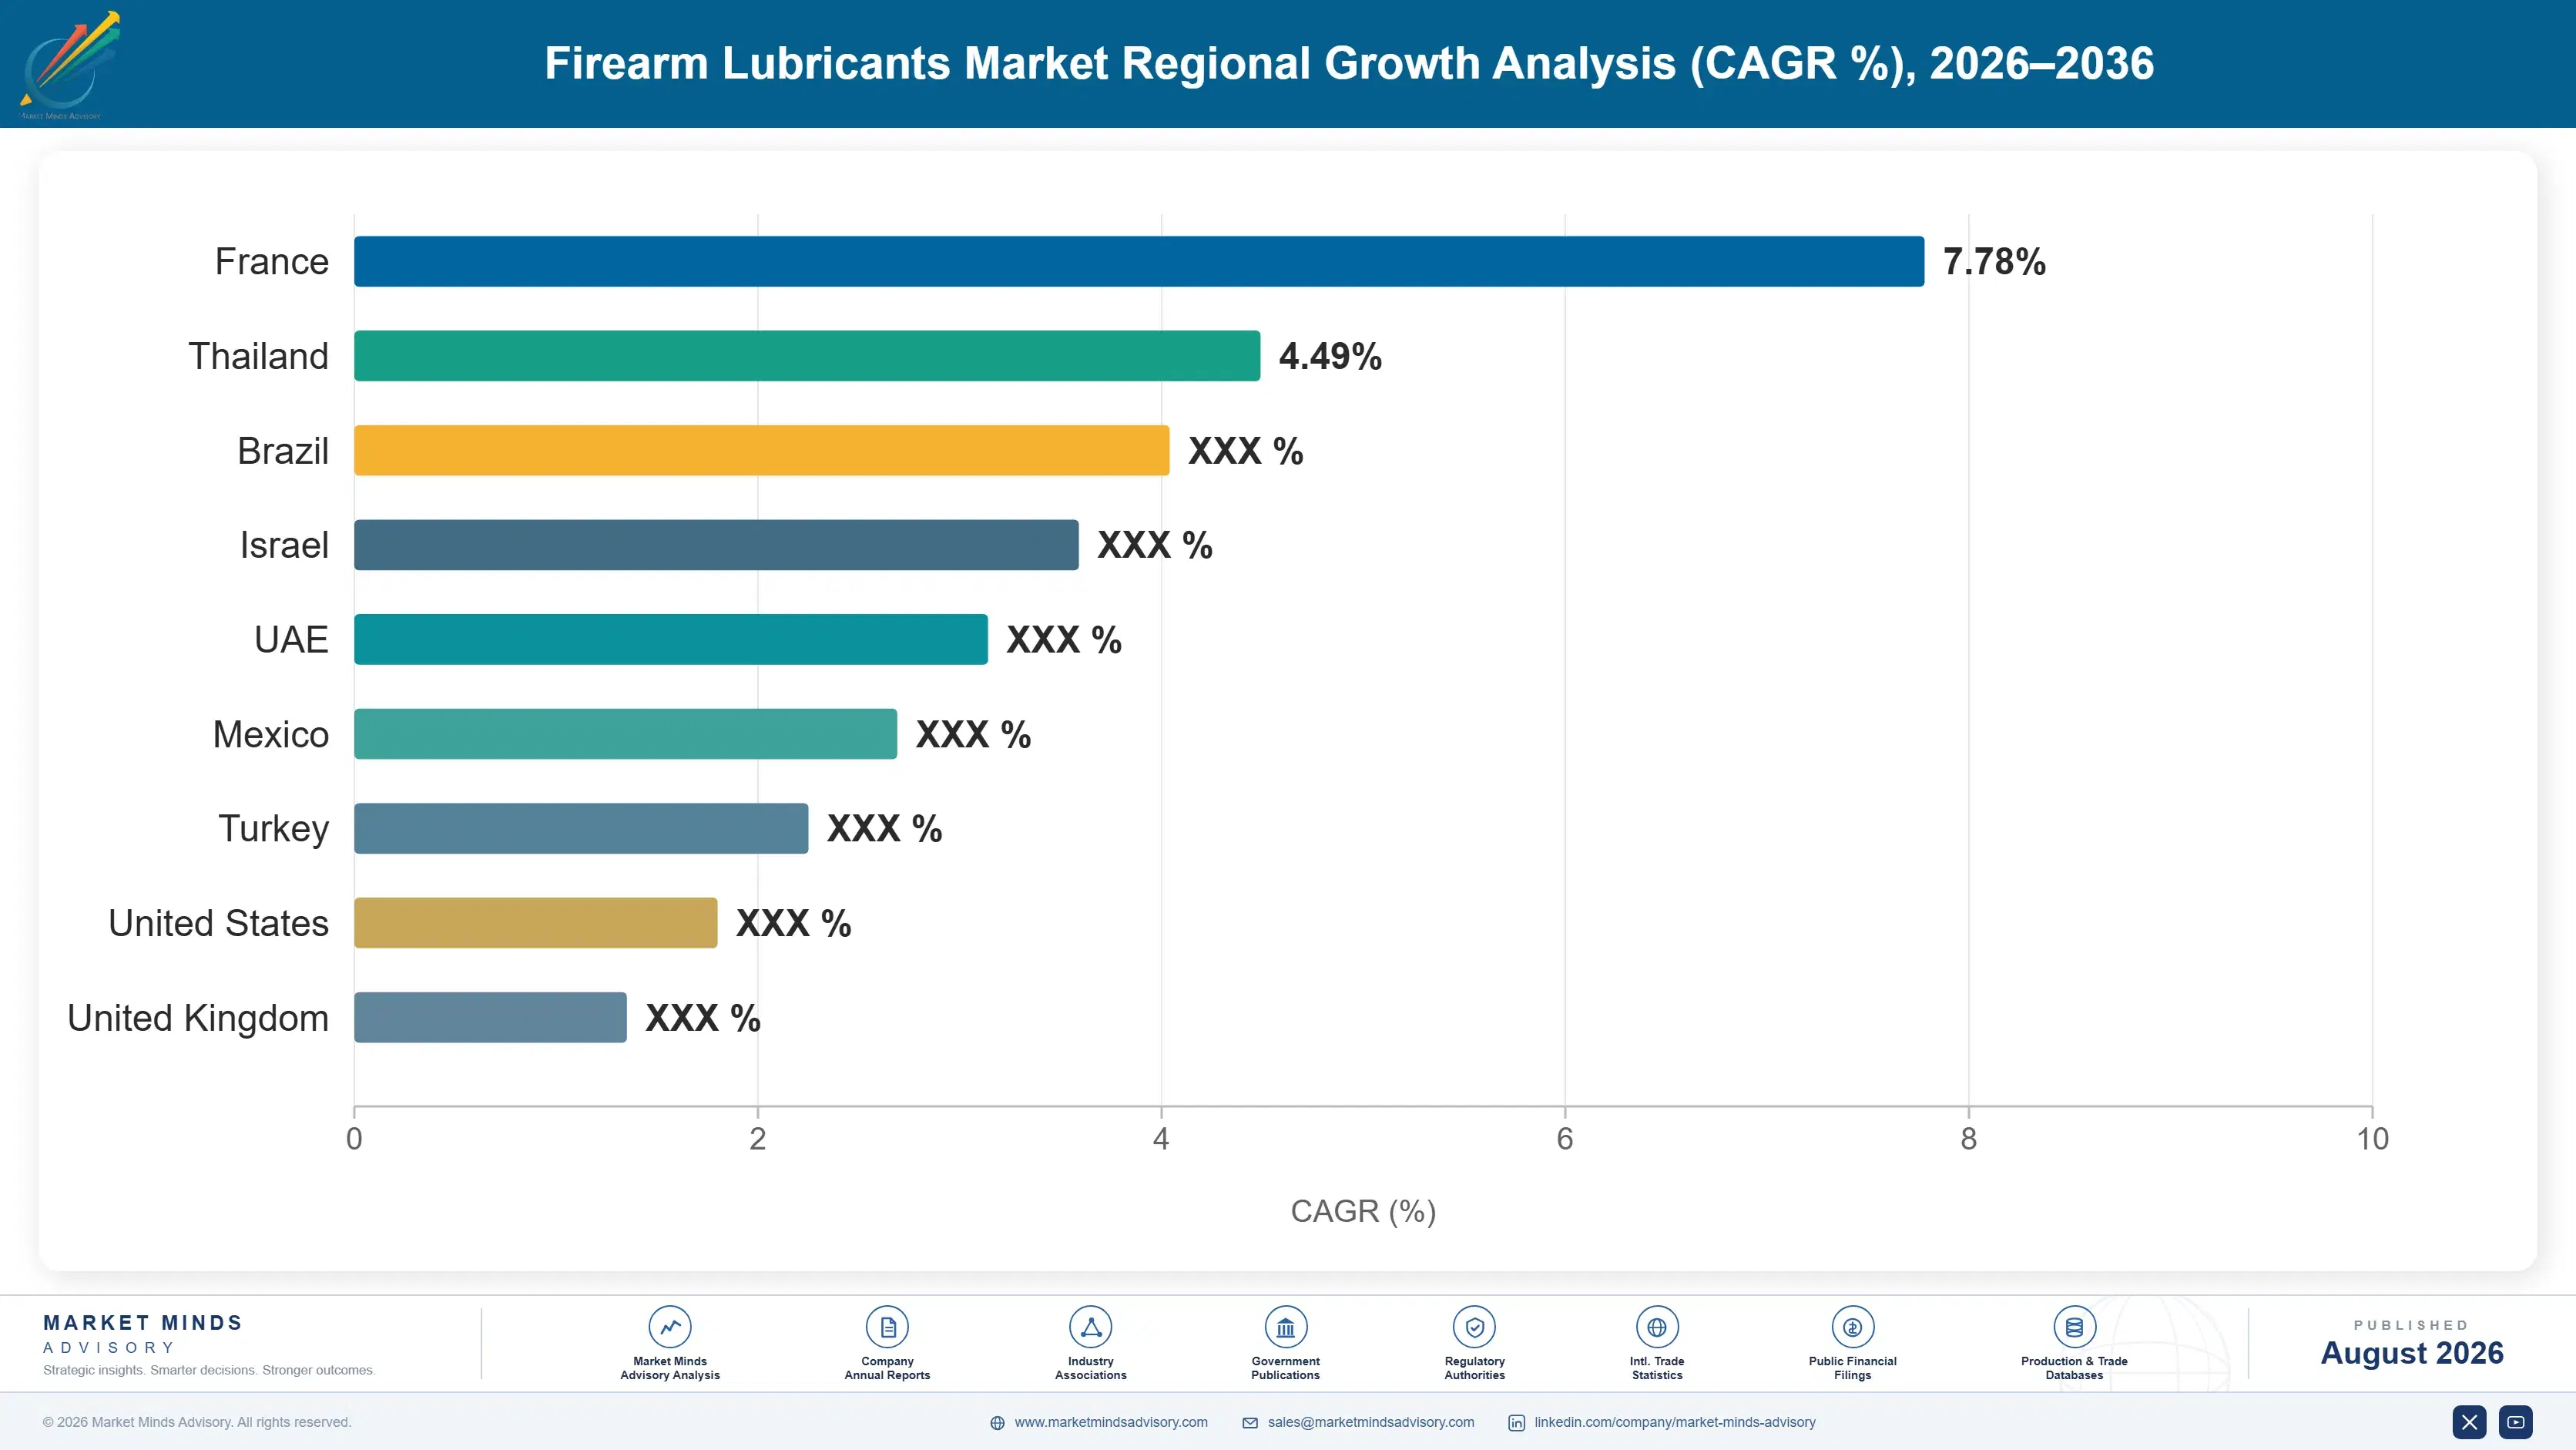
firearm-lubricants-market-trend-country-cagr-analysis-1787551350142

Four Moves Worth Real Capital

Advantage here comes from shelf position, specification approval, and products that sell to owners who are not currently shooting anything. Four moves justify capital across the forecast period, and the first addresses a demand misreading that costs manufacturers accuracy in every planning cycle. Each one addresses a different way this particular market is routinely misread.

Forecast against round count, not firearm sales

Maintenance chemistry is consumed by shooting rather than by ownership, and consumption fell roughly 30% during the last ammunition shortage while firearm sales figures climbed throughout. Manufacturers planning production from sales data build inventory into a demand trough and then run short when range attendance recovers. Ammunition pricing, range utilisation, and competition entry numbers all predict consumption far better. The data exists and very few companies in this market are actually using any of it. Range operators publish utilisation figures and competition bodies publish entry counts, and both are considerably better leading indicators than anything the retail channel reports.
Market Impact: Consumption swings a full 30% on ammunition pricing

Defend retail facings before growing online

Around 58% of consumer volume moves through physical retail, and large chains are consolidating rather than expanding the space allocated to an eleven-dollar bottle that turns over slowly. A brand losing a facing loses the majority of buyers who never research a purchase. Category management support, planogram data, and turn performance are what retain space, and they matter more than any product improvement. Online growth is worth pursuing and it does not replace a facing that has been surrendered. Recovering a surrendered facing takes several planogram cycles and evidence the brand generally cannot produce once it has already gone.
Market Impact: Protects the 58% of volume moving through retail

Build corrosion protection for owners who never shoot

A large share of privately held firearms are fired rarely, and those owners still buy protection against humidity, salt air, and long storage. The segment grows at 6.2% and is almost entirely insulated from the ammunition pricing that swings everything else. Humid coastal and tropical markets buy disproportionately. Manufacturers weighted entirely toward active shooting consumption carry volatility they could have hedged with products serving a buyer base considerably larger than the shooting population. These products consume slowly and repeat reliably, which makes them a poor volume story and a very good margin one for anybody willing to look properly.
Market Impact: Hedges against a 30% swing in shooting consumption

Pursue defence specification approval despite the timeline

Military and law enforcement supply represents 19% of volume against contracts that renew predictably and buyers who rarely change an approved product. Qualification takes years, constrains formulation, and requires testing most consumer brands never contemplate. That cost is precisely what makes the position defensible once held, since later arrivals face the same barrier without the incumbent's performance record. Brands holding approvals lose them very rarely, which turns a slow qualification into a long annuity. Field performance history accumulates during the contract and becomes the record that later challengers have to match before anybody will even evaluate them.
Market Impact: Reaches the entire 19% supplied against defence specifications

Who Controls the Margin Pool

Concentration sits at roughly 42% for the top five on maintenance chemistry revenue, held by brand recognition and retail distribution rather than by formulation anybody could not copy. Vista Outdoor carries heritage consumer brands with the deepest shelf presence. Safariland holds defence specification positions alongside consumer products. Otis is strong in kits and military supply, Lucas Oil brings lubricant category credibility, and WD-40 competes on general brand strength.
Competition runs on three dimensions. Retail shelf position is the first and it decides most consumer outcomes before any product comparison happens. Defence specification approval is the second, protecting 19% of volume behind a qualification barrier measured in years. Reformulation capability is the third, since emission rules are removing the solvent chemistry several older products were built around.

Pressure is building from two directions. Emission compliance at roughly 340,000 dollars per product is squeezing single-product brands that cannot spread the cost. Direct online brands with strong reputation and no retail dependency are taking share from names that assumed shelf position was permanent. Rankings will shift toward manufacturers holding both distribution and reformulated portfolios. Shelf position alone has stopped being sufficient for anybody.
firearm-lubricants-market-trend-company-positioning-matrix-1787551350659

Competitive Moat and Risk Dimensions

VISTA OUTDOOR

Moat: Heritage brands with shelf depth

Consumer brands with generations of recognition occupy retail facings that competitors cannot buy at any price, because category managers allocate space on turn history rather than on product claims. That position determines what most buyers see, since the majority never research a maintenance purchase before making it. Portfolio breadth also spreads reformulation cost that single-product competitors absorb alone.
VISTA OUTDOOR

Risk: Retail channel consolidation exposure

Heavy dependence on physical retail carrying 58% of consumer volume becomes a liability as chains consolidate facings and direct online brands build reputation without needing any shelf at all. Defending space requires category management investment that grows while the category itself turns slowly. A brand built on shelf presence has limited answer to buyers who never enter the store.
OTIS TECHNOLOGY

Moat: Defence specification and kit position

Military and law enforcement qualification takes years and constrains formulation in ways consumer products never face, and Otis holds approvals across multiple programmes with the performance record that renewals depend on. Those contracts represent volume that ammunition pricing does not swing. Kit-based selling also bundles chemistry with tools, which raises transaction value and makes competitor substitution considerably harder.
OTIS TECHNOLOGY

Risk: Defence budget cycle dependency

Concentration in military and law enforcement supply ties volume to training budgets and procurement cycles that move on political timetables rather than commercial ones. Consumer retail presence is thinner than the major heritage brands hold, which limits the offset when defence spending pauses. Winning consumer shelf space from incumbents is expensive and slow for a company organised around institutional supply.

Players Tracked

Prominent Players

Vista Outdoor
Safariland Group
Otis Technology
Lucas Oil Products
WD-40 Company

Other Key Players

Birchwood Casey
Shooter's Choice
Ballistol
Brunox
Slip 2000
Real Avid
Sentry Solutions
Militec
FrogLube
Weapon Shield
Napier of London
Pro-Shot Products
Bore Tech
Hornady
Clenzoil

Recent Developments

FEBRUARY 2025

Manufacturer reformulates bore cleaner for emission compliance

A consumer maintenance brand reformulated its principal bore cleaner to meet volatile organic compound limits now applying across several jurisdictions, absorbing development, testing, and registration costs near the category norm. Two smaller competitors discontinued comparable products rather than fund the same work. Compliance decided the outcome entirely.
Signal: Compliance cost per product is now consolidating the category faster than competitive pressure ever managed to
JUNE 2025

Retail chain reduces maintenance chemistry facings

A large sporting goods chain cut the shelf space allocated to firearm maintenance chemistry in favour of faster-turning categories, removing several regional brands from its planogram entirely. Brands retained had supplied category management data and turn performance evidence during the review. Product merit was never discussed.
Signal: Facings are allocated on turn evidence rather than product merit, and losing one removes most consumer discovery
OCTOBER 2025

Defence contract renewal retains incumbent chemistry supplier

A national defence maintenance contract renewed with its existing chemistry supplier without competitive retender, citing qualification status and field performance history across multiple weapon platforms. Competing products would have required requalification measured in years before any evaluation could begin. No challenger had even attempted the qualification process.
Signal: Specification approval functions as a long annuity, since requalification cost deters challengers far more than pricing ever does

What Fills the Bottle

Base oils and synthetic esters represent roughly 31% of manufacturing cost, sourced from lubricant base stock suppliers across North America, Europe, and Asia. Solvent carriers take a further 18%, and this is the component emission regulation is progressively removing. Additive packages including corrosion inhibitors and friction modifiers absorb 16%. Packaging, principally small bottles, applicators, and aerosol cans, accounts for a surprisingly large 21% of delivered cost.
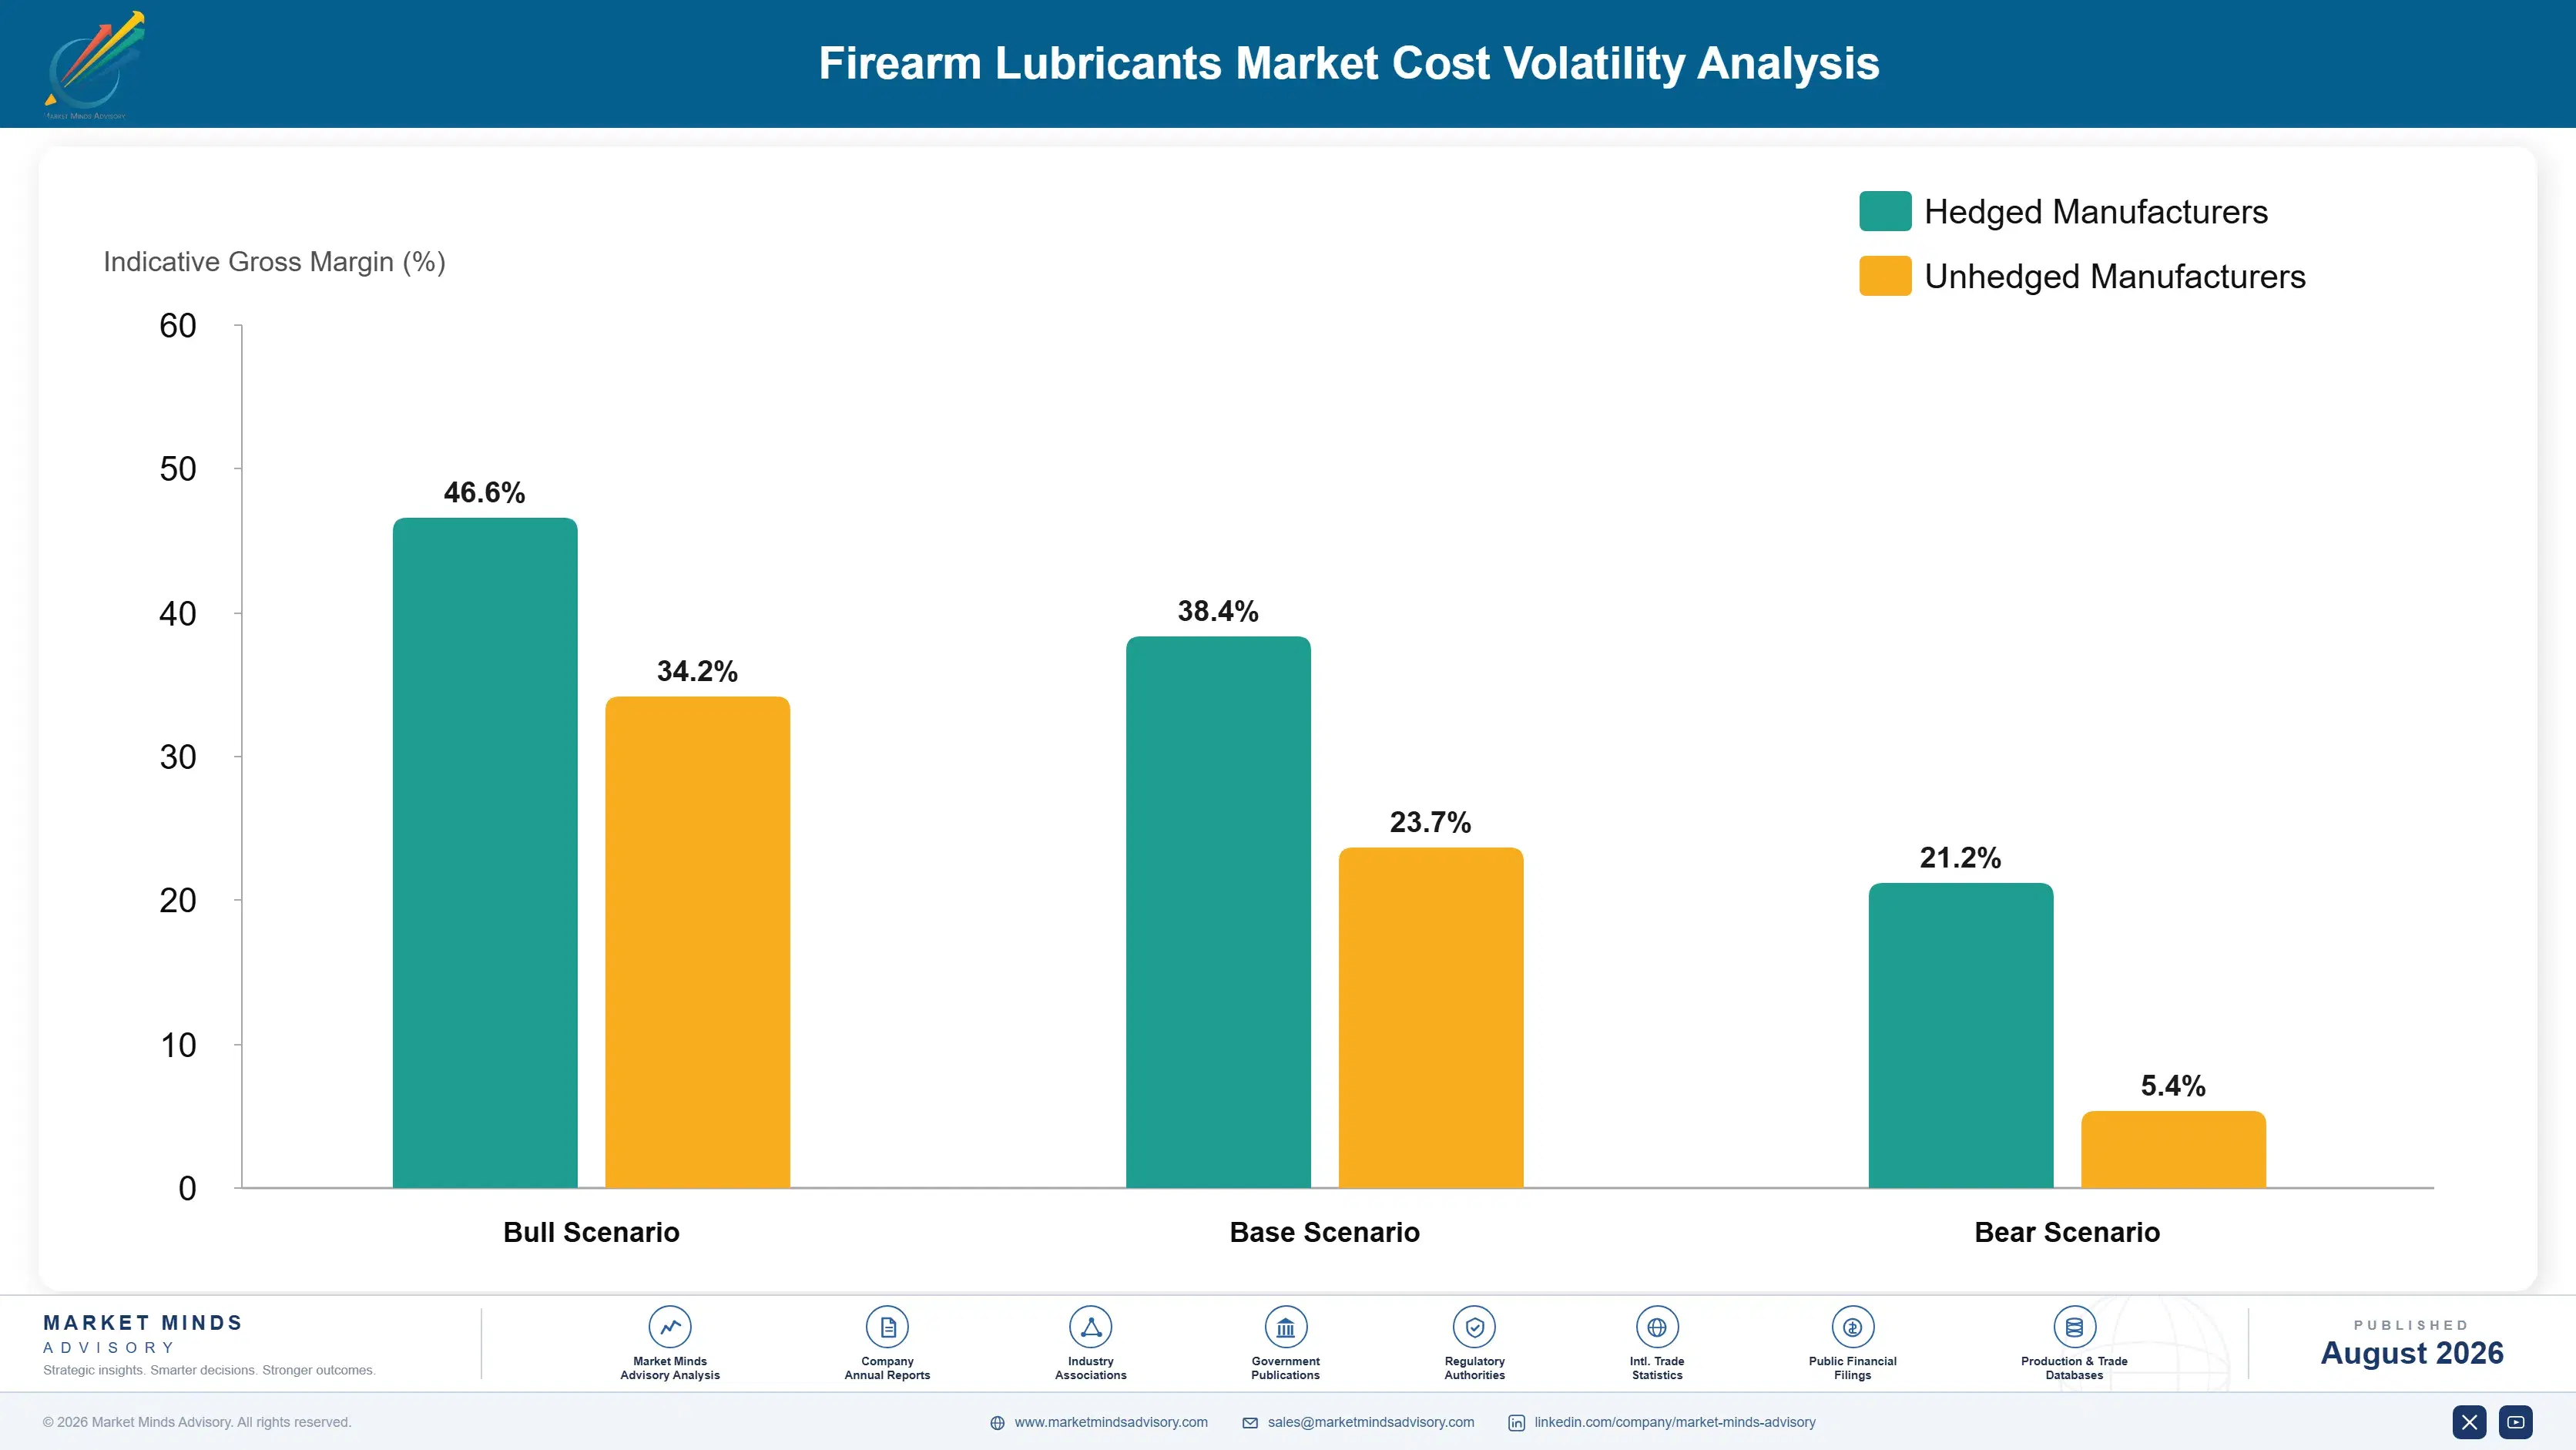
Base oil pricing moved with crude and refinery margins through 2022 and 2023, and manufacturers selling into retail at fixed shelf price points absorbed most of it rather than renegotiating an eleven-dollar item mid-year. WD-40 Company discussed input cost pressure and pricing actions in its reporting for those years. Aerosol propellant and can availability tightened separately, which affected spray-format products considerably more than bottled liquids.

Exposure divides on packaging format and channel rather than on scale. Aerosol products carry propellant, can, and valve costs plus transport restrictions that bottled liquids avoid entirely. Retail-channel products face fixed shelf price points that make input recovery slow and awkward. Direct online sellers reprice freely and carry the smallest exposure of anybody, which is one more advantage a channel shift is quietly handing them.
firearm-lubricants-market-trend-cost-volatility-analysis-1787551350855

Reprice retail products on annual planogram resets

Shelf price points are effectively fixed between category reviews, which leaves manufacturers absorbing input movement for months at a time on an eleven-dollar item. Aligning price adjustments to planogram reset timing recovers cost without triggering a facing review. Manufacturers who attempt mid-cycle increases frequently find the conversation turns into a space discussion instead of a pricing one.

Shift format mix away from aerosol where possible

Propellant, can, and valve costs plus shipping restrictions make aerosol formats materially more expensive to produce and distribute than bottled liquids of equivalent volume. Where the application genuinely needs spray delivery the format is justified, and where it is habit rather than requirement the cost is avoidable. Several products carry aerosol packaging for no functional reason at all.

Spread reformulation cost across a product family

Emission compliance runs near 340,000 dollars per product in development, testing, and registration, which single-product brands cannot absorb and portfolio manufacturers can. Reformulating a shared base chemistry across several products rather than each individually cuts the total considerably. Planning that at family level rather than product level is the difference between affordable compliance and discontinuation.

Portfolio Architecture for Margin Defence

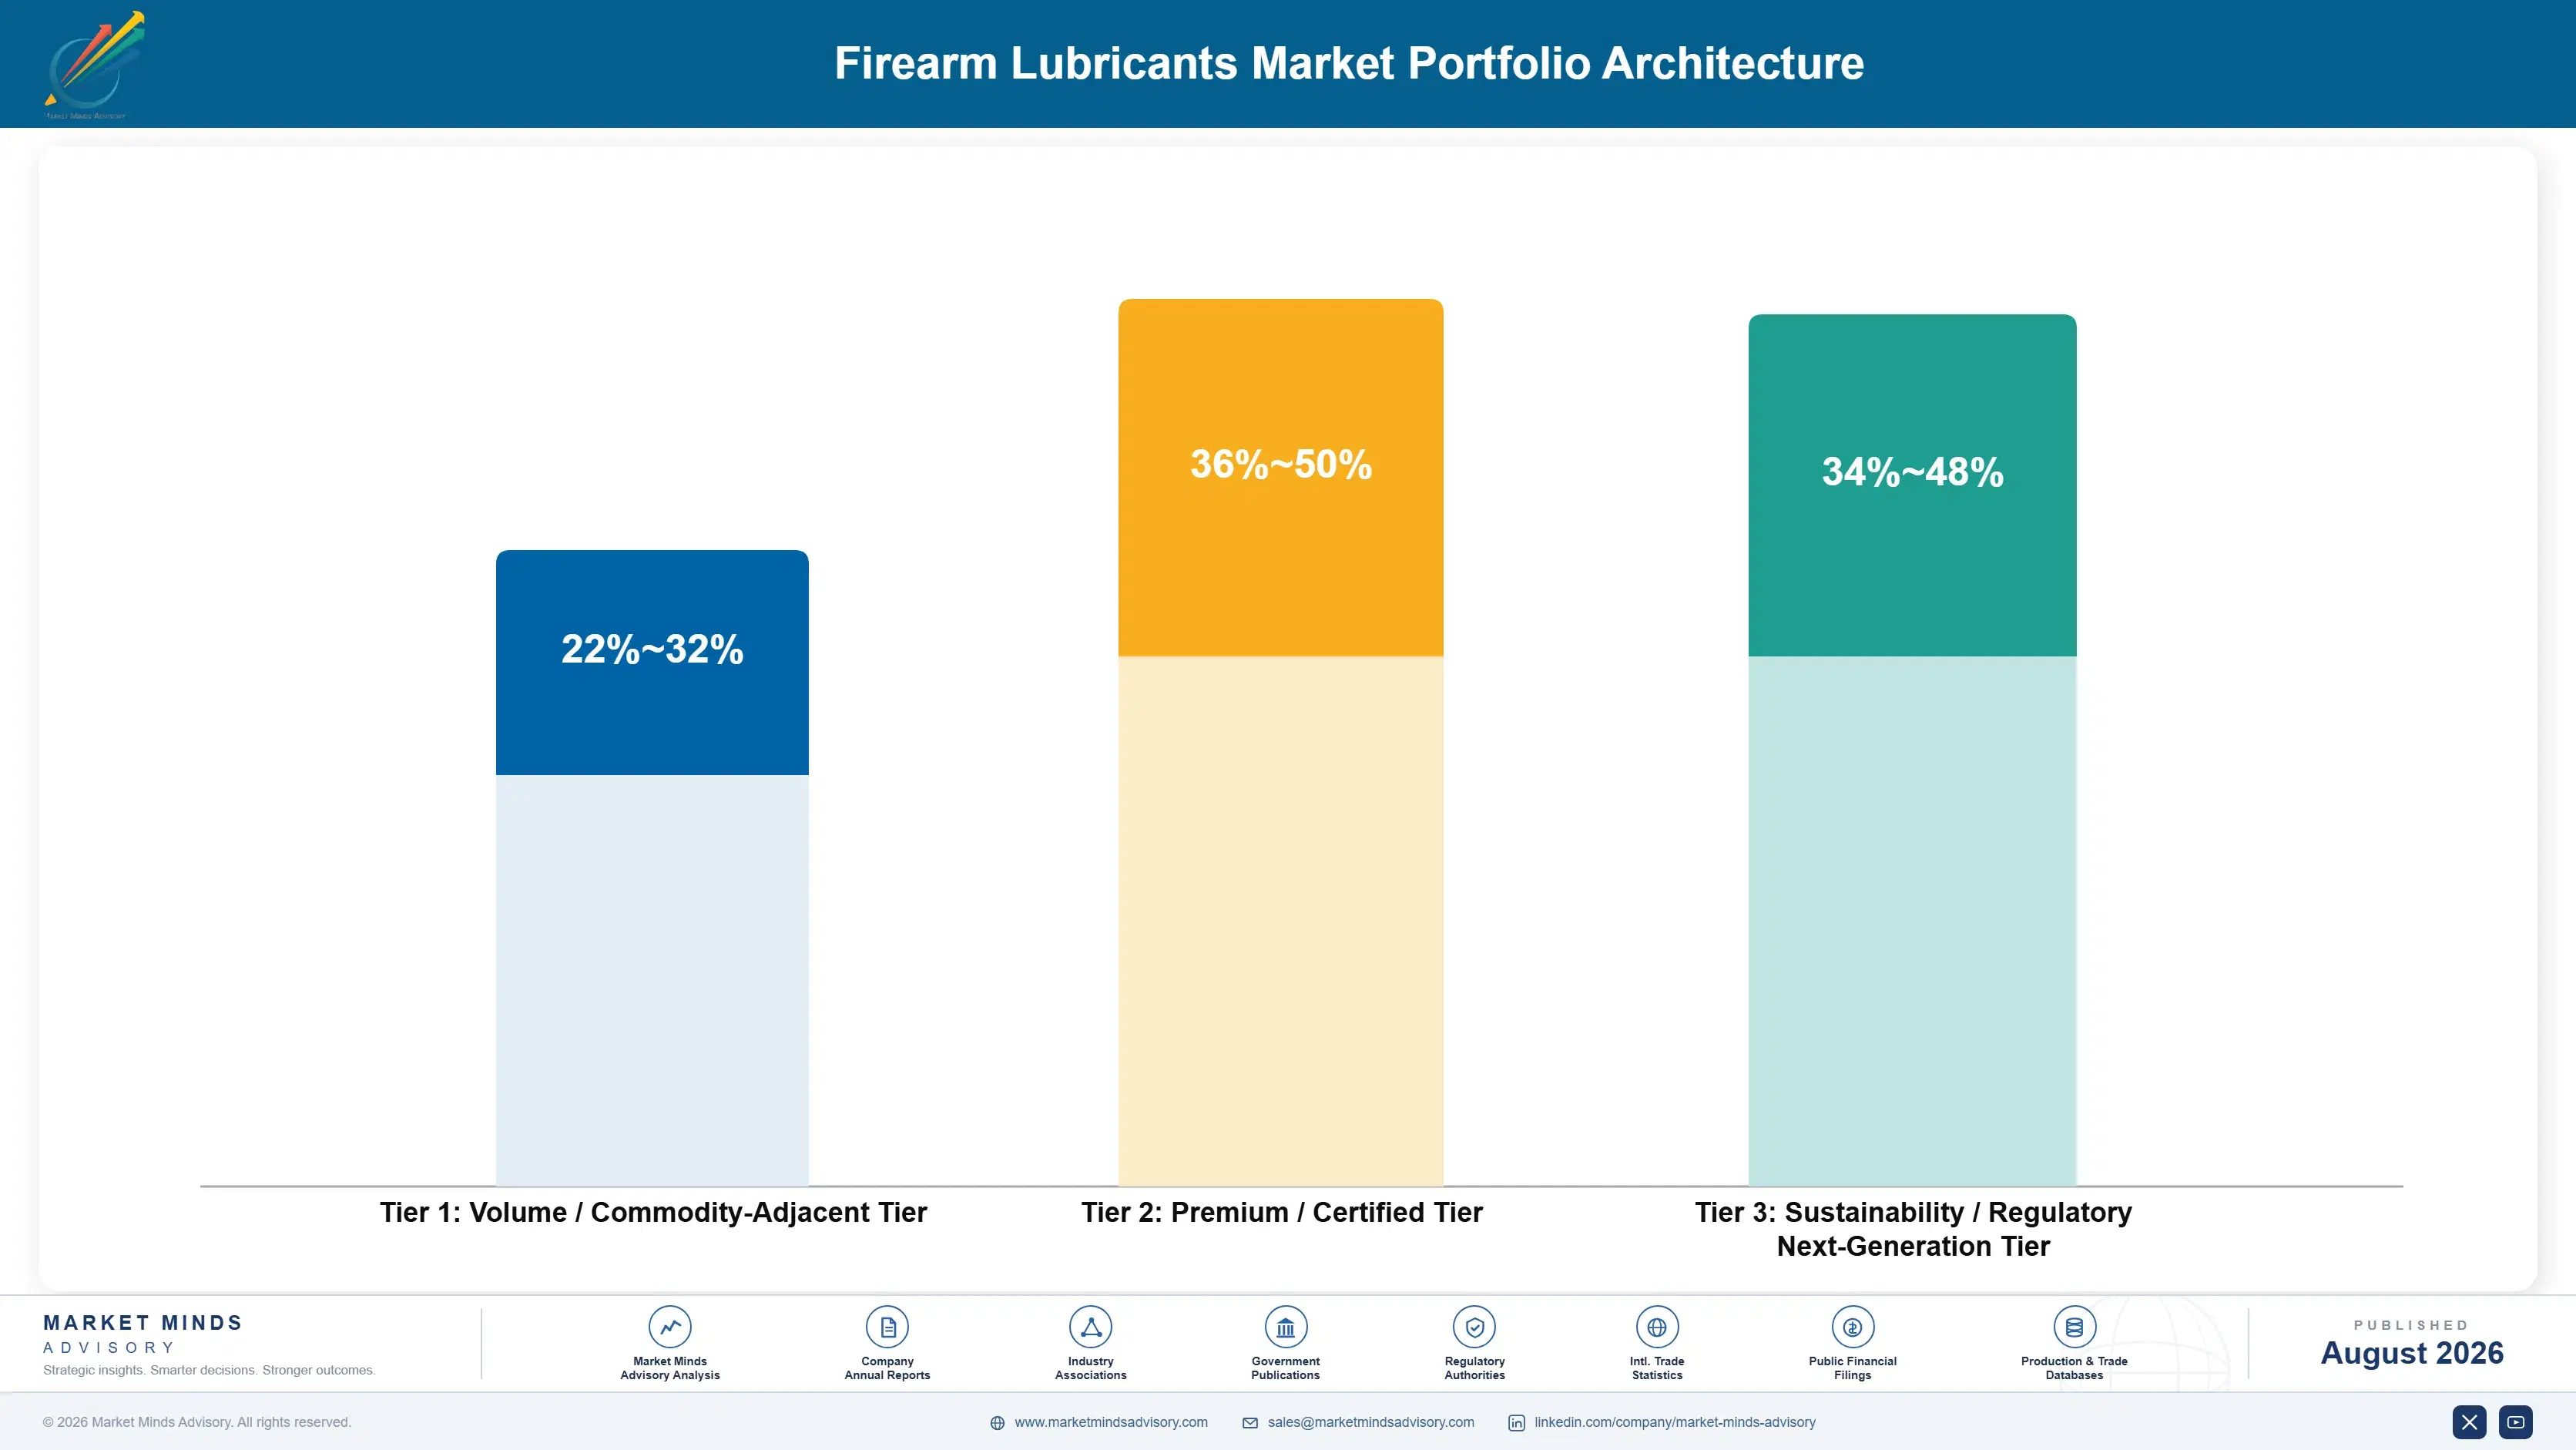
Margin architecture follows channel and qualification rather than chemistry, which is unusual for a lubricants business. Commodity oils and general cleaners sold through mass retail compete on shelf price against products that perform indistinguishably, and they earn accordingly. Specialised dry film and high-temperature products earn considerably more on genuine performance difference. Defence-qualified chemistry earns well on a barrier competitors would need years to cross.
The volume and premium tension shows in how manufacturers treat the retail shelf. Mass-channel volume is large, visible, and thin, and defending it consumes category management effort that returns very little margin. Specialist and direct-channel products earn several times better on a fraction of the volume. Brands built entirely around shelf presence find their best-performing products are the ones retail never carried at all. Very few of them appear to have noticed.

High-value pools concentrate in defence-specified chemistry, dry film and suppressor-appropriate products, and corrosion protection serving owners who are not shooting anything. Each is defended by qualification, formulation performance, or a buyer base that ammunition pricing does not move, which is a considerably more comfortable position than the shelf provides. Retail volume looks impressive on a chart and returns very little.

Volume / Commodity-Adjacent Tier

General cleaning solvents, standard lubricating oils, and combination products sold through mass retail at fixed shelf price points. Performance differences are hard for buyers to detect. Shelf position rather than chemistry decides outcomes here.
Gross Margin: 22%-32%

Premium / Certified Tier

Dry film, PTFE-based, and high-temperature lubricants where suppressor and adverse-condition performance is genuinely measurable and buyers search deliberately. Specialist dealers and online channels carry most of it. The range reflects wide format and channel variation.
Gross Margin: 36%-50%

Sustainability / Regulatory / Next-Generation Tier

Defence-qualified chemistry and reformulated low-emission products meeting tightening volatile organic compound limits across jurisdictions. Qualification and compliance investment defend both. The range is wide because defence contract and consumer compliance economics differ substantially.
Gross Margin: 34%-48%
firearm-lubricants-market-trend-portfolio-architecture-1787551351357

High-value Sub-segments and Strategic Watch-out

Defence-Qualified Chemistry

Represents 19% of volume behind qualification measured in years, with renewals that rarely go to competitive retender because requalification deters challengers. Training budgets rather than ammunition pricing govern the volume entirely. Field performance history accumulates during the contract and eventually becomes the whole barrier itself.
Gross Margin: 34%-46%

Dry Film and Suppressor Products

Growing at 8.4% as suppressed firearms run hotter and dirtier than conventional lubricants were formulated for. Buyers search deliberately for these rather than browsing, which favours online and specialist dealer channels heavily. Regulation on suppressor ownership rather than any product factor governs how fast this grows.
Gross Margin: 38%-50%

Corrosion and Storage Protection

Growing at 6.2% and almost entirely insulated from ammunition pricing, since the buyers are owners who rarely shoot at all. Humid coastal and tropical markets buy disproportionately and the base is very large. Products consume slowly, which makes this a margin story rather than a volume one.
Gross Margin: 32%-44%

Mass Retail Commodity Products

The strategic watch-out. Fixed shelf price points slow input cost recovery, facings are consolidating rather than expanding, and buyers cannot detect any performance difference between competing eleven-dollar bottles anyway. Defending the space costs continuing category management effort that returns very little actual margin in return.
Gross Margin: 22%-32%

How Bottles Actually Get Bought

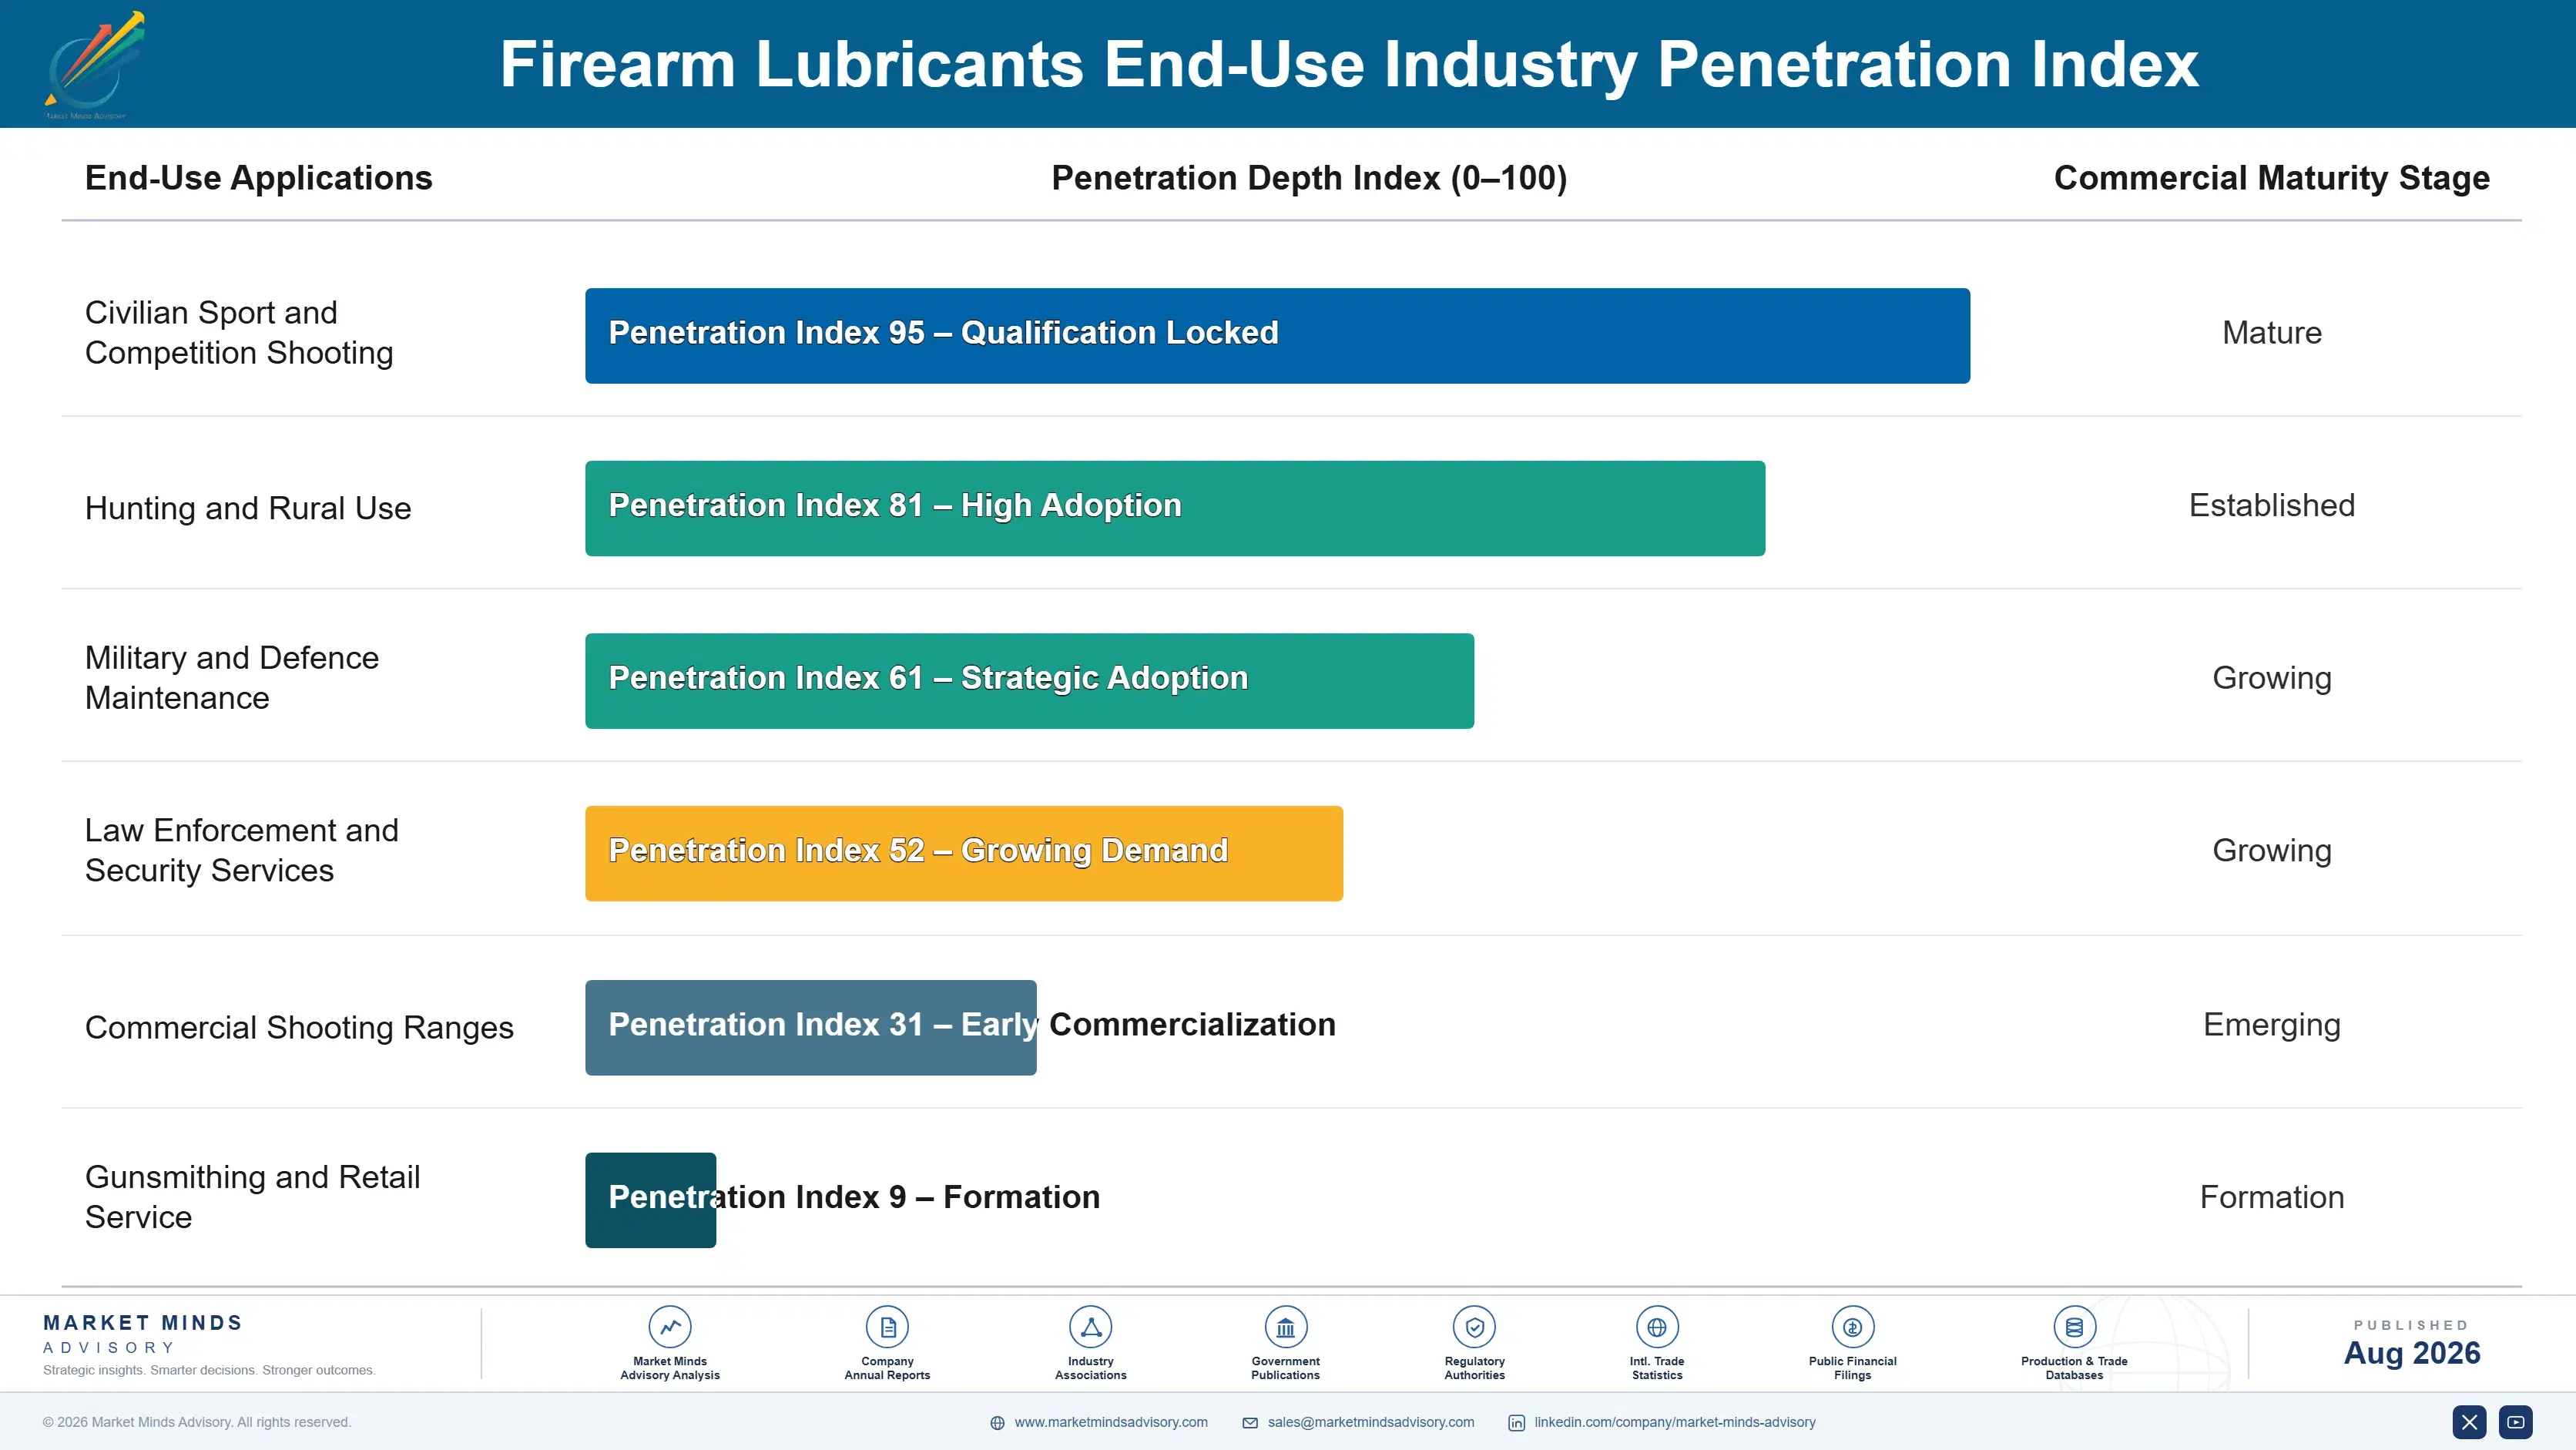
Demand arrives through three channels that behave nothing alike. Mass retail serves buyers who never researched anything and pick whatever occupies the facing they walk past, which makes shelf position the entire competitive question. Specialist dealers and online serve buyers who read reviews, compare formulations, and arrive knowing what they want. Defence and law enforcement supply runs on qualification status and contract renewal, where the product was chosen years earlier and nobody revisits it casually.
Stickiness follows how the choice was made in the first place. Defence qualification holds through contract cycles because requalification costs years. Specialist buyers hold through reputation and reviews accumulated over time. Retail buyers hold nothing at all and switch to whatever is in front of them next time. Nothing in a retail purchase creates any loyalty whatsoever.

The deciding buyer at retail is not the consumer but the category manager allocating planogram space on turn evidence. Manufacturers who understand that sell turn data and category performance rather than product features. Those who market to end consumers while losing facings are addressing the wrong decision entirely. Marketing budgets aimed at consumers while facings disappear are money spent in the wrong room.
firearm-lubricants-market-trend-end-use-penetration-index-1787551351844

Where the Margin Actually Is

These are among the four positions where our research anticipates prominent divergence between winners and laggards over the coming forecast period. Each is grounded in the demand model, the regulatory perimeter, and the announced capacity pipeline.
01 / CONSUMPTION FORECASTING BASIS

Model round count, not firearms sold

Maintenance chemistry is consumed by shooting rather than by ownership, and consumption fell roughly 30% through the last ammunition shortage while firearm sales figures climbed steadily throughout the same period. Manufacturers planning production from sales data build inventory into a demand trough and then run short exactly when range attendance eventually recovers again. Ammunition pricing, range utilisation, and competitive shooting entry numbers all predict actual consumption considerably better, and almost nobody in this market currently uses any of them at all.
02 / SHELF FACING DEFENCE

Sell turn data to category managers, not features

Around 58% of consumer volume moves through physical retail where large chains are consolidating rather than expanding the space for an eleven-dollar bottle that turns over slowly against considerably faster-moving goods elsewhere. A brand losing a facing loses the majority of buyers who never research a maintenance purchase before making one at the shelf. Category management support, planogram evidence, and demonstrated turn performance retain space far more reliably than any product improvement or consumer marketing campaign has ever managed to.
03 / NON-SHOOTING OWNER PRODUCTS

Sell to the safe, not only the range

A very large share of privately held firearms are fired rarely or never, and those owners still buy protection against humidity, salt air, and extended storage in conditions that promote surface corrosion over time. That segment grows at 6.2% and stays almost entirely insulated from the ammunition pricing that swings every round-count-driven product by roughly 30%. Manufacturers weighted purely toward active shooting consumption are carrying volatility they could have hedged against a buyer base considerably larger than the active shooting population is.
04 / SPECIFICATION QUALIFICATION INVESTMENT

Pay the years to reach defence approval

Military and law enforcement supply represents fully 19% of market volume against contracts that renew predictably and buyers who almost never change an approved product without a compelling reason to do so. Qualification takes years, constrains available formulation choices, and demands testing that most consumer brands never seriously contemplate undertaking at all. That cost is precisely what makes the position defensible once held, because later arrivals face the identical barrier without the incumbent's accumulated field performance record standing behind them.

Engagement Snapshot From the Field

A live engagement with an industry participant carrying material or product regulatory and market exposure ahead of a defining policy shift, showing how our research translates into a defensible multi-year portfolio strategy.
MARKET MINDS ADVISORY · CLIENT ENGAGEMENT SUMMARY
Firearm Lubricants Producer Strategic Portfolio Review and Transition Roadmap 2026·Investment Scenario on Firearm Lubricants Exposure Evaluation 2025-26
CLIENT PROFILE
A North American firearm maintenance chemistry manufacturer with revenue near USD 62 million (client-reported, unverified by MMA), selling cleaning solvents, oils, and combination products predominantly through mass sporting goods retail. No defence qualification existed, dry film products were absent from the range, and two facings had been lost in the previous planogram review. Planning had always followed sales data.
STRATEGIC CHALLENGE
Production planning followed firearm sales data and had missed badly through the last ammunition cycle, leaving inventory built into a trough and shortages during recovery. Emission reformulation costs were approaching on three products. Retail was consolidating facings and the business had no channel that did not depend on them. Nothing in the portfolio was insulated.
MMA APPROACH
MMA rebuilt demand history against ammunition pricing and range utilisation rather than firearm sales, assessed reformulation cost at family rather than product level, and evaluated defence qualification timelines against contract volumes. Forty-seven expert interviews with category managers, range operators, specialist dealers, and defence procurement staff established how each channel genuinely decides.
KEY FINDINGS
  1. Consumption tracked ammunition pricing and range utilisation almost exactly, while correlation against firearm sales data the client had used for planning was close to meaningless.
  2. The two lost facings had gone to competitors who supplied category management turn data during the review, which the client had never provided to any retailer.
  3. Reformulating three products individually would have cost roughly three times the amount required to reformulate the shared base chemistry underneath all of them together.
  4. Corrosion protection products the client sold as an afterthought were its highest-margin line and had grown steadily straight through the ammunition shortage that halved everything else.
CLIENT PROFILE
A North American firearm maintenance chemistry manufacturer with revenue near USD 62 million (client-reported, unverified by MMA), selling cleaning solvents, oils, and combination products predominantly through mass sporting goods retail. No defence qualification existed, dry film products were absent from the range, and two facings had been lost in the previous planogram review. Planning had always followed sales data.
STRATEGIC CHALLENGE
Production planning followed firearm sales data and had missed badly through the last ammunition cycle, leaving inventory built into a trough and shortages during recovery. Emission reformulation costs were approaching on three products. Retail was consolidating facings and the business had no channel that did not depend on them. Nothing in the portfolio was insulated.
MMA APPROACH
MMA rebuilt demand history against ammunition pricing and range utilisation rather than firearm sales, assessed reformulation cost at family rather than product level, and evaluated defence qualification timelines against contract volumes. Forty-seven expert interviews with category managers, range operators, specialist dealers, and defence procurement staff established how each channel genuinely decides.
KEY FINDINGS
  1. Consumption tracked ammunition pricing and range utilisation almost exactly, while correlation against firearm sales data the client had used for planning was close to meaningless.
  2. The two lost facings had gone to competitors who supplied category management turn data during the review, which the client had never provided to any retailer.
  3. Reformulating three products individually would have cost roughly three times the amount required to reformulate the shared base chemistry underneath all of them together.
  4. Corrosion protection products the client sold as an afterthought were its highest-margin line and had grown steadily straight through the ammunition shortage that halved everything else.
RECOMMENDED STRATEGY
Phase 1: Phase one: rebuild demand planning on ammunition pricing and range utilisation data, and supply category management turn evidence to every retail account. Phase 2: Phase two: reformulate the shared base chemistry once across the affected product family rather than funding three separate compliance programmes. Phase 3: Phase three: expand corrosion and storage protection deliberately, and begin defence qualification on a single product to establish the approval pathway.
OUTCOME
The client recovered one lost facing within two planogram cycles and reformulated at family level for roughly a third of the projected cost. Corrosion product revenue grew substantially, blended gross margin improved 6.4 percentage points, and defence qualification testing began (client-reported, unverified by MMA). A second facing recovery is under review.

Frequently Asked Questions

Foundational context covering the market sizes, CAGR, scope, country, region and competition that inform every finding below. This section is provided to cover basics and most often pre-purchase conversations, answered from the MMA Primary Research Dataset.

What is the current size of the Firearm Lubricants Market?

The market was valued at USD 0.9 billion in 2025, rising to an estimated USD 0.94 billion in 2026. North America holds the largest regional share at 52% of value.

How large will the Firearm Lubricants Market be by 2036?

MMA forecasts USD 1.51 billion by 2036 under the base case, an expansion multiple of 1.6 times the 2026 value. That represents USD 0.57 billion of incremental value.

What is the CAGR for the Firearm Lubricants Market 2026 to 2036?

The base case CAGR is 4.8%, with a bull case of 6.0% and a bear case of 3.6%. The spread reflects uncertainty over ammunition affordability and reformulation compliance cost.

Which segment is growing fastest?

Dry film and PTFE-based lubricants grow fastest at 8.4%, roughly 1.75 times the market rate, on suppressor adoption. Corrosion and storage protectants follow at 6.2%.

Who are the major companies in the Firearm Lubricants Market?

Vista Outdoor, Safariland Group, Otis Technology, Lucas Oil Products, and WD-40 Company lead, holding roughly 42% between them. Brand recognition and retail distribution sustain that position.

Which country is growing fastest?

The Philippines grows fastest at 7.6%, on an active licensed ownership base and strong practical shooting participation. Humid conditions also make corrosion protection a genuine requirement there.

Report Segmentation Architecture

The full report scope spans multiple orthogonal segmentation dimensions, with cross-tabulated demand data provided for each dimension pair. Coverage extends further to regional breakdowns, trend trajectories, and the competitive detail needed to support segment-level decision-making.

By Product Function

  • Cleaning Solvents and Bore Cleaners
  • Lubricating Oils
  • Greases and Heavy Lubricants
  • Combination Cleaner-Lubricant-Protectant Products
  • Dry Film and PTFE-Based Lubricants
  • Corrosion Inhibitors and Storage Protectants

By End-Use Industry

  • Civilian Sport and Competition Shooting
  • Hunting and Rural Use
  • Military and Defence Maintenance
  • Law Enforcement and Security Services
  • Commercial Shooting Ranges
  • Gunsmithing and Retail Service

By Distribution Channel

  • Mass Sporting Goods Retail
  • Independent Dealers and Gunsmiths
  • Direct Online and Brand Websites
  • Range and Club Retail
  • Government and Defence Contracts

By Region

  • North America
  • Western Europe
  • East Asia
  • South Asia and Pacific
  • Latin America
  • Middle East and Africa
  • Eastern Europe

Scope, Methodology, and Coverage

Every figure in this report is reproducible from documented input assumptions. The scope below maps the historical period, the forecast horizon, the segmentation dimensions, and the countries covered, alongside the underlying primary and qualitative methodology.
Historical Period
2020 to 2025
Forecast Period
2026 to 2036
Base Year
2025 (USD billions; MMA Primary Research Dataset, August 2026)
Market Definition
The market comprises chemistry formulated for firearm maintenance and supplied to consumer, commercial, and defence users, covering cleaning solvents and bore cleaners, lubricating oils, greases and heavy lubricants, combination cleaner-lubricant-protectant products, dry film and PTFE-based lubricants, and corrosion inhibitors for long-term storage. Value is measured at manufacturer level across retail, specialist, online, and contract channels. Firearms and ammunition, cleaning tools, brushes, rods and patches sold separately, gun safes and storage cabinets, industrial and automotive lubricants, and general-purpose household penetrating oils fall outside scope.
Quantitative Units
USD billions (current prices); million units shipped annually; USD per unit by product function and packaging format
Segmentation Dimensions
By Product Function; By End-Use Industry; By Distribution Channel; By Region
Regions Covered
North America, Western Europe, East Asia, South Asia and Pacific, Latin America, Middle East and Africa, Eastern Europe
Countries Covered
United States, Canada, Mexico, Germany, France, Italy, Spain, United Kingdom, Switzerland, Austria, Finland, Poland, Czechia, Slovakia, Romania, Serbia, Philippines, Australia, New Zealand, India, Thailand, Japan, South Korea, China, Brazil, Argentina, Chile, Saudi Arabia, United Arab Emirates, South Africa
Key Companies Profiled
Vista Outdoor, Safariland Group, Otis Technology, Lucas Oil Products, WD-40 Company, Birchwood Casey, Shooter's Choice, Ballistol, Brunox, Slip 2000, Real Avid, Sentry Solutions, Militec, FrogLube, Weapon Shield, Napier of London, Pro-Shot Products, Bore Tech, Hornady, Clenzoil
Quantitative Methodology
Primary survey, n=3,800 respondents, Q4 2025, six countries; demand-side model with trade association cross-validation
Qualitative Methodology
47 expert interviews, Q4 2025; applied to validate demand model assumptions, identify emerging dynamics, and assess competitive positioning
Report Format
PDF and XLSX data workbook (Word format preview document)
Publisher
Market Minds Advisory
Report Code
MMA-2026-CHM-347
Published
August 2026
Contact
sales@marketmindsadvisory.com | www.marketmindsadvisory.com

Purchase the full Firearm Lubricants Market Report (2026 to 2036).

The full report sizes firearm maintenance chemistry demand across six product functions, six end-use categories, and seven regions with 2026 to 2036 forecasts under base, bull, and bear cases. It models consumption against round count and ammunition pricing rather than firearm sales, since the two diverge sharply and most planning in this market uses the wrong one. Competitive profiles cover twenty manufacturers assessed consistently on maintenance chemistry revenue, retail distribution, and specification approval status. Cost analysis traces base oil, solvent, additive, and packaging exposure by format. Commercial guidance addresses forecasting basis, shelf defence, storage products, and defence qualification.
Six product functions sized separately by region
Consumption modelled against round count and ammunition pricing
Retail facing allocation tracked across major chain accounts
Emission reformulation cost estimated at product and family level
Defence specification approval timelines mapped by jurisdiction
Channel margin compared across retail, specialist, and direct sales

Built For The People Who Decide

From boardroom strategy to bench-side execution, this report is read cover-to-cover by leaders shaping the next decade of their industry, turning demand scenarios, market dynamics and valuation benchmarks into decisions.
CXOs/ Presidents/ VPs/ Managers
M&A and Corporate Development
Strategy Teams and R&D Heads
Procurement and Product Directors
Regulatory and Compliance Leaders
Investor Relations and Equity Analysts