Market Minds Advisory
Fire Trucks Market

Fire Trucks Market: Backlog Economics, Chassis Choice, and Electrification Against a Brutal Duty Cycle

Order books ran out to 38 months and manufacturers stopped negotiating. Municipal buyers who had specified around one builder for decades discovered what that dependency was actually worth to the other side.

Lead Analyst

David Horsley

Published

September 2026

Make Smarter Decisions with Customized Research Insights

Request a free sample report and evaluate market opportunities, growth trends, and competitive dynamics relevant to your business needs.

2025 MARKET VALUE$8.6BMarket Size 2025
2036 FORECAST VALUE$15.7BBase Case , 2026 to 2036
CAGR 2026 TO 20365.6 %Bull 6.8% / Bear 4.4%
INCREMENTAL OPPORTUNITY$6.6BNet 10- year value creation
EXPANSION MULTIPLE1.72x2036 value over 2026 base
Strategic Levers
M&A Pipeline
Regional Outlook
Country Rankings
Competitive Intelligence
Segmental Deep-dive
Call-Us : 91 93563 13602

Executive Snapshot and Market Trajectory

Lead times went from under a year to 38 months and never came back. That single change handed pricing power to manufacturers who had spent decades bidding against each other on municipal tenders written by fire chiefs who knew exactly what they wanted. Nobody had planned for that.
Commercial advantage now belongs to builders who can convert backlog into delivered units rather than to those who quote lowest, because a department waiting three years for an engine values a date more than a discount. Electric and alternative drive apparatus grows fastest at 18.4%, roughly 3.29 times the market. North America holds the largest position at 34% of value, above the standard band, on custom chassis pricing no other region pays.
Concentration runs at roughly 44% for the top five, held by chassis engineering and aerial capability rather than by assembly. Around 41% of units globally are built on purpose-designed chassis, almost all of them American. Replacement cycles average 19 years, which makes every order a decision a department lives with for a very long time. Getting it wrong is not something a chief can quietly correct later.
Market Definition
The market comprises purpose-built firefighting apparatus delivered to fire services and industrial operators, covering pumper and engine apparatus, aerial ladder and platform apparatus, heavy rescue and squad apparatus, airport rescue and firefighting vehicles, wildland and brush apparatus, and electric or alternative drive apparatus. Value is measured at manufacturer level on delivered units and attached service. Standalone chassis supply, portable pumps and hoses sold separately, personal protective equipment, ambulances and other emergency medical vehicles, and fire station equipment fall outside scope.
Base Year Value
$8.6B in 2025 (MMA Primary Research Dataset, August 2026)
Forecast Period
2026 to 2036, eleven discrete annual values
CAGR
5.6% base case. Bull 6.8%. Bear 4.4%.
Fastest Growth Segment
Electric and Alternative Drive Apparatus: 18.4% CAGR
Fastest Growth Country
India: 8.6% CAGR
Fastest Growth Region
South Asia and Pacific: 7.8% CAGR
Largest Region
North America: 34% of 2025 global value
Market Leaders
Oshkosh, REV Group, Rosenbauer, Magirus, and Morita Holdings lead on fire apparatus delivery revenue. Source: company annual reports and MMA Analysis, July 2026.
Primary Survey
n=3,800 procurement and R&D decision-makers, Q4 2025, six countries
Methodology
Demand-side build-up, cross-validated against public data, 47 expert interviews

Fire Trucks Market Forecast Scenarios

fire-trucks-market-size-forecast-scenario-1787551330537
The period from 2020 to 2025 broke a procurement model that had run unchanged for decades. Chassis and component shortages collided with deferred municipal replacement demand, backlogs stretched past three years, and pricing that had been ground down by competitive tender began moving upward instead. Departments started ordering earlier and accepting standard configurations to get a delivery date. The 4.6% historical rate reflects constrained deliveries rather than weak underlying demand.
The 5.6% base case rests on three mechanisms. Deferred replacement across an ageing municipal fleet keeps order intake high, since apparatus running past a 19-year cycle eventually fails inspection or insurance requirements. Wildland apparatus demand grows with fire seasons that now run most of the year in several regions. And electrification is moving from demonstration units into genuine fleet orders in European and North American cities. None of the three requires new fire departments anywhere.
The 6.8% bull case assumes backlog conversion accelerates as component supply normalises while municipal capital budgets hold. The 4.4% bear case reflects municipal budget pressure deferring replacements further, higher interest rates raising the cost of the bond issues that fund apparatus, and electrification orders stalling on duty cycle performance that has disappointed several early adopters.

What a Three-Year Wait Changed

Chassis choice is the largest single decision in this market and it splits the world in two. A purpose-designed cab-forward chassis built for firefighting costs several times a commercial truck chassis, and roughly 41% of global units use one. Almost all of those are American. European, Asian, and most other departments mount bodies on MAN, Mercedes, Scania, or Isuzu commercial platforms instead, which is why unit prices differ so enormously between regions.
TOP-FIVE CONCENTRATION44%Combined share of apparatus deliveries held by leading manufacturers
ORDER BACKLOG DURATION38 monthsTypical wait between order placement and vehicle delivery
AVERAGE UNIT PRICEUSD 720,000Blended across pumper, aerial, and specialty apparatus deliveries
REPLACEMENT CYCLE LENGTH19 yearsTypical service life before a municipal department replaces apparatus
CUSTOM CHASSIS SHARE41%Portion of units built on purpose-designed rather than commercial chassis
AFTERMARKET SERVICE SHARE17%Portion of manufacturer revenue from parts, service, and refurbishment
Backlog reshaped the commercial relationship completely. A department that waits 38 months for delivery specifies earlier, accepts more standard configuration, and negotiates far less, because the alternative is waiting longer somewhere else. Manufacturers that spent years competing on price now allocate production slots. Whether that discipline survives when component supply fully normalises is the open question underneath every forecast in this market.
Aerial apparatus is where the engineering barrier genuinely sits. Ladder and platform stability calculations, torsion box design, and the certification behind them limit how many builders can credibly compete, and departments buying one are making a 19-year commitment to a specific manufacturer's service network. That is a different business from building a pumper, and it explains most of the concentration figure.
"For thirty years the fire chief wrote a specification, three builders bid, and the cheapest compliant one won. Then delivery dates became the scarce thing instead of dollars, and every assumption in that process quietly stopped applying. Nobody has decided yet whether it goes back."
Practice Director, Emergency Vehicles and Municipal Fleet · MMA Emergency and Specialty Vehicles Practice · August 2026

Market Trends

Backlog Turns Delivery Slots Into the Scarce Commodity

Waits of around 38 months converted apparatus from a purchase into a queue position, and departments now order before budgets are formally approved to hold a slot. Manufacturers allocate production rather than chasing orders, which reversed a negotiating dynamic that had run one way for decades. Standard configurations move faster than heavily customised ones, so specification discipline has improved considerably. Whether pricing power survives normalised component supply is the question every builder is quietly modelling behind its published order intake. Nobody in the industry seems willing to answer that question out loud.
Market Impact: Cycles average 19 years per unit

Wildland Apparatus Demand Follows Lengthening Fire Seasons

Fire seasons in California, southern Europe, and Australia now run for most of the year, and the vehicles needed are not municipal pumpers at all. Wildland apparatus requires high ground clearance, pump-and-roll capability, smaller water capacity, and durability on unmade ground that structural apparatus never encounters. Federal, state, and forestry agencies buy these in fleets rather than singly. The segment grows at 9.6% against a market rate of 5.6%, and specialist builders compete against the majors more effectively here than anywhere. Municipal structural apparatus simply does not work on that terrain at all.
Market Impact: Custom chassis on 41% of units

Market Opportunities and Growth Drivers

Ageing Municipal Fleets Force Deferred Replacement Orders

Apparatus running past a 19-year replacement cycle starts failing pump certification, accumulating maintenance cost, and attracting insurance and mutual aid questions that a fire chief cannot answer indefinitely. Many departments deferred through the last decade of municipal budget pressure and then again through the backlog period, which built a replacement queue that has to clear eventually. Bond issues fund most of it in North America. That deferred demand is the steadiest component of order intake anywhere in this market. Volunteer departments defer the longest and eventually face exactly the same certification problem.
Market Impact: Pumping draws power for 4 hours

American Custom Chassis Pricing Anchors Global Value

United States departments specify purpose-designed cab-forward chassis engineered for firefighting rather than adapted commercial trucks, and those vehicles cost several times what a body-on-commercial-chassis unit does elsewhere. Roughly 41% of global units are built that way and almost all sit in North America. That pricing is why the region holds 34% of value, above the standard share band, on a unit count nowhere near that proportion. Nothing suggests American specification practice is about to change. Apparatus committees staffed by serving firefighters write those specifications, and they specify what they have already used and trusted.
Market Impact: Deferrals move orders 3 years

Market Restraints and Challenges

Electrification Struggles Against the Actual Duty Cycle

An engine pumping at a working fire draws substantial power for hours, which is a load no practical battery pack sustains, so every serious electric apparatus carries a range extender or generator and is a hybrid in all but name. The root cause is energy density rather than any engineering reluctance. Manufacturers mitigate through hybrid architectures that use battery drive for response and combustion for sustained pumping, through station charging infrastructure grants, and by targeting urban departments with short response distances. Early adopters buying on range figures have been disappointed accordingly.
Market Impact: Backlogs stretch beyond 38 months

Municipal Budget Cycles Defer Orders Unpredictably

Apparatus is funded through capital budgets and bond issues that compete against every other municipal priority, and a single council decision can move a replacement two or three years to the right. The root cause is that fire apparatus lasts long enough to defer without immediate consequence, unlike most spending. Manufacturers mitigate through lease and financing arrangements that convert capital cost into operating budget, through refurbishment programmes that extend service life, and by building order books deep enough that individual deferrals stop mattering. None of that gives a chief any control over council timing.
Market Impact: Wildland apparatus growing at 9.6%
3 additional market trends, 4 additional growth drivers, and 2 additional restraints and challenges are covered in the full report. Contact sales@marketmindsadvisory.com to access the complete intelligence.

Segment CAGR and Growth Architecture

Segmentation follows apparatus type, because each vehicle answers a different operational requirement, carries a distinct engineering barrier, and is bought by a different part of the fire service. Six types cover commercial supply, and the divide between structural municipal apparatus and specialised wildland or airport vehicles matters more commercially than any difference in chassis brand.
fire-trucks-market-market-share-analysis-1787551331073

Electric and Alternative Drive Apparatus

The fastest type at 18.4%, roughly 3.29 times the market, from a base that remains genuinely small in unit terms. Every credible product is a hybrid rather than a pure battery vehicle, because pumping at a working fire draws power for hours that no practical pack sustains, so a range extender or generator handles sustained operation while battery drive covers response and scene idling. European and North American cities with air quality commitments have placed the first fleet orders. Station charging infrastructure is frequently the harder half of the project for the department involved. Grid capacity at older stations frequently requires a service upgrade before any apparatus can be charged at all.
CAGR 18.4%

Wildland and Brush Apparatus

Second fastest at 9.6%, and a fundamentally different vehicle from anything a municipal department parks in a station. High ground clearance, pump-and-roll capability while moving, smaller water capacity, and survivability on unmade terrain matter far more than ladder reach or hose bed layout. Fire seasons across California, southern Europe, and Australia now run most of the year, and federal, state, and forestry agencies buy in fleets rather than as single replacements. Specialist builders compete against the majors more effectively here than in any other apparatus category. Water capacity trades directly against ground clearance and approach angle, which forces design compromises that municipal apparatus never has to consider seriously at all.
CAGR 9.6%
Full segment breakdown across 6 segments available in the complete report.

Regional Architecture and Country Demand Map

Regional shares follow apparatus specification and unit pricing rather than population or fire service size, and the difference between those things is very large. Two regions sit outside the standard bands for reasons named below, both driven by chassis choice. Unit counts tell an entirely different story.

North America

At 34% this sits above the standard band, because American departments specify purpose-designed cab-forward chassis costing several times the commercial platforms used everywhere else, which lifts value far above the region's unit count. Oshkosh through Pierce and REV Group through its several brands dominate deliveries. Bond-funded municipal procurement, volunteer department purchasing, and a strong specification culture written by fire chiefs all shape how apparatus is bought. Backlogs here stretched furthest and pricing moved most. Growth of 5.4% reflects deferred replacement clearing rather than any expansion in the number of departments. Volunteer departments account for a large share of units at lower specification, which pulls average pricing below what career service purchasing alone would show.
Share: 34% | CAGR: 5.4% (2026 to 2036)

Western Europe

Body-on-commercial-chassis construction is standard, with MAN, Mercedes, Scania, and Volvo platforms carrying apparatus bodies from Rosenbauer, Magirus, Ziegler, and regional builders. That keeps unit prices well below American equivalents while delivering entirely adequate capability for the operational profile. Aerial platforms are a genuine regional strength, with Bronto and Magirus holding engineering positions few can match anywhere. Municipal air quality commitments have produced the earliest serious electric apparatus orders. Growth of 4.2% is the slowest anywhere, reflecting mature fleets and constrained municipal budgets across most member states. Volunteer and part-time services across Germany and Austria buy large unit volumes at modest specification, which keeps regional value well below what the fleet size alone would suggest.
Share: 23% | CAGR: 4.2% (2026 to 2036)
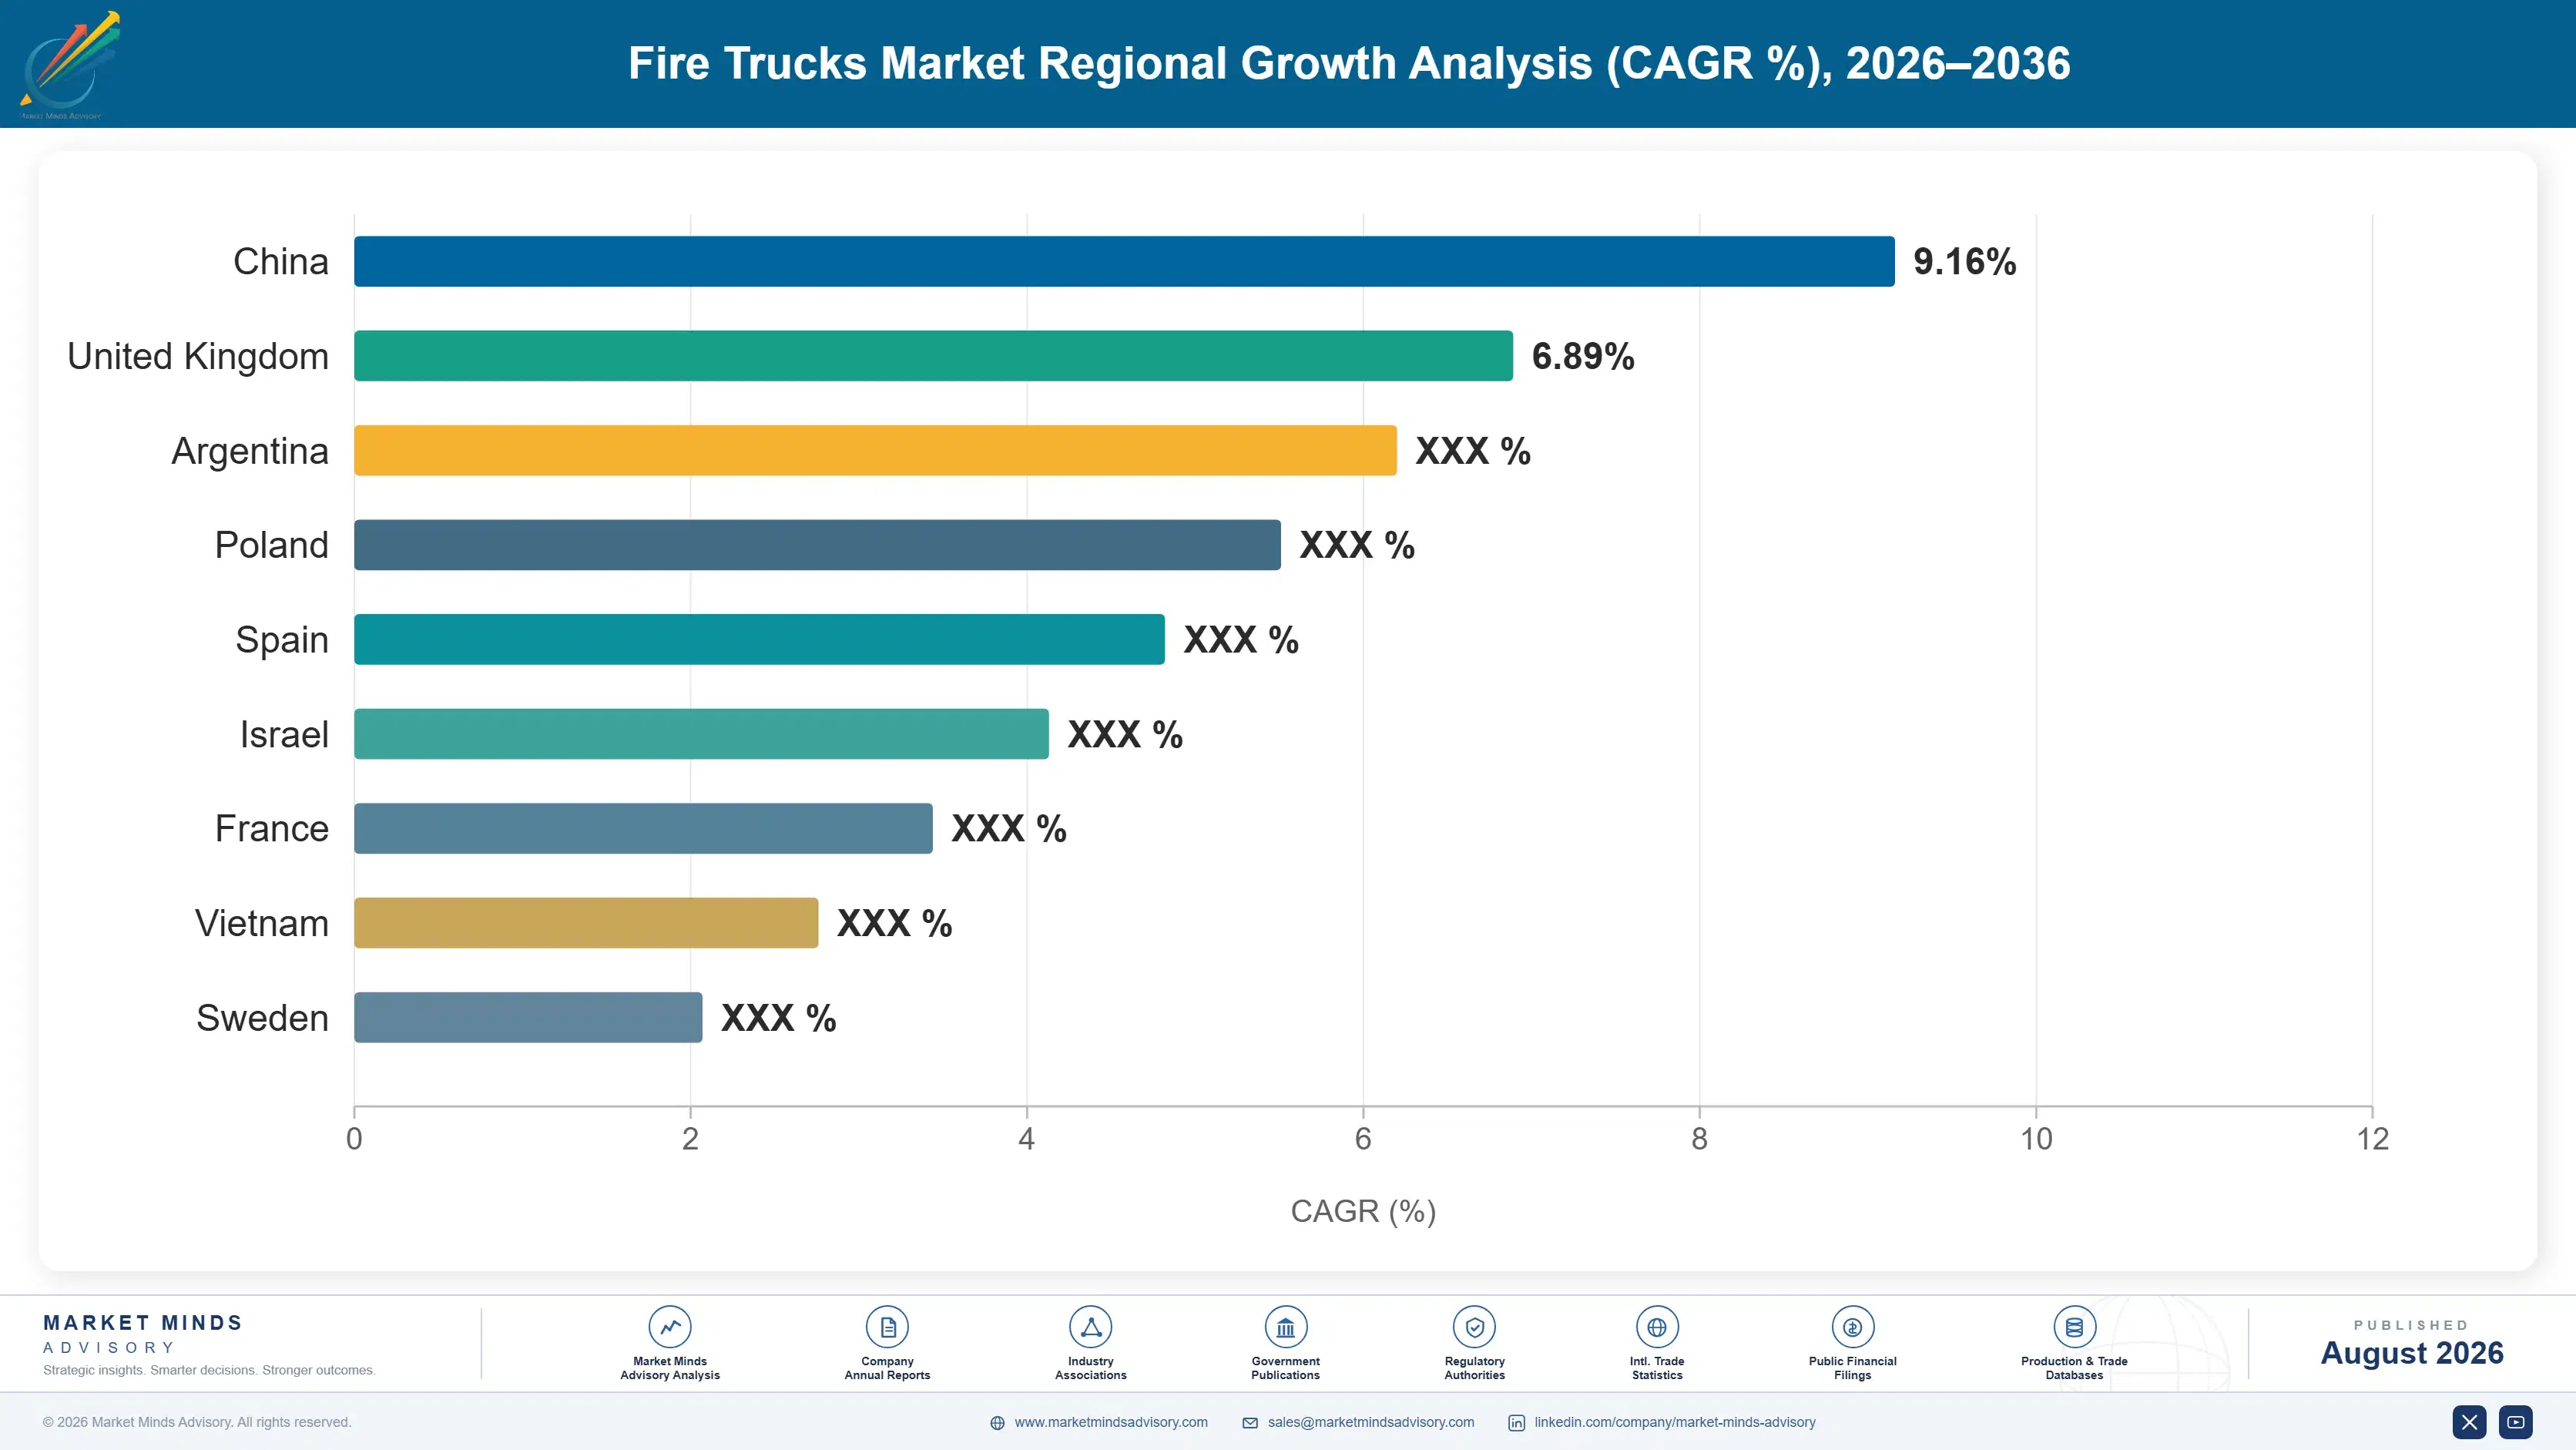
Regional intelligence for 5 additional markets available in the complete report: East Asia, South Asia and Pacific, Latin America, Middle East and Africa, Eastern Europe. Contact sales@marketmindsadvisory.com.
fire-trucks-market-country-cagr-analysis-1787551331586

Four Moves While the Backlog Holds

Advantage here comes from converting backlog into delivered units, from engineering positions competitors cannot match, and from revenue that continues long after the vehicle leaves the factory. Four moves justify capital across the forecast period, and the first decides whether the current pricing environment leaves anything permanent behind. Most builders are only thinking about the first.

Convert backlog into throughput, not just price

Waits near 38 months handed manufacturers pricing power for the first time in decades, and the temptation is to bank it rather than fix the constraint underneath. Departments remember who delivered and who quoted. Investment in assembly throughput, chassis supply security, and configuration standardisation converts a temporary shortage into permanent share, while price increases alone convert it into resentment that surfaces the moment lead times normalise across the industry. Chassis supply security matters as much as assembly hours, since availability rather than price was what stopped deliveries through the disruption. Standardisation helps both at once.
Market Impact: Addresses a delivery backlog running 38 full months

Defend aerial engineering rather than pumper volume

Ladder and platform stability, torsion box design, and the certification behind them limit how many builders can credibly compete, which is where most of the 44% concentration figure actually comes from. Pumpers are contested by many more manufacturers on far thinner terms. A department buying an aerial commits to that manufacturer's service network for 19 years, which makes the sale considerably stickier. Engineering investment here defends margin that pumper volume never will. Certification programmes take years and cost real capital, which is exactly why so few builders have completed one and why the position holds once earned.
Market Impact: Protects the share behind a 44% concentration figure

Build hybrid architecture around the real duty cycle

Pumping at a working fire draws heavy power for hours, and pure battery apparatus cannot sustain it, so credible products pair battery drive for response with combustion for sustained operation. The segment grows at 18.4% from a small base and early adopters have been disappointed by products designed around range rather than pump load. Manufacturers who engineer for the actual operational profile, and who help departments solve station charging, will hold those fleet relationships. Station grid capacity is frequently the harder half of the project, and manufacturers who help solve it join the department's planning rather than its supplier list.
Market Impact: Enters a segment growing 18.4% every single year

Grow service and refurbishment beyond delivery

Aftermarket parts, service, and refurbishment already represent 17% of manufacturer revenue and continue across a 19-year service life at margins delivery rarely matches. Departments deferring replacement under budget pressure are natural refurbishment customers, and the work keeps a manufacturer inside the relationship until the next order. Building genuine service network coverage costs real money and it converts a single transaction into two decades of contact with the people who write the next specification. Departments deferring replacement under budget pressure are refurbishment customers rather than lost sales, which turns a weak capital cycle into service revenue instead.
Market Impact: Service already yields 17% of total manufacturer revenue

Who Controls the Margin Pool

Concentration runs at roughly 44% for the top five on delivery revenue, sustained by chassis engineering and aerial capability rather than by assembly scale. Oshkosh leads through Pierce with the strongest American custom chassis position. REV Group covers multiple brands and price points across North America. Rosenbauer holds the broadest international footprint, Magirus anchors European aerials, and Morita leads Japan with technically sophisticated products.
Competition runs on three dimensions. Delivery date is the first while backlogs hold, and it has displaced price as the decisive factor on most municipal tenders. Aerial engineering is the second, since few builders can certify a platform credibly. Service network coverage is the third, because a department is committing to 19 years of support rather than a vehicle.

Pressure is building from two directions. Regional builders in China, India, and the Gulf compete effectively on commercial chassis platforms at prices international manufacturers cannot approach. Electrification is opening a technical contest where incumbency counts for less than usual. Rankings will shift toward manufacturers who convert current backlog into throughput rather than purely into price. Delivery performance during the shortage will decide more of that than anything else.
fire-trucks-market-company-positioning-matrix-1787551332109

Competitive Moat and Risk Dimensions

OSHKOSH

Moat: Custom chassis design authority

Pierce custom chassis are engineered specifically for firefighting rather than adapted from commercial trucks, and American departments write specifications around exactly that capability. Decades of fire chief relationships mean tender documents frequently describe a Pierce product without naming it. Service network density across North America supports a 19-year ownership commitment that competitors with thinner coverage cannot credibly promise.
OSHKOSH

Risk: Concentration in one market

The custom chassis proposition only commands its premium where departments will pay for it, which is essentially North America and nowhere else at scale. International expansion means competing on commercial chassis platforms where the engineering advantage largely disappears. Any softening of American municipal capital budgets hits the business without a geographic offset available anywhere.
ROSENBAUER

Moat: International reach and electric platform

Rosenbauer sells across more markets than any competitor and adapts to local chassis practice rather than requiring departments to accept one construction philosophy. Its electric apparatus platform reached serious municipal orders earlier than most, which builds relationships in a segment growing at 18.4%. Breadth across pumpers, aerials, airport, and wildland reaches almost every category of buyer.
ROSENBAUER

Risk: Thin margins across broad footprint

Serving many markets with locally adapted products carries engineering and support cost that a single-market specialist avoids entirely, and margins have reflected that pressure. Competing against regional builders on commercial chassis platforms leaves limited room in exactly the markets where growth is fastest. Electric development spending sits against volumes that remain small in absolute unit terms.

Players Tracked

Prominent Players

Oshkosh
REV Group
Rosenbauer
Magirus
Morita Holdings

Other Key Players

Ziegler
Bronto Skylift
Gimaex
BAI Brescia Antincendi
Sides
Angloco
Seagrave
WS Darley
HME Ahrens-Fox
NAFFCO
Iturri
Tatra Trucks
Shanghai Jinhou
Hubei Jiangnan Special Vehicle
Bristol Fire Engineering

Recent Developments

JANUARY 2025

Department orders apparatus before budget approval to hold slot

A North American municipal fire service placed an apparatus order ahead of formal council budget approval purely to secure a production slot, accepting a standard configuration rather than its usual specification. Waiting for approval would have added more than a year to delivery. Configuration flexibility was surrendered deliberately.
Signal: Delivery date has now displaced both price and specification as the decisive factor in municipal apparatus procurement
MAY 2025

European city commits to hybrid apparatus fleet order

A Western European city ordered a fleet of hybrid drive pumpers combining battery response with combustion pumping, alongside station charging infrastructure funded separately. Pure battery apparatus had been evaluated and rejected on sustained pump duty rather than on any response range concern. Range had never been the issue.
Signal: Sustained duty cycle rather than driving range is what determines whether electric apparatus is operationally credible anywhere
SEPTEMBER 2025

Forestry agency contracts multi-year wildland apparatus fleet

A national forestry agency contracted a multi-year wildland apparatus supply programme covering high clearance pump-and-roll vehicles, citing fire seasons that now extend across most of the year. Municipal structural apparatus had proved unsuitable for the terrain and operational profile involved. Single-unit replacement purchasing had proved entirely inadequate.
Signal: Wildland procurement is becoming programme-based fleet buying rather than the occasional single-unit replacement it has always been

What Builds Into the Price

Chassis represents the largest single line, running near 34% of build cost on commercial platforms and considerably more where a purpose-designed cab-forward unit is specified. Pumps, valves, and water handling take a further 17%, sourced from Waterous, Hale, and Rosenbauer's own manufacture. Aerial devices on ladder apparatus carry their own substantial cost. Skilled assembly labour absorbs 21% across a build measured in weeks.
Chassis and component availability constrained deliveries severely through 2021 and into 2023, and manufacturers holding fixed-price municipal contracts written before the disruption absorbed cost increases they had no mechanism to recover. Oshkosh and REV Group both discussed supply constraints and pricing actions in their reporting for those years. Skilled assembly labour tightened at the same time, and apparatus building is difficult work to staff quickly at any wage.

Exposure divides on contract structure rather than on scale. Manufacturers holding firm-price municipal orders across delivery periods now measured in years carry the entire input risk, which is precisely what damaged margins through the disruption. Those who introduced escalation or index clauses after 2022 recovered position considerably faster. Regional builders on commercial chassis carry less exposure, since the chassis is a purchased commodity rather than an engineered product.
fire-trucks-market-cost-volatility-analysis-1787551332305

Write escalation clauses into long-delivery contracts

Municipal orders taking 38 months to deliver were routinely priced firm at signature, which transferred three years of input risk to the manufacturer for nothing in return. Escalation tied to published chassis and steel references removes that mismatch, and departments accept it more readily than expected once explained properly. Firm pricing on multi-year delivery is a position nobody chose.

Standardise configurations to compress assembly labour

Skilled assembly at 21% of build cost is the hardest input to expand, since apparatus building takes years to train and cannot be staffed quickly at any wage offered. Configuration standardisation cuts hours per unit and improves throughput without adding people. Departments accepting standard builds already get earlier delivery slots, which aligns the customer incentive with the manufacturing one neatly.

Secure chassis supply through multi-year commitments

Chassis at roughly 34% of build cost is the input that stopped deliveries during the disruption, and availability rather than price was the binding constraint throughout. Multi-year volume commitments with chassis suppliers secure allocation when supply tightens again. Manufacturers building their own custom chassis avoid this exposure entirely, which was worth considerably more than anybody had priced beforehand.

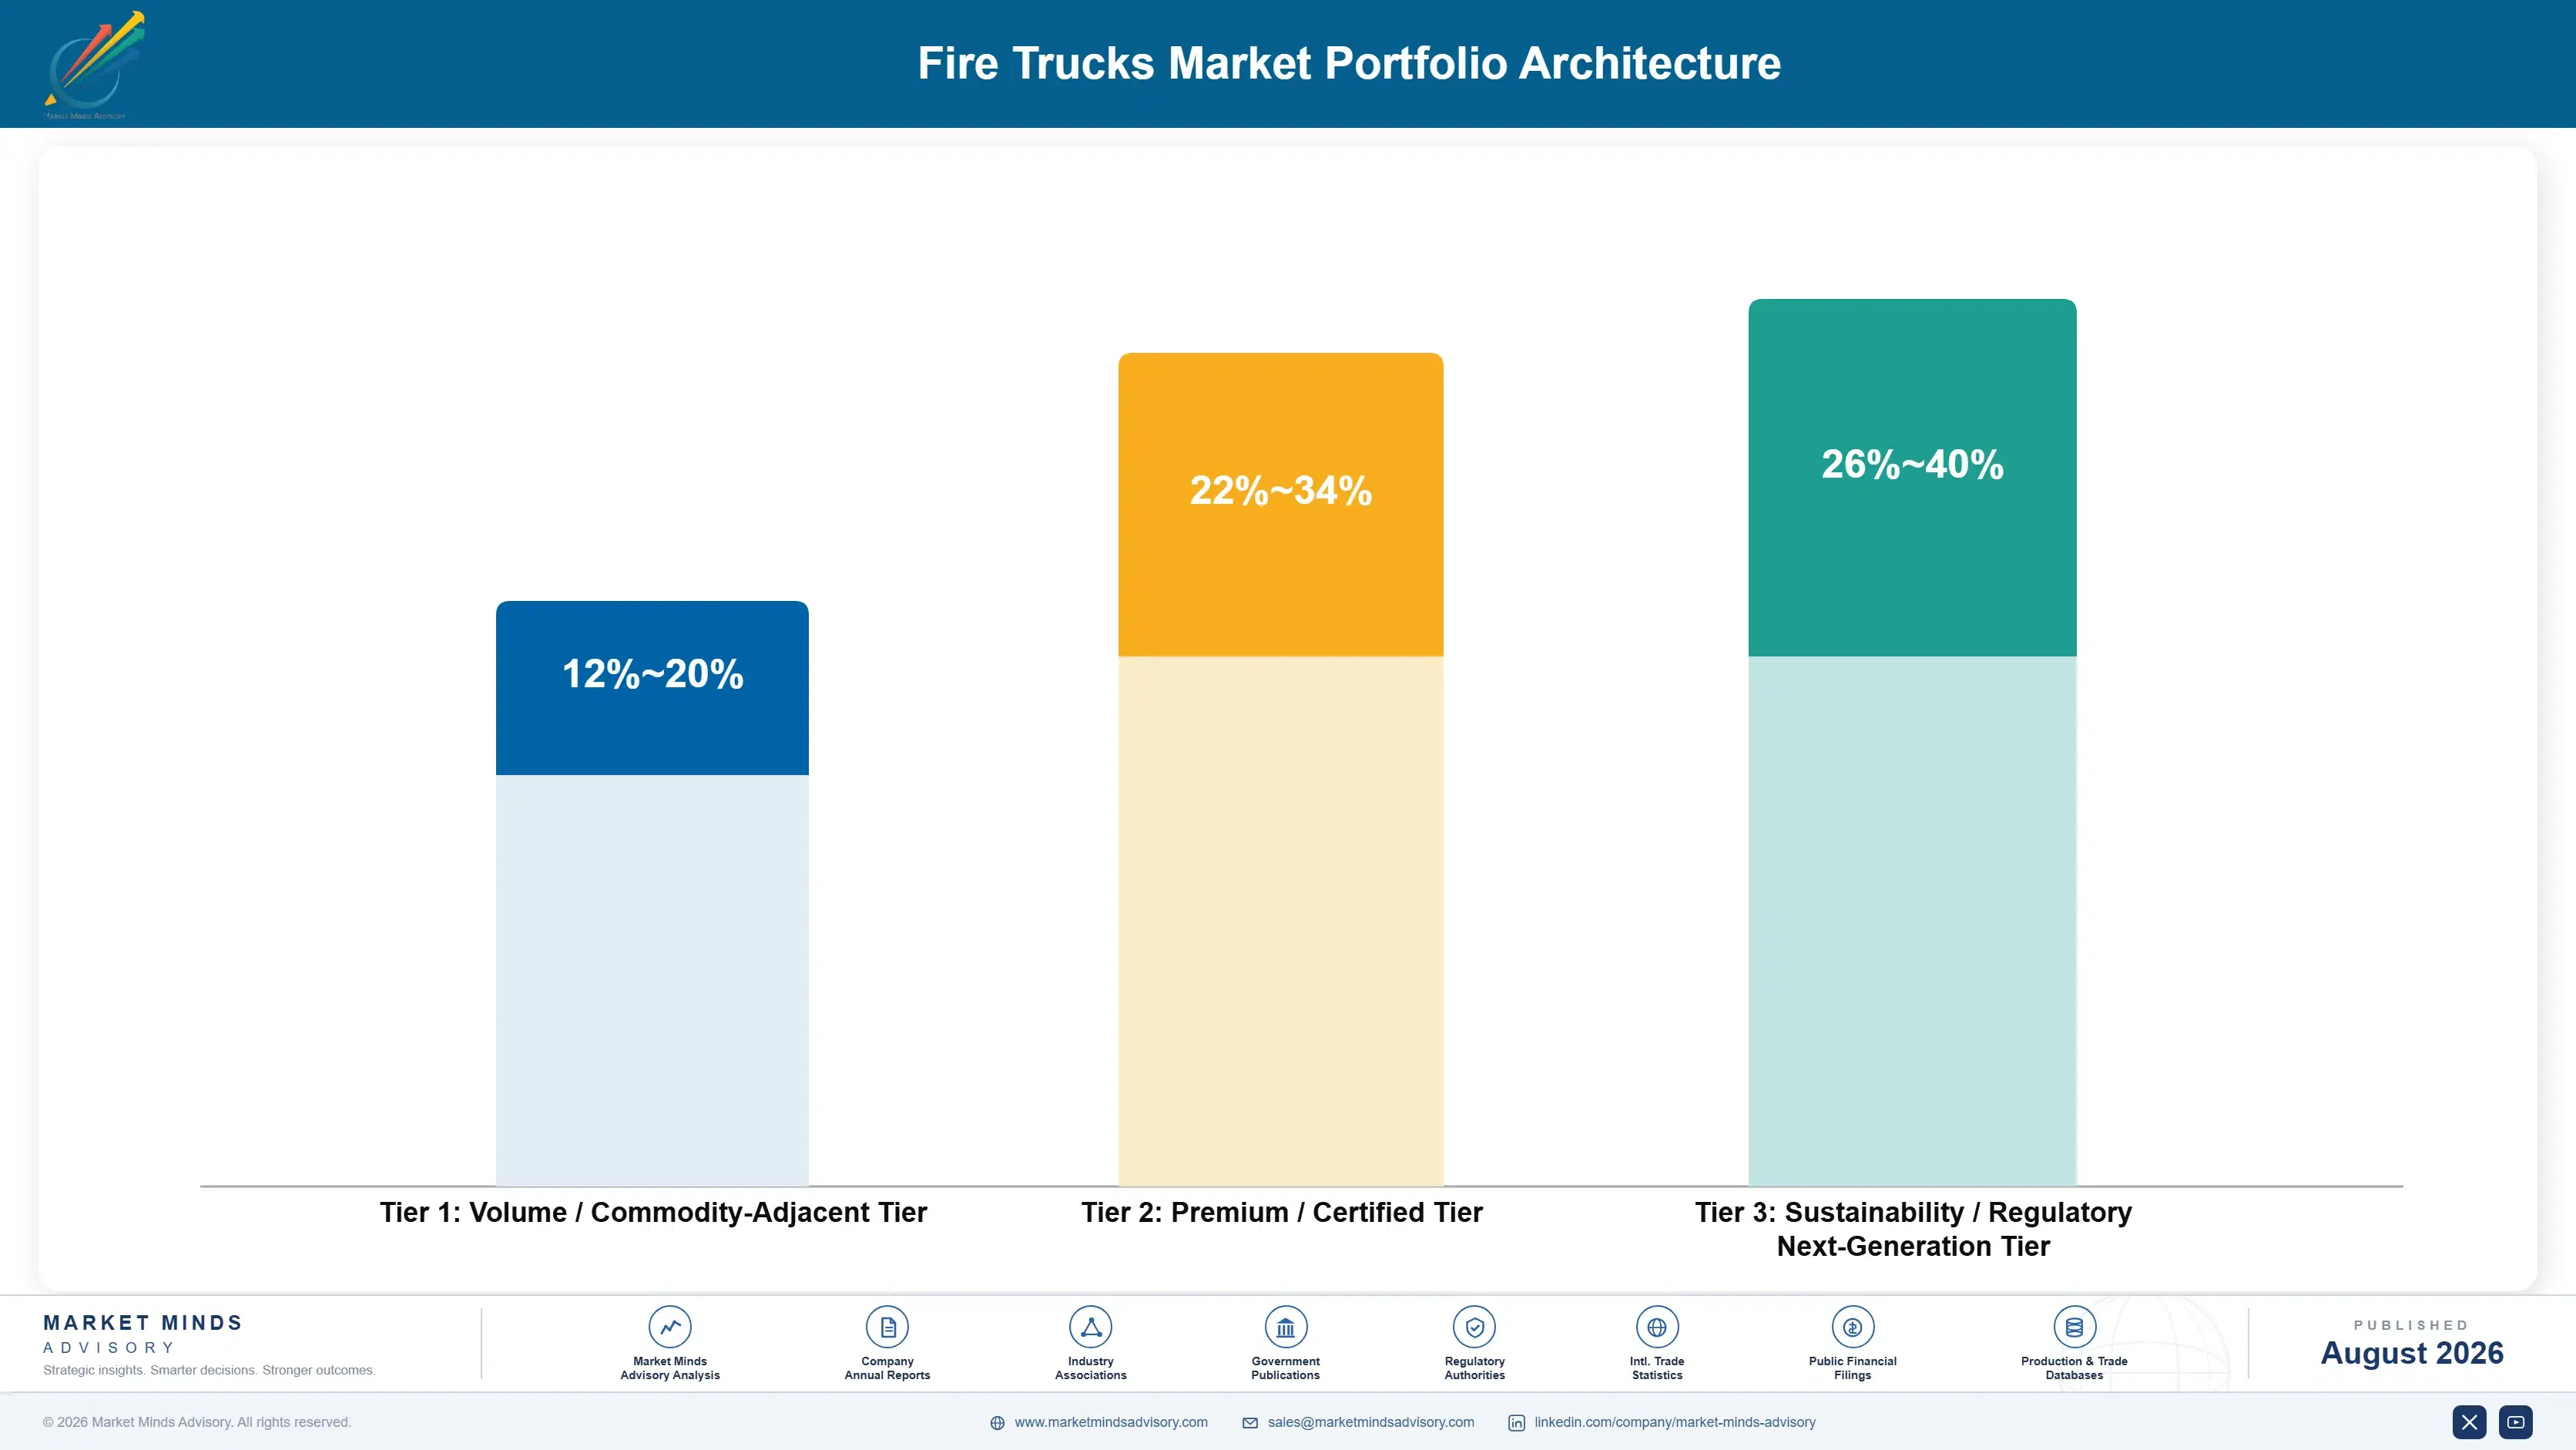
Portfolio Architecture for Margin Defence

Margin architecture follows engineering barrier rather than unit price, which is why the most expensive vehicles are not always the most profitable ones. Pumpers on commercial chassis are contested by many builders and earn accordingly, however large the order. Custom chassis apparatus earns more because the specification was written around it. Aerials earn well on certification difficulty, and service revenue earns best of all across a 19-year life.
The volume and premium tension currently sits inside the backlog. Manufacturers can bank price on a 38-month wait or invest in throughput that converts the shortage into permanent share, and the two paths diverge sharply once lead times normalise. Departments remember delivery performance long after they forget a quotation. Very few builders appear to be modelling that trade-off explicitly rather than simply enjoying the moment.

High-value pools concentrate in aerial engineering, custom chassis positions where specification culture supports them, and aftermarket service across two decades of ownership. Each is defended by certification, relationship, or network coverage rather than by assembly cost, which is the one thing regional builders can genuinely undercut anywhere they operate. Assembly cost is the one advantage nobody in this industry can defend.

Volume / Commodity-Adjacent Tier

Pumper and rescue bodies mounted on commercial chassis, contested by many builders including strong regional competitors. Assembly cost and delivery date decide outcomes. Nothing in the engineering defends the position for long.
Gross Margin: 12%-20%

Premium / Certified Tier

Custom chassis apparatus and certified aerial ladder or platform vehicles where engineering barriers limit credible competition. Specification culture and 19-year service commitments defend pricing. The range reflects wide differences between chassis and aerial economics.
Gross Margin: 22%-34%

Sustainability / Regulatory / Next-Generation Tier

Hybrid and electric drive apparatus, airport rescue vehicles, and specialised wildland platforms carrying distinct engineering and certification requirements. Early positions build long relationships. The range is wide because electric and airport economics differ substantially.
Gross Margin: 26%-40%
fire-trucks-market-portfolio-architecture-1787551332806

High-value Sub-segments and Strategic Watch-out

Aerial Ladder and Platform Engineering

Certification, stability calculation, and torsion box design limit credible competitors sharply, and a department commits to that manufacturer's service network for 19 years. Most of the concentration figure originates here rather than in pumper volume. Pumper volume offers no comparable barrier to anybody entering the market.
Gross Margin: 24%-34%

Aftermarket Service and Refurbishment

Already 17% of manufacturer revenue and continuing across a two-decade service life at margins delivery rarely matches. Departments deferring replacement under budget pressure are natural refurbishment customers and stay inside the relationship. Building genuine network coverage costs capital and keeps the manufacturer near the next specification.
Gross Margin: 30%-44%

Hybrid and Electric Apparatus

Growing at 18.4% from a small base, with duty cycle rather than driving range deciding operational credibility. Early fleet relationships in air quality committed cities will shape who supplies those departments for decades. Station grid capacity is frequently the harder half of any such fleet project.
Gross Margin: 26%-40%

Commercial Chassis Pumper Bodies

The strategic watch-out. Regional builders in China, India, and the Gulf compete effectively at prices international manufacturers cannot approach, and nothing in the engineering creates any defensible separation between them. Used American apparatus arriving through dealers and donations competes for exactly the same municipal budgets.
Gross Margin: 12%-20%

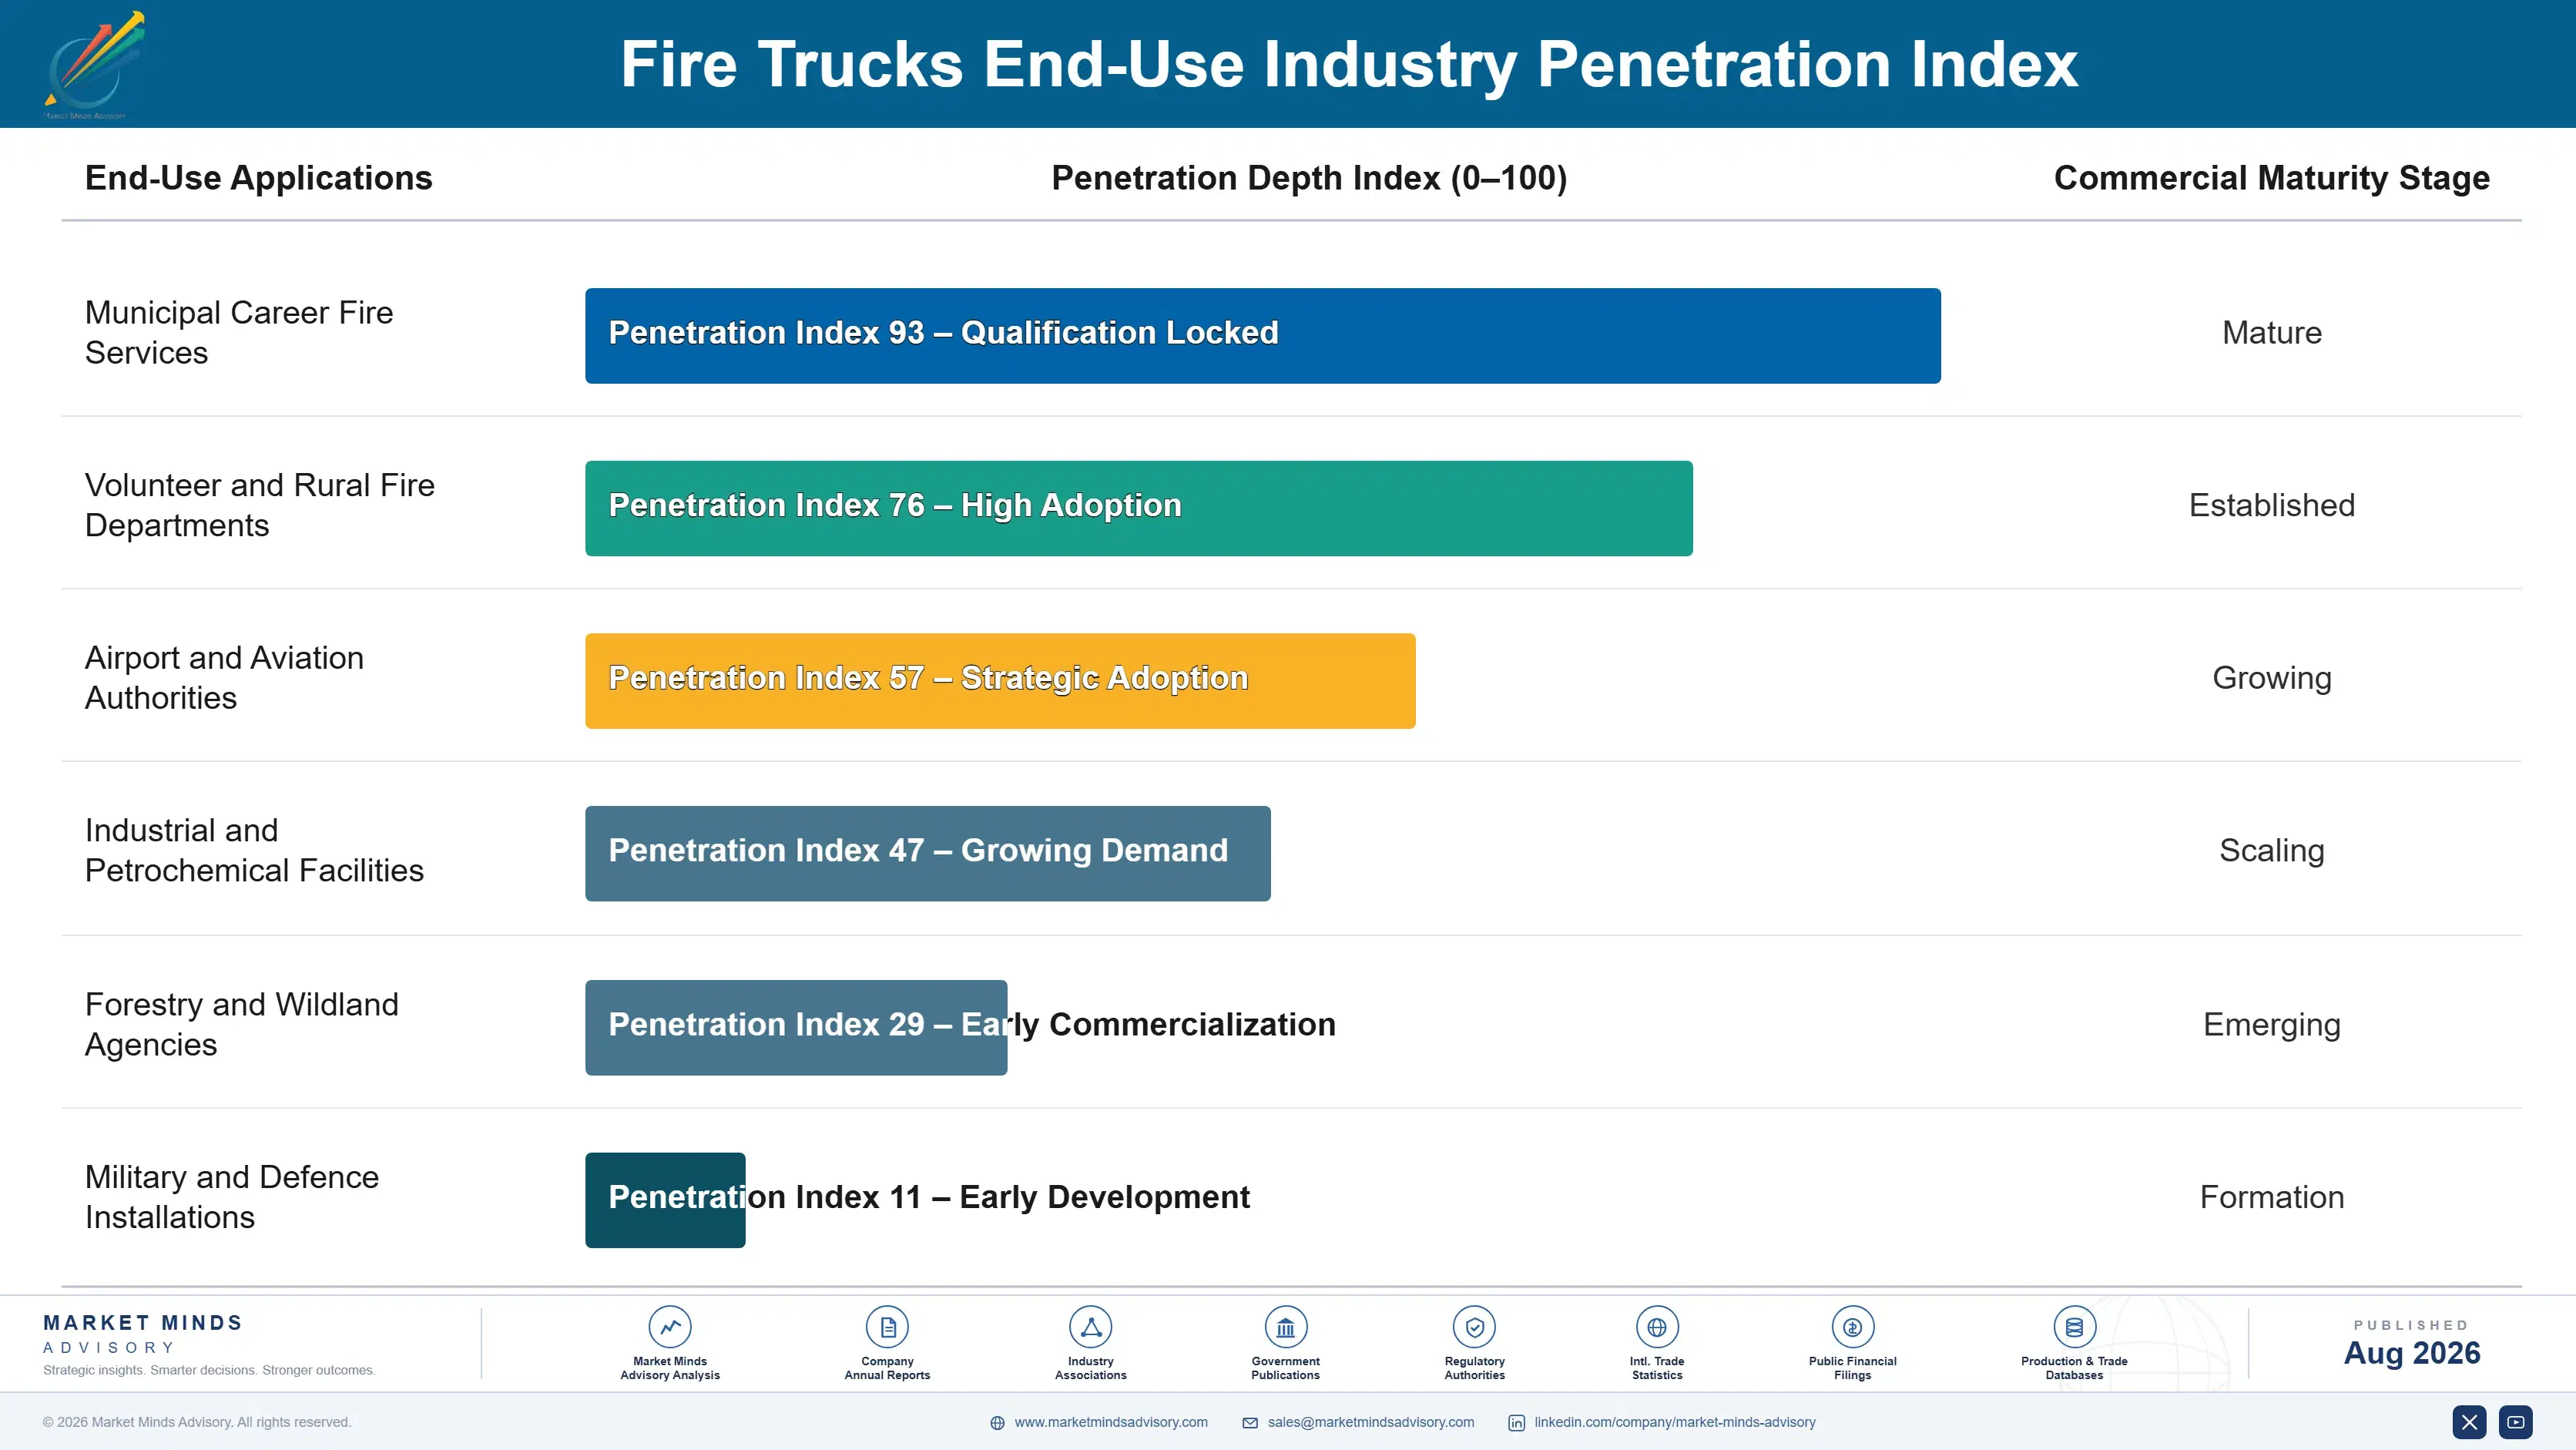
How Apparatus Orders Arrive

Demand reaches manufacturers through a process almost nobody outside the fire service understands properly. A chief identifies a replacement need, an apparatus committee of serving firefighters writes a specification frequently modelled on a vehicle they already like, the municipality funds it through capital budget or bond issue, and a tender follows that the specification has often already decided. Backlog changed the last step, since delivery date now overrides compliance detail in most evaluations.
Stickiness runs deeper here than in almost any vehicle market. A department that has run one manufacturer's apparatus for thirty years has trained its mechanics, stocked its parts, and written its specifications accordingly. Aerials hold hardest on service network dependency. Commercial chassis pumper bodies hold least, because the body builder is genuinely interchangeable.

The deciding buyer is a serving firefighter on an apparatus committee rather than a procurement officer, which is unusual and consequential. Those people evaluate hose bed height, pump panel layout, and how the cab feels at three in the morning. Manufacturers who sell to purchasing departments and skip the committee lose tenders they had already technically won. That mistake is made repeatedly and it is entirely avoidable.
fire-trucks-market-end-use-penetration-index-1787551333304

What the Backlog Leaves Behind

These are among the four positions where our research anticipates prominent divergence between winners and laggards over the coming forecast period. Each is grounded in the demand model, the regulatory perimeter, and the announced capacity pipeline.
01 / THROUGHPUT CONVERSION DISCIPLINE

Bank capacity from this shortage, not only price

Waits approaching 38 months handed manufacturers pricing power for the first time in decades, and the easy response is to take the margin rather than fix the constraint producing it in the first place. Departments remember who delivered on a promised date far longer than they remember what anybody quoted, and lead times will eventually normalise across the industry. Investment in assembly throughput, chassis security, and configuration standardisation converts a temporary shortage into permanent share that price increases on their own never will.
02 / AERIAL CERTIFICATION DEFENCE

Protect ladder engineering over pumper unit volume

Stability calculation, torsion box design, and platform certification limit how many builders can credibly offer an aerial, which is where most of the 44% top-five concentration figure genuinely originates from in practice. Pumpers are contested by many more manufacturers on considerably thinner terms with no comparable barrier to entry at all. A department buying an aerial commits to that manufacturer's service network for a 19-year ownership life, which makes the relationship far stickier than any pumper sale is ever likely to become.
03 / DUTY CYCLE ENGINEERING

Design electric apparatus around pumping, not range

An engine pumping at a working fire draws heavy power for hours, which no practical battery pack sustains, so every credible electric apparatus pairs battery drive for response with combustion for sustained operation on scene. The segment grows at 18.4% from a small base, and early adopters have been disappointed by products engineered around driving range rather than pump load. Manufacturers who build for the real operational profile, and who help departments solve station charging, will hold those fleet relationships.
04 / SERVICE NETWORK EXTENSION

Own the nineteen years after delivery day

Aftermarket parts, service, and refurbishment already generate 17% of manufacturer revenue at margins that vehicle delivery rarely matches, and it continues across a service life averaging some 19 years for every unit. Departments deferring replacement under municipal budget pressure become natural refurbishment customers rather than sales lost to a competitor entirely. Genuine service network coverage costs real capital and it keeps a manufacturer in contact with exactly the people who will write the specification for the next apparatus order after that.

Engagement Snapshot From the Field

A live engagement with an industry participant carrying material or product regulatory and market exposure ahead of a defining policy shift, showing how our research translates into a defensible multi-year portfolio strategy.
MARKET MINDS ADVISORY · CLIENT ENGAGEMENT SUMMARY
Fire Trucks Producer Strategic Portfolio Review and Transition Roadmap 2026·Investment Scenario on Fire Trucks Exposure Evaluation 2025-26
CLIENT PROFILE
A European fire apparatus manufacturer with revenue near EUR 240 million (client-reported, unverified by MMA), building pumper and rescue bodies on commercial chassis for municipal and volunteer services across several countries. Aerial capability was limited to a licensed platform, no electric product existed, and margins had compressed for four consecutive years running. Service was handled entirely by others.
STRATEGIC CHALLENGE
Regional builders were winning volume tenders on commercial chassis bodies at prices the client could not match, and the licensed aerial arrangement gave it no engineering position of its own. Two municipal electric fleet tenders had been lost outright. Aftermarket service was handled by third-party workshops entirely. Nothing in the portfolio was genuinely defensible.
MMA APPROACH
MMA analysed win and loss rates by apparatus type and tender structure, assessed aerial engineering investment against the licensing arrangement, and modelled aftermarket service network economics across the installed base. Forty-seven expert interviews with fire chiefs, apparatus committee members, and municipal procurement officers established how tenders are genuinely decided. Tender documents from five years were reviewed line by line.
KEY FINDINGS
  1. Every tender lost on price involved a commercial chassis body that three regional builders could construct equally well, and every win involved something those builders could not certify.
  2. The licensed aerial platform generated volume without any engineering position, and the licensor was quietly selling directly into two of the client's own national markets.
  3. Both electric tenders were lost on sustained pump duty rather than driving range, and the winning products were hybrids the client had dismissed as compromised engineering.
  4. Third-party workshops were capturing service revenue across an installed base of more than two thousand vehicles, and the client had no contact with those departments between orders.
CLIENT PROFILE
A European fire apparatus manufacturer with revenue near EUR 240 million (client-reported, unverified by MMA), building pumper and rescue bodies on commercial chassis for municipal and volunteer services across several countries. Aerial capability was limited to a licensed platform, no electric product existed, and margins had compressed for four consecutive years running. Service was handled entirely by others.
STRATEGIC CHALLENGE
Regional builders were winning volume tenders on commercial chassis bodies at prices the client could not match, and the licensed aerial arrangement gave it no engineering position of its own. Two municipal electric fleet tenders had been lost outright. Aftermarket service was handled by third-party workshops entirely. Nothing in the portfolio was genuinely defensible.
MMA APPROACH
MMA analysed win and loss rates by apparatus type and tender structure, assessed aerial engineering investment against the licensing arrangement, and modelled aftermarket service network economics across the installed base. Forty-seven expert interviews with fire chiefs, apparatus committee members, and municipal procurement officers established how tenders are genuinely decided. Tender documents from five years were reviewed line by line.
KEY FINDINGS
  1. Every tender lost on price involved a commercial chassis body that three regional builders could construct equally well, and every win involved something those builders could not certify.
  2. The licensed aerial platform generated volume without any engineering position, and the licensor was quietly selling directly into two of the client's own national markets.
  3. Both electric tenders were lost on sustained pump duty rather than driving range, and the winning products were hybrids the client had dismissed as compromised engineering.
  4. Third-party workshops were capturing service revenue across an installed base of more than two thousand vehicles, and the client had no contact with those departments between orders.
RECOMMENDED STRATEGY
Phase 1: Phase one: build owned aerial engineering capability rather than renewing the licence, targeting the certification barrier that regional builders genuinely cannot cross. Phase 2: Phase two: develop a hybrid apparatus platform engineered around sustained pump duty, since range-focused pure battery products keep losing municipal tenders. Phase 3: Phase three: establish direct service network coverage across the installed base, converting single deliveries into contact through a nineteen-year ownership cycle.
OUTCOME
The client began aerial development and declined licence renewal, and a hybrid platform entered testing within a year. Direct service coverage reached a third of the installed base, blended gross margin improved 5.4 percentage points, and one electric fleet tender was won (client-reported, unverified by MMA).

Frequently Asked Questions

Foundational context covering the market sizes, CAGR, scope, country, region and competition that inform every finding below. This section is provided to cover basics and most often pre-purchase conversations, answered from the MMA Primary Research Dataset.

What is the current size of the Fire Trucks Market?

The market was valued at USD 8.6 billion in 2025, rising to an estimated USD 9.08 billion in 2026. North America holds the largest regional share at 34% of value.

How large will the Fire Trucks Market be by 2036?

MMA forecasts USD 15.66 billion by 2036 under the base case, an expansion multiple of 1.72 times the 2026 value. That represents USD 6.58 billion of incremental value.

What is the CAGR for the Fire Trucks Market 2026 to 2036?

The base case CAGR is 5.6%, with a bull case of 6.8% and a bear case of 4.4%. The spread reflects uncertainty over municipal budgets and backlog conversion rates.

Which segment is growing fastest?

Electric and alternative drive apparatus grows fastest at 18.4%, roughly 3.29 times the market rate, from a small base. Wildland and brush apparatus follows at 9.6%.

Who are the major companies in the Fire Trucks Market?

Oshkosh, REV Group, Rosenbauer, Magirus, and Morita Holdings lead, holding roughly 44% between them. Chassis engineering and aerial certification sustain that concentration rather than assembly scale.

Which country is growing fastest?

India grows fastest at 8.6%, as municipal fire services expand with urban development and high-rise construction outpaces the reach of existing aerial fleets in most cities.

Report Segmentation Architecture

The full report scope spans multiple orthogonal segmentation dimensions, with cross-tabulated demand data provided for each dimension pair. Coverage extends further to regional breakdowns, trend trajectories, and the competitive detail needed to support segment-level decision-making.

By Apparatus Type

  • Pumper and Engine Apparatus
  • Aerial Ladder and Platform Apparatus
  • Heavy Rescue and Squad Apparatus
  • Airport Rescue and Firefighting Vehicles
  • Wildland and Brush Apparatus
  • Electric and Alternative Drive Apparatus

By End-Use Industry

  • Municipal Career Fire Services
  • Volunteer and Rural Fire Departments
  • Airport and Aviation Authorities
  • Industrial and Petrochemical Facilities
  • Forestry and Wildland Agencies
  • Military and Defence Installations

By Sales Model

  • Competitive Municipal Tender
  • Multi-Year Fleet Supply Programmes
  • Dealer and Distributor Networks
  • Lease and Financing Arrangements
  • Direct Government Procurement Contracts

By Region

  • North America
  • Western Europe
  • East Asia
  • South Asia and Pacific
  • Latin America
  • Middle East and Africa
  • Eastern Europe

Scope, Methodology, and Coverage

Every figure in this report is reproducible from documented input assumptions. The scope below maps the historical period, the forecast horizon, the segmentation dimensions, and the countries covered, alongside the underlying primary and qualitative methodology.
Historical Period
2020 to 2025
Forecast Period
2026 to 2036
Base Year
2025 (USD billions; MMA Primary Research Dataset, August 2026)
Market Definition
The market comprises purpose-built firefighting apparatus delivered to fire services and industrial operators, covering pumper and engine apparatus, aerial ladder and platform apparatus, heavy rescue and squad apparatus, airport rescue and firefighting vehicles, wildland and brush apparatus, and electric or alternative drive apparatus. Value is measured at manufacturer level on delivered units together with attached parts, service, and refurbishment. Standalone chassis supply, portable pumps and hoses sold separately, personal protective equipment, ambulances and other emergency medical vehicles, fire station equipment, and fixed suppression systems fall outside scope.
Quantitative Units
USD billions (current prices); thousand apparatus units delivered annually; USD per unit by apparatus type and chassis construction
Segmentation Dimensions
By Apparatus Type; By End-Use Industry; By Sales Model; By Region
Regions Covered
North America, Western Europe, East Asia, South Asia and Pacific, Latin America, Middle East and Africa, Eastern Europe
Countries Covered
United States, Canada, Mexico, Germany, France, United Kingdom, Italy, Spain, Netherlands, Austria, Sweden, Finland, Poland, Czechia, Romania, Hungary, China, Japan, South Korea, Taiwan, India, Australia, Indonesia, Thailand, Brazil, Chile, Colombia, Saudi Arabia, United Arab Emirates, South Africa
Key Companies Profiled
Oshkosh, REV Group, Rosenbauer, Magirus, Morita Holdings, Ziegler, Bronto Skylift, Gimaex, BAI Brescia Antincendi, Sides, Angloco, Seagrave, WS Darley, HME Ahrens-Fox, NAFFCO, Iturri, Tatra Trucks, Shanghai Jinhou, Hubei Jiangnan Special Vehicle, Bristol Fire Engineering
Quantitative Methodology
Primary survey, n=3,800 respondents, Q4 2025, six countries; demand-side model with trade association cross-validation
Qualitative Methodology
47 expert interviews, Q4 2025; applied to validate demand model assumptions, identify emerging dynamics, and assess competitive positioning
Report Format
PDF and XLSX data workbook (Word format preview document)
Publisher
Market Minds Advisory
Report Code
MMA-2026-AUT-247
Published
August 2026
Contact
sales@marketmindsadvisory.com | www.marketmindsadvisory.com

Purchase the full Fire Trucks Market Report (2026 to 2036).

The full report sizes fire apparatus demand across six vehicle types, six end-use categories, and seven regions with 2026 to 2036 forecasts under base, bull, and bear cases. It separates custom chassis construction from commercial chassis bodies, since unit pricing differs by a factor of several and that difference drives every regional value comparison in the market. Competitive profiles cover twenty manufacturers assessed consistently on delivery revenue, aerial engineering capability, and service network coverage. Cost analysis traces chassis, pump, and assembly labour exposure against contract structure. Commercial guidance addresses throughput conversion, aerial defence, duty cycle engineering, and service extension.
Six apparatus types sized separately by region
Custom chassis separated from commercial chassis construction
Order backlog duration tracked across major manufacturers
Electric apparatus assessed against sustained pumping duty cycles
Aftermarket service capture rates estimated by manufacturer type
Municipal funding mechanisms mapped across procurement regions

Built For The People Who Decide

From boardroom strategy to bench-side execution, this report is read cover-to-cover by leaders shaping the next decade of their industry, turning demand scenarios, market dynamics and valuation benchmarks into decisions.
CXOs/ Presidents/ VPs/ Managers
M&A and Corporate Development
Strategy Teams and R&D Heads
Procurement and Product Directors
Regulatory and Compliance Leaders
Investor Relations and Equity Analysts