Market Minds Advisory
Fine Chemicals Market

Fine Chemicals Market: Regulatory Lock-In, Flow Chemistry Capability, and the Onshoring Premium Nobody Wants to Pay

Once a manufacturing site appears in a drug filing, moving it costs variations, comparability work, and sometimes clinical bridging. That paperwork holds 94% of commercial programmes far better than any pricing ever could.

Lead Analyst

Bilal Shaikh

Published

September 2026

Make Smarter Decisions with Customized Research Insights

Request a free sample report and evaluate market opportunities, growth trends, and competitive dynamics relevant to your business needs.

2025 MARKET VALUE$118.0BMarket Size 2025
2036 FORECAST VALUE$258.8BBase Case , 2026 to 2036
CAGR 2026 TO 20367.4 %Bull 8.6% / Bear 6.2%
INCREMENTAL OPPORTUNITY$132.1BNet 10- year value creation
EXPANSION MULTIPLE2.04x2036 value over 2026 base
Strategic Levers
M&A Pipeline
Regional Outlook
Country Rankings
Competitive Intelligence
Segmental Deep-dive
Call-Us : 91 93563 13602

Executive Snapshot and Market Trajectory

Buyers ask about reactor volume and cost per kilogram, and neither decides anything. What wins a programme is having run the chemistry before, and what keeps it is a site name written into a regulatory filing that costs real money and time to change. Nothing else matters much.
Commercial advantage belongs to manufacturers holding capability nobody else can offer rather than capacity everybody has, because multipurpose reactors are available worldwide at prices Western producers cannot match. Continuous flow and photochemistry grows fastest at 13.6%, roughly 1.84 times the market. East Asia holds the largest position at 30% of value, following Chinese intermediate manufacture that Western supply chains depend on far more than they admit.
Concentration is remarkably low at roughly 18% for the top five, because a competent multipurpose plant can make most molecules and thousands of them exist. Regulatory lock retains 94% of commercial programmes once filed. Onshoring carries a 38% cost premium, which explains why so much of it has been announced and so little completed. Sponsors say they want Western supply and then decline to fund the difference when the quotation actually arrives.
Market Definition
The market comprises fine chemicals manufactured by multistep synthesis and supplied to third parties on specification, covering standard multistep organic synthesis, chiral and asymmetric synthesis, high-potency containment manufacture, continuous flow and photochemistry, biocatalysis and enzymatic routes, and organometallic or cryogenic chemistry. Value is measured at manufacturer level on merchant and contract supply. Captive in-house production by pharmaceutical or agrochemical companies, commodity and bulk chemicals, biologics and cell therapy manufacture, formulation and finished dose production, and laboratory reagent distribution fall outside scope.
Base Year Value
$118.0B in 2025 (MMA Primary Research Dataset, August 2026)
Forecast Period
2026 to 2036, eleven discrete annual values
CAGR
7.4% base case. Bull 8.6%. Bear 6.2%.
Fastest Growth Segment
Continuous Flow and Photochemistry: 13.6% CAGR
Fastest Growth Country
India: 10.2% CAGR
Fastest Growth Region
South Asia and Pacific: 9.6% CAGR
Largest Region
East Asia: 30% of 2025 global value
Market Leaders
Lonza, Siegfried, Cambrex, Divi's Laboratories, and WuXi STA lead on third-party fine chemical manufacturing revenue. Source: company annual reports and MMA Analysis, July 2026.
Primary Survey
n=3,800 procurement and R&D decision-makers, Q4 2025, six countries
Methodology
Demand-side build-up, cross-validated against public data, 47 expert interviews

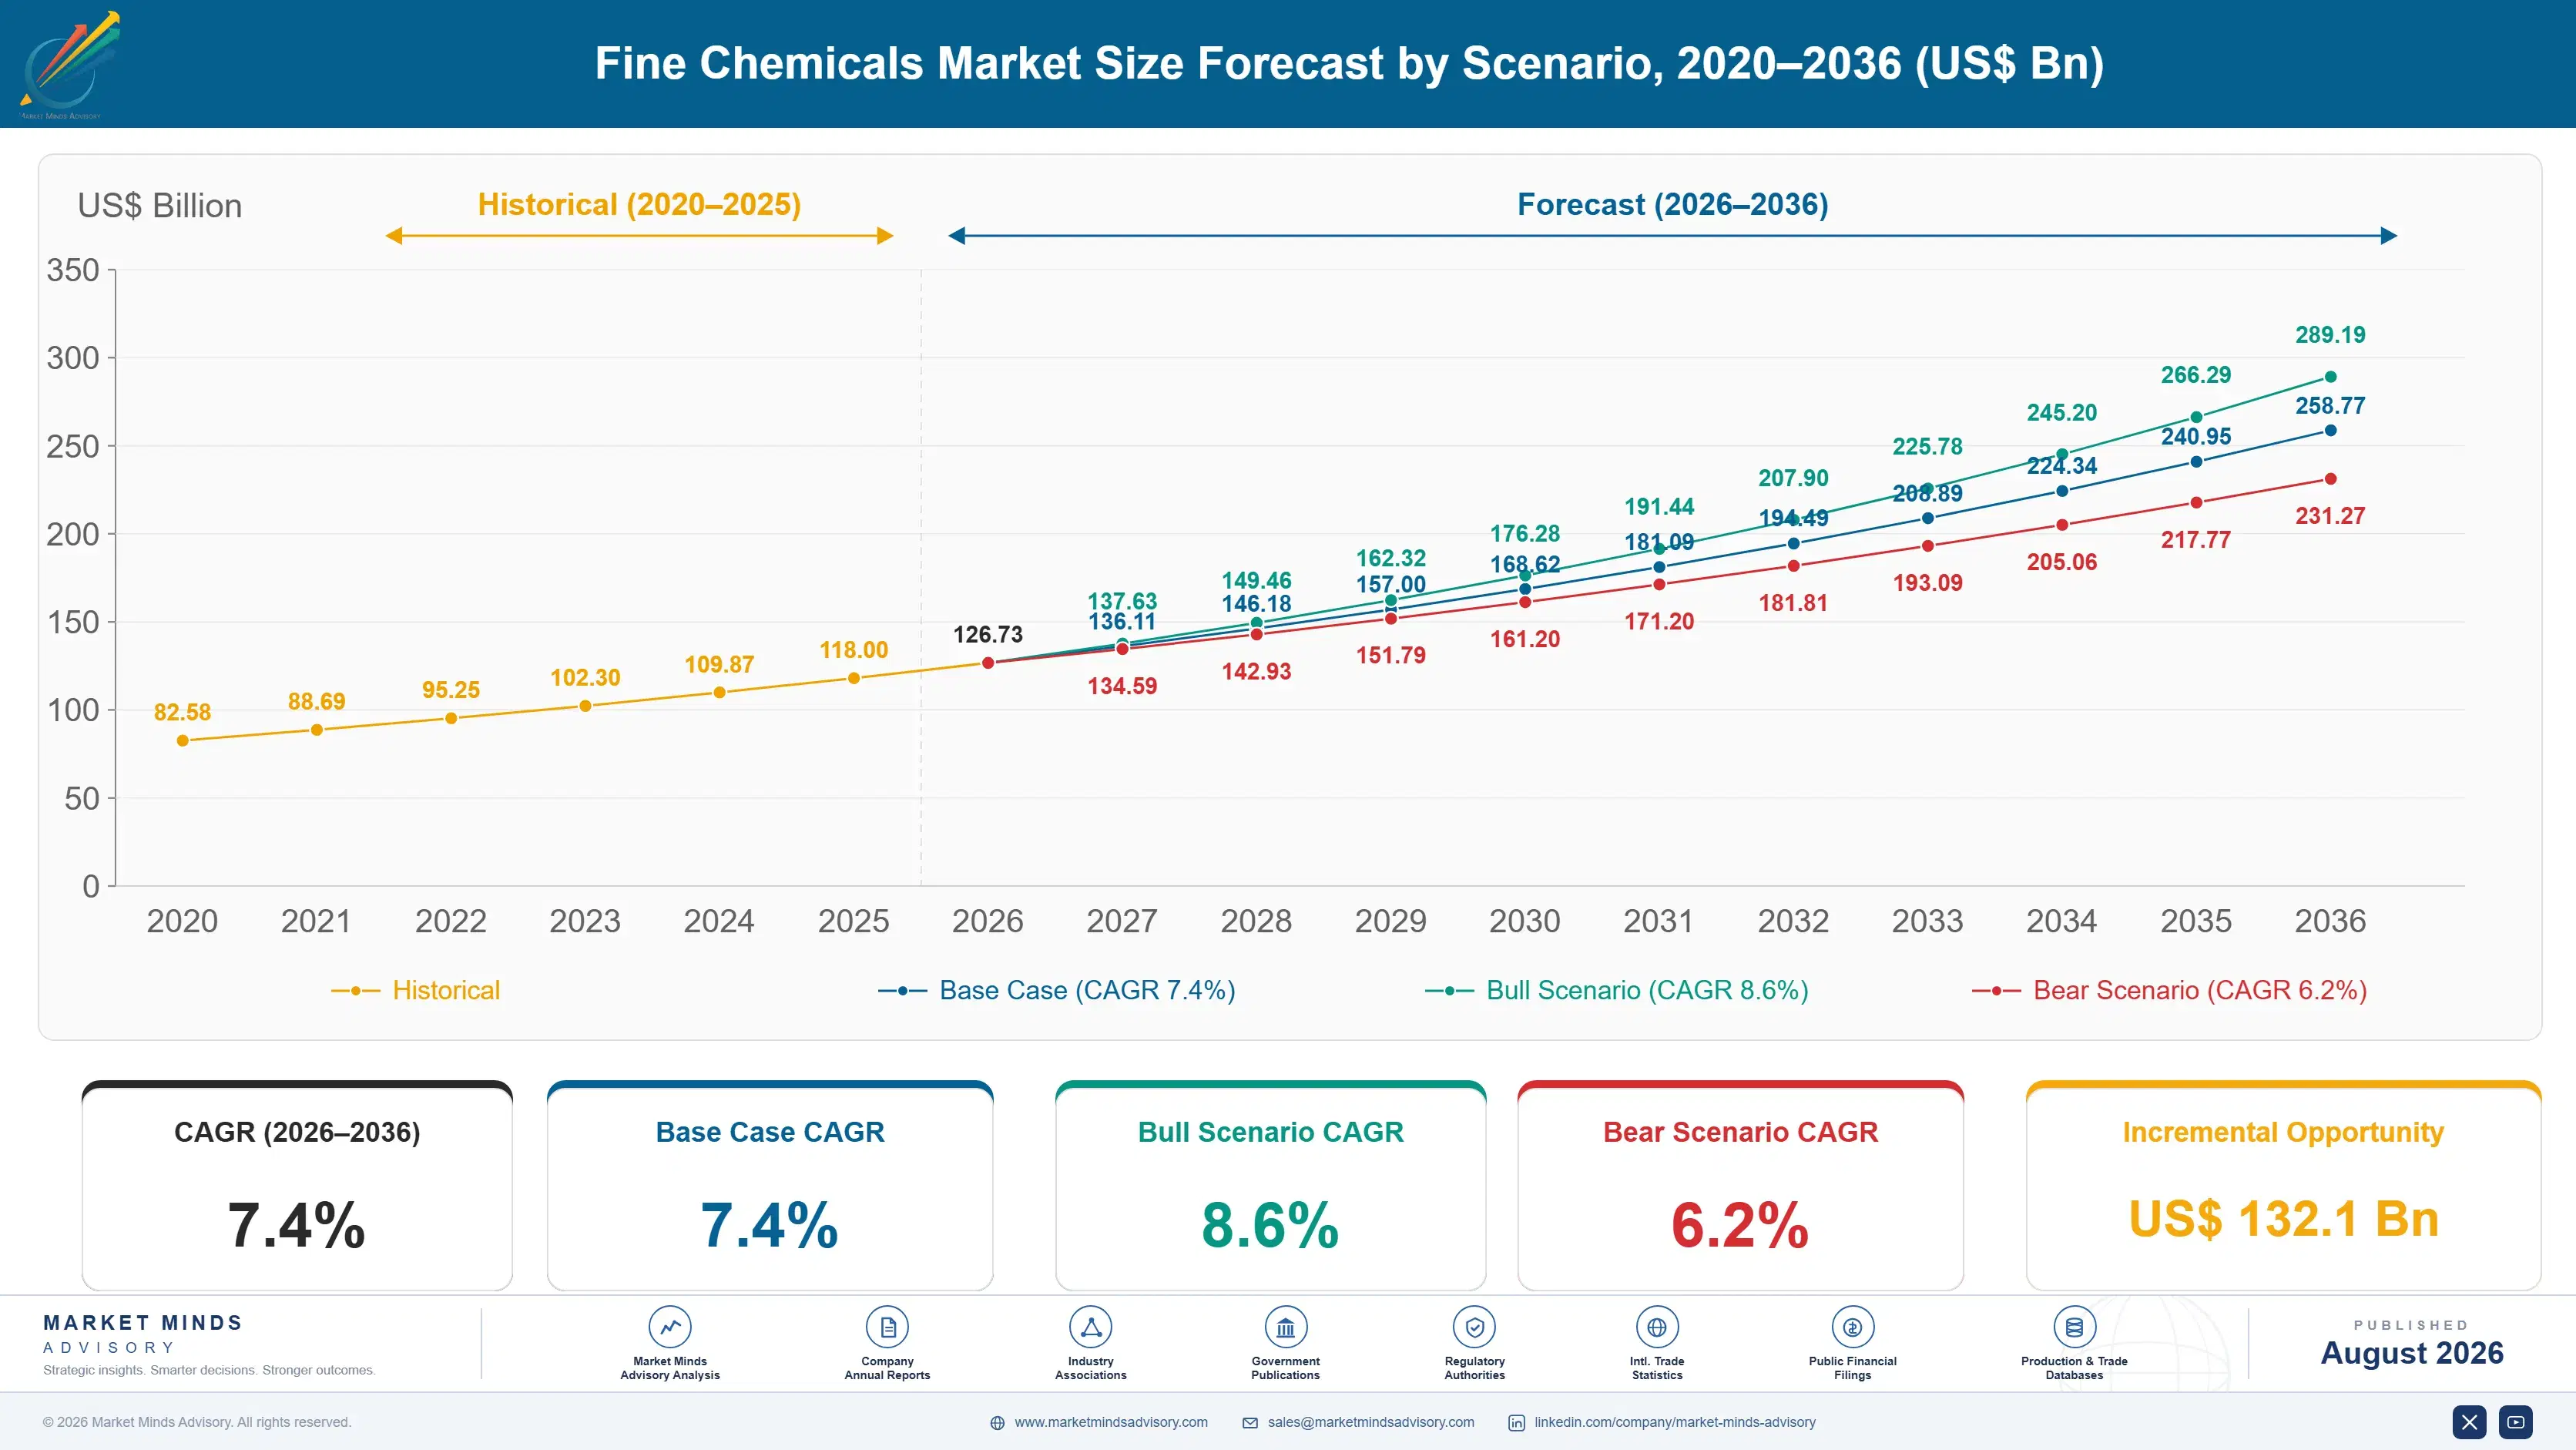
Fine Chemicals Market Forecast Scenarios

fine-chemicals-market-size-forecast-scenario-1787551312305
The 2020 to 2025 period exposed a dependency the industry knew about and priced as if it did not exist. Pandemic disruption and geopolitical tension revealed how much Western pharmaceutical supply rests on Chinese and Indian intermediates. Governments funded onshoring, companies announced Western capacity, and the 38% premium meant far less got built than committed. The 6.0% historical rate reflects demand growth rather than any reshaping of where manufacture happens.
The 7.4% base case rests on three mechanisms. Oral small molecule pipelines in obesity and oncology are pulling volumes back after a decade of biologics narrative, and those products need tonnes rather than kilograms. Antibody drug conjugate and targeted oncology development keeps expanding high-potency containment demand. And continuous flow capability is converting chemistry that batch plants cannot safely run into routine commercial manufacture. None of the three depends on onshoring policy delivering anything.
The 8.6% bull case assumes obesity and oncology oral volumes arrive at the upper end of projections while security-of-supply policy funds genuine Western capacity. The 6.2% bear case reflects pharmaceutical pricing pressure squeezing contract manufacturing margins, development pipeline attrition running above the historical 88%, and Asian producers continuing to hold cost positions that keep onshoring theoretical.

Capability Sold as Capacity

Three forces shape returns here and reactor capacity is not among them. Regulatory lock is first: a site named in a filing holds 94% of commercial programmes because moving it means variations, comparability studies, and occasionally clinical bridging that no procurement saving justifies. Capability is second, since the chemistry a manufacturer has actually run beats the chemistry it could theoretically attempt. Cost position is third and Asian producers own it.
TOP-FIVE CONCENTRATION18%Combined share of third-party supply held by leading manufacturers
REGULATORY FILING LOCK RATE94%Share of commercial programmes retained after the first filing
AVERAGE PROGRAMME DURATION11 yearsTypical span from development agreement to commercial supply end
CAPACITY UTILISATION76%Average reactor occupancy measured across all multipurpose synthesis assets
ONSHORING COST PREMIUM38%Uplift on Western manufacture against Asian equivalent supply routes
DEVELOPMENT STAGE ATTRITION88%Portion of early programmes that never reach commercial manufacture
The commercial model splits sharply. Catalogue supply of known intermediates competes on price against Chinese and Indian producers with fundamentally lower cost bases, and Western manufacturers rarely win there. Exclusive custom synthesis under a development agreement runs eleven years on average from first contract to end of commercial supply, survives price comparison entirely, and is where every durable business in this industry actually sits.
Attrition governs how the front end works. Around 88% of early-stage programmes never reach commercial manufacture, so a development portfolio is a lottery with a very good prize. Manufacturers who price development work as though it were profitable on its own miss the point completely, and those who treat it as pure loss-leading fail to select for the programmes worth winning.
"Clients arrive with a request for quotation comparing dollars per kilogram across six suppliers, and the actual question is which of those six has made something like this before without ruining a batch. Nobody puts that on the spreadsheet, and it decides the outcome anyway."
Practice Director, Pharmaceutical Chemistry and Contract Manufacturing · MMA Pharmaceutical and Specialty Chemistry Practice · August 2026

Market Trends

Flow Chemistry Makes Unsafe Reactions Routinely Manufacturable

Nitrations, azide chemistry, organolithium reactions, and photochemical transformations that a batch plant either cannot run or runs at genuine risk become controllable in continuous flow, where reaction volume at any instant is tiny. That opens synthetic routes chemists previously designed around, frequently cutting steps and improving yield substantially. Capital and engineering expertise are the barriers rather than any conceptual difficulty. The segment grows at 13.6%, fastest here, and manufacturers holding it win programmes on routes competitors cannot quote at all. Route redesign of that kind is where competitive separation now actually happens.
Market Impact: Programmes require 40 tonne quantities
Antibody Conjugates Pull Containment Capacity Into Shortage

Targeted oncology and antibody drug conjugate development requires payloads at occupational exposure limits measured in nanograms, which needs containment suites that cost a great deal and take years to qualify. Very few facilities worldwide can handle the most potent compounds at commercial scale. High-potency containment manufacture grows at 12.4% and commands pricing several times standard synthesis on comparable volumes. Development sponsors increasingly select a manufacturer on containment capability alone, before any commercial discussion has begun at all. Qualification history rather than the suite specification itself is what sponsors verify before committing anything.
Market Impact: Western manufacture costs 38% more

Market Opportunities and Growth Drivers

Oral Small Molecule Volumes Return With Obesity and Oncology

A decade of biologics narrative suggested small molecule manufacture was in terminal decline, and oral programmes in metabolic disease and targeted oncology have contradicted that firmly. These products need tonnes rather than the kilograms typical of specialised indications, which changes what a manufacturer must commit in capacity terms. Several sponsors have contracted multiple sites for the same molecule to secure supply. That volume profile favours manufacturers with genuine commercial-scale assets rather than development-focused facilities alone. Manufacturers who converted small molecule capacity to other uses over the past decade are now rebuilding it at considerable expense.
Market Impact: Premium blocks 38% cost gap closure

Indian and Chinese Cost Positions Anchor Global Pricing

Chinese intermediate manufacture and Indian active ingredient production together set the price at which most known chemistry can be bought, and the gap against Western equivalents runs near 38%. Divi's, Laurus, Aarti, and WuXi STA compete on capability as well as cost, which is what distinguishes the current situation from a simple labour arbitrage. India grows fastest of any country at 10.2%. East Asia holds 30% of value, and Western supply chains depend on both far more than procurement policy admits. Procurement policy has not caught up with how deep that dependency runs.
Market Impact: Only 12% reach commercial supply

Market Restraints and Challenges

Onshoring Costs More Than Anybody Wants to Pay

Security-of-supply policy funded Western capacity announcements that a 38% cost premium has largely prevented from being built, because a pharmaceutical company facing pricing pressure will not absorb that voluntarily. The root cause is labour, energy, environmental compliance, and construction cost differentials that no operational improvement closes. Mitigation runs through continuous flow that cuts footprint and labour intensity, through government procurement preferences that pay the premium explicitly, and through concentrating Western capacity on chemistry Asian producers do not hold. Subsidy structures have consistently funded construction while leaving the operating differential entirely unaddressed.
Market Impact: Fastest capability growing at 13.6%

Development Attrition Makes the Front End a Lottery

Around 88% of programmes entering development never reach commercial manufacture, so most early work generates modest revenue and no downstream annuity whatsoever. The root cause is clinical failure rather than anything a manufacturer controls. Mitigation runs through pricing development work to cover its own cost rather than treating it as investment, through portfolio selection that weighs sponsor quality and indication odds seriously, and through capability positioning that attracts programmes already past the riskiest clinical stages. None of that changes the underlying odds, which sit with clinical outcomes no manufacturer has any influence over whatsoever.
Market Impact: Containment grows at 12.4% annually
4 additional market trends, 3 additional growth drivers, and 2 additional restraints and challenges are covered in the full report. Contact sales@marketmindsadvisory.com to access the complete intelligence.

Segment CAGR and Growth Architecture

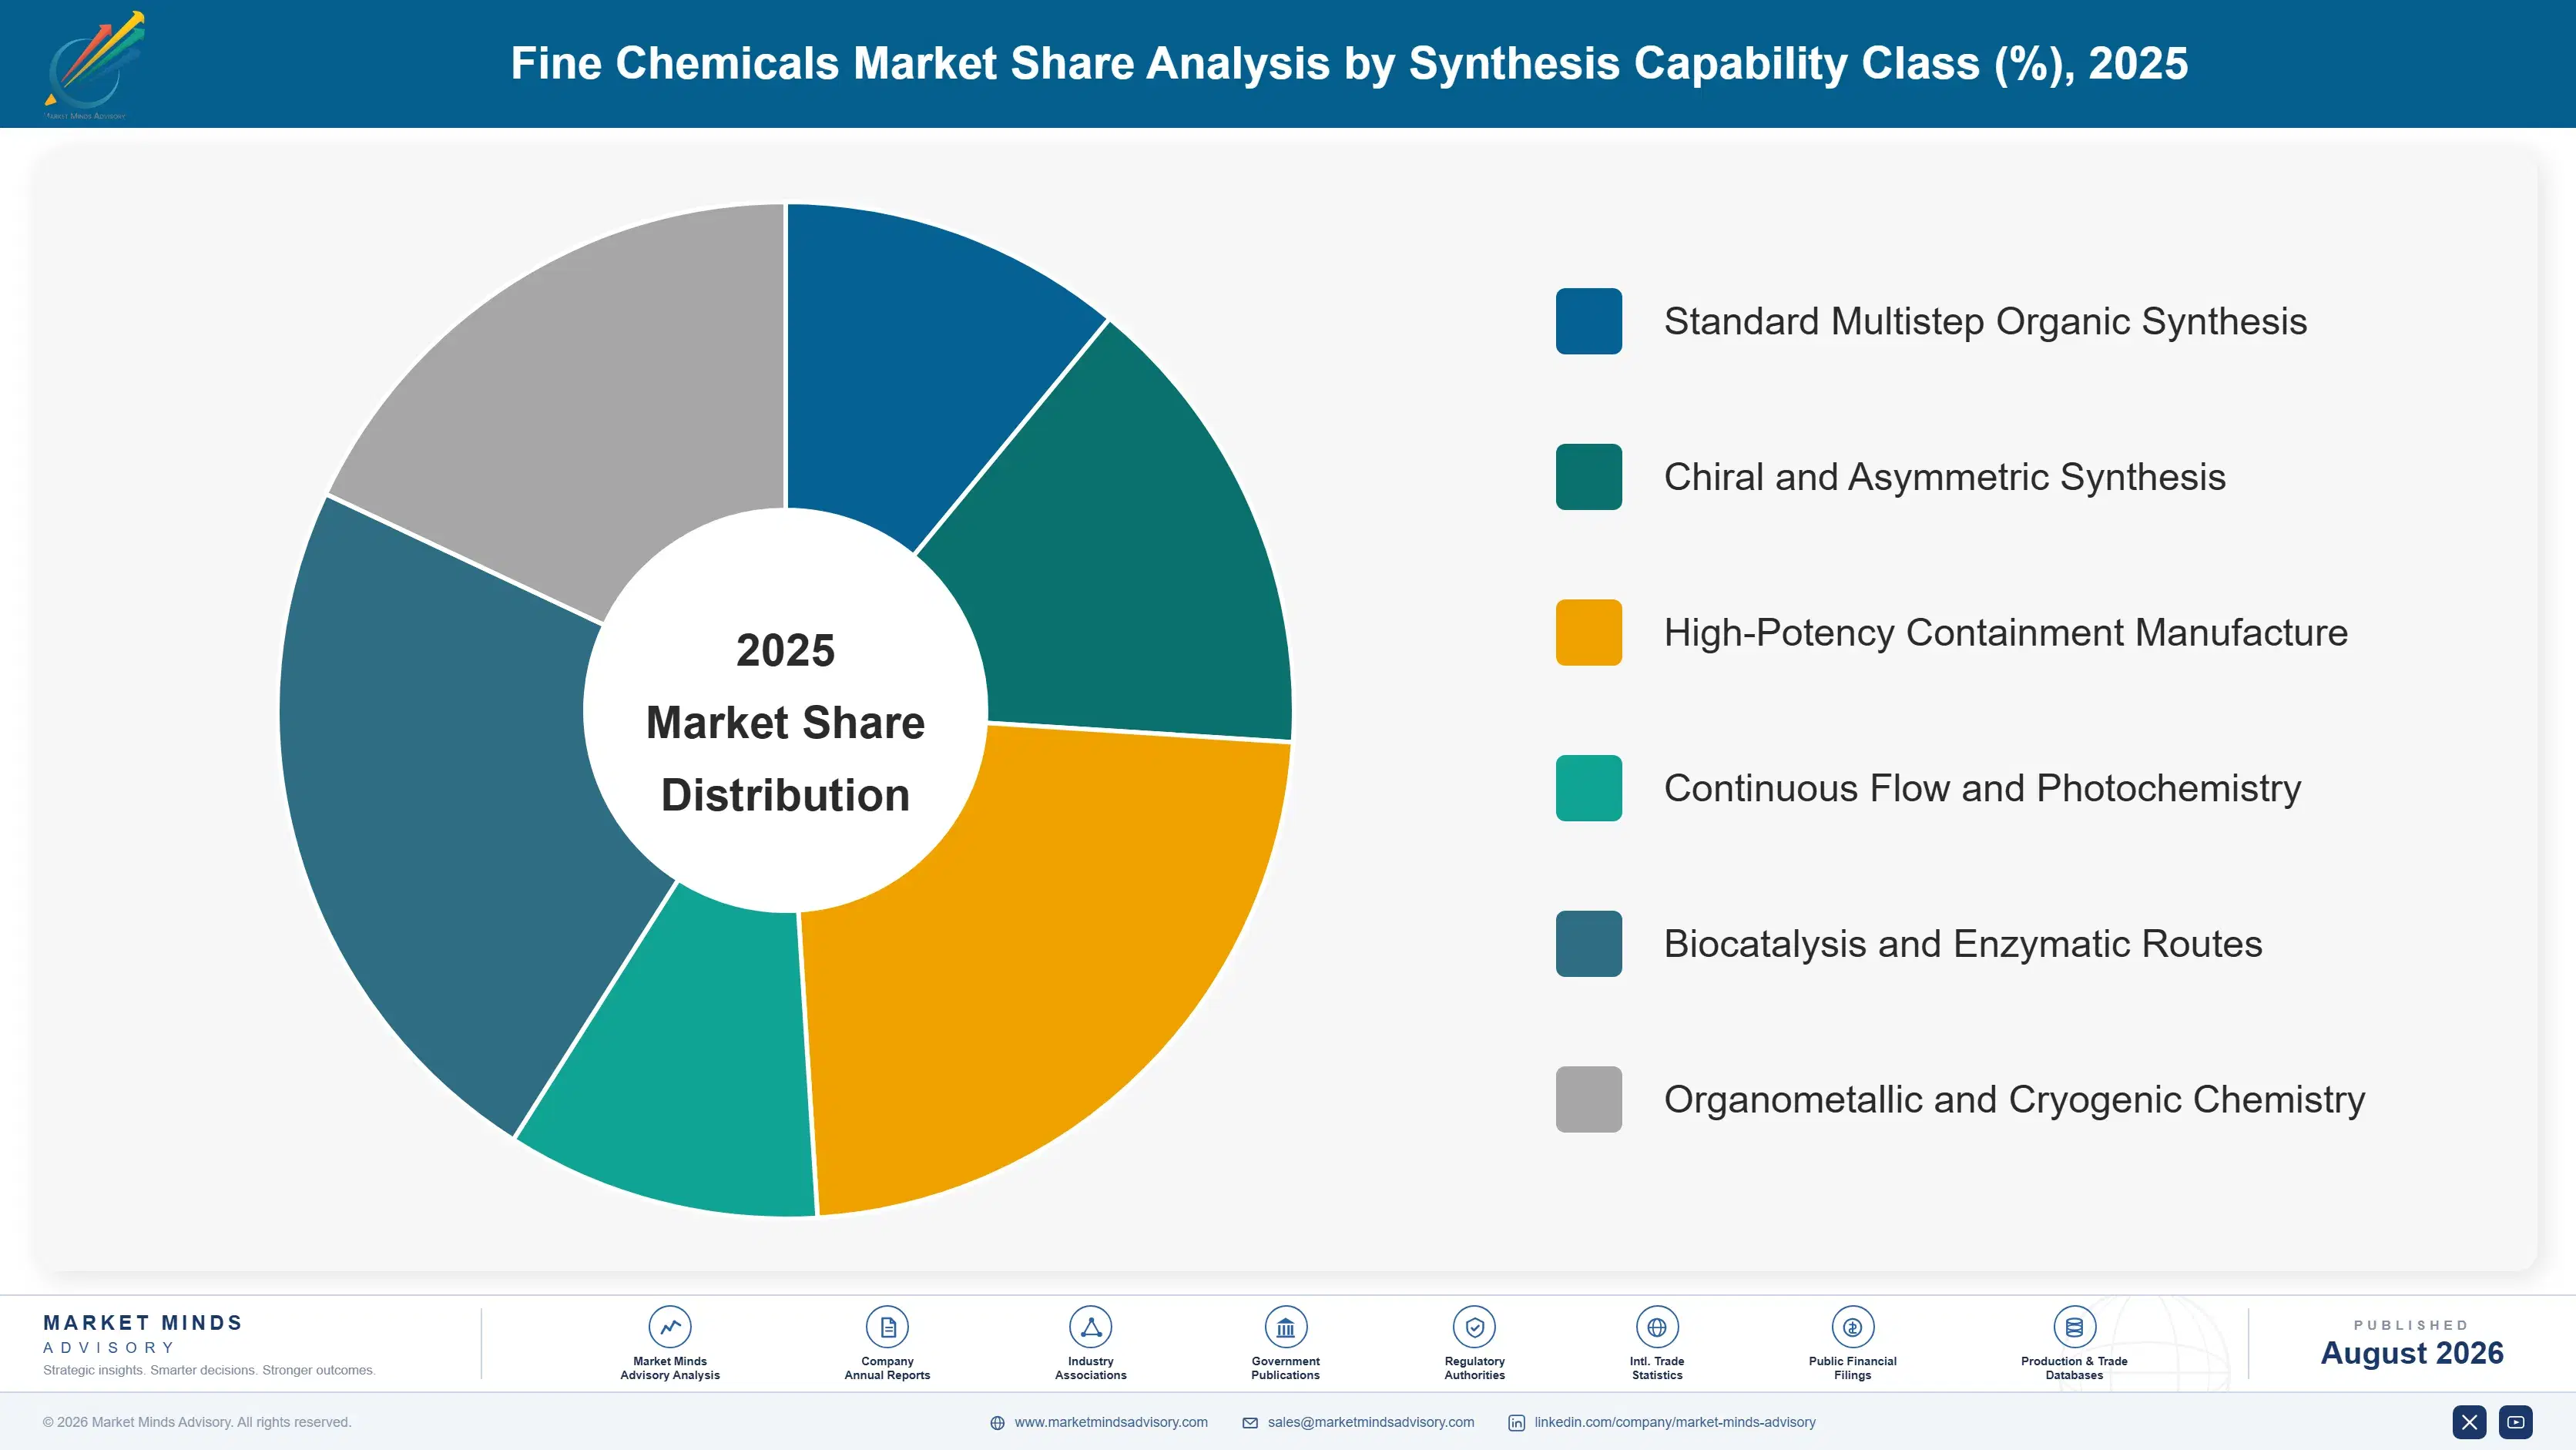
Segmentation follows synthesis capability class, because what a manufacturer can chemically do determines which programmes it can win, what it can charge, and whether competitors can quote against it at all. Six capability classes cover commercial supply, and the divide between chemistry anybody can run and chemistry very few can matters more than any measure of installed reactor volume.
fine-chemicals-market-market-share-analysis-1787551312851

Continuous Flow and Photochemistry

The fastest capability at 13.6%, roughly 1.84 times the market, and the one that genuinely changes what routes are available. Because reaction volume at any instant is very small, transformations that batch plants cannot safely run become controllable: nitrations, azides, organolithiums, ozonolysis, and photochemical steps. Routes shorten, yields improve, and footprint falls dramatically, which also helps Western manufacturers close part of the onshoring cost gap. Capital and process engineering expertise are the barriers rather than any theoretical difficulty. Manufacturers holding it win programmes competitors cannot even quote against. Sponsors increasingly ask whether a flow route exists before requesting any batch quotation, which is a shift in how these conversations begin.
CAGR 13.6%

High-Potency Containment Manufacture

Second fastest at 12.4%, driven by antibody drug conjugates and targeted oncology payloads with occupational exposure limits measured in nanograms per cubic metre. Containment suites cost a great deal, take years to design, build, and qualify, and very few facilities worldwide handle the most potent categories at commercial scale. Pricing runs several times standard synthesis on comparable volumes because alternatives barely exist. Sponsors frequently select a manufacturer on containment capability before commercial terms are discussed at all. Qualification history rather than suite specification is what buyers actually verify. Suites also carry high fixed cost against uncertain loading, which is why several manufacturers have declined the capital despite obvious demand signals.
CAGR 12.4%
Full segment breakdown across 6 segments available in the complete report.

Regional Architecture and Country Demand Map

Regional shares follow where synthesis actually happens rather than where the finished medicines are sold, and those two maps differ enormously. South Asia and Pacific sits above the standard band for reasons named below, and every other region falls inside its range. That gap is unusually large here.

North America

Security-of-supply policy and biosecurity legislation have made domestic manufacturing capability a procurement consideration rather than only a commercial one, which supports pricing that pure cost comparison would never justify. Cambrex, Thermo Fisher, and Sterling hold established positions weighted toward late-stage and commercial programmes. Containment capacity for high-potency oncology payloads is genuinely scarce here and commands accordingly. Development-stage work concentrates near the biotechnology clusters in Boston and San Francisco. Growth of 7.8% depends heavily on whether policy converts announcements into funded capacity rather than continuing as intent. Development-stage work is plentiful and commercially thin, while the late-stage programmes that carry real value are contested against Swiss, Indian, and Chinese manufacturers simultaneously.
Share: 22% | CAGR: 7.8% (2026 to 2036)

Western Europe

Swiss and German manufacturers built the modern custom synthesis model and still hold the deepest regulatory and quality reputations, which matters in an industry where a site name sits inside a drug filing for a decade. Lonza, Siegfried, Bachem, and Corden anchor that position across peptides, containment, and complex synthesis. Energy and labour costs make standard chemistry uncompetitive against Asian supply, so the region has moved decisively toward capability that cannot be sourced elsewhere. Growth of 5.8% is the slowest anywhere, held back by cost position on everything except genuinely difficult chemistry. Peptide synthesis is a particular regional strength, and demand from metabolic disease programmes has tightened that capacity considerably over the past two years.
Share: 20% | CAGR: 5.8% (2026 to 2036)
Regional intelligence for 5 additional markets available in the complete report: East Asia, South Asia and Pacific, Latin America, Middle East and Africa, Eastern Europe. Contact sales@marketmindsadvisory.com.
fine-chemicals-market-country-cagr-analysis-1787551313374

Four Moves That Hold Programmes

Advantage here comes from chemistry competitors cannot run and from filings that make a site expensive to leave. Four moves justify capital across the forecast period, and the first is the only reliable answer to a cost gap that no amount of operational improvement will close on its own. Cost is not among the four.

Invest in flow chemistry as a route advantage

Continuous processing makes nitrations, azides, organolithiums, and photochemistry manufacturable where batch plants cannot safely run them, which opens routes chemists previously designed around entirely. The capability grows at 13.6% against a market rate of 7.4%. It also cuts footprint and labour intensity enough to close part of the 38% Western cost premium, which is the only mechanism that genuinely does. Manufacturers without it are quoting the same batch routes as everybody else and losing on price to producers with lower costs. Process engineering talent is scarcer than the capital and takes longer to assemble.
Market Impact: Narrows part of the 38% Western cost premium

Build containment before sponsors come asking

Antibody drug conjugate and targeted oncology payloads need occupational exposure control at nanogram levels, and suites take years to design, build, and qualify properly. High-potency containment grows at 12.4% and prices at several times standard synthesis on comparable volumes because so few facilities can do it. Sponsors select on containment capability before commercial terms are ever discussed. Building after a request arrives means missing that programme and the eleven years of commercial supply attached to it afterwards. High fixed cost against uncertain loading is the real objection, and it is why several competitors have declined the same capital.
Market Impact: Enters a scarce capability growing 12.4% each year

Price development work to cover its own cost

Around 88% of programmes entering development never reach commercial manufacture, so treating early work as an investment in future supply means funding a lottery with borrowed conviction. Development should cover its cost, and portfolio selection should weigh sponsor quality and indication odds explicitly rather than accepting whatever arrives. Manufacturers who do both retain the option value without the losses. Those treating it purely as loss-leading select for nothing and pay for programmes that were never going anywhere. Selection criteria weighing sponsor funding, indication odds, and chemistry fit turn a lottery ticket portfolio into something closer to an investment decision.
Market Impact: Manages the 88% development stage attrition rate properly

Convert filing inclusion into commercial discipline

A site named in a regulatory filing holds 94% of commercial programmes, because moving it requires variations, comparability studies, and occasionally clinical bridging that no procurement saving covers. That position is worth defending with reliability rather than discounting, since the customer's alternative is genuinely expensive. Manufacturers who discount into filed programmes are giving away the one advantage this industry actually confers. Average programme duration of eleven years means each point of margin surrendered compounds a very long way. Supply reliability and responsiveness are what sponsors actually remember when the next programme comes up for placement.
Market Impact: Protects a 94% retention rate on filed programmes

Who Controls the Margin Pool

Concentration is remarkably low at roughly 18% for the top five on third-party manufacturing revenue, because most molecules can be made in a competent multipurpose plant and thousands of such plants exist. Lonza leads on breadth across containment, peptides, and complex synthesis. Siegfried and Cambrex hold strong late-stage and commercial positions. Divi's operates at cost and scale few match, and WuXi STA competes on capability rather than price alone.
Competition runs on three dimensions. Chemistry capability is the first, since having run something before beats being able to attempt it. Regulatory and inspection history is the second, because a sponsor is naming this site in a filing for a decade. Cost position is the third, and Asian producers hold it decisively on anything a competent plant can make.

Pressure is building from two directions. Biosecurity legislation has introduced genuine commercial uncertainty into Chinese manufacturing relationships that Western sponsors had treated as settled. Indian manufacturers are moving up the capability curve rather than competing only on cost. Rankings will shift toward manufacturers holding chemistry others cannot run, wherever they happen to be located. Location has stopped predicting who wins the difficult work.
fine-chemicals-market-company-positioning-matrix-1787551313896

Competitive Moat and Risk Dimensions

LONZA

Moat: Capability breadth across difficult chemistry

Lonza spans containment, peptide synthesis, complex small molecule chemistry, and bioconjugation at commercial scale, which lets it serve a sponsor across modalities rather than one programme. That breadth also means it can take chemistry most competitors decline. Regulatory inspection history across many sites supports filing inclusion, which is what actually retains programmes once commercial supply begins.
LONZA

Risk: Western cost base exposure

Standard synthesis at Swiss and Western European sites cannot compete against Asian producers on a 38% cost differential, which confines Lonza to genuinely difficult chemistry and leaves it exposed if competitors close the capability gap. Indian and Chinese manufacturers are moving up that curve deliberately. Defending on quality reputation alone gets harder each year that record is matched elsewhere.
DIVI'S LABORATORIES

Moat: Scale with regulatory inspection record

Divi's combines Indian cost structure with an inspection and compliance record that international sponsors accept for filed commercial programmes, which is a combination very few manufacturers anywhere hold. Scale in generic active ingredients funds capability investment that pure contract businesses struggle to justify. Backward integration into intermediates reduces the Chinese dependency that concerns many of its own customers.
DIVI'S LABORATORIES

Risk: Generic pricing pressure exposure

A substantial portion of revenue sits in generic active ingredients where pricing erodes continuously and competition from other Indian and Chinese producers is intense. Custom synthesis growth has to outpace that erosion to lift blended returns. Concentration in a small number of large customer relationships also means a single programme loss moves results considerably more than the portfolio size suggests.

Players Tracked

Prominent Players

Lonza
Siegfried
Cambrex
Divi's Laboratories
WuXi STA

Other Key Players

Recipharm
Catalent
Thermo Fisher Scientific
Asymchem
Porton Pharma Solutions
Hikal
Laurus Labs
Aarti Industries
Johnson Matthey
Evonik
Bachem
PolyPeptide Group
Corden Pharma
Sterling Pharma Solutions
Piramal Pharma Solutions

Recent Developments

MARCH 2025

Sponsor selects manufacturer on flow chemistry route alone

A pharmaceutical sponsor awarded a commercial programme on the strength of a continuous flow route that removed two synthetic steps and a hazardous intermediate entirely. Competing manufacturers had quoted the original batch route and could not match the resulting cost of goods at any volume.
Signal: Route capability rather than reactor pricing decided the award, which is where the real competition now sits
JULY 2025

Oncology developer books containment capacity years ahead

An antibody drug conjugate developer reserved high-potency containment capacity well before its programme entered late-stage development, citing the scarcity of qualified suites capable of handling payloads at the required occupational exposure limits. Commercial terms were agreed after the capacity commitment rather than before. Price never entered it.
Signal: Containment scarcity has now inverted the usual sequence, with capacity secured well before any commercial negotiation happens
NOVEMBER 2025

Western capacity announcement deferred on cost grounds

A planned Western fine chemical facility supported by security-of-supply policy was deferred after cost estimates confirmed a substantial premium over existing Asian supply, with no customer willing to commit volumes at the resulting price. Policy support covered construction rather than any ongoing operating differential. Nobody committed volumes.
Signal: Onshoring stalls on operating cost rather than capital, which subsidy structures have consistently failed to address

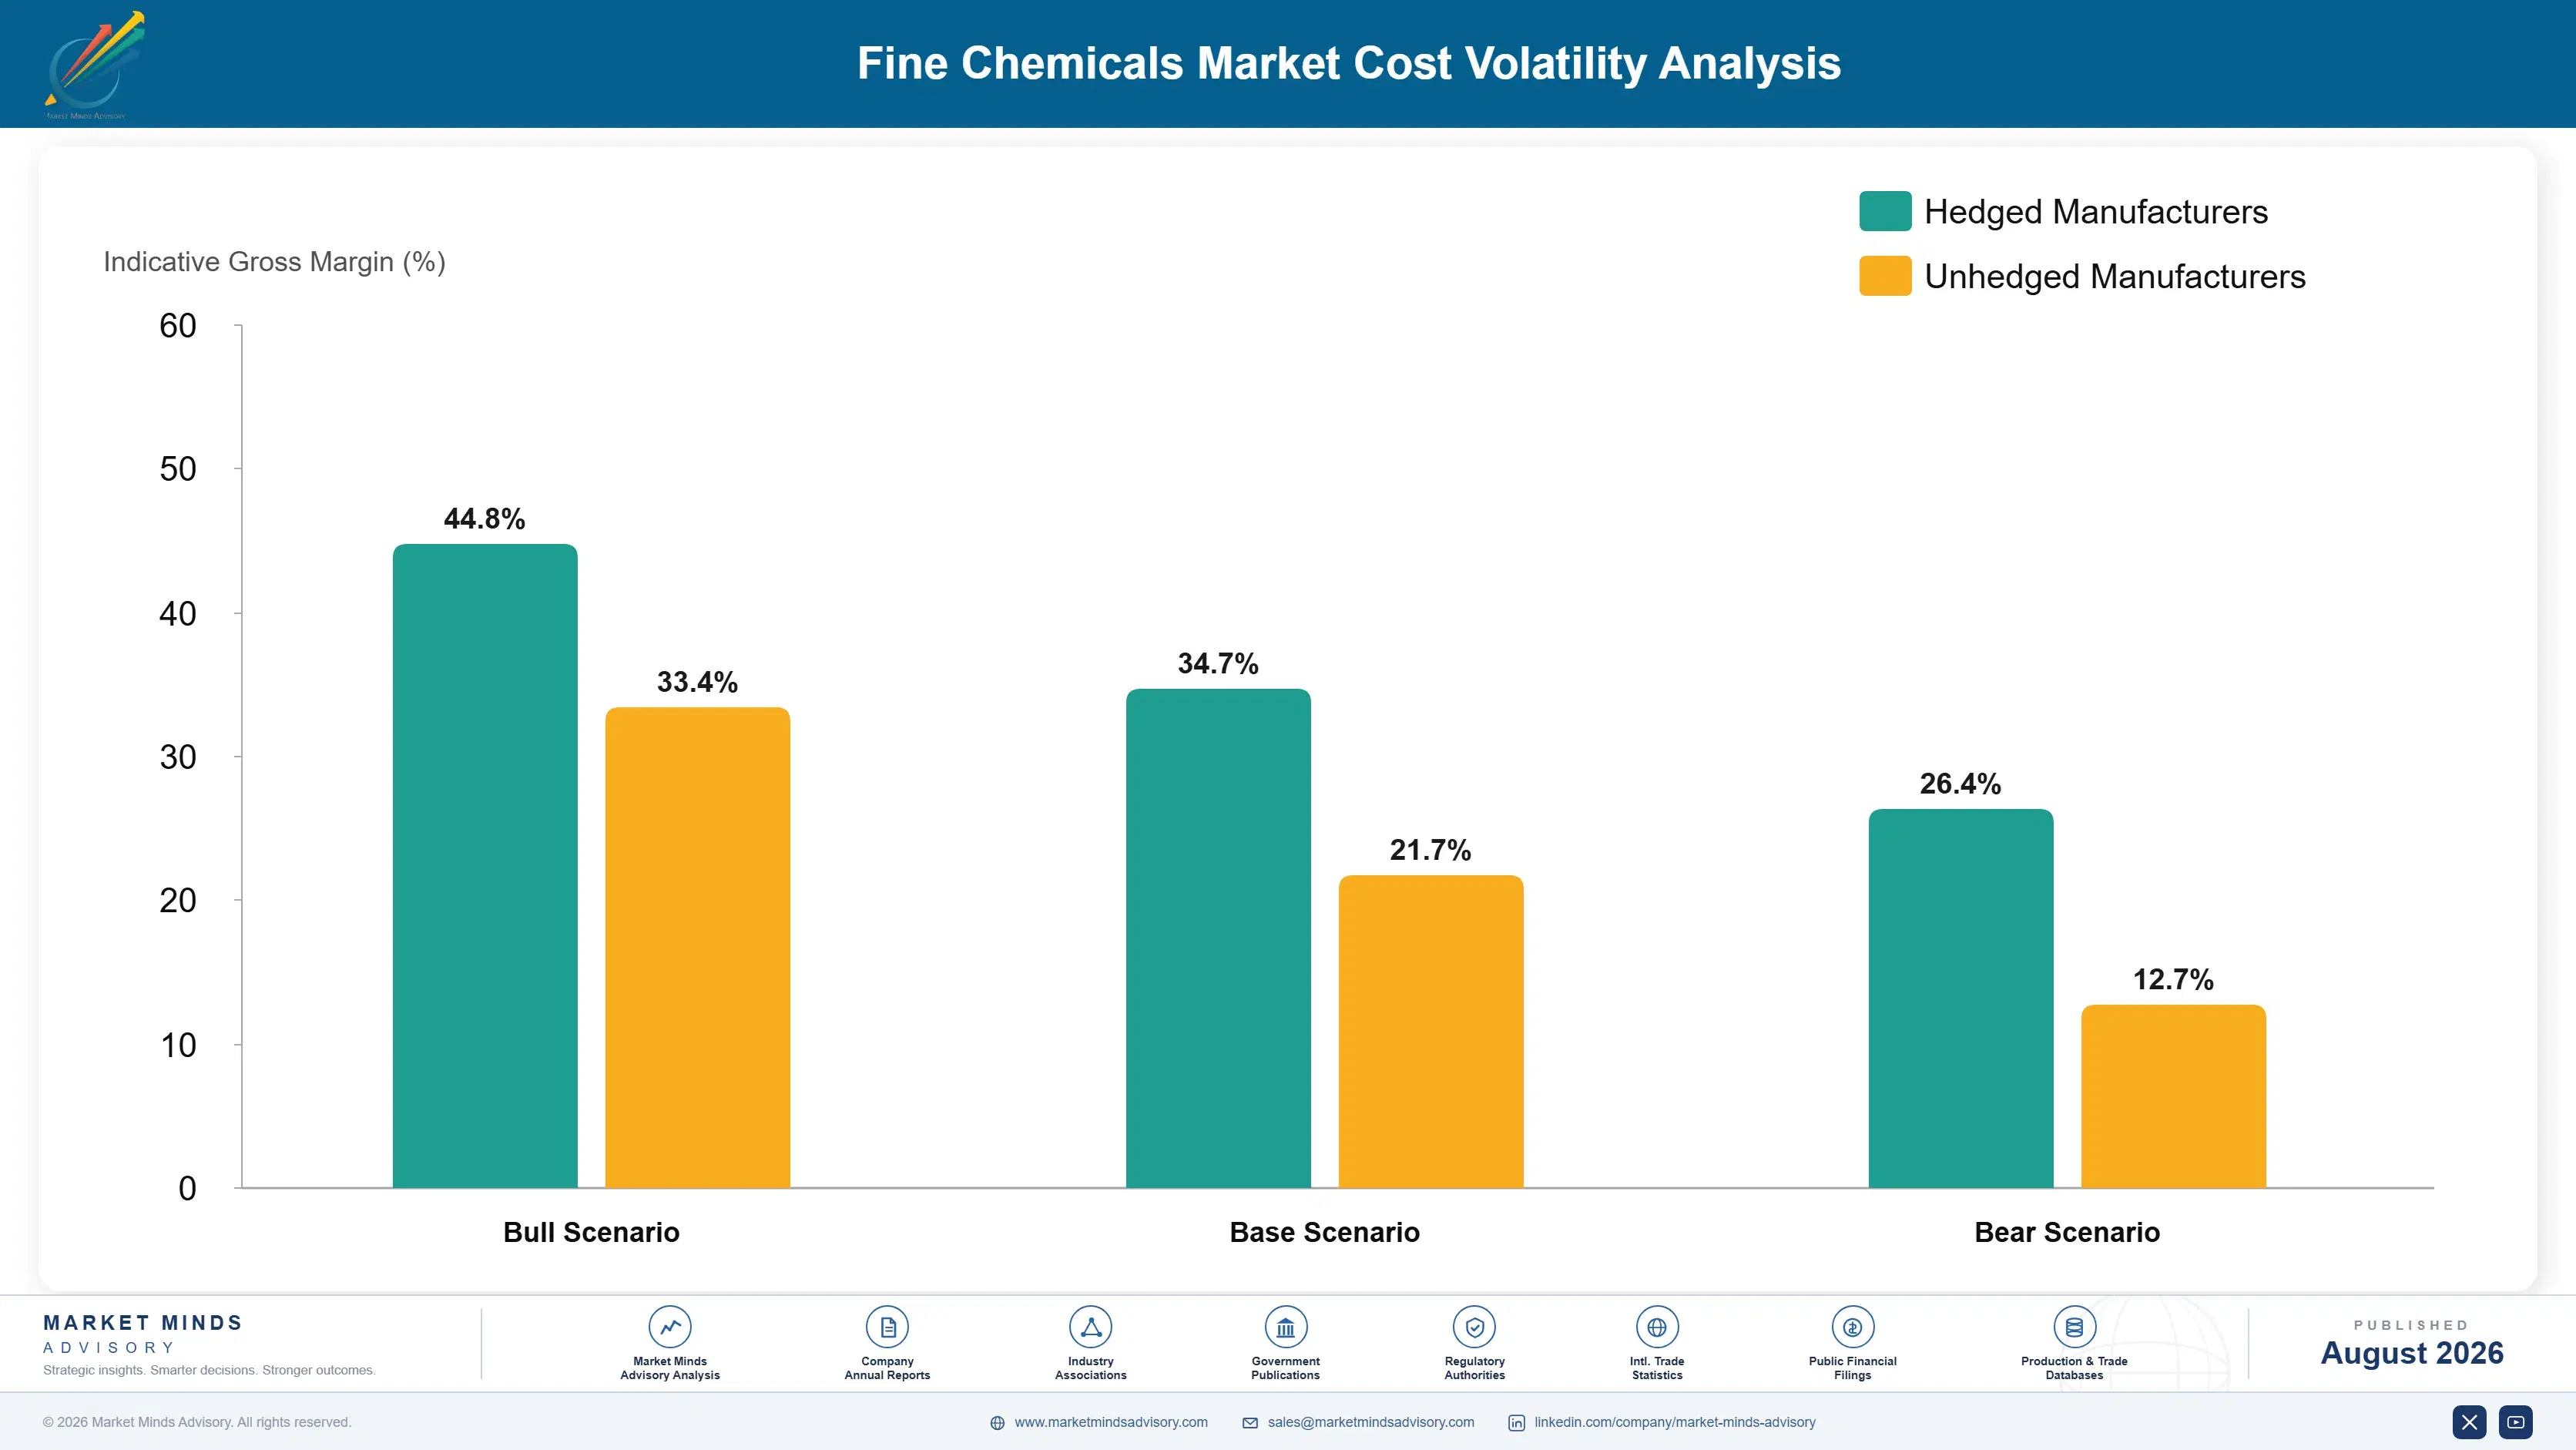
What Sits Under the Kilogram Price

Raw materials and starting intermediates dominate at roughly 41% of manufacturing cost, sourced heavily from Chinese producers even by Western manufacturers who market supply chain independence. Skilled labour takes a further 22%, and this is where the Western cost differential mostly originates. Energy, solvent recovery, and waste treatment absorb 17%. Facility depreciation on multipurpose plant running at 76% utilisation carries the remainder across every programme.
Chinese intermediate availability tightened sharply during 2021 and 2022 on environmental enforcement and logistics disruption, and Western manufacturers discovered how many of their own starting materials originated there regardless of where final synthesis occurred. Lonza and Siegfried both discussed input availability and cost pressure in their reporting for those years. European energy costs compounded the problem, since solvent recovery and distillation are genuinely energy intensive processes.

Exposure divides on programme structure rather than on scale. Manufacturers on cost-plus development contracts pass input movement through directly and carry almost nothing. Those holding fixed-price commercial supply agreements across multi-year filed programmes absorb everything, which is exactly where the largest volumes and the longest commitments sit. Asian manufacturers additionally hold a labour cost position that no procurement or process improvement closes for anybody else.
fine-chemicals-market-cost-volatility-analysis-1787551314092

Index long-term commercial contracts to inputs

Filed commercial programmes run around eleven years and are frequently priced firm against starting materials whose cost moves considerably more than that. Indexation to named intermediate references removes a mismatch that erodes margin quietly across a very long contract. Sponsors accept it more readily than manufacturers expect, since they carry the same exposure with any alternative supplier.

Qualify non-Chinese starting material sources

Western manufacturers marketing supply chain independence frequently buy Chinese starting materials, which leaves the dependency intact one step upstream where nobody is looking. Qualifying Indian or European alternates costs analytical and regulatory work rather than capital. It also converts a marketing claim into something a sponsor's security-of-supply assessment will actually credit properly. The dependency is one step upstream.

Use flow processing to cut labour intensity

Skilled labour at 22% of cost is where the Western differential largely originates, and continuous processing runs with considerably less operator intervention per kilogram than batch campaigns require. Footprint and solvent consumption fall alongside it. This is the one mechanism that genuinely narrows a cost gap that procurement discipline and operational improvement have both failed to touch.

Portfolio Architecture for Margin Defence

Margin architecture follows how easily a customer could go elsewhere, which in this industry means chemistry capability and filing status rather than anything about the plant. Catalogue supply of known intermediates competes against Asian producers on price and earns accordingly. Filed commercial custom synthesis earns considerably more on switching cost. Containment and flow chemistry earn most, because the alternatives frequently do not exist.
The volume and premium tension shows in how a manufacturer handles development work. Early-stage programmes are numerous, small, and 88% of them go nowhere, but they are the only route into commercial supply that lasts eleven years. Treating them as profit centres loses the funnel. Treating them as free marketing fills a plant with programmes nobody selected for. The discipline sits uncomfortably between the two.

High-value pools concentrate in continuous flow routes competitors cannot quote, high-potency containment where qualified capacity barely exists, and filed commercial programmes defended on reliability rather than price. Each is protected by capability or regulatory position rather than by cost, which is fortunate, because cost is the one thing Western manufacturers will never win. That is fortunate rather than clever, and it will not last forever.

Volume / Commodity-Adjacent Tier

Catalogue intermediates and standard multistep synthesis that any competent multipurpose plant can produce. Asian producers set pricing with a cost base Western manufacturers cannot approach. Nothing about the chemistry defends the position at all.
Gross Margin: 14%-24%

Premium / Certified Tier

Filed commercial custom synthesis under long-term supply agreements where a site name sits inside a regulatory dossier. Switching costs defend pricing far better than any technical claim. The range reflects wide variation in chemistry difficulty across programmes.
Gross Margin: 28%-42%

Sustainability / Regulatory / Next-Generation Tier

Continuous flow routes, high-potency containment, and biocatalytic processes where qualified alternatives are genuinely scarce. Capability rather than capacity sets price. The range is wide because containment and flow economics differ substantially from each other.
Gross Margin: 36%-54%
fine-chemicals-market-portfolio-architecture-1787551314596

High-value Sub-segments and Strategic Watch-out

Continuous Flow Route Development

Growing at 13.6% and the only capability that meaningfully narrows the 38% Western cost premium, by cutting labour intensity, footprint, and step count together. Competitors quoting batch routes cannot match the resulting cost of goods. Process engineering talent is scarcer than the capital required to build it.
Gross Margin: 38%-54%

High-Potency Containment Suites

Growing at 12.4% with sponsors reserving capacity before commercial terms are discussed, which inverts the usual sequence entirely. Qualified suites take years to build and very few handle the most potent payload categories. High fixed cost against uncertain loading is why several manufacturers declined the capital.
Gross Margin: 40%-54%

Filed Commercial Custom Synthesis

Retention runs at 94% because moving a named site costs variations, comparability work, and sometimes clinical bridging. Programmes average eleven years, so every point of margin surrendered at signature compounds a very long way. Reliability rather than any discounting is what defends the position at renewal.
Gross Margin: 28%-42%

Catalogue Intermediate Supply

The strategic watch-out. Priced by Chinese and Indian producers with a 38% cost advantage, defended by nothing, and offering no route into the filed commercial programmes where this industry actually earns its returns. Winning here also builds no relationship that carries into anything more valuable later.
Gross Margin: 14%-24%

How Programmes Reach Manufacturers

Demand arrives through a funnel with brutal arithmetic at the front and remarkable stability at the back. Development programmes come in numbers, and 88% of them fail clinically before reaching commercial manufacture, which makes early work a portfolio bet rather than a revenue line. The ones that survive convert into filed commercial supply lasting around eleven years with 94% retention. Nothing else in specialty chemistry offers that combination of front-end risk and back-end durability.
Stickiness comes almost entirely from the regulatory dossier. A site named in a filing holds until the sponsor is willing to fund variations and comparability studies. Development work holds until the next programme phase. Catalogue supply holds until somebody quotes lower, which happens continuously. Nothing else in the relationship generates any durability at all.

The deciding buyer moved from procurement toward technical operations and supply chain security functions over the past five years. Those groups evaluate chemistry capability, inspection history, and geographic dependency rather than cost per kilogram. Procurement still runs the process, and increasingly runs it around a manufacturer somebody else has already chosen on other grounds. Selling to procurement alone reaches the process and misses the decision entirely.
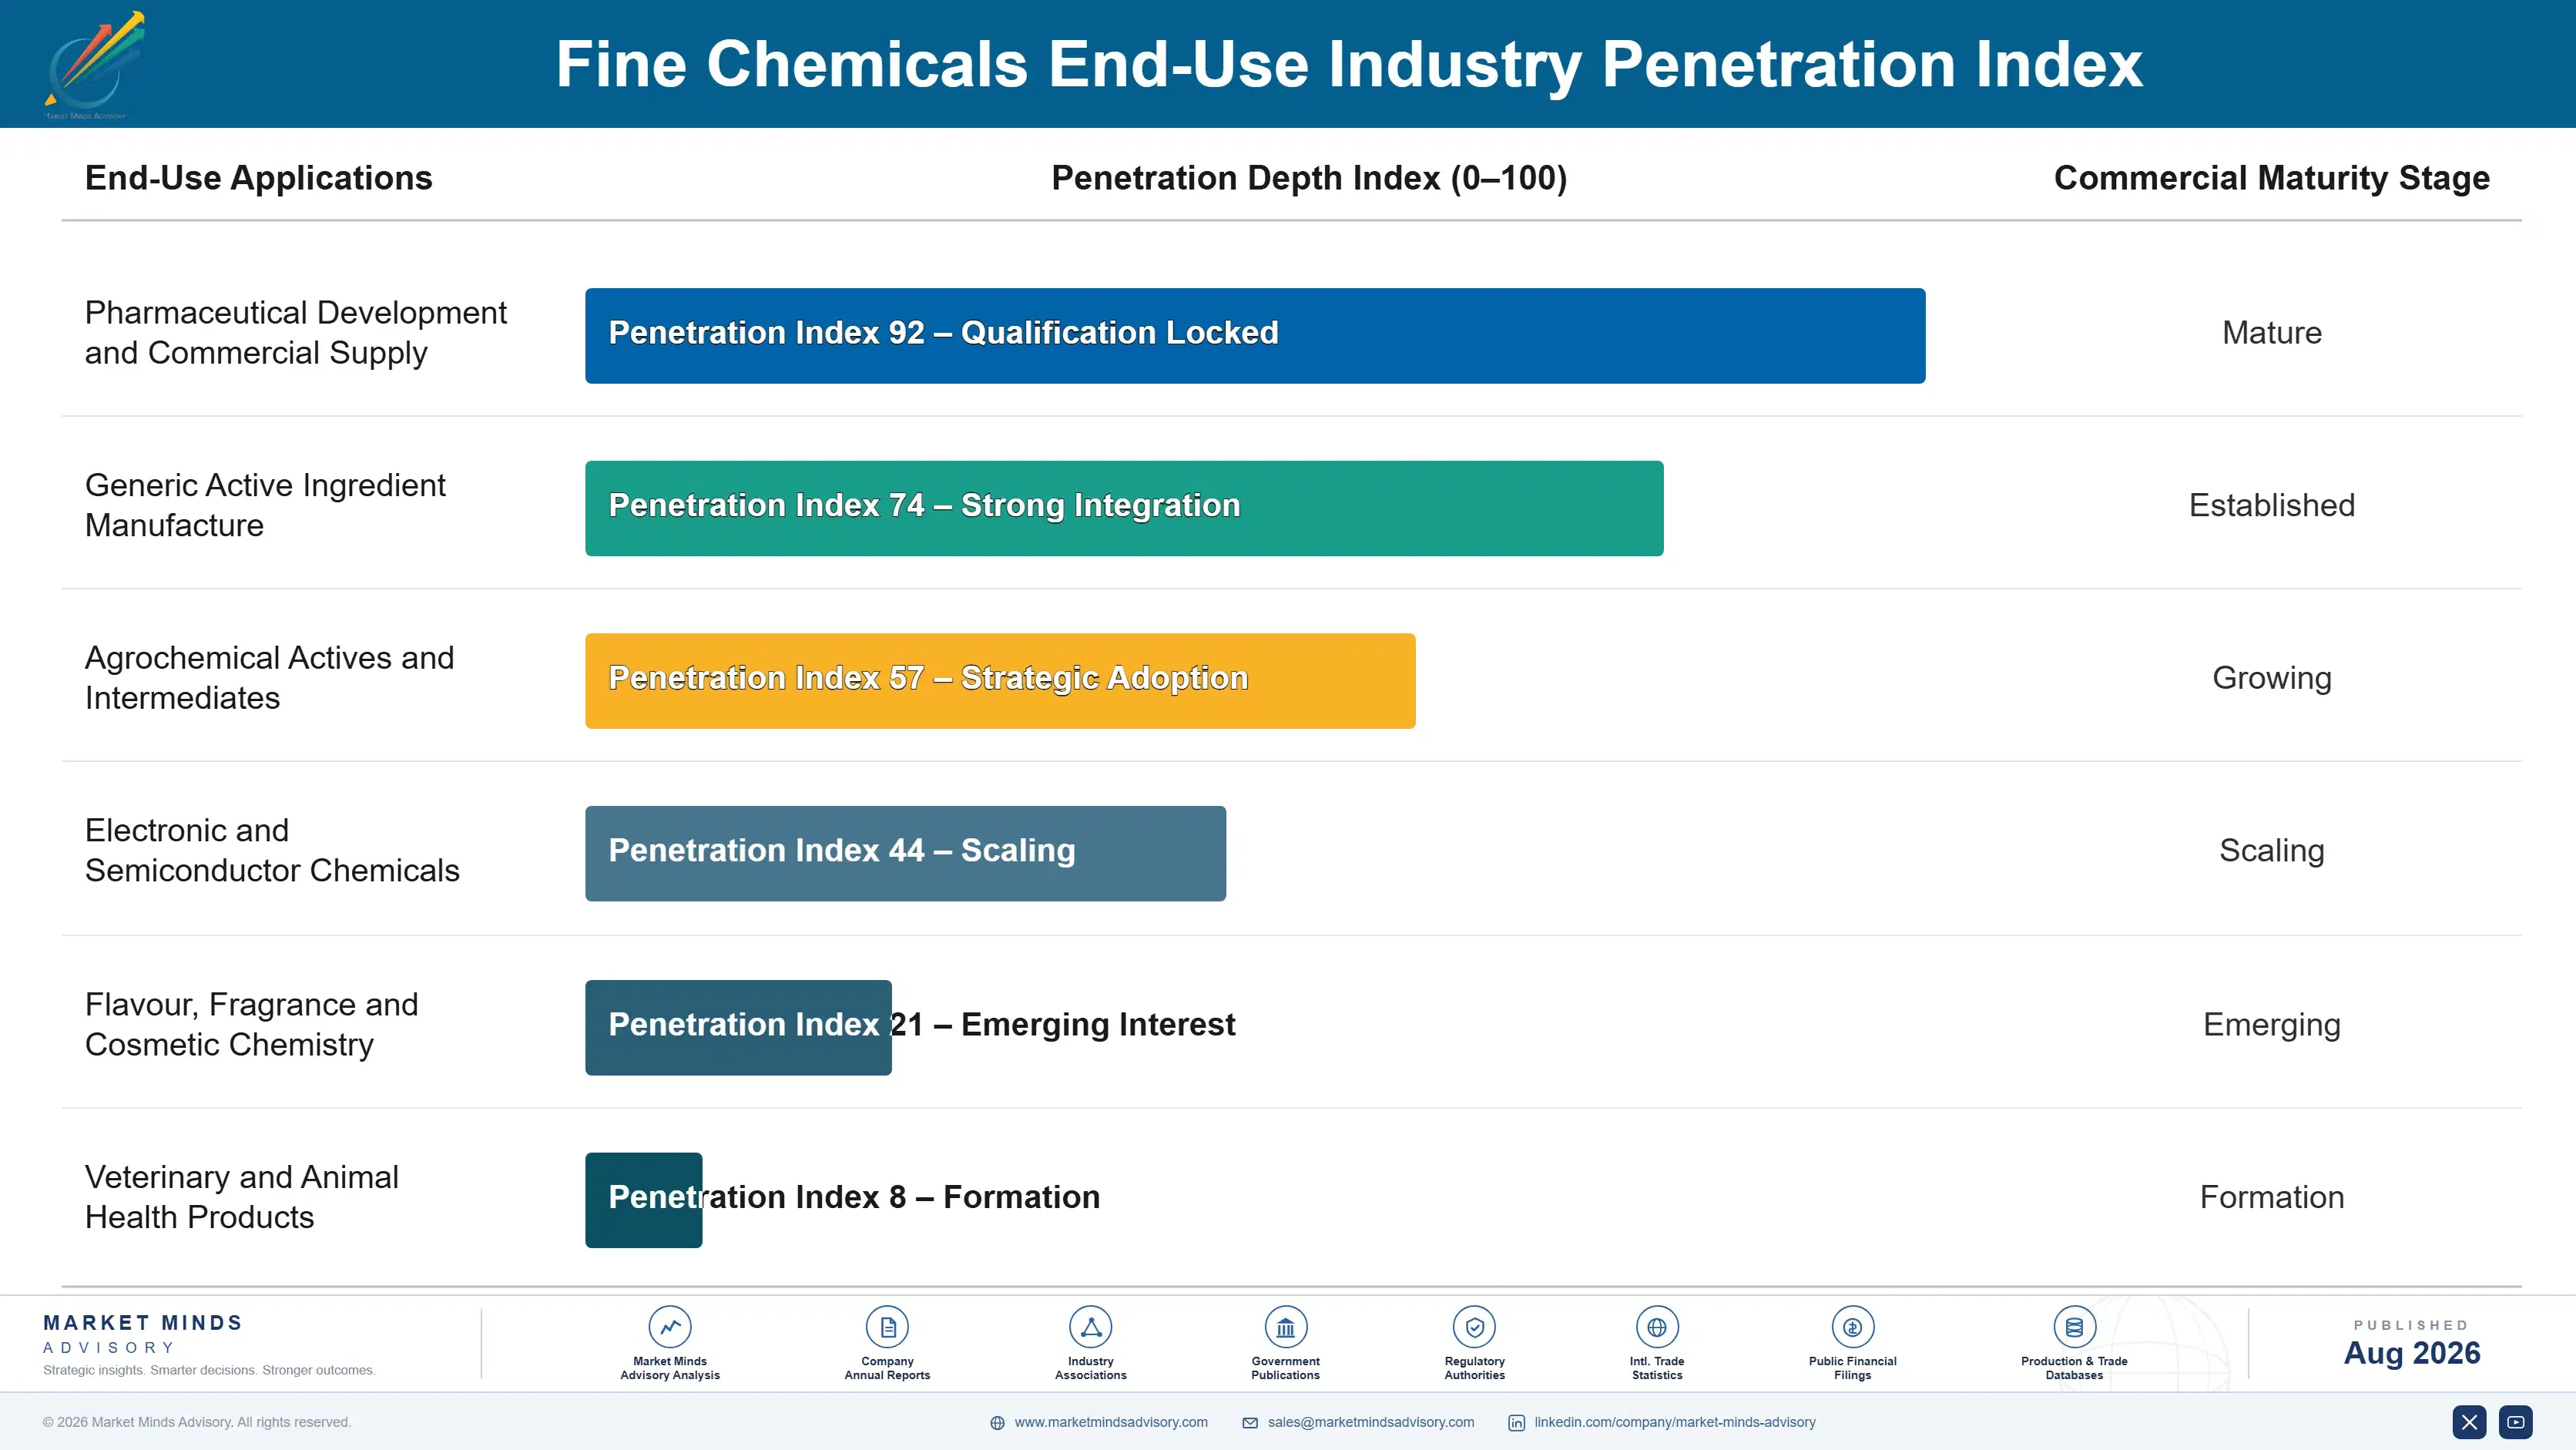
fine-chemicals-market-end-use-penetration-index-1787551315085

What Actually Wins Work

These are among the four positions where our research anticipates prominent divergence between winners and laggards over the coming forecast period. Each is grounded in the demand model, the regulatory perimeter, and the announced capacity pipeline.
01 / FLOW CHEMISTRY CAPABILITY

Buy routes competitors cannot quote against

Continuous processing makes nitrations, azide chemistry, organolithiums, and photochemical steps manufacturable where batch plants either cannot run them safely or will not attempt them at all in a batch plant. The capability grows at 13.6% against a market rate of 7.4%, and it cuts footprint and labour intensity enough to close part of the 38% Western cost premium that nothing else touches. Manufacturers quoting the same batch routes as everybody else are competing on price against producers whose costs are permanently lower than theirs.
02 / CONTAINMENT CAPACITY TIMING

Build the suites before sponsors ask for them

Antibody drug conjugate and targeted oncology payloads require occupational exposure control at nanogram levels, and qualified containment suites take years to design, construct, and validate before any material can legally be made in them at all. The capability grows at 12.4% and prices at several times standard synthesis because so few facilities worldwide can handle the most potent categories. Sponsors now reserve capacity before discussing commercial terms, so building after the request arrives means missing eleven years of commercial supply afterwards.
03 / DEVELOPMENT PORTFOLIO DISCIPLINE

Select programmes rather than accepting them

Roughly 88% of programmes entering development never reach commercial manufacture, which makes the front end a lottery whose only prize is the eleven-year filed supply agreement waiting behind it at the end. Manufacturers pricing development as a profit centre lose the funnel entirely, and those treating it as free marketing fill plants with programmes nobody ever selected for. Pricing early work to cover its own cost while weighing sponsor quality and indication odds explicitly keeps the option value without carrying the losses alongside it.
04 / FILED POSITION DEFENCE

Never discount into a programme already filed

A manufacturing site named inside a regulatory dossier retains fully 94% of commercial programmes, because moving it requires variations, comparability studies, and occasionally clinical bridging that no procurement saving would ever come close to covering. That position deserves defending through reliability and supply performance rather than through price concession, since the customer's genuine alternative is both expensive and genuinely slow. With programmes averaging eleven years, every point of margin surrendered at signature compounds across a remarkably long commercial commitment indeed.

Engagement Snapshot From the Field

A live engagement with an industry participant carrying material or product regulatory and market exposure ahead of a defining policy shift, showing how our research translates into a defensible multi-year portfolio strategy.
MARKET MINDS ADVISORY · CLIENT ENGAGEMENT SUMMARY
Fine Chemicals Producer Strategic Portfolio Review and Transition Roadmap 2026·Investment Scenario on Fine Chemicals Exposure Evaluation 2025-26
CLIENT PROFILE
A Western European fine chemicals manufacturer with revenue near EUR 310 million (client-reported, unverified by MMA), running multipurpose batch synthesis for pharmaceutical and agrochemical customers across development and commercial programmes. No continuous flow capability existed, containment was limited to moderate potency categories, and utilisation had declined for three consecutive years. Development work had never been selected against any criteria.
STRATEGIC CHALLENGE
Standard synthesis quotations were losing consistently to Indian and Chinese manufacturers on a cost gap the client could not close. Development work was accepted indiscriminately and most of it failed, filling reactors with programmes that never converted. Two containment enquiries had been declined outright for lack of qualified suite capacity.
MMA APPROACH
MMA analysed win and loss rates by chemistry type and programme stage, modelled continuous flow investment against route economics on lost quotations, and assessed containment capital against enquiry volume already declined. Forty-seven expert interviews with sponsors, technical operations leads, and supply chain security functions established how manufacturer selection genuinely happens now.
KEY FINDINGS
  1. Every quotation lost on price had been for chemistry any competent plant could run, and every award won had involved a transformation competitors were reluctant to attempt at all.
  2. Development programmes were accepted with no selection criteria whatsoever, and the resulting portfolio failed at a rate materially worse than the industry norm of 88%.
  3. Both declined containment enquiries had subsequently reached late-stage development elsewhere, taking commercial supply agreements the client had effectively forfeited by not building.
  4. Roughly two thirds of the client's own starting materials originated in China despite supply chain independence being central to its commercial positioning with European sponsors.
CLIENT PROFILE
A Western European fine chemicals manufacturer with revenue near EUR 310 million (client-reported, unverified by MMA), running multipurpose batch synthesis for pharmaceutical and agrochemical customers across development and commercial programmes. No continuous flow capability existed, containment was limited to moderate potency categories, and utilisation had declined for three consecutive years. Development work had never been selected against any criteria.
STRATEGIC CHALLENGE
Standard synthesis quotations were losing consistently to Indian and Chinese manufacturers on a cost gap the client could not close. Development work was accepted indiscriminately and most of it failed, filling reactors with programmes that never converted. Two containment enquiries had been declined outright for lack of qualified suite capacity.
MMA APPROACH
MMA analysed win and loss rates by chemistry type and programme stage, modelled continuous flow investment against route economics on lost quotations, and assessed containment capital against enquiry volume already declined. Forty-seven expert interviews with sponsors, technical operations leads, and supply chain security functions established how manufacturer selection genuinely happens now.
KEY FINDINGS
  1. Every quotation lost on price had been for chemistry any competent plant could run, and every award won had involved a transformation competitors were reluctant to attempt at all.
  2. Development programmes were accepted with no selection criteria whatsoever, and the resulting portfolio failed at a rate materially worse than the industry norm of 88%.
  3. Both declined containment enquiries had subsequently reached late-stage development elsewhere, taking commercial supply agreements the client had effectively forfeited by not building.
  4. Roughly two thirds of the client's own starting materials originated in China despite supply chain independence being central to its commercial positioning with European sponsors.
RECOMMENDED STRATEGY
Phase 1: Phase one: invest in continuous flow capability targeted at the hazardous transformations competitors decline, rather than at general capacity expansion of any kind. Phase 2: Phase two: introduce explicit development programme selection weighing sponsor quality and indication odds, and price early work to cover its own cost. Phase 3: Phase three: commit containment suite capital against declined enquiry volume, and qualify non-Chinese starting material sources to make the independence claim genuine.
OUTCOME
The client commissioned a flow unit within fourteen months and won two programmes on routes competitors could not quote. Development selection cut accepted programmes while raising conversion, containment capital was approved, and blended gross margin improved 8.6 percentage points (client-reported, unverified by MMA). Starting material qualification work is underway.

Frequently Asked Questions

Foundational context covering the market sizes, CAGR, scope, country, region and competition that inform every finding below. This section is provided to cover basics and most often pre-purchase conversations, answered from the MMA Primary Research Dataset.

What is the current size of the Fine Chemicals Market?

The market was valued at USD 118 billion in 2025, rising to an estimated USD 126.73 billion in 2026. East Asia holds the largest regional share at 30% of value.

How large will the Fine Chemicals Market be by 2036?

MMA forecasts USD 258.78 billion by 2036 under the base case, an expansion multiple of 2.04 times the 2026 value. That represents USD 132.05 billion of incremental value.

What is the CAGR for the Fine Chemicals Market 2026 to 2036?

The base case CAGR is 7.4%, with a bull case of 8.6% and a bear case of 6.2%. The spread reflects uncertainty over oral small molecule volumes and pipeline attrition.

Which segment is growing fastest?

Continuous flow and photochemistry grows fastest at 13.6%, roughly 1.84 times the market rate. High-potency containment manufacture follows at 12.4% on antibody conjugate demand and targeted oncology payload work.

Who are the major companies in the Fine Chemicals Market?

Lonza, Siegfried, Cambrex, Divi's Laboratories, and WuXi STA lead, holding roughly 18% between them. Concentration is low because most molecules can be made in competent multipurpose plants.

Which country is growing fastest?

India grows fastest at 10.2%, as manufacturers move up the capability curve rather than competing on cost alone. Production-linked incentives support backward integration into imported intermediates.

Report Segmentation Architecture

The full report scope spans multiple orthogonal segmentation dimensions, with cross-tabulated demand data provided for each dimension pair. Coverage extends further to regional breakdowns, trend trajectories, and the competitive detail needed to support segment-level decision-making.

By Synthesis Capability Class

  • Standard Multistep Organic Synthesis
  • Chiral and Asymmetric Synthesis
  • High-Potency Containment Manufacture
  • Continuous Flow and Photochemistry
  • Biocatalysis and Enzymatic Routes
  • Organometallic and Cryogenic Chemistry

By End-Use Industry

  • Pharmaceutical Development and Commercial Supply
  • Generic Active Ingredient Manufacture
  • Agrochemical Actives and Intermediates
  • Electronic and Semiconductor Chemicals
  • Flavour, Fragrance and Cosmetic Chemistry
  • Veterinary and Animal Health Products

By Sales Model

  • Exclusive Custom Synthesis Agreements
  • Filed Commercial Supply Contracts
  • Development Stage Programme Work
  • Catalogue and Merchant Intermediate Supply
  • Technology Transfer and Second Source Arrangements

By Region

  • North America
  • Western Europe
  • East Asia
  • South Asia and Pacific
  • Latin America
  • Middle East and Africa
  • Eastern Europe

Scope, Methodology, and Coverage

Every figure in this report is reproducible from documented input assumptions. The scope below maps the historical period, the forecast horizon, the segmentation dimensions, and the countries covered, alongside the underlying primary and qualitative methodology.
Historical Period
2020 to 2025
Forecast Period
2026 to 2036
Base Year
2025 (USD billions; MMA Primary Research Dataset, August 2026)
Market Definition
The market comprises fine chemicals manufactured by multistep synthesis and supplied to third parties on specification, covering standard multistep organic synthesis, chiral and asymmetric synthesis, high-potency containment manufacture, continuous flow and photochemistry, biocatalysis and enzymatic routes, and organometallic or cryogenic chemistry. Value is measured at manufacturer level across development, commercial, and merchant supply. Captive in-house production by pharmaceutical or agrochemical companies, commodity and bulk chemicals, biologics, cell and gene therapy manufacture, formulation and finished dose production, packaging, and laboratory reagent distribution fall outside scope.
Quantitative Units
USD billions (current prices); thousand tonnes of active and intermediate output annually; USD per kilogram by capability class and programme stage
Segmentation Dimensions
By Synthesis Capability Class; By End-Use Industry; By Sales Model; By Region
Regions Covered
North America, Western Europe, East Asia, South Asia and Pacific, Latin America, Middle East and Africa, Eastern Europe
Countries Covered
China, Japan, South Korea, Taiwan, India, Singapore, Australia, Indonesia, United States, Canada, Mexico, Switzerland, Germany, Ireland, United Kingdom, France, Italy, Spain, Netherlands, Denmark, Belgium, Hungary, Poland, Slovenia, Czechia, Brazil, Argentina, Israel, Egypt, South Africa
Key Companies Profiled
Lonza, Siegfried, Cambrex, Divi's Laboratories, WuXi STA, Recipharm, Catalent, Thermo Fisher Scientific, Asymchem, Porton Pharma Solutions, Hikal, Laurus Labs, Aarti Industries, Johnson Matthey, Evonik, Bachem, PolyPeptide Group, Corden Pharma, Sterling Pharma Solutions, Piramal Pharma Solutions
Quantitative Methodology
Primary survey, n=3,800 respondents, Q4 2025, six countries; demand-side model with trade association cross-validation
Qualitative Methodology
47 expert interviews, Q4 2025; applied to validate demand model assumptions, identify emerging dynamics, and assess competitive positioning
Report Format
PDF and XLSX data workbook (Word format preview document)
Publisher
Market Minds Advisory
Report Code
MMA-2026-CHM-334
Published
August 2026
Contact
sales@marketmindsadvisory.com | www.marketmindsadvisory.com

Purchase the full Fine Chemicals Market Report (2026 to 2036).

The full report sizes third-party fine chemical supply across six synthesis capability classes, six end-use industries, and seven regions with 2026 to 2036 forecasts under base, bull, and bear cases. It separates catalogue intermediate supply from filed commercial custom synthesis, since retention, pricing, and competitive dynamics differ completely between them. Competitive profiles cover twenty manufacturers assessed consistently on third-party manufacturing revenue, chemistry capability, and regulatory inspection history. Cost analysis traces starting material, labour, and energy exposure against contract structure. Commercial guidance addresses flow chemistry investment, containment timing, development portfolio discipline, and filed position defence.
Six capability classes sized separately by region
Catalogue supply separated from filed commercial custom synthesis
Onshoring cost premium quantified against Asian supply routes
Containment capacity availability mapped by potency category
Development attrition rates modelled through to commercial conversion
Starting material origin dependency traced beyond final synthesis site

Built For The People Who Decide

From boardroom strategy to bench-side execution, this report is read cover-to-cover by leaders shaping the next decade of their industry, turning demand scenarios, market dynamics and valuation benchmarks into decisions.
CXOs/ Presidents/ VPs/ Managers
M&A and Corporate Development
Strategy Teams and R&D Heads
Procurement and Product Directors
Regulatory and Compliance Leaders
Investor Relations and Equity Analysts