Market Minds Advisory
Fine Bubble Diffuser Market

Fine Bubble Diffuser Market: The Cheapest Component Setting The Largest Bill

Aeration burns more than half a treatment plant's electricity, and the diffuser is the cheapest part of it. A thirty-four dollar disc decides a power bill running for twenty years.

Lead Analyst

David Horsley

Published

September 2026

Make Smarter Decisions with Customized Research Insights

Request a free sample report and evaluate market opportunities, growth trends, and competitive dynamics relevant to your business needs.

2025 MARKET VALUE$1.1BMarket Size 2025
2036 FORECAST VALUE$2.2BBase Case , 2026 to 2036
CAGR 2026 TO 20366.6 %Bull 7.9% / Bear 5.4%
INCREMENTAL OPPORTUNITY$1.1BNet 10- year value creation
EXPANSION MULTIPLE1.90x2036 value over 2026 base
Strategic Levers
M&A Pipeline
Regional Outlook
Country Rankings
Competitive Intelligence
Segmental Deep-dive
Call-Us : 91 93563 13602

Executive Snapshot and Market Trajectory

Aeration consumes 54% of a wastewater treatment plant's electricity, and the diffuser costs almost nothing beside the blower driving it. That asymmetry is the whole story. The market reaches USD 1.1 billion in 2025 and grows at 6.6% on energy rather than on capacity growth anywhere at all.
Membrane panel and strip diffusers grow fastest at 11.8%, about 1.79 times the market rate, because they deliver the highest oxygen transfer efficiency and deep tanks convert that into blower power saved. East Asia holds 25% of value on Chinese plant construction, North America 27% on retrofit, and Western Europe 24%. Nearly all procured on unit price. Retrofit and new construction behave nothing alike in commercial terms at all.
Concentration runs at 51%, held up by membrane compounding and moulding capability that general equipment suppliers do not have. Competition turns on efficiency claims and fouling resistance. A poorly maintained grid loses 30% of transfer efficiency by year five, and almost nobody measures it, so the loss appears as electricity instead of as a maintenance item anybody notices. Suppliers who can prove efficiency compete on different ground. Very few of them actually manage it.
Market Definition
The fine bubble diffuser market covers diffuser elements producing bubbles below roughly three millimetres for biological wastewater aeration, together with the drop pipes, laterals, retrievable assemblies, and grid hardware supplied with them. It spans membrane disc, tube, panel, and strip designs alongside ceramic dome and porous plate types. Blowers and compressors, coarse bubble diffusers, mechanical surface and jet aerators, membrane bioreactor modules, and dissolved oxygen instrumentation are excluded.
Base Year Value
$1.1B in 2025 (MMA Primary Research Dataset, August 2026)
Forecast Period
2026 to 2036, eleven discrete annual values
CAGR
6.6% base case. Bull 7.9%. Bear 5.4%.
Fastest Growth Segment
Membrane Panel and Strip Diffusers: 11.8% CAGR
Fastest Growth Country
India: 9.6% CAGR
Fastest Growth Region
South Asia and Pacific: 8.8% CAGR
Largest Region
North America: 27% of 2025 global value
Market Leaders
Xylem, Veolia Water Technologies, Environmental Dynamics International, SSI Aeration, Aquaconsult Anlagenbau. Source: MMA Primary Research Dataset, July 2026.
Primary Survey
n=3,800 procurement and R&D decision-makers, Q4 2025, six countries
Methodology
Demand-side build-up, cross-validated against public data, 47 expert interviews

Fine Bubble Diffuser Market Forecast Scenarios

fine-bubble-diffuser-market-size-forecast-scenario-1787333808158
Between 2020 and 2025 municipal capital budgets moved slowly while energy prices did not. European and North American utilities facing power costs they could not pass on began treating aeration efficiency as a cost line, and diffuser retrofit became one of the few investments paying back in months. Chinese plant construction continued throughout. A 5.3% historical CAGR blends those two very different demand types.
Three mechanisms carry the 6.6% base case. Energy cost is the largest, since aeration takes 54% of plant electricity and a diffuser upgrade is the cheapest intervention available against it. Nutrient discharge consent tightening is the second, because meeting a lower ammonia limit usually means more oxygen into the same tank rather than a bigger tank. And Asian municipal treatment capacity keeps being built at a pace no other region approaches.
The 7.9% bull case turns on utilities adopting off-gas testing as routine practice, which would expose efficiency losses that currently stay invisible in the electricity bill. The 5.4% bear case is municipal capital deferral, since a diffuser retrofit competes against every other item in a constrained public budget. Neither scenario turns on the technology. Utilities decide both, and neither decision is technical.

Three Per Cent Of The Project, Half The Bill

A diffuser element costs about USD 34 and represents perhaps 3% of an aeration retrofit, while the oxygen transfer efficiency it delivers sets the blower power for the next decade. Aeration is 54% of a plant's electricity. That makes this the cheapest place to change a plant power bill, and almost nobody buys it that way.
TOP FIVE CONCENTRATION51%Aeration specialists hold positions general equipment suppliers cannot reach
AVERAGE DIFFUSER PRICEUSD 34Delivered price of a single membrane disc diffuser element
AERATION ENERGY SHARE54%Portion of a treatment plant's total electricity consumed by aeration
MEMBRANE SERVICE LIFE5 to 10 yearsOperating years before membrane replacement becomes economically necessary
FOULED EFFICIENCY LOSS30%Oxygen transfer decline on a poorly maintained diffuser grid
LEADING PRODUCER SHARE36%Membrane compounding and moulding concentrate where elastomer capability exists
The reason is organisational rather than technical. A procurement team compares diffuser prices per unit because that is what a purchase order contains, while the electricity consequence lands in an operating budget somebody else defends. Nobody in that transaction is rewarded for spending more on discs to spend less on power, and no document connects the two decisions. Nobody has an incentive to connect them either. That organisational gap is the whole reason this market underperforms its own physics.
Fouling makes it worse. Membranes stiffen, pores distort, and biofilm accumulates, so a grid delivering its rated efficiency at commissioning can be 30% down by year five. Confirming that requires an off-gas test nobody budgets for, so plants simply run blowers harder and pay. The loss is real, continuous, and completely invisible on any purchase document.
"A utility will spend six months negotiating a blower and buy the diffusers on a spreadsheet comparison. The blower is a fixed efficiency you cannot improve. The diffusers are the variable that decides how hard it has to work. They have got the whole thing exactly backwards."
Director, Water Infrastructure Practice · MMA Construction and Industrial Equipm

Market Trends

Energy Cost Turns Aeration Into A Finance Question

Aeration takes 54% of a treatment plant's electricity and utilities in Europe and North America have spent three years unable to pass power costs through to a regulated tariff. That moved oxygen transfer efficiency out of the engineering department and into a conversation the finance director has, because a diffuser retrofit is one of the few interventions with a payback measured in months rather than decades. Panel and strip designs offering the highest transfer efficiency benefit most from that reframing. The argument works only where somebody has modelled the energy, which is where most suppliers still fail.
Market Impact: Material choice shifts efficiency 1
Tighter Nutrient Consents Demand More Oxygen Per Tank

Regulators across Europe and North America keep lowering permitted ammonia and total nitrogen discharge, and a plant meeting a stricter consent generally needs more oxygen delivered into the tanks it already has rather than more tank volume it cannot afford. That converts a compliance requirement into a diffuser density and efficiency question directly. Utilities discover that adding diffusers is cheaper and faster than adding basins by a wide margin, particularly where the site has no land available. The revised urban wastewater directive in Europe pushes the same way across a large installed population.
Market Impact: Asian capacity adds 8% annually

Market Opportunities and Growth Drivers

Membrane Material Choice Decides Efficiency Over Ten Years

EPDM membranes lose plasticiser over time, harden, and permanently distort their pore openings, which reduces oxygen transfer efficiency in a way no cleaning recovers. Polyurethane resists that migration and silicone resists it further still, at prices that look expensive on a unit comparison and cheap on a decade of electricity. The difference between the materials across a ten year life runs well beyond the entire diffuser purchase. Buyers who model it choose differently from buyers who do not, and the second group is considerably larger than the first at present.
Market Impact: Off-gas tests cost USD 12,000

Asian Municipal Treatment Capacity Keeps Being Built

Chinese and Indian municipal wastewater treatment capacity continues expanding at a pace developed markets have not seen since the 1970s, and each new plant specifies a complete diffuser grid rather than a replacement set. That is genuine unit demand rather than the retrofit and replacement volume driving Western markets. Specification levels vary enormously, with export-standard plants buying international product and domestic municipal work buying local. Volume is growing considerably faster than value here, which is a familiar pattern and one suppliers routinely misread when planning capacity. Value grows more slowly than units here.
Market Impact: Lowest tender wins 70% of awards

Market Restraints and Challenges

Nobody Measures Efficiency Loss So Nobody Funds Replacement

Oxygen transfer efficiency degrades continuously as membranes foul and stiffen, but confirming the loss requires an off-gas test that costs money, takes a plant out of normal operation, and appears in no maintenance schedule. The root cause is that the consequence lands in an electricity bill nobody attributes to the diffusers. Commercially this delays replacement well past the economic optimum and caps the market below what the physics justifies. Suppliers are mitigating by offering off-gas testing as a service, by publishing efficiency decay curves, and by writing performance guarantees into supply agreements.
Market Impact: Aeration takes 54% of plant power

Municipal Procurement Compares Unit Price Not Lifetime Cost

Public procurement rules generally require award to the lowest compliant tender, and a diffuser specification written on materials and dimensions makes every compliant offer look identical on paper. The root cause is that oxygen transfer efficiency is difficult to specify verifiably and easy to claim, so procurement officers exclude it rather than adjudicate it. Commercially this rewards the cheapest compliant product regardless of what it costs to run. Suppliers are mitigating by working with consulting engineers at specification stage and by pushing third-party verified efficiency testing into tender documents. Verifiable efficiency is the only way out.
Market Impact: Consents cut ammonia limits by 40%
3 additional market trends, 2 additional growth drivers, and 4 additional restraints and challenges are covered in the full report. Contact sales@marketmindsadvisory.com to access the complete intelligence.

Segment CAGR and Growth Architecture

Segmentation follows diffuser geometry, because the shape of the element determines bubble size distribution, oxygen transfer efficiency, headloss, fouling behaviour, and the tank depth at which the design makes sense. Membrane material, tank configuration, and end-use application are handled in the framework and commentary, since each cuts across every geometry rather than defining one of them.
fine-bubble-diffuser-market-market-share-analysis-1787333808691

Membrane Panel and Strip Diffusers

Panel and strip diffusers grow fastest at 11.8%, about 1.79 times the market rate, because they deliver the highest oxygen transfer efficiency of any geometry and deep tanks convert that straight into blower power avoided. A large flat membrane area distributes air across a greater footprint than discs at equivalent airflow, which produces finer bubbles at lower headloss and better distribution across the tank floor. Installation is more involved and the capital cost per square metre of tank is higher, which is why the geometry only wins where somebody has modelled the energy properly. Utilities facing power costs they cannot pass through are doing that modelling for the first time, and the segment grows accordingly.
CAGR 11.8%

Membrane Tube Diffusers

Tube diffusers grow at 7.4%, holding retrofit applications where a grid must be installed into an existing tank without draining it and where retrievable assemblies matter more than peak efficiency. A tube mounted on a lateral can be lifted, inspected, and replaced from the surface, which suits plants that cannot take a basin offline for maintenance at any point in the year. Oxygen transfer efficiency sits below panel designs and above older ceramic types, and headloss is manageable across a wide airflow range. Industrial wastewater applications favour the geometry for the same access reasons, particularly in food processing and chemical plants where the treatment train runs continuously and cannot be stopped.
CAGR 7.4%
Full segment breakdown across 7 segments available in the complete report.

Regional Architecture and Country Demand Map

Regional shares divide between two demand types that look nothing alike: retrofit of ageing plant in developed markets driven by energy cost, and complete grids specified into new construction across Asia. Growth rates reflect which of the two each region is running on rather than any technology preference.

North America

North America holds 27% of value almost entirely on retrofit rather than new build, because the municipal treatment estate here was largely constructed between the 1970s and the 1990s and is now well past first diffuser replacement. Electricity costs that utilities cannot fully recover through regulated rates have made aeration efficiency a board level conversation at a surprising number of water authorities. Nutrient consent tightening across the Chesapeake, the Great Lakes, and much of the Midwest pushes the same way by requiring more oxygen into existing basins. Consulting engineers hold enormous specification influence and most suppliers underinvest in reaching them. Growth at 6.2% sits close to the global rate, carried by energy economics rather than by any capacity expansion.
Share: 27% | CAGR: 6.2% (2026 to 2036)

East Asia

New construction rather than retrofit gives East Asia 25% of value. Chinese municipal treatment capacity continues expanding under national water quality programmes, and each plant specifies a complete diffuser grid from scratch rather than replacing an existing one. Domestic manufacturers supply most of that volume at prices international suppliers cannot approach, while export-standard and industrial installations still buy imported product. Japanese and Korean demand is replacement-weighted and technically demanding, with energy efficiency benchmarking applied as rigorously as in Europe. Growth at 7.6% exceeds the global rate on construction volume, though value grows more slowly than units because the domestic share of that construction keeps rising every year. Domestic supply keeps taking share of that construction volume.
Share: 25% | CAGR: 7.6% (2026 to 2036)
Regional intelligence for 5 additional markets available in the complete report: Western Europe, South Asia and Pacific, Latin America, Middle East and Africa, Eastern Europe. Contact sales@marketmindsadvisory.com.
fine-bubble-diffuser-market-country-cagr-analysis-1787333809209

Where Diffuser Value Actually Accrues

Four levers matter here, and none of them is the price of the element. Energy modelling, specification stage engagement, verified efficiency testing, and material selection decide outcomes, because the buyer's real cost is electricity rather than hardware. A supplier competing on unit price is arguing over 3% of a project and ignoring the other half.

Model The Electricity, Not The Purchase Order

Aeration takes 54% of a plant's power and a diffuser grid decides how hard the blowers work to deliver it, which means the real comparison between two offers is an energy model rather than a price list. A supplier who arrives with a modelled annual kilowatt hour figure for the specific tank geometry changes what the buyer is deciding. That work takes a process engineer several days and costs nothing against the contract value. Most suppliers quote a unit price into a procurement process that never asked the question they could most usefully answer.
Market Impact: Aeration consumes 54% of a plant el

Reach The Consulting Engineer Before The Tender

Municipal specifications are written by consulting engineers roughly 6 months before procurement opens, and a specification naming oxygen transfer efficiency verified under third-party test excludes most of the field before any price is submitted. A supplier present at that stage shapes what gets specified. One arriving at tender bids against a document somebody else influenced and competes only on price. Engineering firms hold this influence across hundreds of projects and are reached by a handful of technical relationships rather than by advertising, which makes it the cheapest access in the whole market.
Market Impact: Specifications close roughly 6 mont

Sell Off-Gas Testing As A Service

Efficiency loss from fouling reaches 30% by year five and stays invisible because confirming it requires an off-gas test costing around USD 12,000 that appears in no maintenance schedule. A supplier offering that test, at cost or free, converts an invisible problem into a documented one with a number attached. The utility then has a business case for replacement it could not previously build, and the supplier who produced the evidence is the obvious source. Very few manufacturers do this, and the ones who do describe it as their most productive commercial activity.
Market Impact: Off-gas testing exposes the full 30

Specify The Membrane Material On Decade Economics

EPDM hardens as plasticiser migrates and permanently loses pore geometry, while polyurethane and silicone resist that at higher unit cost. Across a ten year life the 15% efficiency difference between materials is worth considerably more than the entire diffuser purchase, and a supplier who models that comparison sells the expensive option on arithmetic rather than on persuasion. Buyers who see the calculation choose differently from buyers who do not. Presenting it costs a spreadsheet and reframes the whole transaction away from the unit price comparison the buyer arrived intending to run.
Market Impact: Material choice moves transfer effi

Who Controls the Margin Pool

Concentration sits at 51% for the top five, which is high for a component this simple, because membrane compounding and moulding are genuine capabilities that general equipment suppliers do not hold. The gap between leaders and challengers is verified efficiency data and specification stage access rather than product design. All participants here are assessed on one basis, revenue from fine bubble diffuser elements and their dedicated grid hardware.
Competition runs on four lines. Verified oxygen transfer efficiency decides technically evaluated tenders, though many tenders do not evaluate it. Specification stage access decides what the tender document permits in the first place. Membrane material capability decides who can offer polyurethane and silicone credibly. Price decides everything else, and in public procurement that is most of it.

Two pressures will move positions. Chinese manufacturers hold cost positions that international suppliers cannot approach and are working through the certification and reference project requirements that currently keep them out of Western municipal work. Meanwhile utilities beginning to model energy properly are a different customer from the one this industry has served. Positions favour whoever can substantiate efficiency and reach the consulting engineer who writes the specification.
fine-bubble-diffuser-market-company-positioning-matrix-1787333809733

Competitive Moat and Risk Dimensions

XYLEM

Moat: Sanitaire reference base and modelling

Xylem's Sanitaire aeration business holds one of the largest installed reference bases in municipal treatment, and reference projects matter enormously in public procurement where nobody wants to be the first buyer. Process engineering capability lets it model tank performance rather than quote a component. Breadth across pumps, treatment, and instrumentation reaches the utility through several relationships at once.
XYLEM

Risk: Breadth dilutes specialist focus

Aeration is one business among many inside a large water technology group, which means engineering attention and capital compete against product lines with better near-term returns. Specialist competitors bring process engineers who work on nothing else. Price competition from Asian manufacturers reaches the standard disc ranges most directly, and those ranges carry the volume rather than the margin.
VEOLIA WATER TECHNOLOGIES

Moat: Operator relationships and plant access

Veolia operates treatment plants as well as supplying them, which gives it aeration performance data pure suppliers never see and a route into utilities through service contracts. The Evoqua acquisition added substantial North American aeration depth and installed base. Understanding what a diffuser grid actually does across ten years is a genuine advantage in this category.
VEOLIA WATER TECHNOLOGIES

Risk: Conflict between operator and supplier

Utilities that compete with Veolia for operating contracts are sometimes reluctant to buy equipment from it, which closes accounts a pure supplier would reach. Integration across a very large acquisition consumes management attention that competitors are using to sell. Municipal procurement rules in several markets also limit how far an operating relationship can be converted into equipment supply.

Players Tracked

Prominent Players

Xylem
Veolia Water Technologies
Environmental Dynamics International
SSI Aeration
Aquaconsult Anlagenbau

Other Key Players

Ovivo
WesTech Engineering
Parkson
Sulzer
Invent Umwelt
Jäger Umwelttechnik
Nopon Oy
Aquarius Technologies
Nijhuis Saur Industries
Diffused Gas Technologies
Aquatec-Maxcon
Kusters Water
Ecologix Environmental Systems
Tsurumi Manufacturing
Huber SE

Recent Developments

MARCH 2025

European wastewater directive tightens nutrient removal deadlines

Implementation timetables under the revised European urban wastewater treatment directive were confirmed, setting nutrient removal deadlines across a very large installed plant population. These were regulatory confirmations rather than commercial events, and meeting a tighter ammonia limit generally means more oxygen into existing tanks rather than new ones.
Signal: A consent deadline converts an efficiency
SEPTEMBER 2024

Utilities adopt energy benchmarking across treatment estates

Water utilities in several European countries extended published energy benchmarking across their treatment works, comparing kilowatt hours per volume treated between plants and against peers. These were operational reporting changes rather than transactions, and they make aeration inefficiency visible to people who had never previously seen it.
Signal: Publishing a comparison between operators
JUNE 2024

Chinese diffuser manufacturers pursue international project references

Chinese fine bubble diffuser manufacturers began targeting internationally funded treatment projects outside China to build the reference base that Western municipal procurement effectively requires. These were competitive positioning moves rather than corporate transactions, and reference projects are the barrier rather than product capability or price.
Signal: Reference projects are the last barrier in

Elastomer, Moulding, Stainless, And Freight

Membrane material dominates and separates the product tiers completely. EPDM compound carries 26% to 38% of a standard disc diffuser's cost, from a broad set of elastomer suppliers. Polyurethane and silicone compounds run 44% to 60% on premium ranges, from a much narrower base. Moulded polypropylene bodies and stainless retainers add 18% to 26%. Freight matters unusually, since a grid is bulky and low in value.
European elastomer and polymer prices rose sharply through 2021 and 2022 as energy costs hit chemical production and several producers declared force majeure, and the IEA documented the underlying industrial energy constraint. Silicone in particular moved on upstream siloxane availability. Xylem and Sulzer both disclosed input cost pressure across that period. Suppliers holding municipal framework prices agreed years earlier had no pass-through mechanism, and several absorbed the increase entirely.

Each range above exceeds three points because an EPDM disc and a silicone panel share almost nothing beyond the retaining ring. Exposure separates by material mix. A standard disc supplier carries broad elastomer risk it can index. A premium supplier carries silicone exposure to a narrow base and cannot substitute without requalifying the whole efficiency claim. Asian manufacturers hold compounding, moulding, and freight advantages together.
fine-bubble-diffuser-market-cost-volatility-analysis-1787333809931

Index municipal framework prices to elastomer

Membrane compound carries up to 60% of a premium diffuser's cost and moved by large multiples between 2021 and 2023, while municipal framework agreements routinely fix prices for three years or more. That combination is a commodity position taken without intending to. Indexation costs a concession at award and removes an exposure that already erased sector margin once.

Qualify a second silicone compound before you need it

Silicone and polyurethane compounds come from a narrow supplier base, and switching means requalifying the oxygen transfer efficiency claim that the whole product proposition rests on. That work takes months and independent testing. Doing it while supply is comfortable costs testing time only, and the alternative is a premium range unable to ship during a shortage nobody forecast.

Mould bodies regionally, ship membranes centrally

Diffuser bodies are bulky and cheap while membranes are dense and valuable, so shipping complete assemblies across an ocean pays freight on air. Moulding bodies near the market and shipping only membrane and hardware centrally cuts freight substantially and shortens lead times. It costs regional tooling investment that most suppliers keep deferring until a competitor does it first.

Portfolio Architecture for Margin Defence

Three tiers sit inside this category and the material draws most of the lines. Standard EPDM disc diffusers form the volume tier, sold on unit price into public tenders where every compliant offer looks alike. Verified efficiency ranges with third-party test data earn more, because the documentation is what a competitor must replicate. Premium membrane materials and panel geometries price highest, since they sell against an electricity bill rather than against another diffuser.
The tension is between tender volume that fills the moulding line and efficiency work that earns money. Public procurement awards on lowest compliant price, and a specification written on dimensions makes everything compliant, so volume goes to whoever is cheapest. Yet the same utility pays the electricity consequence for a decade. Suppliers who resolve this do it by reaching the consulting engineer before the specification is written, not by arguing at tender.

High-value pools concentrate where evidence limits competition: verified oxygen transfer efficiency in technically evaluated tenders, premium membrane materials sold on decade economics, panel geometries in deep tanks, and any grid specified after an off-gas test the supplier performed. The commodity end is standard EPDM discs into lowest-price municipal tender, where Asian manufacturing sets the level.

Volume / Commodity-Adjacent Tier

Standard EPDM disc and tube diffusers sold into lowest-price municipal and industrial tenders. The range is wide because Asian compounding and moulding cost positions differ enormously from Western ones on physically comparable elements.
Gross Margin: 18-32%

Premium / Certified Tier

Diffuser ranges carrying third-party verified oxygen transfer efficiency data and documented performance guarantees. The range is wide because technically evaluated tenders hold pricing while the same product competes on price wherever evaluation is dimensional.
Gross Margin: 30-46%

Sustainability / Regulatory / Next-Generation Tier

Polyurethane and silicone membranes, panel and strip geometries, and grids sold with energy modelling attached. The range is wide because material cost varies sharply while the energy argument supports pricing that unit comparison never would.
Gross Margin: 38-58%
fine-bubble-diffuser-market-portfolio-architecture-1787333810432

High-value Sub-segments and Strategic Watch-out

Membrane Panel and Strip Diffusers

High value and high growth at 11.8%, the fastest geometry, because it delivers the highest oxygen transfer efficiency available and deep tanks convert that into blower power avoided. It only wins where somebody has modelled the energy, which remains the exception rather than the rule.
Gross Margin: 38-58%

Membrane Tube Diffusers

High value with strong growth at 7.4%, holding retrofit and industrial work where retrievable access matters more than peak efficiency. Plants that cannot take a basin offline at any point in the year specify this geometry almost regardless of what the energy model says. Access beats efficiency here.
Gross Margin: 30-46%

Membrane Disc Diffusers

The volume core by units at 6.2%, the default specification on the majority of municipal tanks worldwide and the geometry every manufacturer builds. Price decides most awards, and the efficiency differences between compliant offers are real but rarely evaluated by anybody. Volume without much reward attached.
Gross Margin: 18-32%

Ceramic Dome Diffusers

The strategic watch-out at 2.4%, a durable technology with genuine longevity that membrane designs have beaten on efficiency and installed cost for two decades now. Replacement demand from a shrinking installed base is the entire remaining opportunity in this tier. A managed decline, honestly described.
Gross Margin: 18-32%

How Aeration Demand Actually Commits

Demand commits at plant design or retrofit specification and then repeats on membrane replacement every five to ten years. A grid installed in a tank sets the mounting, the lateral spacing, and the airflow envelope, so replacement usually means the same geometry from a supplier who fits it. That gives incumbents a genuine annuity at low defence cost. The real competitive moments are a new plant, a full retrofit, and a consent change forcing more oxygen into the same basin.
Stickiness varies with how hard the plant is to take offline. Continuous industrial treatment sticks hardest, since the operator cannot drain a basin and will not experiment. Large municipal works stick nearly as hard through mounting compatibility and spares standardisation across many tanks. Small municipal plants stick least, because each replacement is retendered against whatever compliant offers arrive.

The buyer has changed from a plant superintendent to an asset manager with an energy target and, increasingly, a sustainability officer reporting operational carbon. Twenty years ago the conversation was durability and cleaning frequency. Now it is kilowatt hours per volume treated and how the supplier can evidence them. Suppliers leading with membrane durability address a person who stopped deciding.
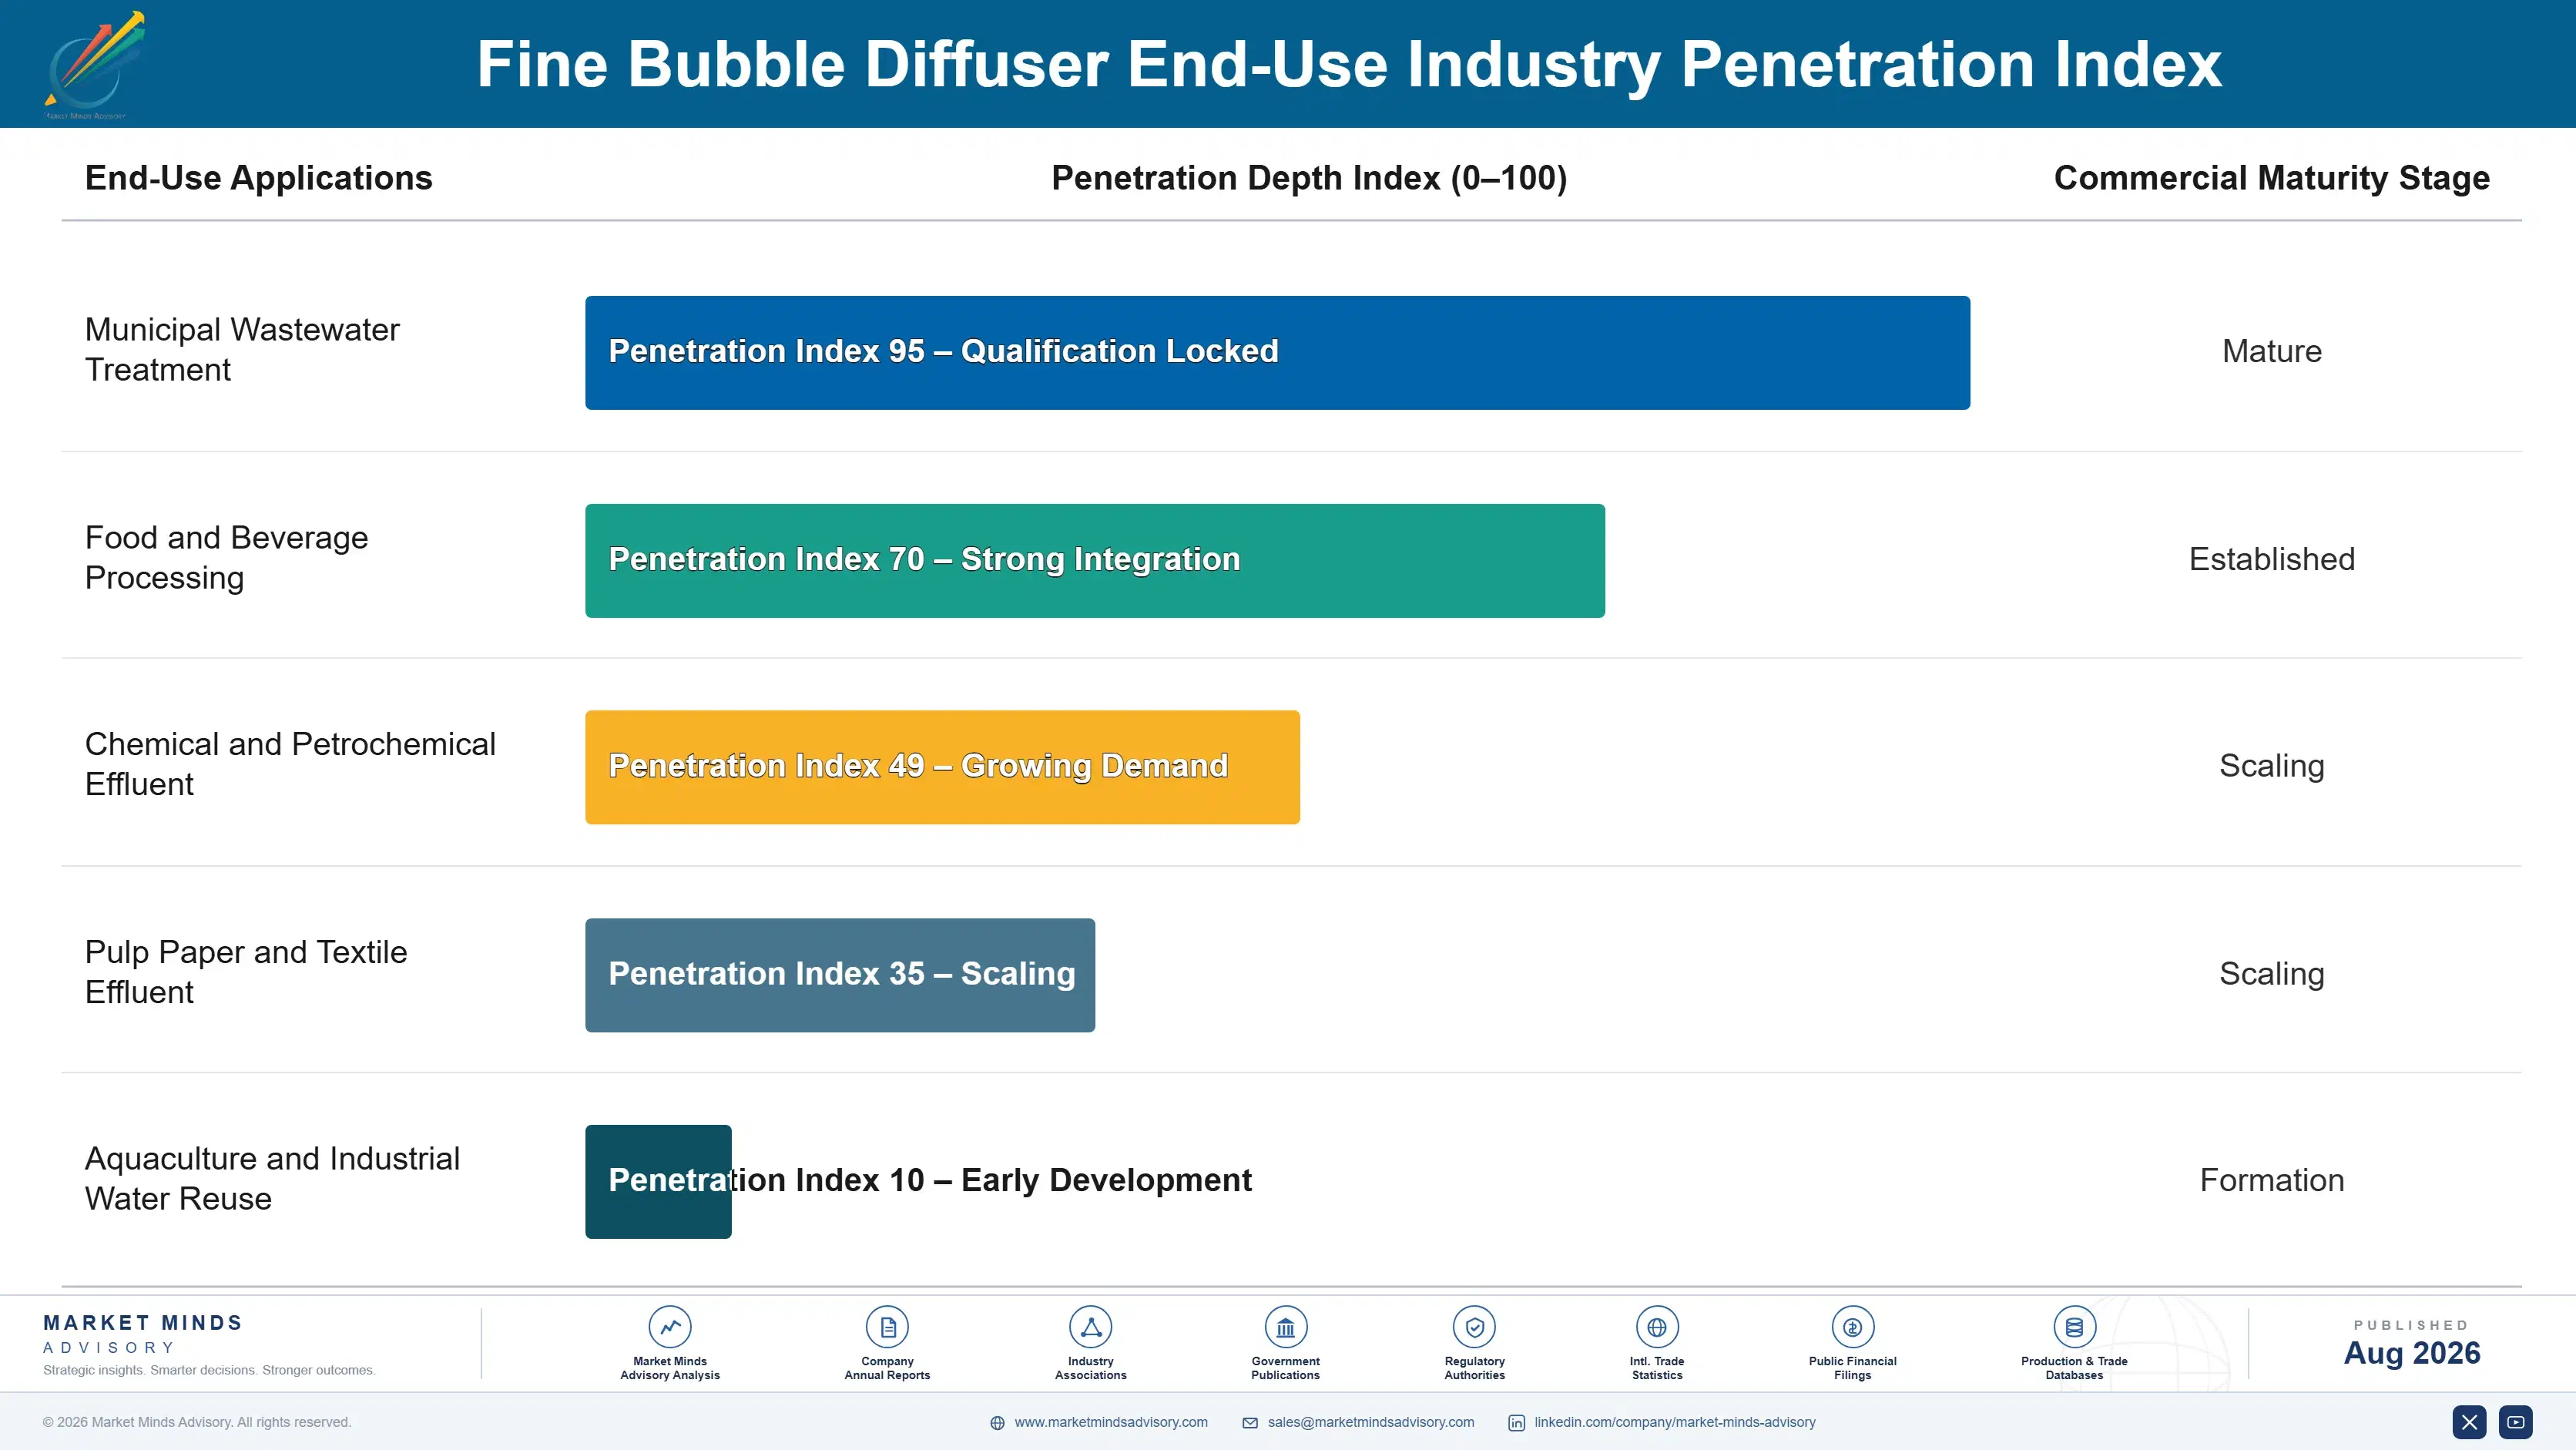
fine-bubble-diffuser-market-end-use-penetration-index-1787333810920

Our Call On Fine Bubble Diffusers

These are among the four positions where our research anticipates prominent divergence between winners and laggards over the coming forecast period. Each is grounded in the demand model, the regulatory perimeter, and the announced capacity pipeline.
01 / ENERGY MODEL SELLING

Quote the electricity, not the element

Aeration consumes 54% of a treatment plant's electricity and the diffuser grid determines how hard the blowers work to deliver it, which makes the honest comparison between two offers an annual kilowatt hour figure rather than a unit price. A supplier arriving with that number modelled for the specific tank geometry has changed what the buyer is deciding and removed the comparison the procurement process was built to run. Most suppliers still quote a price list into a process that never asked the question they could most usefully answer.
02 / SPECIFICATION STAGE ACCESS

The tender is written before it opens

Municipal specifications are drafted by consulting engineers months ahead of procurement, and a document naming third-party verified oxygen transfer efficiency excludes most of the field before any price is submitted or compared. A supplier present at that stage shapes what becomes compliant, while one arriving at tender competes only on price against a specification somebody else influenced. Engineering firms carry that influence across hundreds of projects and are reached through a handful of technical relationships rather than through any marketing spend.
03 / EFFICIENCY LOSS EVIDENCE

Prove the invisible loss and fund the replacement

A fouled diffuser grid loses roughly 30% of its oxygen transfer efficiency by year five, and nobody replaces it because confirming the loss needs an off-gas test costing around USD 12,000 that appears in no maintenance schedule anywhere. A supplier offering that test converts an invisible operating cost into a documented business case the utility can actually fund, and becomes the obvious source of the replacement it justifies. The manufacturers doing this describe it as their single most productive commercial activity.
04 / MEMBRANE MATERIAL ECONOMICS

Sell the decade, not the disc

EPDM hardens as plasticiser migrates out and permanently loses the pore geometry that oxygen transfer depends on, while polyurethane and silicone resist that at unit prices which look indefensible on a procurement spreadsheet. Across ten years the efficiency difference is worth considerably more than the entire diffuser purchase, and a supplier who models that comparison sells the expensive option on arithmetic rather than persuasion. Presenting the calculation costs a spreadsheet and reframes a transaction the buyer arrived intending to decide on price.

Engagement Snapshot From the Field

A live engagement with an industry participant carrying material or product regulatory and market exposure ahead of a defining policy shift, showing how our research translates into a defensible multi-year portfolio strategy.
MARKET MINDS ADVISORY · CLIENT ENGAGEMENT SUMMARY
Fine Bubble Diffuser Producer Strategic Portfolio Review and Transition Roadmap 2026·Investment Scenario on Fine Bubble Diffuser Exposure Evaluation 2025-26
CLIENT PROFILE
A European regional water utility operating eighteen treatment works engaged MMA after electricity became its second largest operating cost and the regulator declined to allow full pass-through (client-reported, unverified by MMA). Aeration accounted for the majority of that consumption and most of the diffuser grids across the estate were between eight and fifteen years old with no efficiency data anywhere.
STRATEGIC CHALLENGE
Operations wanted to replace diffusers at every site and had no budget for it. Finance wanted evidence before funding anything. Nobody knew which of the eighteen works were actually losing efficiency and which were performing acceptably, and the procurement team intended to run the whole thing as a single lowest-price tender regardless of what the answer turned out to be.
MMA APPROACH
MMA commissioned off-gas testing at six representative works chosen across age, geometry, and membrane material rather than testing everything. We modelled annual electricity consequence per site against replacement cost using the utility's own tariff. We then compared three procurement routes: a single lowest-price framework, a performance-specified tender with verified efficiency requirements, and a phased programme sequenced by measured loss.
KEY FINDINGS
  1. Measured oxygen transfer efficiency loss varied from 8% to 41% across the six tested works, and age correlated far less strongly with loss than membrane material did (client-reported, unverified by MMA).
  2. The three worst sites accounted for more annual electricity waste than the other fifteen combined, which made a phased programme obviously superior to a uniform one.
  3. A lowest-price framework modelled worse over ten years than a performance-specified tender, even allowing for a substantially higher unit price on the latter.
  4. Polyurethane membranes at the two newest works showed materially less degradation than EPDM at works of similar age, which nobody at the utility had noticed.
CLIENT PROFILE
A European regional water utility operating eighteen treatment works engaged MMA after electricity became its second largest operating cost and the regulator declined to allow full pass-through (client-reported, unverified by MMA). Aeration accounted for the majority of that consumption and most of the diffuser grids across the estate were between eight and fifteen years old with no efficiency data anywhere.
STRATEGIC CHALLENGE
Operations wanted to replace diffusers at every site and had no budget for it. Finance wanted evidence before funding anything. Nobody knew which of the eighteen works were actually losing efficiency and which were performing acceptably, and the procurement team intended to run the whole thing as a single lowest-price tender regardless of what the answer turned out to be.
MMA APPROACH
MMA commissioned off-gas testing at six representative works chosen across age, geometry, and membrane material rather than testing everything. We modelled annual electricity consequence per site against replacement cost using the utility's own tariff. We then compared three procurement routes: a single lowest-price framework, a performance-specified tender with verified efficiency requirements, and a phased programme sequenced by measured loss.
KEY FINDINGS
  1. Measured oxygen transfer efficiency loss varied from 8% to 41% across the six tested works, and age correlated far less strongly with loss than membrane material did (client-reported, unverified by MMA).
  2. The three worst sites accounted for more annual electricity waste than the other fifteen combined, which made a phased programme obviously superior to a uniform one.
  3. A lowest-price framework modelled worse over ten years than a performance-specified tender, even allowing for a substantially higher unit price on the latter.
  4. Polyurethane membranes at the two newest works showed materially less degradation than EPDM at works of similar age, which nobody at the utility had noticed.
RECOMMENDED STRATEGY
Phase 1: Phase 1 (0 to 8 months): Test the remaining twelve works and rank the whole estate by measured annual electricity waste rather than by grid age. Phase 2: Phase 2 (8 to 26 months): Replace the worst-performing sites first under a performance-specified tender requiring verified efficiency data. Sequence by measured waste. Phase 3: Phase 3 (26 to 48 months): Standardise on polyurethane membranes across the estate and adopt off-gas testing on a fixed cycle.
OUTCOME
The board funded estate-wide testing and abandoned the uniform lowest-price framework, which the procurement director accepted once the ten-year comparison was presented. The three worst sites were replaced first and the client reports aeration electricity falling materially against a rising tariff (client-reported, unverified by MMA). Estate-wide material standardisation remains under discussion.

Frequently Asked Questions

Foundational context covering the market sizes, CAGR, scope, country, region and competition that inform every finding below. This section is provided to cover basics and most often pre-purchase conversations, answered from the MMA Primary Research Dataset.

What is the current size of the Fine Bubble Diffuser Market?

The global market is valued at USD 1.1 billion in 2025, covering membrane disc, tube, panel, and strip diffusers alongside ceramic dome and porous plate types. Blowers, coarse bubble diffusers, and surface aerators are excluded.

How large will the Fine Bubble Diffuser Market be by 2036?

The market is forecast to reach USD 2.22 billion by 2036 in the base case, about 1.90 times the 2026 level. That represents incremental value of roughly USD 1.05 billion.

What is the CAGR for the Fine Bubble Diffuser Market 2026 to 2036?

The market grows at a 6.6% CAGR in the base case, with bull and bear scenarios at 7.9% and 5.4%. The spread turns on off-gas testing adoption and on municipal capital availability.

Which segment is growing fastest?

Membrane panel and strip diffusers grow fastest at 11.8%, about 1.79 times the overall rate, because they deliver the highest oxygen transfer efficiency available. Membrane tube diffusers follow at 7.4%.

Who are the major companies in the Fine Bubble Diffuser Market?

Leading participants include Xylem, Veolia Water Technologies, Environmental Dynamics International, SSI Aeration, and Aquaconsult Anlagenbau. Concentration sits at roughly 51%, reflecting membrane compounding capability general suppliers lack.

Which country is growing fastest?

India grows fastest at a 9.6% CAGR, driven by national river cleaning and urban sanitation programmes building treatment capacity at unprecedented rates. China follows on continued municipal plant construction.

Report Segmentation Architecture

The full report scope spans multiple orthogonal segmentation dimensions, with cross-tabulated demand data provided for each dimension pair. Coverage extends further to regional breakdowns, trend trajectories, and the competitive detail needed to support segment-level decision-making.

By Diffuser Geometry

  • Membrane Panel and Strip Diffusers
  • Membrane Tube Diffusers
  • Membrane Disc Diffusers
  • Ceramic Dome Diffusers
  • Porous Plate Diffusers

By End-Use Industry

  • Municipal Wastewater Treatment
  • Food and Beverage Processing
  • Chemical and Petrochemical Effluent
  • Pulp Paper and Textile Effluent
  • Aquaculture and Industrial Water Reuse

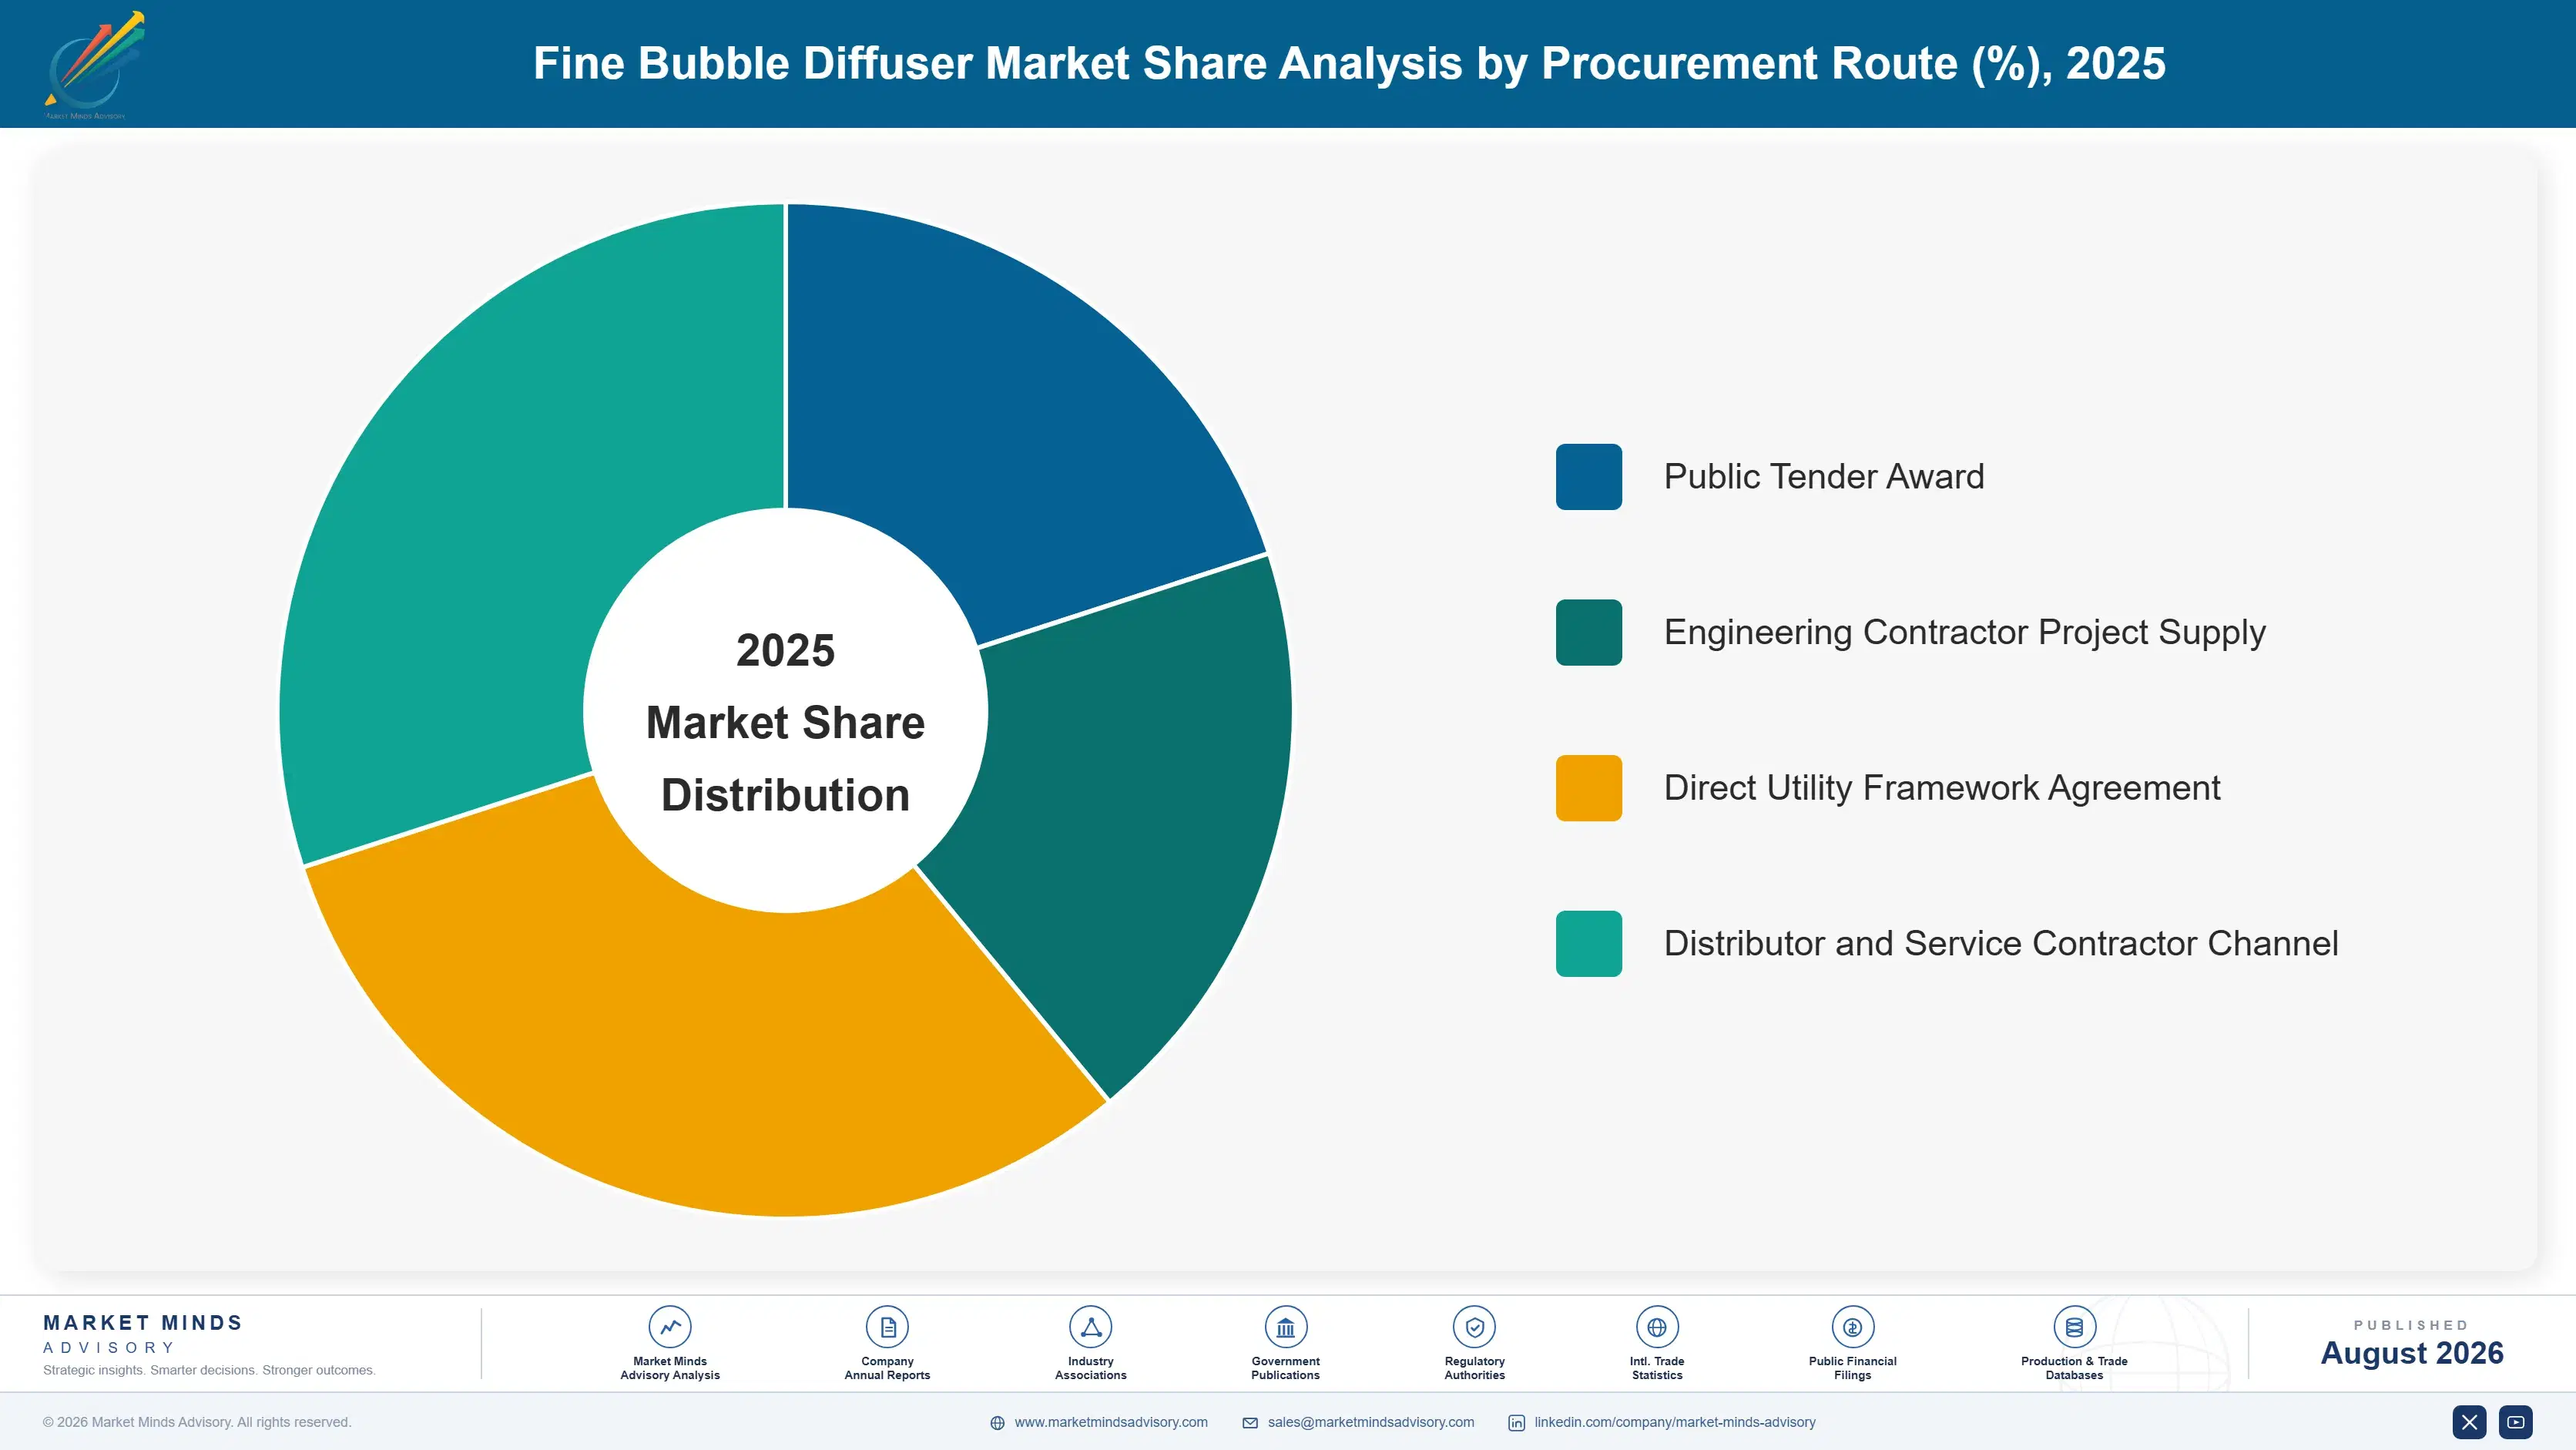
By Procurement Route

  • Public Tender Award
  • Engineering Contractor Project Supply
  • Direct Utility Framework Agreement
  • Distributor and Service Contractor Channel

By Region

  • North America
  • East Asia
  • Western Europe
  • South Asia and Pacific
  • Latin America
  • Middle East and Africa
  • Eastern Europe

Scope, Methodology, and Coverage

Every figure in this report is reproducible from documented input assumptions. The scope below maps the historical period, the forecast horizon, the segmentation dimensions, and the countries covered, alongside the underlying primary and qualitative methodology.
Historical Period
2020 to 2025
Forecast Period
2026 to 2036
Base Year
2025 (USD billions; MMA Primary Research Dataset, August 2026)
Market Definition
The fine bubble diffuser market comprises the manufacture and sale of aeration diffuser elements producing bubbles below approximately three millimetres in diameter for biological wastewater treatment, valued at manufacturer selling prices to utilities, engineering contractors, equipment integrators, and service contractors. It spans membrane disc, tube, panel, and strip diffusers in EPDM, polyurethane, and silicone compounds, alongside ceramic dome and porous plate elements, together with the retaining rings, drop pipes, air laterals, retrievable assemblies, support grids, and mounting hardware supplied as part of a diffuser system. Blowers, turbo compressors, and air piping upstream of the drop pipe, coarse bubble diffusers producing bubbles above that threshold, mechanical surface aerators, jet and venturi aeration systems, membrane bioreactor filtration modules, dissolved oxygen sensors and aeration control systems, and complete treatment plant engineering are excluded. Off-gas testing and plant operating services sold independently sit outside scope.
Quantitative Units
USD billions (current prices); volume in millions of diffuser elements shipped
Segmentation Dimensions
By Diffuser Geometry; By End-Use Industry; By Procurement Route; By Region
Regions Covered
North America, East Asia, Western Europe, South Asia and Pacific, Latin America, Middle East and Africa, Eastern Europe
Countries Covered
USA, Canada, Mexico, Germany, Netherlands, Denmark, Sweden, Switzerland, Austria, France, Italy, Spain, UK, Ireland, China, Japan, South Korea, Taiwan, India, Australia, Singapore, Thailand, Vietnam, Indonesia, Philippines, Brazil, Chile, Colombia, Peru, Argentina, Saudi Arabia, United Arab Emirates, Egypt, Morocco, South Africa, Poland, Czechia, Romania, Bulgaria, Hungary, and additional markets relevant to this sector
Key Companies Profiled
Xylem, Veolia Water Technologies, Environmental Dynamics International, SSI Aeration, Aquaconsult Anlagenbau, Ovivo, WesTech Engineering, Parkson, Sulzer, Invent Umwelt, Jäger Umwelttechnik, Nopon Oy, Aquarius Technologies, Nijhuis Saur Industries, Diffused Gas Technologies, Aquatec-Maxcon, Kusters Water, Ecologix Environmental Systems, Tsurumi Manufacturing, Huber SE
Quantitative Methodology
Primary survey, n=3,800 respondents, Q4 2025, six countries; demand-side model with trade association cross-validation
Qualitative Methodology
47 expert interviews, Q4 2025; applied to validate demand model assumptions, identify emerging dynamics, and assess competitive positioning
Report Format
PDF and XLSX data workbook (Word format preview document)
Publisher
Market Minds Advisory
Report Code
MMA-2026-CON-491
Published
August 2026
Contact
sales@marketmindsadvisory.com | www.marketmindsadvisory.com

Purchase the full Fine Bubble Diffuser Market Report (2026 to 2036).

The full MMA Fine Bubble Diffuser report sizes the market across five diffuser geometries, five end-use industries, four procurement routes, and seven regions through 2036. It profiles 20 participants on a consistent basis of diffuser element and grid hardware revenue, scoring each on verified efficiency data, specification stage access, membrane material capability, and installed reference base. Scenario models quantify how electricity pricing, nutrient consent tightening, and municipal capital availability move both volume and achievable margin. The report also includes oxygen transfer efficiency benchmarking by geometry and material, membrane degradation curves by compound, off-gas testing practice by region, and specification influence mapping across major consulting engineers.
Five-geometry and four-route market sizing to 2036
Twenty-participant benchmark on diffuser and grid revenue
Oxygen transfer efficiency benchmarking by geometry and material
Membrane degradation curves by compound and service year
Off-gas testing practice benchmarking by region and utility
Specification influence mapping across major consulting engineers

Built For The People Who Decide

From boardroom strategy to bench-side execution, this report is read cover-to-cover by leaders shaping the next decade of their industry, turning demand scenarios, market dynamics and valuation benchmarks into decisions.
CXOs/ Presidents/ VPs/ Managers
M&A and Corporate Development
Strategy Teams and R&D Heads
Procurement and Product Directors
Regulatory and Compliance Leaders
Investor Relations and Equity Analysts