Market Minds Advisory
Fin Field Effect Transistor (FinFET) Market

Fin Field Effect Transistor (FinFET) Market: FinFET Market: Node Migration, Mask Set Economics and Why The Trailing Nodes Keep Earning 2026 to 2036

Everybody watches the leading node while the money keeps arriving from the ones behind it. A mask set that cost a fortune to produce earns steadily for a decade afterwards.

Lead Analyst

Published

September 2026

Make Smarter Decisions with Customized Research Insights

Request a free sample report and evaluate market opportunities, growth trends, and competitive dynamics relevant to your business needs.

2025 MARKET VALUE$68.4BMarket Size 2025
2036 FORECAST VALUE$167.8BBase Case , 2026 to 2036
CAGR 2026 TO 20368.5 %Bull 9.8% / Bear 7.3%
INCREMENTAL OPPORTUNITY$93.6BNet 10- year value creation
EXPANSION MULTIPLE2.26x2036 value over 2026 base
Strategic Levers
M&A Pipeline
Regional Outlook
Country Rankings
Competitive Intelligence
Segmental Deep-dive
Call-Us : 91 93563 13602

Executive Snapshot and Market Trajectory.

Everybody watches the leading node and most of the money keeps arriving from the ones behind it. A mask set that cost a fortune to produce earns for the better part of a decade, which is what FinFET economics genuinely reward. Mature node utilisation sits near 84% today.
The market reaches USD 74.2 billion in 2026 and USD 167.8 billion by 2036, a 2.26 times expansion at 8.5% annually. Automotive and industrial qualified FinFET devices grow at 12.8%, half again the market rate of 8.5%, because vehicle electronics need long supply commitments that consumer parts never required. East Asia holds 46% of output value, far above the usual band, on foundry concentration.
Five participants hold 78% of FinFET output value, which is very high and reflects capital intensity rather than any design advantage. TSMC, Samsung Electronics, Intel, GlobalFoundries and UMC lead. Mask set amortisation across design volume decides most competitive outcomes in this business. Mature node utilisation runs near 84% on depreciated equipment, which is exactly when a process starts contributing properly. A design ships for roughly nine years afterwards to justify that mask cost fully.
Market Definition
This report covers fin field effect transistor devices and the manufacturing services producing them: FinFET logic devices at 16 nanometre through 5 nanometre nodes, automotive and industrial qualified FinFET devices, foundry manufacturing services for FinFET designs, FinFET-based memory controllers and interface devices, radio frequency FinFET devices, and design enablement libraries sold with process access. It excludes gate-all-around and nanosheet transistor devices, planar transistor devices, memory arrays, packaging and assembly services, and semiconductor manufacturing equipment.
Base Year Value
$68.4B in 2025 (MMA Primary Research Dataset, September 2026)
Forecast Period
2026 to 2036, eleven discrete annual values
CAGR
8.5% base case. Bull 9.8%. Bear 7.3%.
Fastest Growth Segment
Automotive And Industrial Qualified FinFET Devices: 12.8% CAGR
Fastest Growth Country
India: 14.2% CAGR
Fastest Growth Region
South Asia and Pacific: 10.6% CAGR
Largest Region
East Asia: 46% of 2025 global value
Market Leaders
TSMC, Samsung Electronics, Intel, GlobalFoundries and UMC lead on FinFET device and foundry service output value. Source: MMA Analysis.
Primary Survey
n=3,800 procurement and R&D decision-makers, Q4 2025, six countries
Methodology
Demand-side build-up, cross-validated against public data, 47 expert interviews

Fin Field Effect Transistor (FinFET) Market Forecast Scenarios

fin-field-effect-transistor-finfet-market-size-forecast-scenario-1789998998524
Between 2020 and 2025 the category compounded at 7.4%, and the interesting movement was backwards rather than forwards. Leading edge production migrated to gate-all-around structures, which left FinFET as the established rather than advanced technology. That is precisely when a node becomes profitable: equipment is depreciated, yields are mature, and the designs running on it were paid for years earlier and keep shipping without further investment.
The base case holds 8.5% on three mechanisms. Automotive and industrial demand keeps growing on nodes that must be supported for a decade or more, which suits mature FinFET rather than anything newer. Design starts keep concentrating on nodes where mask sets cost less than leading edge alternatives. And regional capacity programmes keep funding FinFET fabs rather than leading edge ones, because the technology is available to license and the demand is proven.
The bull case at 9.8% assumes automotive electronic content per vehicle rises faster than expected, since those parts demand long supply commitments that consumer devices never did. The bear case at 7.3% is capacity overbuild, where subsidised regional fabs add FinFET output faster than demand absorbs it and pricing falls across the mature nodes that currently carry the profitability.

The Trailing Node Earns Most

A node becomes profitable at exactly the moment the industry stops finding it interesting. Leading edge production has migrated to gate-all-around structures, leaving FinFET as established technology with depreciated equipment, mature yields and designs that were paid for years ago. Mature node utilisation runs near 84%. The capital was spent, the learning curve is behind, and every wafer contributes accordingly.
TOP FIVE CONCENTRATION78%Very high, reflecting capital intensity rather than any design advantage
LEADING MASK COSTUSD 28 millionPer design at the most advanced structure node
DESIGN PRODUCTION LIFESPAN9 yearsTypical shipping life of a design once mask sets exist
AUTOMOTIVE QUALIFIED SHARE18%Output requiring automotive qualification and long supply commitments
MATURE NODE UTILISATION84%Capacity running on depreciated equipment at established process nodes
FOUNDRY SERVICE SHARE71%Output produced for external customers rather than internal device businesses
Mask sets are what actually govern behaviour here. A design at the most advanced FinFET node carries around USD 28 million in mask costs, and once that is spent the design ships for around nine years to justify it. That amortisation is why customers stay on a node long after newer ones exist, and why foundries earn steadily from processes that stopped being newsworthy some time ago.
Automotive is changing the demand profile more than any technical development. Around 18% of output now requires automotive qualification and the long supply commitments that go with it, which consumer parts never demanded. Automotive and industrial qualified FinFET devices grow at 12.8% against 8.5% for the market. A foundry committing to a decade of supply is making a different promise than one selling consumer volume.
"The industry talks about nodes like they expire. They do not. A FinFET design taped out in 2019 is still shipping, still profitable, and the mask set was paid off years ago. That is where the money in this business actually sits and almost nobody writes about it."
Director, Semiconductor Process and Foundry Practice · MMA Technology Practice · September 2026

Market Trends

Maturity Rather Than Advancement Drives Profitability

Leading edge production migrated to gate-all-around structures, which left FinFET as established technology running on depreciated equipment at mature yields. Mature node utilisation sits near 84%, and every wafer now contributes at rates the newest node will not reach for several years. The industry treats a node as obsolete when it stops being advanced, while the economics say the opposite: capital spent, learning curve completed, designs already paid for and still shipping in volume. Operators redirecting capital toward leading edge while under-running established capacity are funding uncertain future margin at the direct expense of the certain present kind.
Market Impact: Mask sets cost USD 28 million
Automotive Qualification Reshapes Foundry Supply Commitments

Around 18% of FinFET output now requires automotive qualification and the decade-long supply commitments that come with it, which consumer parts never demanded from any foundry. Automotive and industrial qualified devices grow at 12.8% against 8.5% for the market. A foundry promising ten years of supply is making a fundamentally different commitment than one selling consumer volume, and it constrains how quickly capacity can be repurposed toward whatever comes next. That commitment also protects incumbents against subsidised new capacity, since qualification takes years to obtain and cannot be accelerated with capital alone however much of it stands behind the fab.
Market Impact: India compounds at 14.2% yearly

Market Opportunities and Growth Drivers

Mask Set Economics Keep Designs On Established Nodes

A design at the most advanced FinFET node carries around USD 28 million in mask costs, and once spent that design ships for roughly nine years to justify the outlay. Customers therefore stay on a node long after newer options exist, because migrating means paying the mask cost again for benefits that rarely justify it. Foundries earn steadily from processes that stopped attracting attention, and that revenue requires no further capital at all. Foundries defending established nodes are defending revenue that arrives without further capital spending of any kind. Migration rarely justifies itself.
Market Impact: Mature nodes run at 84%

Regional Capacity Programmes Fund Established Process Nodes

Government semiconductor programmes across India, Japan and Europe fund FinFET capacity rather than leading edge, because the technology can be licensed and the demand is already proven rather than speculative. India compounds at 14.2%, ahead of every other market, largely on that basis. Those programmes add supply on nodes that currently carry the industry's profitability, which is welcome for buyers and considerably less so for incumbent operators. Licensed technology and proven demand make these nodes considerably easier for a government to fund than speculative leading edge investment that nobody can reliably assess in advance.
Market Impact: Commitments run around 9 years

Market Restraints and Challenges

Subsidised Capacity Threatens Mature Node Pricing

Government-funded FinFET capacity is being added across several regions on nodes that already carry the industry's profitability, which risks supply outrunning demand. The root cause is that industrial policy targets proven technology rather than speculative leading edge investment. Commercially this compresses pricing precisely where margins are best. Mitigation runs through automotive qualification that new entrants cannot quickly obtain, through long-term supply agreements, and through design enablement that raises switching cost for existing customers. Qualification depth is the defence that money cannot quickly buy, and it is where incumbents should be spending.
Market Impact: Mature utilisation runs near 84%

Automotive Commitments Constrain Any Capacity Repurposing

A foundry committing to a decade of automotive supply cannot repurpose that capacity toward newer processes when demand shifts. The root cause is that vehicle programmes qualify a specific part on a specific process and requalification is expensive and slow for the customer. Commercially this locks capacity into fixed use. Mitigation runs through pricing that reflects the commitment, through capacity ring-fencing agreements, and through qualification support that makes eventual migration cheaper for both parties. Pricing the commitment explicitly converts the constraint into revenue rather than absorbing it silently, which most operators still fail to do.
Market Impact: Automotive takes 18% of output
3 additional market trends, 4 additional growth drivers, and 2 additional restraints and challenges are covered in the full report. Contact sales@marketmindsadvisory.com to access the complete intelligence.

Segment CAGR and Growth Architecture

Segmentation follows device and service class, since each carries quite different qualification burden, mask cost exposure and node migration behaviour. Six classes cover the market: automotive and industrial qualified devices, foundry manufacturing services, radio frequency devices, logic devices at established nodes, memory controller and interface devices, and design enablement libraries. Node and customer type are separate dimensions handled elsewhere.
fin-field-effect-transistor-finfet-market-market-share-analysis-1789998999146

Automotive And Industrial Qualified FinFET Devices

Automotive and industrial qualified FinFET devices grow at 12.8%, half again the market rate of 8.5%, because vehicle electronic content keeps rising and those parts demand decade-long supply commitments that consumer devices never required from any foundry. Around 18% of output now carries that qualification. The commitment cuts both ways commercially: it protects incumbent positions against subsidised new capacity that cannot obtain qualification quickly, and it locks capacity into fixed use that cannot be repurposed toward newer processes when demand eventually shifts elsewhere. Vehicle programmes qualify a specific part on a specific process, and requalification is expensive and slow enough that customers rarely attempt it. Incumbents hold that ground for years.
CAGR 12.8%

Design Enablement Libraries And Process Access

Design enablement libraries and process access compound at 10.4% because a customer who designs against one foundry's libraries carries genuine switching cost, and mask sets at around USD 28 million per design at the most advanced node make that cost concrete rather than theoretical. This is where foundries defend against subsidised capacity offering similar process capability at lower prices. New entrants can build the fab considerably faster than they can build the library set and the customer designs that depend on it. Enablement investment retains more customers per dollar spent than process advancement does, which is not where most capital in this business currently goes. Building a fab is the fast part.
CAGR 10.4%
Full segment breakdown across 6 segments available in the complete report.

Regional Architecture and Country Demand Map

East Asia holds 46% of FinFET output value, far above the usual band, because foundry capacity at these nodes is concentrated there to a degree no other technology market matches. North America follows at 23% on device design and Intel manufacturing. India compounds fastest at 14.2% on funded capacity programmes.

East Asia

East Asia takes 46% of FinFET output value, far above the 30% band ceiling, because foundry capacity at these nodes concentrates here to a degree that has no equivalent in any other technology market. TSMC and Samsung Electronics between them operate the majority of qualified FinFET capacity worldwide, and UMC adds established node volume. Automotive qualification depth here exceeds every other region considerably. Growth at 9.4% runs above the global rate on automotive demand rather than any capacity expansion, which is proceeding elsewhere. Design enablement depth built across process generations here is what holds customers rather than any single process advantage, and new regional capacity elsewhere cannot replicate it quickly.
Share: 46% | CAGR: 9.4% (2026 to 2036)

North America

North America accounts for 23% of output value, where Intel manufactures and where a very large share of the fabless design that consumes FinFET capacity originates. Design starts here drive foundry demand that is manufactured elsewhere, which means output value understates commercial influence considerably. GlobalFoundries operates established node capacity serving automotive and industrial customers. Growth at 8.9% sits above the global rate on automotive design content and on domestic capacity programmes now funding established process nodes. Automotive and industrial customers here increasingly require the decade-long supply commitments that constrain how capacity can later be repurposed, and domestic operators are pricing that constraint more explicitly than they once did. Depreciation position decides margin.
Share: 23% | CAGR: 8.9% (2026 to 2036)
Regional intelligence for 5 additional markets available in the complete report: Western Europe, South Asia and Pacific, Latin America, Middle East and Africa, Eastern Europe. Contact sales@marketmindsadvisory.com.
fin-field-effect-transistor-finfet-market-country-cagr-analysis-1789998999676

Where FinFET Margin Is Made

The mature node earns rather than the leading one, mask set amortisation keeps customers where they are, and automotive qualification is the barrier subsidised capacity cannot cross quickly. The four levers below follow those conditions rather than any argument about process performance. Each addresses a commercial condition rather than a technical one, which is where most operator attention currently goes.

Run Depreciated Capacity Rather Than Chasing Nodes

Mature node utilisation sits near 84% on equipment that is already depreciated and yields that are already mature, which is when a process finally contributes properly. Every wafer produced there earns at rates the newest node will not reach for several years. Operators redirecting capital toward leading edge while under-running established capacity are funding future margin at the expense of present margin, and the present margin is the certain one. The present margin is the certain one. Under-running depreciated lines to fund a newer node is the most expensive decision available in this business.
Market Impact: Mature nodes now run near 84% utilisation today

Build Qualification Barriers Subsidised Entrants Cannot Cross

Around 18% of output requires automotive qualification, which takes years to obtain and cannot be accelerated with capital alone. Government-funded capacity being added across several regions can match process capability far more easily than it can match qualification depth. Foundries deepening automotive and industrial qualification defend the pricing that new capacity would otherwise compress, and they do it on ground where money by itself buys very little advantage. Process capability can be licensed; qualification history cannot. Capital buys a fab quickly and buys qualification not at all. That asymmetry favours incumbents.
Market Impact: Automotive now takes a full 18% of output

Raise Switching Cost Through Design Enablement Depth

Mask sets at around USD 28 million per design at the most advanced node make switching cost concrete rather than theoretical, and a customer designed against one foundry's libraries carries that cost twice over. Foundries investing in enablement depth hold customers that process comparison alone would not retain. New entrants build the fab considerably faster than they build the library and the installed base of designs that depend on it. Enablement retains more customers per dollar than advancement. Process comparison alone retains almost nobody at these nodes. The library set takes years.
Market Impact: Mask sets now cost USD 28 million each

Price The Decade Commitment Rather Than The Wafer

A foundry promising around 9 years of automotive supply cannot repurpose that capacity when demand shifts, which is a real cost that wafer pricing rarely reflects. Pricing the commitment explicitly rather than absorbing it converts a constraint into revenue. Customers requiring supply security will pay for it, and foundries treating long commitments as ordinary volume are giving away optionality that is genuinely valuable to the other side. Around 18% of output already carries those commitments, and the share is rising as vehicle electronic content grows. Supply security is worth paying for.
Market Impact: Commitments now run around 9 full years each

Who Controls the Margin Pool

Five participants hold 78% of FinFET output value, which is very high even for semiconductors and reflects capital intensity rather than any design or process advantage. TSMC, Samsung Electronics, Intel, GlobalFoundries and UMC lead. All participants are assessed on FinFET device and foundry service output value rather than on total semiconductor revenue across all process technologies they operate. Concentration has held for years and shows no sign of loosening, since building qualified capacity takes capital and time in roughly equal measure.
Competition runs on qualified capacity availability and design enablement depth far more than on process specification, which converges across serious operators at these established nodes. The second dimension is automotive qualification, because around 18% of output requires it and new capacity cannot obtain it quickly regardless of how much capital stands behind the fab.

Pressure is emerging from government-funded capacity being added on exactly the nodes carrying current profitability. Rankings shift where automotive qualification depth exists and where regional programmes reach production, particularly across India, Japan and Europe over the second half of this decade. Incumbents with qualification depth are considerably better protected than those competing on general logic capacity alone.
fin-field-effect-transistor-finfet-market-company-positioning-matrix-1789999000203

Competitive Moat and Risk Dimensions

TSMC

Moat: Qualified Capacity Scale

TSMC operates qualified FinFET capacity at a scale no competitor approaches, which matters because customers holding mask sets worth around USD 28 million per design need supply certainty across roughly nine years of production. Scale also supports design enablement depth that smaller operators cannot fund. Competitors matching process capability still cannot match the assurance that volume and qualification breadth provide.
TSMC

Risk: Subsidised Capacity Addition

Government programmes across India, Japan and Europe are funding capacity on precisely the established nodes that currently carry industry profitability, which compresses pricing where margins are best. Scale advantage assumes demand grows into supply. Where subsidised output arrives faster than automotive and industrial demand absorbs it, mature node pricing falls for everybody including the largest operator.
GLOBALFOUNDRIES

Moat: Automotive Qualification Depth

GlobalFoundries holds automotive and industrial qualification depth across established nodes, which takes years to obtain and cannot be accelerated with capital. Around 18% of FinFET output requires that qualification and the decade-long supply commitments attached to it. Subsidised entrants can match process capability considerably more easily than they can match qualification, which is where the pricing defence actually sits.
GLOBALFOUNDRIES

Risk: Node Portfolio Narrowness

Qualification depth sits on a narrower node range than the largest operators hold, which limits where existing customers can migrate when their designs eventually need more performance. Automotive customers value continuity across generations rather than at a single node. A qualification advantage on one process is worth less when the customer's roadmap runs past it.

Players Tracked

Prominent Players

TSMC
Samsung Electronics
Intel
GlobalFoundries
UMC

Other Key Players

SMIC
Tower Semiconductor
Rapidus
Texas Instruments
STMicroelectronics
Infineon Technologies
NXP Semiconductors
Renesas Electronics
Qualcomm
MediaTek
Broadcom
Marvell Technology
Nvidia
Advanced Micro Devices
Socionext

Recent Developments

MARCH 2025

Regional Programmes Fund Established Node FinFET Capacity

Government semiconductor programmes across India, Japan and Europe committed funding to FinFET capacity at established nodes rather than to leading edge manufacturing, a policy development rather than any corporate transaction. Licensed technology and proven demand make those nodes easier to fund than speculative leading edge investment.
Signal: Subsidised capacity now lands on exactly the nodes that currently carry the whole industry's profitability today.
SEPTEMBER 2024

Automotive Customers Extend Supply Commitment Requirements

Automotive customers extended required supply commitment periods on qualified FinFET parts, a procurement development rather than any acquisition or merger. Around 18% of output now carries automotive qualification, and vehicle programmes qualify specific parts on specific processes where requalification is expensive and slow for the customer to complete.
Signal: Long supply commitments protect incumbents while locking that same capacity out of any future repurposing entirely.
JULY 2025

Leading Edge Migration Leaves FinFET As Established Technology

Leading edge logic production continued migrating to gate-all-around structures, leaving FinFET as established rather than advanced technology, a technology transition rather than any corporate event. Mature node utilisation sits near 84% on depreciated equipment, which is precisely when a process node starts contributing properly to operator margin.
Signal: A node becomes genuinely profitable at the moment the industry stops describing it as advanced technology.

What A FinFET Wafer Costs

Depreciation and facility cost absorb roughly 34% of wafer cost at established FinFET nodes, and that share falls sharply once equipment reaches the end of its depreciation schedule. Materials including photoresists, gases and target materials take around 24%. Energy and facility utilities absorb about 17%, which is high and rising, with labour and yield loss taking the remaining balance.
Energy costs rose sharply across European and Asian manufacturing regions through 2022 and 2023, and semiconductor fabrication is among the most energy-intensive manufacturing there is. TSMC Annual Report 2024 and GlobalFoundries Annual Report 2024 both record energy and materials cost among principal operating variables. Operators with long-term power agreements or on-site generation absorbed considerably less of that increase than those buying at market rates. Fabrication energy intensity makes that difference material.

The competitive disadvantage mechanism is depreciation position rather than input price. An operator running fully depreciated equipment carries a cost structure that a newly built fab cannot approach for years regardless of process capability. Exposure concentrates among subsidised new entrants, since capital subsidy reduces the build cost without changing the depreciation schedule that follows it across the fab's early operating life.
fin-field-effect-transistor-finfet-market-cost-volatility-analysis-1789999000401

Extend Equipment Life Beyond Depreciation Schedules

Depreciation and facility cost absorb roughly 34% of wafer cost, and that share falls sharply once equipment passes its depreciation schedule while still producing at mature yields. Extending productive life converts a written-off asset into the lowest cost capacity available. The constraint is maintenance discipline and spare parts availability, both planned years ahead. Both need planning early.

Contract Power Supply Across Multiple Years

Energy and facility utilities absorb about 17% of wafer cost and have risen sharply across European and Asian manufacturing regions. Long-term power agreements or on-site generation insulate margin from market volatility that no operator controls. The commitment looks expensive during stable periods, which is exactly when it can be secured on terms nobody will offer once prices have already moved.

Qualify Alternative Materials Suppliers Before Disruption

Materials including photoresists, gases and target materials absorb around 24% of wafer cost, and several categories come from very few qualified suppliers. Qualifying alternatives ahead of any disruption preserves output when a single source fails. Qualification takes months and cannot be compressed, which means the work has no value unless it was completed well before it was needed.

Portfolio Architecture for Margin Defence

Margin architecture separates on qualification and depreciation rather than on process node. General logic devices at established nodes earn least, since capacity is broadly available and pricing competes directly. Memory controller and radio frequency devices sit above on design specificity. Automotive qualified devices, foundry services on depreciated capacity and design enablement earn most, because each combines barriers with cost positions competitors cannot quickly replicate.
The volume versus premium tension runs between general foundry capacity and qualified committed supply, which reward opposite operating behaviour entirely. Volume requires capacity flexibility and rapid repurposing as demand shifts across customers. Premium requires decade-long commitments that remove exactly that flexibility. Operators taking automotive commitments at general foundry pricing have accepted the constraint without collecting anything for it. Very few price it explicitly.

High-value pools concentrate in automotive qualified devices and in design enablement, and neither is reached through capital investment alone. Automotive qualification takes years and cannot be purchased. Design enablement requires libraries, tooling and an installed base of customer designs accumulated over process generations. Both explain why five participants hold 78% while subsidised capacity is being added on the same nodes beneath them.

Volume / Commodity-Adjacent

General logic devices at established FinFET nodes, where capacity is broadly available and pricing competes directly between operators with similar process capability. The twelve point spread separates operators running fully depreciated equipment from those still carrying capital cost against every wafer produced.
Gross Margin: 26% to 38%

Premium / Certified

Memory controller and interface devices and radio frequency FinFET devices, where design specificity and performance requirements narrow the qualified supplier set considerably. The twelve point spread tracks how much of each operator's volume in these categories runs on depreciated rather than recently installed capacity.
Gross Margin: 43% to 55%

Sustainability / Regulatory / Next-Generation

Automotive and industrial qualified devices, foundry services on depreciated capacity and design enablement libraries, each combining barriers with cost positions competitors cannot replicate quickly. The fourteen point spread reflects qualification depth and depreciation position taken together.
Gross Margin: 58% to 72%
fin-field-effect-transistor-finfet-market-portfolio-architecture-1789999000907

High-value Sub-segments and Strategic Watch-out

Automotive And Industrial Qualified FinFET Devices

Grows at 12.8% because vehicle electronic content keeps rising and those parts require decade-long supply commitments. The fourteen point spread reflects qualification depth. Subsidised entrants can match process capability far more easily than they can match qualification. Qualification takes years to obtain. Capital cannot accelerate it.
Gross Margin: 58% to 72%

Design Enablement Libraries And Process Access

Grows at 10.4% because designing against one foundry's libraries carries switching cost that mask sets make concrete. The fourteen point spread reflects installed design base. Entrants build the fab considerably faster than they build the library. Designs accumulate over generations. Libraries take longer to build.
Gross Margin: 58% to 72%

Radio Frequency FinFET Devices

Grows at 9.2% on wireless infrastructure and device demand where performance requirements narrow the qualified supplier set. The twelve point spread reflects depreciation position. Design specificity keeps pricing competition milder than general logic capacity faces. Qualified suppliers remain few here. Performance requirements narrow entry. Depreciation still decides.
Gross Margin: 43% to 55%

General Logic Devices At Established Nodes

Grows at 6.1%, slowest of the six classes, as subsidised capacity arrives on exactly these nodes and compresses pricing. The twelve point spread reflects depreciation. Process capability converges, so cost position is what separates operators here. Pricing pressure is sharpest here. Cost position separates operators.
Gross Margin: 26% to 38%

Why Designs Stay Put

The annuity here is the mask set rather than any supply contract. A design carrying around USD 28 million in mask costs at the most advanced FinFET node ships for roughly nine years to justify that outlay, and every one of those years runs on the foundry where the design was taped out. Migration means paying the mask cost again for benefits that rarely justify it.
Depth varies by how much enablement the customer designed against. A customer using one foundry's libraries, tooling and process design kits carries switching cost well beyond the masks themselves, because the design work would need redoing rather than merely re-manufacturing. A customer designing to portable standards moves more easily. Foundries that invested in enablement depth hold customers that process comparison alone would never have retained for this long.

The buyer has changed more than the process has. A consumer device designer evaluated performance per watt against a product cycle measured in eighteen months. An automotive customer evaluates supply commitment across a decade and requalification cost if that commitment fails. An industrial customer evaluates availability over even longer horizons. Operators organised around the first buyer serve the least committed segment.
fin-field-effect-transistor-finfet-market-end-use-penetration-index-1789999001400

What Wins FinFET Business

These are among the four positions where our research anticipates prominent divergence between winners and laggards over the coming forecast period. Each is grounded in the demand model, the regulatory perimeter, and the announced capacity pipeline.
01 / DEPRECIATED CAPACITY DISCIPLINE

Run The Old Fab, Not The Narrative

Mature node utilisation sits near 84% on equipment already depreciated and yields already mature, which is precisely when a process finally contributes properly to operator margin. Every wafer produced there earns at rates the newest node will not reach for several years yet. Operators redirecting capital toward leading edge while under-running established capacity are funding uncertain future margin at the direct expense of certain present margin, and the present margin is the only certain one available anywhere in this business.
02 / QUALIFICATION BARRIER DEPTH

Build What Capital Alone Cannot Buy

Around 18% of FinFET output requires automotive qualification, which takes years to obtain and cannot be accelerated by spending more money on the fab itself. Government-funded capacity arriving across several regions matches process capability considerably more easily than it matches qualification depth. Foundries deepening automotive and industrial qualification defend pricing on ground where subsidy buys very little advantage at all, which is why incumbents should be spending there rather than on process advancement nobody has asked them for in the first place.
03 / ENABLEMENT INVESTMENT PRIORITY

Own The Libraries, Hold The Designs

Mask sets at around USD 28 million per design at the most advanced node make switching cost concrete, and a customer designed against one foundry's libraries carries that cost twice over on any migration. Foundries investing in enablement depth retain customers that process comparison alone would not hold. New entrants build the fab considerably faster than they build the library and the installed design base behind it, which takes process generations to accumulate properly and cannot be bought outright at any price.
04 / COMMITMENT PRICING PRACTICE

Charge For The Decade You Promise

A foundry committing to around nine years of automotive supply cannot repurpose that capacity when demand shifts, which is a genuine cost that ordinary wafer pricing almost never reflects properly. Pricing the commitment explicitly converts a constraint into revenue rather than absorbing it silently. Customers needing supply security will pay for it, and operators treating long commitments as ordinary volume give away real optionality that the other side values considerably, and give away optionality worth collecting for to their own customers.

Engagement Snapshot From the Field

A live engagement with an industry participant carrying material or product regulatory and market exposure ahead of a defining policy shift, showing how our research translates into a defensible multi-year portfolio strategy.
MARKET MINDS ADVISORY · CLIENT ENGAGEMENT SUMMARY
Fin Field Effect Transistor (FinFET) Producer Strategic Portfolio Review and Transition Roadmap 2026·Investment Scenario on Fin Field Effect Transistor (FinFET) Exposure Evaluation 2025-26
CLIENT PROFILE
A foundry operator planning to convert established FinFET capacity toward a newer process while its automotive and industrial customers were requesting extended supply commitments on the existing nodes. Management treated the conversion as necessary modernisation, without modelling what the depreciated capacity would earn if left in place across the same period. Nobody had run that comparison at all.
STRATEGIC CHALLENGE
Engineering wanted conversion to keep the process roadmap current against competitors. Sales wanted to accept extended automotive commitments that conversion would make impossible to honour. Nobody had modelled either path financially, and two automotive customers were requesting decade-long commitments within the following quarter that would settle the question by default.
MMA APPROACH
MMA modelled earnings from the existing depreciated capacity against the conversion case across a ten year horizon, including the qualification cost and requalification risk that conversion would impose on automotive customers. We assessed what subsidised regional capacity would do to pricing on both paths. Work drew on 47 expert interviews conducted in Q4 2025 with foundries, fabless designers and automotive buyers.
KEY FINDINGS
  1. Depreciated capacity earned more across the 10 year horizon than the conversion case, because the conversion restarted a depreciation schedule the existing lines had completed.
  2. Automotive customers would have requalified elsewhere rather than absorb any conversion risk, taking roughly 18% of the operator's total output with them permanently.
  3. Subsidised regional capacity compressed pricing on general logic but not on automotive qualified output, where entrants could not qualify (client-reported, unverified by MMA).
  4. Design enablement investment retained materially more customers per dollar spent than process advancement did, across every single customer segment the analysis examined.
CLIENT PROFILE
A foundry operator planning to convert established FinFET capacity toward a newer process while its automotive and industrial customers were requesting extended supply commitments on the existing nodes. Management treated the conversion as necessary modernisation, without modelling what the depreciated capacity would earn if left in place across the same period. Nobody had run that comparison at all.
STRATEGIC CHALLENGE
Engineering wanted conversion to keep the process roadmap current against competitors. Sales wanted to accept extended automotive commitments that conversion would make impossible to honour. Nobody had modelled either path financially, and two automotive customers were requesting decade-long commitments within the following quarter that would settle the question by default.
MMA APPROACH
MMA modelled earnings from the existing depreciated capacity against the conversion case across a ten year horizon, including the qualification cost and requalification risk that conversion would impose on automotive customers. We assessed what subsidised regional capacity would do to pricing on both paths. Work drew on 47 expert interviews conducted in Q4 2025 with foundries, fabless designers and automotive buyers.
KEY FINDINGS
  1. Depreciated capacity earned more across the 10 year horizon than the conversion case, because the conversion restarted a depreciation schedule the existing lines had completed.
  2. Automotive customers would have requalified elsewhere rather than absorb any conversion risk, taking roughly 18% of the operator's total output with them permanently.
  3. Subsidised regional capacity compressed pricing on general logic but not on automotive qualified output, where entrants could not qualify (client-reported, unverified by MMA).
  4. Design enablement investment retained materially more customers per dollar spent than process advancement did, across every single customer segment the analysis examined.
RECOMMENDED STRATEGY
Phase 1: Phase one: keep the depreciated capacity in production, since it earns more across the horizon than conversion does and carries no restart risk. Phase 2: Phase two: accept the extended automotive commitments and price them explicitly rather than at general wafer rates, since the constraint is real. Phase 3: Phase three: redirect the whole conversion budget toward design enablement, which retained more customers per dollar spent than process advancement achieved.
OUTCOME
The operator kept its depreciated capacity in production and accepted the automotive commitments at commitment-specific pricing (client-reported, unverified by MMA). Margin held through the period when subsidised capacity compressed general logic pricing, and enablement investment retained designs that would otherwise have moved. Depreciation position is now modelled before any conversion decision.

Frequently Asked Questions

Foundational context covering the market sizes, CAGR, scope, country, region and competition that inform every finding below. This section is provided to cover basics and most often pre-purchase conversations, answered from the MMA Primary Research Dataset.

What is the current size of the Fin Field Effect Transistor (FinFET) Market?

Global value reaches USD 74.2 billion in 2026, measured as FinFET device and foundry service output value. The 2025 base was USD 68.4 billion on the same basis.

How large will the Fin Field Effect Transistor (FinFET) Market be by 2036?

The market reaches USD 167.8 billion by 2036, an increase of USD 93.6 billion across the forecast period. That represents 2.26 times expansion from the 2026 base.

What is the CAGR for the Fin Field Effect Transistor (FinFET) Market 2026 to 2036?

The base case runs at 8.5% annually, with a bull case at 9.8% if automotive electronic content rises faster than expected and a bear case at 7.3% if subsidised capacity overbuilds.

Which segment is growing fastest?

Automotive and industrial qualified FinFET devices grow at 12.8%, half again the market rate of 8.5%. Vehicle electronics require decade-long supply commitments consumer parts never did.

Who are the major companies in the Fin Field Effect Transistor (FinFET) Market?

TSMC, Samsung Electronics, Intel, GlobalFoundries and UMC lead on device and foundry service output value, holding 78% between them. SMIC and Tower Semiconductor hold smaller positions.

Which country is growing fastest?

India leads at 14.2%, as government programmes fund FinFET capacity on licensed technology where demand is proven rather than speculative. Japan and Germany follow behind it.

Report Segmentation Architecture

The full report scope spans multiple orthogonal segmentation dimensions, with cross-tabulated demand data provided for each dimension pair. Coverage extends further to regional breakdowns, trend trajectories, and the competitive detail needed to support segment-level decision-making.

By Device And Service Class

  • Automotive And Industrial Qualified FinFET Devices
  • Design Enablement Libraries And Process Access
  • Radio Frequency FinFET Devices
  • Foundry Manufacturing Services
  • Memory Controller And Interface Devices
  • General Logic Devices At Established Nodes

By End-Use Industry

  • Automotive Electronics And Control
  • Mobile And Consumer Devices
  • Data Centre And Networking Infrastructure
  • Industrial Automation And Control
  • Wireless And Telecommunications Infrastructure
  • Aerospace And Defence Electronics

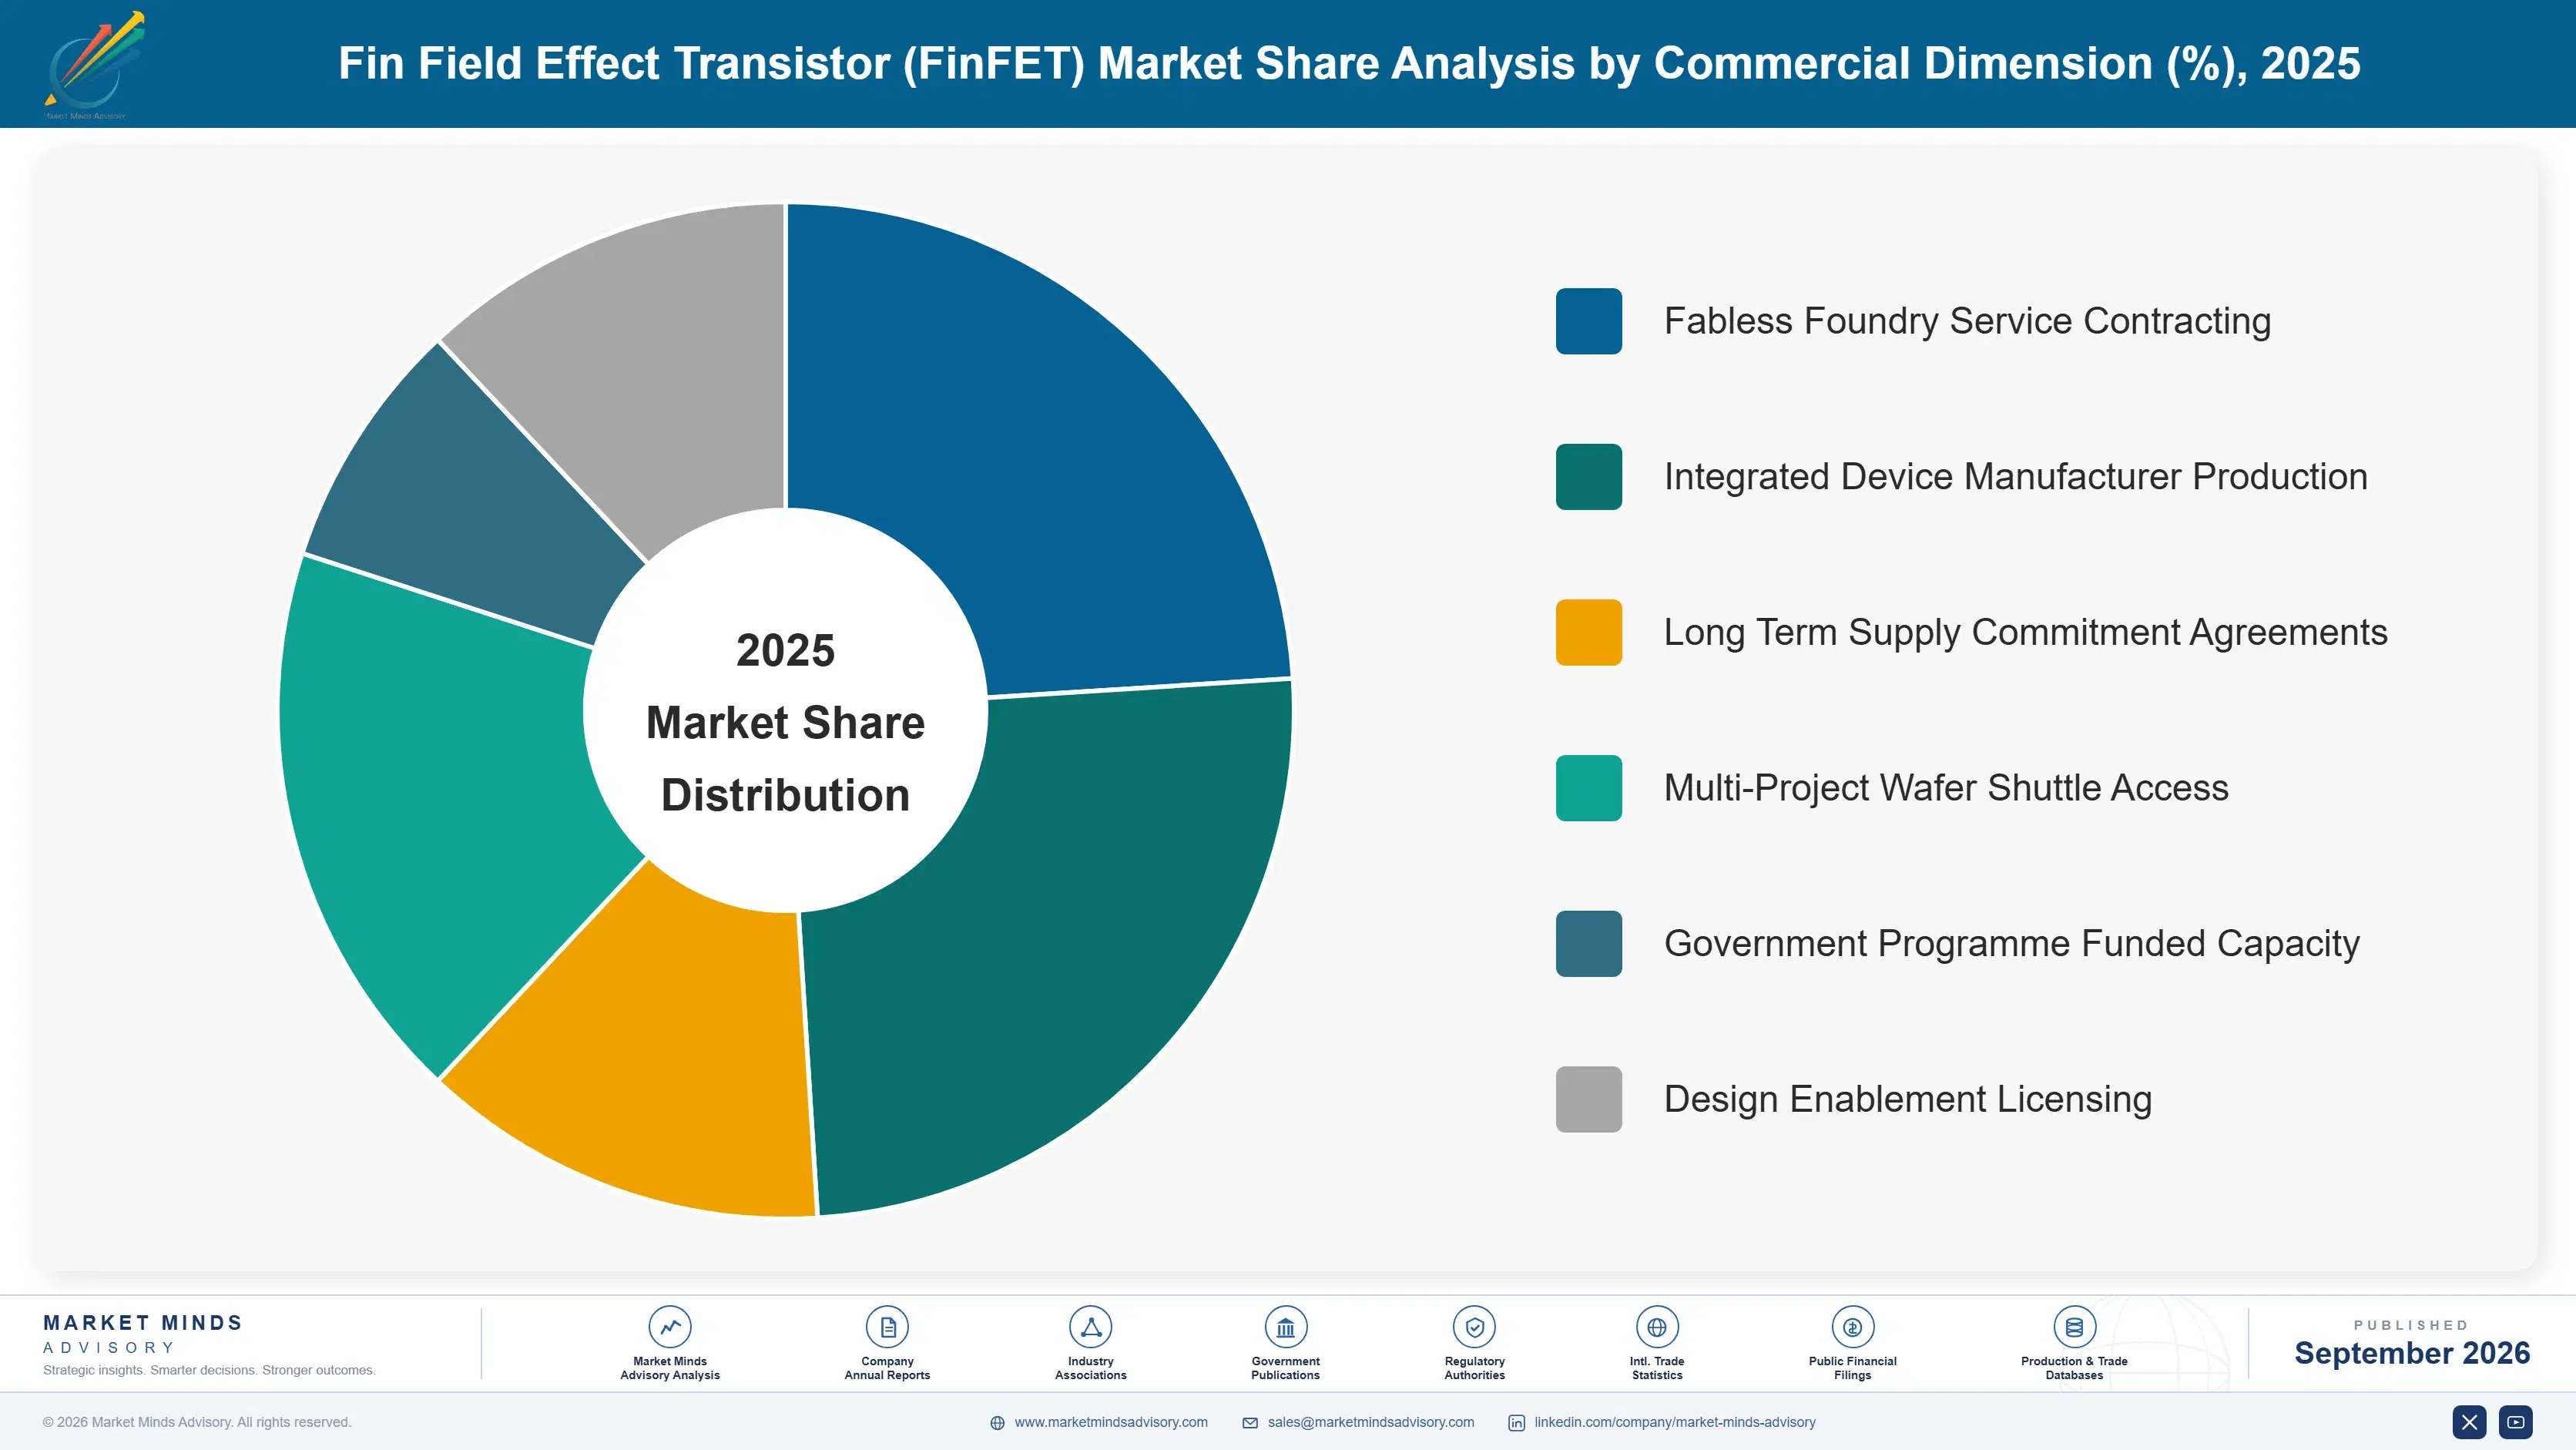
By Commercial Dimension

  • Fabless Foundry Service Contracting
  • Integrated Device Manufacturer Production
  • Long Term Supply Commitment Agreements
  • Multi-Project Wafer Shuttle Access
  • Government Programme Funded Capacity
  • Design Enablement Licensing

By Region

  • North America
  • Western Europe
  • East Asia
  • South Asia and Pacific
  • Latin America
  • Middle East and Africa
  • Eastern Europe

Scope, Methodology, and Coverage

Every figure in this report is reproducible from documented input assumptions. The scope below maps the historical period, the forecast horizon, the segmentation dimensions, and the countries covered, alongside the underlying primary and qualitative methodology.
Historical Period
2020 to 2025
Forecast Period
2026 to 2036
Base Year
2025 (USD billions; MMA Primary Research Dataset, September 2026)
Market Definition
This report covers fin field effect transistor devices and the manufacturing services producing them: FinFET logic devices at 16 nanometre through 5 nanometre nodes, automotive and industrial qualified devices, foundry manufacturing services, memory controller and interface devices, radio frequency FinFET devices, and design enablement libraries sold with process access. It excludes gate-all-around and nanosheet devices, planar transistor devices, memory arrays, packaging and assembly services, and manufacturing equipment.
Quantitative Units
USD millions, FinFET device and foundry service output value basis; wafer starts at FinFET nodes; mask set cost per design in USD; design production lifespans in years; mature node utilisation rates; automotive qualified share of output.
Segmentation Dimensions
Device and service class; end-use industry; commercial contracting route; geography across seven regions.
Regions Covered
North America, Western Europe, East Asia, South Asia and Pacific, Latin America, Middle East and Africa, Eastern Europe
Countries Covered
Taiwan, South Korea, China, Japan, Singapore, Malaysia, United States, Canada, Germany, France, Ireland, Netherlands, Italy, Poland, Czechia, India, Israel, Brazil, Mexico, United Arab Emirates.
Key Companies Profiled
TSMC, Samsung Electronics, Intel, GlobalFoundries, UMC, SMIC, Tower Semiconductor, Rapidus, STMicroelectronics, Infineon Technologies, NXP Semiconductors, Renesas Electronics, Qualcomm, MediaTek, Socionext.
Quantitative Methodology
Primary survey, n=3,800 respondents, Q4 2025, six countries; demand-side model with trade association cross-validation
Qualitative Methodology
47 expert interviews, Q4 2025; applied to validate demand model assumptions, identify emerging dynamics, and assess competitive positioning
Report Format
PDF and XLSX data workbook (Word format preview document)
Publisher
Market Minds Advisory
Report Code
MMA-2026-TEC-991
Published
September 2026
Contact
sales@marketmindsadvisory.com | www.marketmindsadvisory.com

Purchase the full Fin Field Effect Transistor (FinFET) Market Report (2026 to 2036).

This report sizes the global FinFET market from 2026 to 2036 across six device and service classes, six industries and seven regions. It explains why a node becomes profitable at the moment the industry stops calling it advanced, with mature node utilisation near 84% on depreciated equipment. Mask sets at around USD 28 million per design are analysed as the reason customers stay on established nodes for roughly nine years. Automotive qualification covering around 18% of output is examined as the barrier subsidised capacity cannot cross quickly. Regional analysis explains why East Asia holds 46% of output value.
Six device and service classes sized to 2036
Mask set economics quantified against design production lifespans
Automotive qualification analysed as a competitive barrier
Twenty named participants assessed on output value
Four revenue levers with quantified commercial impact
Anonymised foundry capacity allocation engagement documented in full

Built For The People Who Decide

From boardroom strategy to bench-side execution, this report is read cover-to-cover by leaders shaping the next decade of their industry, turning demand scenarios, market dynamics and valuation benchmarks into decisions.
CXOs/ Presidents/ VPs/ Managers
M&A and Corporate Development
Strategy Teams and R&D Heads
Procurement and Product Directors
Regulatory and Compliance Leaders
Investor Relations and Equity Analysts