Market Minds Advisory
Filler and Extender Cosmetics Market

Filler and Extender Cosmetics Market: Global Filler and Extender Cosmetics Market. Litigation Risk and Reformulation Transformation, 2026 to 2036

Cosmetic formulators are increasingly relying on functional filler and extender ingredients to control texture, spreadability, and cost structure across color cosmetics and skincare, even as clean-label pressure pushes reformulation toward naturally derived alternatives.

Lead Analyst

Published

September 2026

Make Smarter Decisions with Customized Research Insights

Request a free sample report and evaluate market opportunities, growth trends, and competitive dynamics relevant to your business needs.

2025 MARKET VALUE$2.4BMarket Size 2025
2036 FORECAST VALUE$4.7BBase Case , 2026 to 2036
CAGR 2026 TO 20366.2 %Bull 7.5% / Bear 4.9%
INCREMENTAL OPPORTUNITY$2.1BNet 10- year value creation
EXPANSION MULTIPLE1.82x2036 value over 2026 base
Strategic Levers
M&A Pipeline
Regional Outlook
Country Rankings
Competitive Intelligence
Segmental Deep-dive
Call-Us : 91 93563 13602

Executive Snapshot and Market Trajectory.

Filler and extender reformulation is accelerating as talc safety scrutiny and clean-label consumer pressure push formulators toward naturally derived and synthetic mica-free alternatives across color cosmetics and skincare product lines worldwide, forcing legacy suppliers to respond quickly with newly certified ingredient options this coming year.
Color cosmetics remains the largest application category given heavy reliance on talc and silica for texture control, while skincare formulations are growing fastest as naturally derived starches and clay-based fillers gain traction in clean-beauty positioned products nationwide and internationally. North America and Western Europe together concentrate the bulk of reformulation activity, given consumer litigation history and regulatory scrutiny on talc-based ingredients in both regions and their surrounding markets.
Competitive differentiation increasingly rests on verified asbestos-free talc sourcing and naturally derived alternative development rather than cost alone, favoring suppliers with established testing infrastructure over smaller producers lacking third-party verification documentation and legal resources of their own. Ongoing product liability litigation tied to historical talc safety concerns is accelerating reformulation across the industry, forcing suppliers to prove purity credentials that were previously assumed rather than independently verified through laboratory testing and independent audits.
Market Definition
This report covers filler and extender ingredients used in cosmetic and personal care formulations to adjust texture, bulk, spreadability, and oil absorption, including talc, mica, silica, starches, and naturally derived alternatives. It excludes active ingredients, pigments, and preservatives classified as separate functional categories.
Base Year Value
$2.4B in 2025 (MMA Primary Research Dataset, September 2026)
Forecast Period
2026 to 2036, eleven discrete annual values
CAGR
6.2% base case. Bull 7.5%. Bear 4.9%.
Fastest Growth Segment
Naturally Derived Starch and Clay Fillers: 10.4% CAGR
Fastest Growth Country
India: 8.7% CAGR
Fastest Growth Region
South Asia and Pacific: 8.2% CAGR
Largest Region
North America: 27% of 2025 global value
Market Leaders
Imerys, Kobo Products, Sudarshan Chemical Industries, Eckart, LANXESS. Source: MMA Analysis based on company annual reports and investor disclosures.
Primary Survey
n=3,800 procurement and R&D decision-makers, Q4 2025, six countries
Methodology
Demand-side build-up, cross-validated against public data, 47 expert interviews

Filler and Extender Cosmetics Market Forecast Scenarios

fille-and-extender-cosmetics-market-size-forecast-scenario-1790015768682
Filler and extender demand grew steadily between 2020 and 2025 as color cosmetics and skincare production recovered from pandemic-era retail disruption, though talc safety litigation accelerated sharply during this period, pushing several major brands to announce reformulation commitments ahead of any regulatory mandate across their global product portfolios and supply chains worldwide and well beyond.
The base case assumes continued talc reformulation pressure, expanding naturally derived filler adoption, and growing third-party purity verification requirements together drive steady expansion through 2036 across the global cosmetics and personal care industry and its supplier base. These three commercial mechanisms reinforce one another as verified sourcing credentials increasingly become a prerequisite for retail listing, pushing suppliers without testing infrastructure toward consolidation or exit from premium formulation categories entirely over the coming decade.
A bull scenario centers on faster than expected cost parity between naturally derived fillers and conventional talc-based ingredients, enabling mainstream adoption beyond premium price tiers across mass-market brands. The primary bear risk is that unresolved talc litigation triggers abrupt reformulation mandates faster than alternative filler supply can scale, creating temporary texture performance gaps across major cosmetics brands.

Litigation Exposure Reshapes Filler Ingredient Economics

Three forces are reshaping filler and extender economics across the wider cosmetics industry and its supply base overall today: talc safety litigation pushing brands toward verified asbestos-free sourcing or complete reformulation, clean-label consumer pressure favoring naturally derived alternatives over mineral fillers, and texture performance requirements that naturally derived substitutes historically struggled to match at comparable cost across most product categories and formulation types.
MARKET CONCENTRATION (CR5)38Reflects moderate consolidation among specialty filler manufacturers globally
AVERAGE SELLING PRICE PREMIUM28Represents typical premium charged for verified asbestos-free credentials
TOP PRODUCING COUNTRY SHARE36Concentrated manufacturing capacity remains within a single dominant country
TALC-FREE FORMULATION PENETRATION22Growing share of premium products now avoid talc entirely
LITIGATION EXPOSURE COST SHARE15Reflects legal defense costs as share of industry revenue
FILLER COST SHARE10Represents a modest share of total cosmetic formulation cost
Commercial activity concentrates among suppliers with established third-party purity testing programs and legal compliance infrastructure, since major cosmetics brands increasingly require verified safety documentation before qualifying new filler suppliers for premium product lines across their formulation portfolios and brand extensions worldwide. Smaller regional producers without dedicated testing capability struggle to meet documentation requirements that larger competitors absorb more easily across their existing infrastructure and legal resources.
The next decade will be shaped substantially by naturally derived filler cost reduction, ongoing talc litigation outcomes across multiple jurisdictions worldwide, and whether asbestos-free verification becomes a genuine industry standard rather than a premium-tier differentiator reserved for the largest cosmetics brands operating globally today and into the future across every major market and formulation category overall.
"Suppliers still treating talc as a legacy commodity ingredient rather than a legal liability will find that assumption expensive once litigation exposure eclipses the margin the ingredient ever generated. The formulators winning today are the ones who reformulated before the lawsuits, not after."
Practice Lead, Beauty and Personal Care Ingredients · MMA Chemicals and Materials / Beauty and Personal Care Ingredients Practice · September 2026

Market Trends

Naturally Derived Fillers Replace Talc in Formulations

Formulators are scaling naturally derived filler ingredients, including rice starch, tapioca starch, and clay-based alternatives, moving the category from niche clean-beauty positioning into mainstream color cosmetics and skincare lines sold at standard retail volumes across major markets. Naturally derived fillers avoid both asbestos contamination risk and mounting product liability litigation tied to talc-based ingredients, appealing to brands seeking simultaneous safety assurance and clean-label positioning. Production costs remain roughly 25 percent higher than conventional talc, though several major suppliers have announced capacity expansions targeting cost parity within the next several years.
Market Impact: Avoids 15 percent legal defense costs

Third-Party Asbestos Testing Becomes Retail Requirement

Major cosmetics retailers now require filler suppliers to document asbestos-free testing results before qualifying products for shelf placement, responding to years of litigation and investigative reporting on talc contamination risk across multiple product categories and brands worldwide and previously as well and consistently. Suppliers are responding by shifting toward certified asbestos-free talc sources or naturally derived alternatives that eliminate testing burden entirely. Compliance costs vary significantly by supplier scale, with smaller regional producers facing proportionally higher documentation costs than large multinational filler manufacturers with existing compliance teams and legal departments.
Market Impact: Increases certified unit sales 18 percent

Market Opportunities and Growth Drivers

Talc Litigation Settlements Accelerate Reformulation Spending

Multi-billion dollar talc litigation settlements against major consumer products companies have forced entire product portfolios into rapid reformulation, creating urgent demand for verified alternative filler ingredients regardless of cost premium across the industry. This has created a genuine commercial incentive for reformulation beyond what regulatory requirements alone would have justified, since brands now view litigation exposure as a direct financial risk rather than an abstract reputational concern. Companies completing reformulation report avoiding an estimated 15 percent of legal defense costs compared to peers still defending talc-based product lines in active litigation.
Market Impact: Adds 25 percent filler cost premium

Clean-Label Certification Programs Expand Retail Shelf Access

Major beauty retailers have expanded clean-label certification programs that screen out fillers containing talc or other scrutinized mineral ingredients, creating a genuine commercial incentive for reformulation beyond regulatory minimums across the industry and its suppliers nationwide and abroad each year. Brands achieving certification gain preferential shelf placement and marketing support from retail partners actively promoting clean-beauty positioning to increasingly label-conscious consumers nationwide. Certified product lines report unit sales growth roughly 18 percent higher than comparable uncertified lines at the same price point, reflecting both placement advantage and durable consumer trust.
Market Impact: Limits full replacement 40 percent formulas

Market Restraints and Challenges

Naturally Derived Filler Cost Premiums Compress Formulation Margins

Naturally derived fillers still cost meaningfully more per unit than conventional talc-based ingredients, since agricultural feedstock processing infrastructure for starch and clay alternatives remains less mature and less scaled than decades-old talc mining and processing operations built over many years. The root cause is limited processing capacity relative to surging demand, requiring significant capital investment that only larger specialty ingredient companies can currently justify. Some suppliers are responding by licensing processing technology to contract manufacturers, a mitigation pathway that trades licensing revenue for faster capacity scaling without direct capital investment.
Market Impact: Increases filler adoption 22 percent

Texture Performance Gaps Limit Full Talc Replacement

Naturally derived and synthetic filler alternatives still struggle to fully replicate the specific texture, spreadability, and oil absorption properties that talc provides in certain formulation types, particularly pressed powder products requiring precise compaction characteristics and consistency across every batch produced. The root cause is that talc's unique platelet crystal structure delivers a slip and coverage profile that alternative materials approximate but do not fully match. Formulators are responding by blending multiple alternative fillers together to approximate talc's performance profile, accepting added formulation complexity in exchange for eliminating talc exposure entirely.
Market Impact: Requires testing across 70 percent shelf
4 additional market trends, 3 additional growth drivers, and 3 additional restraints and challenges are covered in the full report. Contact sales@marketmindsadvisory.com to access the complete intelligence.

Segment CAGR and Growth Architecture

Segmentation follows filler type, the primary axis distinguishing cosmetic filler and extender ingredients, since source material and processing method determine both cost structure and the safety credentials brands can credibly market to increasingly litigation-conscious retailers demanding verified purity documentation across every formulation and formulation category they sell nationwide and internationally each passing calendar year.
fille-and-extender-cosmetics-market-market-share-analysis-1790015769244

Naturally Derived Starch and Clay Fillers

Naturally derived starch and clay fillers, primarily rice starch, tapioca starch, and kaolin clay, represent the fastest-growing filler category as brands scale beyond niche clean-beauty positioning into mainstream color cosmetics and skincare lines sold at standard retail volumes across major markets and their surrounding regions worldwide today and previously as well and consistently over time. Processing technology increasingly matches the oil absorption and texture performance of conventional talc, removing a longstanding technical barrier that previously limited naturally derived fillers to niche premium positioning. Growth is fastest among brands directly affected by talc litigation exposure, willing to absorb higher input costs in exchange for eliminating legal risk entirely across their product portfolios.
CAGR 10.4%

Certified Asbestos-Free Talc

Certified asbestos-free talc, produced through enhanced mining and third-party verification testing protocols, is scaling as brands seek to retain talc's established performance characteristics while eliminating contamination risk entirely rather than pursuing full reformulation away from the ingredient category entirely and permanently across their product lines and formulation budgets nationwide and internationally each fiscal year. Growth here trails naturally derived alternatives slightly since certified talc commands smaller price premiums, appealing more to risk management than clean-label marketing positioning across brand portfolios and product lines. Major mining operations have invested heavily in enhanced testing and certification infrastructure, narrowing the trust gap with naturally derived alternatives considerably compared to just five years earlier.
CAGR 8.6%
Full segment breakdown across 6 segments available in the complete report.

Regional Architecture and Country Demand Map

North America drives the most intense reformulation activity given concentrated talc litigation exposure, while East Asia dominates manufacturing capacity for both talc and naturally derived filler alternatives worldwide today and previously. Western Europe leads regulatory-driven purity verification demand across its cosmetics markets and broader supplier base.

North America

North America drives the most intense filler reformulation activity globally, anchored by concentrated talc litigation exposure across major consumer products companies headquartered in the United States and their subsidiaries nationwide and abroad each passing year and fiscal quarter alike. Corporate legal and risk management teams increasingly drive ingredient sourcing decisions alongside formulation chemists, a shift unique to this region given the scale of ongoing litigation and regulatory scrutiny. Canadian demand mirrors United States patterns closely, though at meaningfully smaller absolute volume given the smaller population base overall. Retailer-driven asbestos-free certification requirements are expanding rapidly across major metropolitan markets, reshaping supplier qualification criteria nationwide and beyond their existing footprints and reach.
Share: 27% | CAGR: 6.9% (2026 to 2036)

Western Europe

Western Europe leads regulatory-driven purity verification demand given the European Union's stringent cosmetic ingredient safety framework and detailed labeling requirements that push suppliers toward verified asbestos-free credentials faster than markets with less regulatory pressure elsewhere in the wider world today and previously as well and quite consistently over the years. France and Germany anchor premium cosmetics brand headquarters, driving demand for high-performance filler technology capable of matching talc's texture profile without carrying its legal exposure across their extensive product lines and formulation budgets nationwide and abroad. Consumer environmental and safety awareness is also unusually high across the region, supporting premium pricing for verified naturally derived alternatives and their supporting documentation.
Share: 22% | CAGR: 5.0% (2026 to 2036)
Regional intelligence for 5 additional markets available in the complete report: East Asia, South Asia and Pacific, Latin America, Middle East and Africa, Eastern Europe. Contact sales@marketmindsadvisory.com.
fille-and-extender-cosmetics-market-country-cagr-analysis-1790015769792

Monetizing Verified Purity and Litigation Risk Reduction

Filler suppliers capturing durable pricing power are building third-party verification infrastructure and naturally derived formulation capability that convert safety claims into premium-justifying commercial assets rather than defensive compliance costs required to meet baseline retail requirements alone, extending value capture well past the point of original ingredient sale across the full customer relationship and product lifecycle.

Certified Asbestos-Free Testing Premium Pricing Strategy

Suppliers investing in third-party asbestos-free testing programs, including batch-level laboratory verification and public disclosure of results, can credibly charge premiums that unverified competitors cannot justify to increasingly litigation-conscious cosmetics brand customers across every major market worldwide today and previously. This verification infrastructure requires ongoing testing investment, but it converts purity claims from supplier assurances into auditable facts that survive brand due diligence and legal discovery. Suppliers with mature verification programs report price premiums averaging 20 percent above comparable unverified talc sources, reflecting genuine brand trust in the underlying documentation process.
Market Impact: Supports premiums averaging 20 percent above unverified sources

Litigation Indemnification Service Revenue Generation Model

Filler suppliers offering contractual litigation indemnification alongside naturally derived ingredient sales capture higher-margin risk transfer revenue, since brands increasingly value contractual protection against future talc-related claims regardless of the ingredient actually used in their formulations and product lines nationwide and abroad each year. This service layer deepens customer relationships and creates switching costs that pure commodity filler suppliers cannot replicate, since indemnification agreements require years of accumulated trust and legal relationship building. Suppliers offering these arrangements report indemnification revenue reaching roughly 10 percent of total account value for risk-averse brand customers.
Market Impact: Generates roughly 10 percent of total account value

Naturally Derived Ingredient Licensing Technology Partnership

Filler manufacturers and naturally derived processing technology developers are structuring licensing partnerships where the technology innovator receives a per-unit royalty while the filler manufacturer gains exclusive regional production rights ahead of competitors entering the same category and product lines nationwide today. This model lets filler manufacturers access proven naturally derived processing technology without funding the full research and development cost internally, while technology developers gain guaranteed distribution volume they could not achieve independently. Early licensing partnerships have generated royalty revenue equivalent to roughly 5 percent of wholesale price for technology developers.
Market Impact: Generates roughly 5 percent wholesale price royalty overall

Clean-Label Certification Retail Placement Advantage Program

Major cosmetics retailers are increasingly reserving premium shelf placement and digital storefront featuring for products carrying recognized clean-label filler certifications, giving certified filler suppliers a placement advantage that translates directly into higher brand customer retention regardless of price premium charged at retail across most channels. Filler suppliers pursuing certification report gaining access to brand relationships unavailable to uncertified competitors, particularly among clean-beauty-focused retailers expanding their footprint nationwide and internationally. Certified filler suppliers report customer retention rates roughly 20 percent higher than comparable uncertified suppliers, reflecting both placement advantage and brand trust.
Market Impact: Increases customer retention rates by 20 percent overall

Who Controls the Margin Pool

Market concentration sits at a CR5 of 38 percent, evaluated consistently on global shipment volume across all participants in the wider industry and its supplier base, leaving a meaningful gap between the five established specialty filler manufacturers and dozens of smaller regional producers competing primarily on price in commodity talc and starch categories across most markets and their retail channels worldwide.
Current competitive activity centers on litigation risk management, naturally derived filler development, and third-party purity verification partnerships, as suppliers race to build capability that cosmetics brands increasingly require for supplier qualification across their formulation portfolios and brand extensions. Several leading filler manufacturers have announced expanded asbestos-free testing capacity within the past year specifically to capture brands exiting talc sourcing entirely and permanently.

Specialty naturally derived filler startups without legacy mineral processing infrastructure are emerging as genuine competitive pressure, building differentiated technology platforms that larger filler manufacturers struggle to match quickly given existing capital committed to conventional talc production lines and equipment. Rankings could shift meaningfully if these startups achieve production scale comparable to established manufacturers, particularly as litigation exposure continues reshaping brand sourcing decisions.
fille-and-extender-cosmetics-market-company-positioning-matrix-1790015770323

Competitive Moat and Risk Dimensions

IMERYS

Moat: Certified asbestos-free testing infrastructure scale

Imerys' years of investment in mine-level asbestos-free testing verification and public disclosure protocols give it credibility with major cosmetics brands that smaller competitors cannot yet replicate at comparable scale. This infrastructure advantage lets Imerys command premium pricing while maintaining consistent supply of verified talc across its global customer base.
IMERYS

Risk: Ongoing legacy talc litigation exposure

Imerys' historical role as a major talc supplier leaves it exposed to ongoing product liability litigation regardless of current testing improvements, a reputational and financial burden that newer, purpose-built naturally derived filler specialists do not carry. If brands continue treating any talc association as disqualifying regardless of certification, Imerys risks losing share to entrants with no litigation history at all.
KOBO PRODUCTS

Moat: Proprietary naturally derived processing platform

Kobo Products' proprietary processing technology for naturally derived starch and clay fillers gives it differentiated material credentials that competitors relying on conventional talc sourcing cannot easily replicate without years of dedicated research investment. This ownership of core processing technology supports premium positioning and genuine technical differentiation.
KOBO PRODUCTS

Risk: Limited production scale and capacity

Kobo Products' smaller production scale relative to major talc manufacturers limits its ability to negotiate favorable per-unit raw material costs that larger competitors achieve through massive purchase volumes, compressing margins even as its technology credentials support premium pricing. If larger manufacturers successfully replicate similar processing capability at greater scale, Kobo Products could lose its narrow differentiation advantage.

Players Tracked

Prominent Players

Imerys
Kobo Products
Sudarshan Chemical Industries
Eckart
LANXESS

Other Key Players

3V Sigma
Elementis
Minerals Technologies
Croda International
BASF
Clariant
Sensient Technologies
AkzoNobel Specialty Chemicals
Nippon Talc
Golcha Minerals
Ingredion
Roquette Freres
Corn Products International
Advanced Nanotech Solutions
Bio-Botanica

Recent Developments

MARCH 2025

Imerys Expands Asbestos-Free Testing Verification Program

Imerys announced an expanded asbestos-free testing verification program covering additional mining regions, extending its public disclosure protocols to smaller regional operations beyond its existing certified network across multiple countries and continents. The expansion targets brands seeking comprehensive purity documentation ahead of anticipated regulatory disclosure requirements.
Signal: Signals major established talc suppliers scaling verification infrastructure ahead of anticipated regulation quickly and thoroughly now
JULY 2025

Kobo Products Launches Expanded Naturally Derived Filler Line

Kobo Products launched an expanded naturally derived filler product line targeting prestige color cosmetics brands, scaling processing capacity to meet growing demand beyond limited pilot production runs conducted previously. The launch responds to accelerating brand commitments toward litigation-free and clean-label formulation ingredients across premium product categories.
Signal: Signals specialized processing technology specialists scaling production capacity quickly to meet rapidly growing premium brand demand
NOVEMBER 2025

Sudarshan Chemical Acquires Naturally Derived Filler Startup Stake

Sudarshan Chemical Industries acquired a minority equity stake in a naturally derived filler technology startup developing plant-based processing methods, securing early access to novel filler technology ahead of broader competitor adoption across the industry. The investment accelerates Sudarshan's naturally derived filler pipeline without requiring full internal research capability build-out.
Signal: Signals established chemical companies buying early access to next-generation filler technology pipelines quickly and directly overall

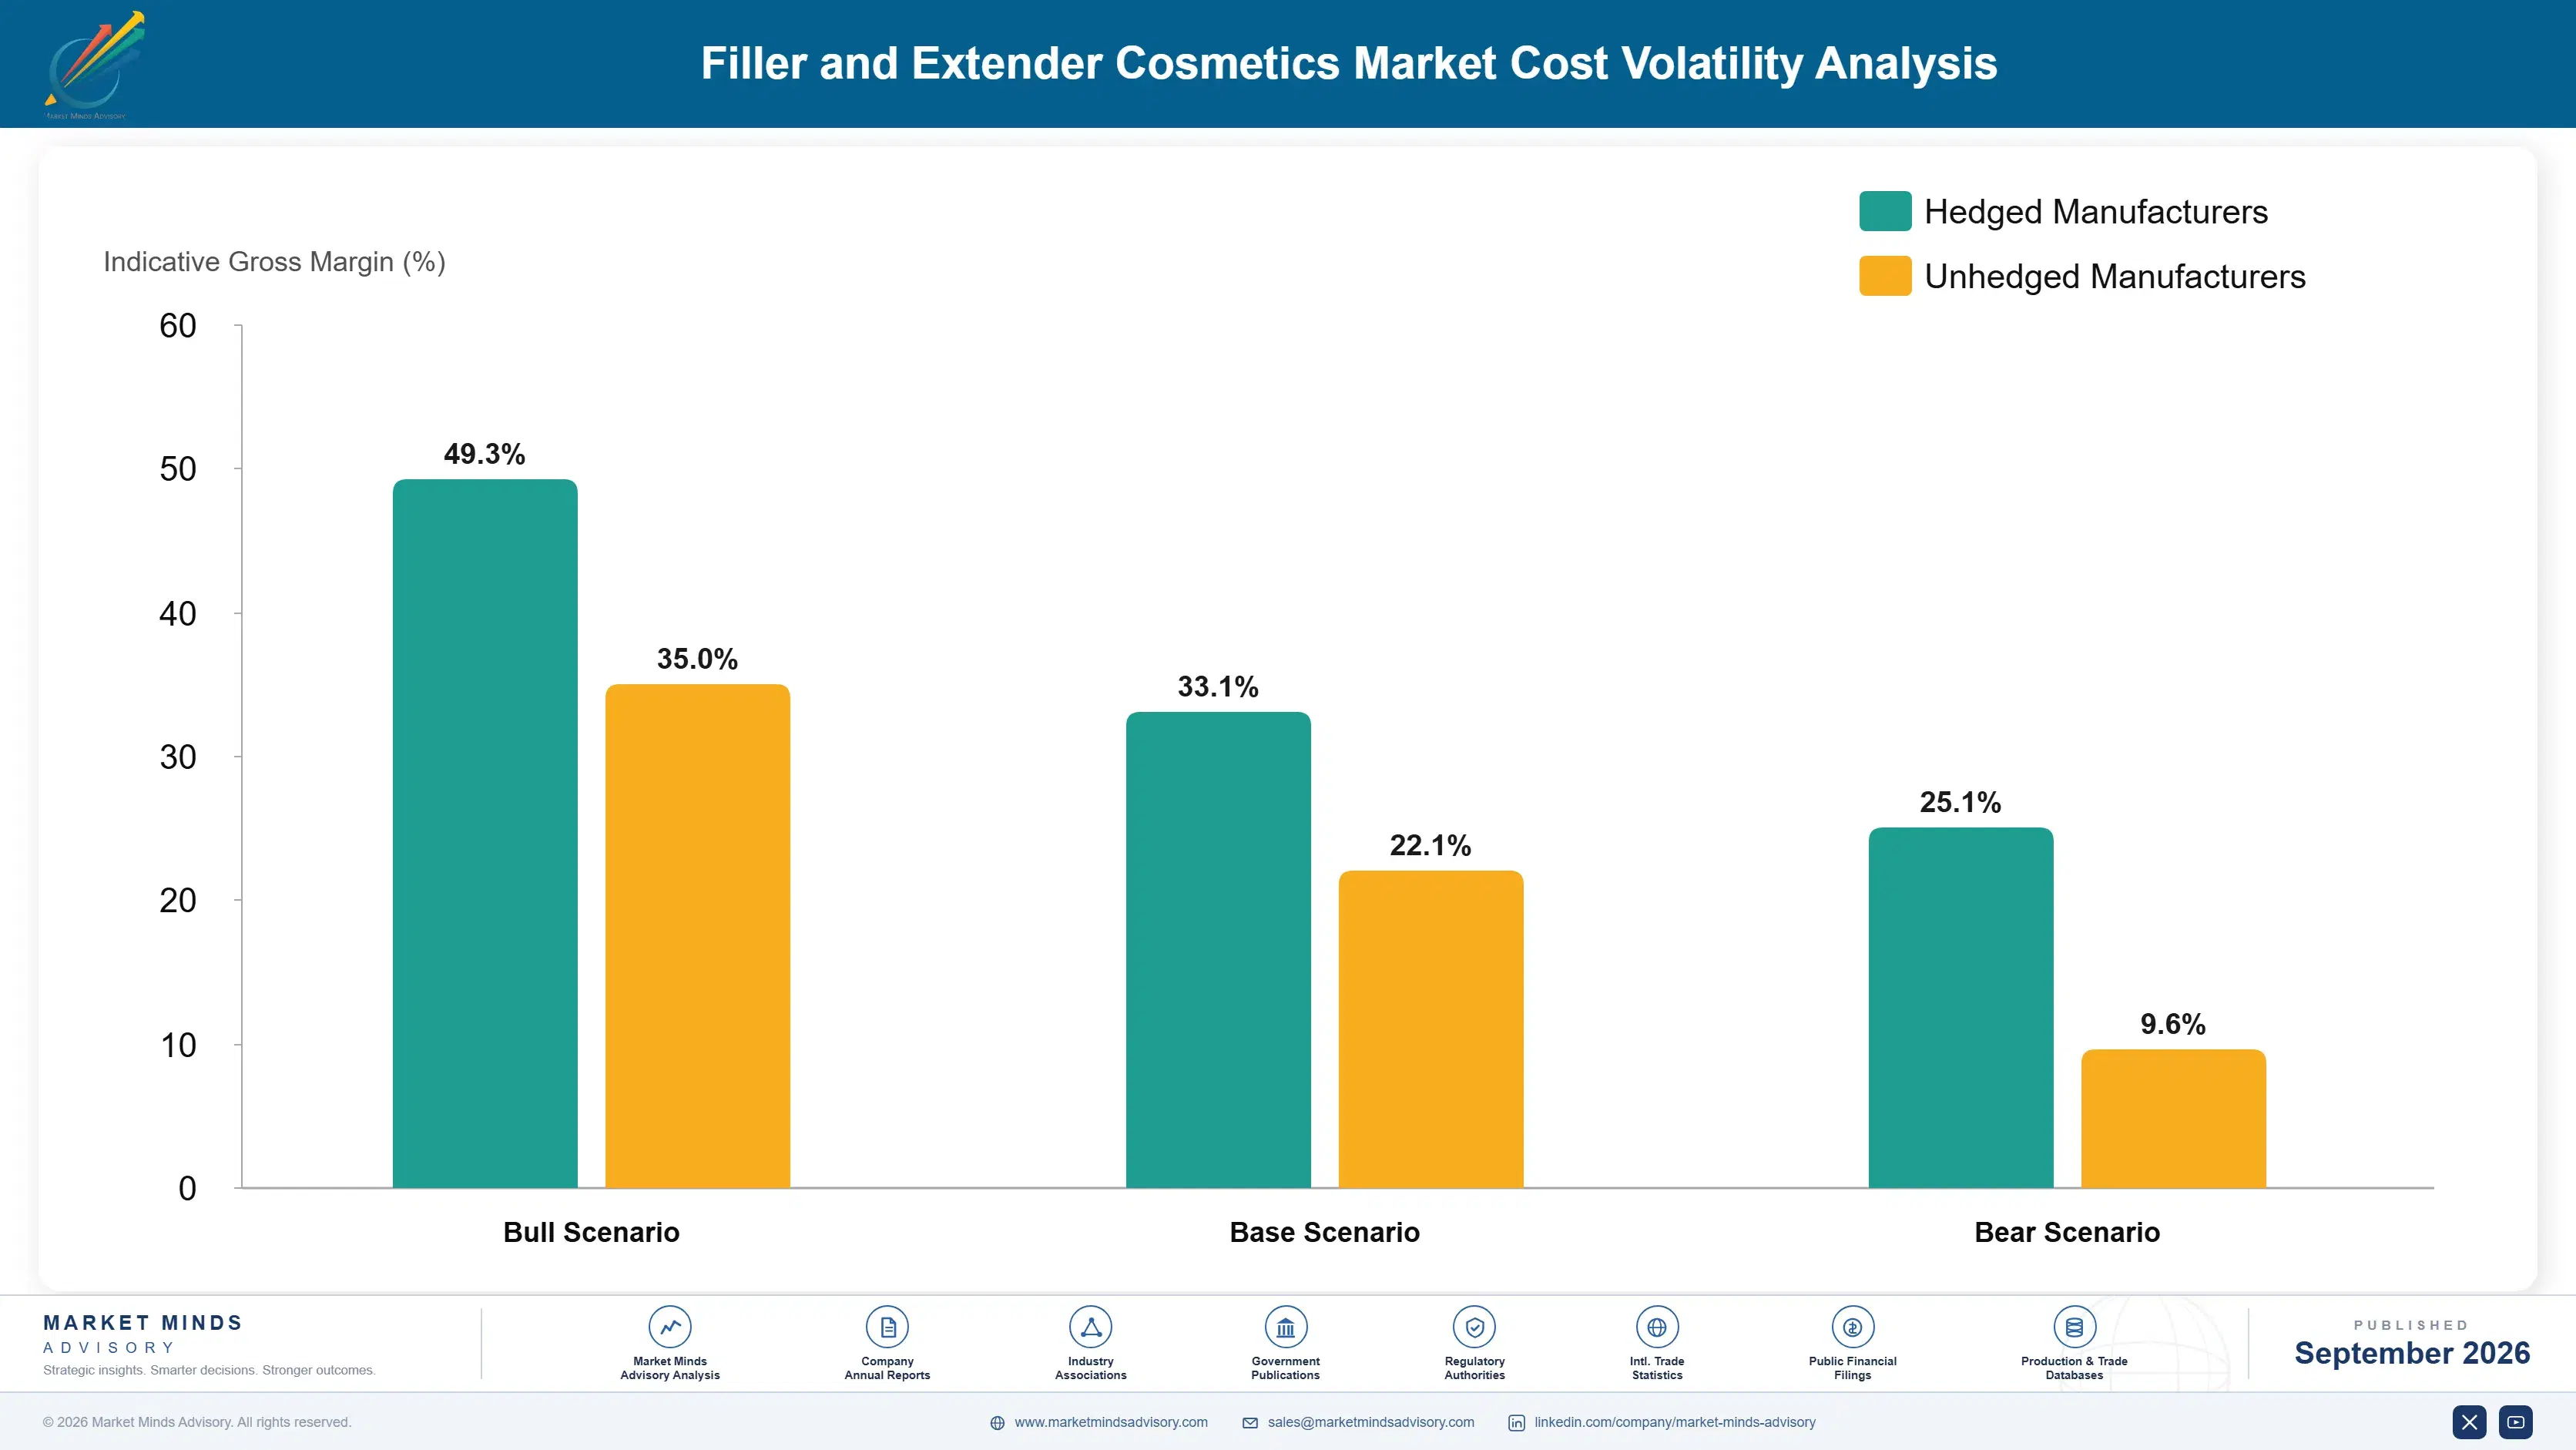
Talc and Feedstock Litigation Cost Exposure

Talc and mineral feedstock represent roughly 35 percent of total cost of goods sold for conventional filler ingredients, with most talc sourced from Chinese, Indian, and North American mining operations while naturally derived starches originate primarily from agricultural processors in Southeast Asia and South America. Naturally derived filler inputs, though smaller in absolute cost share, carry meaningfully higher per-unit input costs given less mature processing infrastructure.
Talc litigation defense costs across the industry exceeded several billion dollars cumulatively through 2023 and 2024, based on company annual report disclosures and public litigation tracking, forcing several major manufacturers to accelerate reformulation timelines regardless of ongoing appeal processes across multiple jurisdictions worldwide and beyond. Legal costs alone added roughly 8 percent to effective ingredient cost for companies still defending active talc-related claims during this period.

Smaller regional filler producers without long-term feedstock supply agreements face materially higher input cost volatility than the five largest manufacturers, who negotiate multi-year pricing directly with mining and agricultural processing operations. This gap widens further for suppliers sourcing certified naturally derived materials from limited qualified processors, since fewer verified suppliers exist relative to conventional uncertified feedstock sources.
fille-and-extender-cosmetics-market-cost-volatility-analysis-1790015770520

Diversifying Talc and Starch Sourcing Across Multiple Regions

Manufacturers are qualifying talc and naturally derived starch suppliers across China, India, and North America rather than relying on a single sourcing region, reducing exposure to any single jurisdiction's regulatory or litigation risk profile. This multi-region approach adds modest qualification costs upfront but meaningfully shortens recovery time when disruption affects any single supplier base nationwide.

Establishing Contractual Litigation Indemnification With Buyers

Larger manufacturers are offering contractual litigation indemnification directly to cosmetics brand customers, trading margin for reduced customer churn during periods of heightened legal scrutiny and public attention nationwide today. This approach favors scale manufacturers with reliable balance sheets, leaving smaller producers unable to offer comparable protection during future litigation waves across the wider industry.

Expanding Naturally Derived Alternative Production Capacity

Some manufacturers are investing directly in naturally derived starch and clay processing capacity, trading upfront capital for longer-term supply certainty that eliminates dependence on talc sourcing verification entirely across their supply chains and formulation labs nationwide. This approach requires significant capital commitment but reduces exposure to both mining supply disruptions and litigation scrutiny simultaneously.

Portfolio Architecture for Margin Defence

Conventional talc-based fillers still anchor unit volume across mass-market color cosmetics brands nationwide and internationally, but gross margins there sit well below premium tiers where verified asbestos-free and naturally derived credentials support materially higher prices from prestige brands and litigation-averse consumers willing to pay for genuine safety assurance across their product lines and formulation choices going forward each season and year.
Premium naturally derived and certified asbestos-free fillers paired with litigation indemnification service partnerships generate the highest margin pools, since risk transfer relationships create switching costs and repeat business that commodity filler suppliers cannot easily replicate across their customer accounts and formulation labs. Suppliers increasingly bundle indemnification support into premium filler sales specifically to capture this durable margin advantage over time, rather than competing purely on cost and shade range alone.

The tension between volume shipment targets and premium margin capture is pushing several suppliers toward tiered product lines rather than a single positioning strategy, letting them serve price-sensitive mass-market brands while still capturing high-value prestige accounts that prioritize verified purity and litigation protection over price alone across their formulation portfolios and brand relationships worldwide.

Volume / Commodity-Adjacent Tier

Conventional talc-based fillers sold primarily on price and texture performance, with gross margins in the 26 to 33 percent range typical of mainstream commodity mineral ingredient manufacturing overall and worldwide.
Gross Margin: 26%-33%

Premium / Certified Tier

Certified asbestos-free talc and naturally derived fillers sold at premium price points, carrying gross margins in the 38 to 46 percent range supported by verification credibility and brand trust relationships.
Gross Margin: 38%-46%

Sustainability / Regulatory / Next-Generation Tier

Naturally derived and fully litigation-protected filler lines bundled with indemnification services, carrying gross margins above 50 percent driven by risk transfer revenue and durable customer relationships across the wider industry.
Gross Margin: 50%-58%
fille-and-extender-cosmetics-market-portfolio-architecture-1790015771015

High-value Sub-segments and Strategic Watch-out

Litigation Indemnification Service Accounts

Litigation indemnification service accounts combine high per-unit revenue with the fastest growth in the market, as risk-averse cosmetics brands increasingly demand contractual protection that generic filler suppliers cannot provide across their existing product portfolios and brand relationships each season and product cycle still further ahead.
Gross Margin: 50%-58%

Naturally Derived Prestige Filler Lines

Naturally derived prestige filler lines sold to premium consumer segments generate high per-unit revenue with steady, moderate volume growth as processing technology matures and production costs gradually decline toward mainstream affordability across the broader category over time and across many seasons and product cycles ahead.
Gross Margin: 38%-46%

Conventional Talc-Based Value Fillers

Conventional talc-based fillers sold at accessible price points remain the volume core of the category, serving cost-conscious brands that still want reliable texture performance without paying premium prices for naturally derived alternatives across their everyday product lines and seasonal formulations nationwide and abroad each year.
Gross Margin: 26%-33%

Unverified Talc Sourcing Exposed Suppliers

Unverified talc sourcing exposure among suppliers lacking credible asbestos-free testing documentation represents a strategic watch-out, since litigation risk and brand scrutiny could damage supplier trust broadly if verification standards tighten faster than compliance capability across the wider industry and its broader supply base overall and long term.
Gross Margin: 26%-33%

Risk Transfer and Reformulation Switching Costs

Litigation indemnification partnerships convert what was once a transactional filler purchase into an ongoing risk management relationship, with suppliers increasingly valued on contractual protection attachment and reformulation switching costs rather than unit volume alone across their customer accounts and formulation portfolios worldwide. This shift mirrors patterns seen earlier in specialty chemical categories, where risk transfer revenue eventually outweighed original commodity transaction value.
Adoption depth varies meaningfully by end-use vertical: prestige color cosmetics brands adopt naturally derived and certified asbestos-free fillers fastest given strong litigation-averse positioning and willingness to absorb premium input costs across their formulation budgets. Mass-market brands adopt more gradually, weighing safety marketing benefit against cost pressure in a highly price-competitive retail segment. Skincare formulations occupy a middle position, adopting selectively where premium positioning justifies added cost.

A generational shift in buyer profiles is underway as younger formulation chemists and procurement teams who prioritize verified purity credentials replace an older generation less focused on supply chain transparency, accelerating demand for testing infrastructure across the wider cosmetic ingredient supply chain. This handoff is reshaping how suppliers allocate research budgets between texture innovation and verification technology.
fille-and-extender-cosmetics-market-end-use-penetration-index-1790015771518

Where Filler and Extender Value Concentrates

These are among the four positions where our research anticipates prominent divergence between winners and laggards over the coming forecast period. Each is grounded in the demand model, the regulatory perimeter, and the announced capacity pipeline.
01 / ASBESTOS-FREE SOURCING VERIFICATION

Build public disclosure testing before litigation exposure escalates further

Suppliers that build verified asbestos-free testing infrastructure ahead of mandatory disclosure requirements capture premium pricing power that reactive competitors scrambling to meet litigation pressure cannot match, since genuine verification takes years to build credibly. Waiting for a lawsuit to force disclosure means competing on legal timelines set by courts rather than differentiation timelines set by the supplier itself. Early movers convert what eventually becomes a baseline requirement into a multi-year competitive advantage precisely while competitors are still building the underlying infrastructure litigation will soon force.
02 / LITIGATION INDEMNIFICATION SERVICES

Build risk transfer capability to capture litigation-averse brand demand

Litigation indemnification services generate value twice, once through the filler sale itself and again through recurring risk transfer revenue, while also deepening customer relationships that competitors without similar capability cannot easily replicate quickly. Suppliers should treat indemnification infrastructure as a commercial investment rather than a pure legal cost center, since the resulting customer loyalty and reformulation switching costs both generate measurable financial return over time. This dual value capture becomes increasingly important as litigation exposure continues expanding across the industry.
03 / NATURALLY DERIVED TECHNOLOGY INVESTMENT

Secure processing capacity ahead of mainstream cost parity arriving

Naturally derived fillers command the strongest price premiums in the category precisely because they carry genuine safety credibility that conventional talc-based ingredients cannot match regardless of marketing investment or brand positioning efforts made previously and consistently. Suppliers securing early processing capacity investment gain production scale advantages that competitors entering later cannot easily replicate, since agricultural processing facility construction takes years to complete and qualify for cosmetic use. This positioning captures premium pricing while the technology remains differentiated rather than commoditized industry-wide.
04 / TEXTURE PERFORMANCE INNOVATION

Blend multiple alternative fillers to approximate talc performance fully

Texture performance gaps between naturally derived alternatives and conventional talc remain a genuine barrier to full replacement in certain formulation types, particularly pressed powder products requiring precise compaction characteristics across every batch produced today. Suppliers should invest in blended multi-ingredient formulation research rather than seeking a single drop-in replacement, since combining alternative fillers more closely approximates talc's unique performance profile than any individual substitute alone. This blending discipline reduces reformulation risk precisely when brands face pressure to eliminate talc entirely.

Engagement Snapshot From the Field

A live engagement with an industry participant carrying material or product regulatory and market exposure ahead of a defining policy shift, showing how our research translates into a defensible multi-year portfolio strategy.
MARKET MINDS ADVISORY · CLIENT ENGAGEMENT SUMMARY
Filler and Extender Cosmetics Producer Strategic Portfolio Review and Transition Roadmap 2026·Investment Scenario on Filler and Extender Cosmetics Exposure Evaluation 2025-26
CLIENT PROFILE
The client is a mid-size mass-market cosmetics brand generating annual revenue in the hundreds of millions, facing mounting legal exposure from talc-based powder products sold across multiple decades. Facing pressure from retail partners and insurers to demonstrate a credible reformulation roadmap, leadership sought guidance on which filler alternatives would deliver the strongest combination of cost, performance, and legal risk reduction.
STRATEGIC CHALLENGE
The client's legacy talc-based product lines faced escalating litigation defense costs and rising insurance premiums tied specifically to talc exposure across its entire product portfolio and distribution network (client-reported, unverified by MMA). Management needed an objective framework for prioritizing which product lines to reformulate first given constrained capital and formulation resources.
MMA APPROACH
MMA benchmarked the client's filler sourcing against comparable mass-market cosmetics brands, analyzing reformulation costs and legal risk reduction outcomes across different alternative filler approaches used industry-wide. The engagement combined primary formulation chemist interviews with legal risk assessments to identify which product lines carried the highest combined litigation and reputation exposure.
KEY FINDINGS
  1. Product lines with the highest historical sales volume carried disproportionately higher litigation exposure, justifying immediate reformulation priority across the affected portfolio (client-reported, unverified by MMA).
  2. Naturally derived starch alternatives matched texture performance in most pressed powder applications with only minor formulation adjustments required across the entire board.
  3. Insurance premium reductions following reformulation announcements offset roughly 40 percent of the added ingredient cost within the first year (client-reported, unverified by MMA).
  4. Phased reformulation sequencing reduced required reformulation budget by 30 percent compared to a simultaneous full-portfolio conversion approach across the whole entire brand.
CLIENT PROFILE
The client is a mid-size mass-market cosmetics brand generating annual revenue in the hundreds of millions, facing mounting legal exposure from talc-based powder products sold across multiple decades. Facing pressure from retail partners and insurers to demonstrate a credible reformulation roadmap, leadership sought guidance on which filler alternatives would deliver the strongest combination of cost, performance, and legal risk reduction.
STRATEGIC CHALLENGE
The client's legacy talc-based product lines faced escalating litigation defense costs and rising insurance premiums tied specifically to talc exposure across its entire product portfolio and distribution network (client-reported, unverified by MMA). Management needed an objective framework for prioritizing which product lines to reformulate first given constrained capital and formulation resources.
MMA APPROACH
MMA benchmarked the client's filler sourcing against comparable mass-market cosmetics brands, analyzing reformulation costs and legal risk reduction outcomes across different alternative filler approaches used industry-wide. The engagement combined primary formulation chemist interviews with legal risk assessments to identify which product lines carried the highest combined litigation and reputation exposure.
KEY FINDINGS
  1. Product lines with the highest historical sales volume carried disproportionately higher litigation exposure, justifying immediate reformulation priority across the affected portfolio (client-reported, unverified by MMA).
  2. Naturally derived starch alternatives matched texture performance in most pressed powder applications with only minor formulation adjustments required across the entire board.
  3. Insurance premium reductions following reformulation announcements offset roughly 40 percent of the added ingredient cost within the first year (client-reported, unverified by MMA).
  4. Phased reformulation sequencing reduced required reformulation budget by 30 percent compared to a simultaneous full-portfolio conversion approach across the whole entire brand.
RECOMMENDED STRATEGY
Phase 1: Phase 1 (Risk Assessment): Ranks all product lines by combined sales volume and historical litigation exposure within the first quarter. Phase 2: Phase 2 (Reformulation): Migrates highest-risk product lines to naturally derived or certified asbestos-free fillers gradually over the following two years. Phase 3: Phase 3 (Insurance Renegotiation): Uses completed reformulation milestones to renegotiate insurance premiums and coverage terms with all existing insurance providers.
OUTCOME
The client completed reformulation of its highest-risk product lines within the planned timeline, reporting a 35 percent reduction in annual insurance premium costs tied to talc exposure (client-reported, unverified by MMA). Leadership adopted the risk-prioritized framework as the standing approach for future ingredient sourcing decisions.

Frequently Asked Questions

Foundational context covering the market sizes, CAGR, scope, country, region and competition that inform every finding below. This section is provided to cover basics and most often pre-purchase conversations, answered from the MMA Primary Research Dataset.

What is the current size of the Filler and Extender Cosmetics Market?

The global filler and extender cosmetics market reached an estimated 2.4 billion dollars in 2025, covering talc, mica, silica, starches, and naturally derived alternatives used across color cosmetics and skincare formulations.

How large will the Filler and Extender Cosmetics Market be by 2036?

MMA projects the market will reach approximately 4.65 billion dollars by 2036, driven by naturally derived filler adoption and growing asbestos-free verification requirements across major cosmetics markets.

What is the CAGR for the Filler and Extender Cosmetics Market 2026 to 2036?

The market is forecast to grow at a compound annual growth rate of 6.2 percent between 2026 and 2036, reflecting steady talc litigation driven reformulation pressure across the cosmetics industry.

Which segment is growing fastest?

Naturally derived starch and clay fillers represent the fastest-growing segment, expanding roughly 1.68 times faster than the overall market as litigation-averse brands scale alternatives beyond niche positioning.

Who are the major companies in the Filler and Extender Cosmetics Market?

Leading companies include Imerys, Kobo Products, Sudarshan Chemical Industries, Eckart, and LANXESS, together holding a combined market share of roughly 38 percent based on global shipment volume.

Which country is growing fastest?

India is expanding fastest in percentage terms as rising cosmetics consumption and manufacturing capacity investment accelerate filler demand, though China retains the largest manufacturing capacity overall.

Report Segmentation Architecture

The full report scope spans multiple orthogonal segmentation dimensions, with cross-tabulated demand data provided for each dimension pair. Coverage extends further to regional breakdowns, trend trajectories, and the competitive detail needed to support segment-level decision-making.

By Filler Type

  • Talc
  • Mica-Based Fillers
  • Silica
  • Naturally Derived Starches
  • Clay-Based Fillers
  • Synthetic Polymer Fillers

By End-Use Application

  • Color Cosmetics
  • Skincare Formulations
  • Personal Care Products
  • Nail Care Products
  • Sun Care Formulations

By Commercial Dimension

  • Direct Brand Supply Contracts
  • Contract Manufacturer Distribution
  • Private Label Formulation Services
  • Specialty Ingredient Distributors

By Region

  • North America
  • Western Europe
  • East Asia
  • South Asia and Pacific
  • Latin America
  • Middle East and Africa
  • Eastern Europe

Scope, Methodology, and Coverage

Every figure in this report is reproducible from documented input assumptions. The scope below maps the historical period, the forecast horizon, the segmentation dimensions, and the countries covered, alongside the underlying primary and qualitative methodology.
Historical Period
2020 to 2025
Forecast Period
2026 to 2036
Base Year
2025 (USD billions; MMA Primary Research Dataset, September 2026)
Market Definition
This report covers filler and extender ingredients used in cosmetic and personal care formulations to adjust texture, bulk, spreadability, and oil absorption, including talc, mica, silica, starches, and naturally derived alternatives. It excludes active ingredients, pigments, and preservatives classified as separate functional categories.
Quantitative Units
USD billions (current prices); unit shipment volume where applicable
Segmentation Dimensions
By Filler Type; By End-Use Application; By Commercial Dimension; By Region
Regions Covered
North America, Western Europe, East Asia, South Asia and Pacific, Latin America, Middle East and Africa, Eastern Europe
Countries Covered
USA, China, Germany, France, UK, Japan, South Korea, India, Australia, Canada, Brazil, Mexico, Indonesia, Vietnam, Thailand, Malaysia, UAE, Saudi Arabia, South Africa, Nigeria, Turkey, Poland, Netherlands, Italy, Spain, Sweden, Switzerland, Argentina, Colombia, Singapore, and additional markets relevant to this sector
Key Companies Profiled
Imerys, Kobo Products, Sudarshan Chemical Industries, Eckart, LANXESS, 3V Sigma, Elementis, Minerals Technologies, Croda International, BASF, Clariant, Sensient Technologies, AkzoNobel Specialty Chemicals, Nippon Talc, Golcha Minerals, Ingredion, Roquette Freres, Corn Products International, Advanced Nanotech Solutions, Bio-Botanica
Quantitative Methodology
Primary survey, n=3,800 respondents, Q4 2025, six countries; demand-side model with trade association cross-validation
Qualitative Methodology
47 expert interviews, Q4 2025; applied to validate demand model assumptions, identify emerging dynamics, and assess competitive positioning
Report Format
PDF and XLSX data workbook (Word format preview document)
Publisher
Market Minds Advisory
Report Code
MMA-2026-CHM-704
Published
September 2026
Contact
sales@marketmindsadvisory.com | www.marketmindsadvisory.com

Purchase the full Filler and Extender Cosmetics Market Report (2026 to 2036).

The full report provides comprehensive coverage of the global filler and extender cosmetics market across all seven regions, ten years of forecast data, and detailed competitive profiling of twenty leading filler manufacturers and specialty suppliers. It includes granular filler type segmentation analysis, regional demand architecture, and revenue lever modeling calibrated to real industry margin structures. Subscribers receive access to underlying primary survey data spanning 3,800 respondents and 47 expert interviews conducted during the fourth quarter of 2025. The report is designed for strategic planning, investment due diligence, and competitive benchmarking purposes across supplier and investor audiences alike.
Full competitive profiles of twenty key market participants
Detailed regional demand architecture across seven global regions
Revenue lever modeling with quantified financial impact estimates
Primary survey data from 3,800 respondents across six countries
Filler-level growth forecasts through the 2036 forecast horizon
Input cost risk analysis with supplier mitigation strategies

Built For The People Who Decide

From boardroom strategy to bench-side execution, this report is read cover-to-cover by leaders shaping the next decade of their industry, turning demand scenarios, market dynamics and valuation benchmarks into decisions.
CXOs/ Presidents/ VPs/ Managers
M&A and Corporate Development
Strategy Teams and R&D Heads
Procurement and Product Directors
Regulatory and Compliance Leaders
Investor Relations and Equity Analysts