Market Minds Advisory
Fiberglass Market

Fiberglass Market: Glass Fibre Reinforcement: Furnace Cycle Economics, Electronics-Grade Scarcity, and Chinese Capacity Everywhere

A glass fibre furnace runs for nine years and cannot be turned down. Everybody builds capacity at the same time, prices collapse together, and then nobody builds anything for half a decade.

Lead Analyst

David Horsley

Published

September 2026

Make Smarter Decisions with Customized Research Insights

Request a free sample report and evaluate market opportunities, growth trends, and competitive dynamics relevant to your business needs.

2025 MARKET VALUE$14.6BMarket Size 2025
2036 FORECAST VALUE$28.3BBase Case , 2026 to 2036
CAGR 2026 TO 20366.2 %Bull 7.4% / Bear 5.0%
INCREMENTAL OPPORTUNITY$12.8BNet 10- year value creation
EXPANSION MULTIPLE1.82x2036 value over 2026 base
Strategic Levers
M&A Pipeline
Regional Outlook
Country Rankings
Competitive Intelligence
Segmental Deep-dive
Call-Us : 91 93563 13602

Executive Snapshot and Market Trajectory

The defining fact here is a furnace that runs nine years without stopping and costs a fortune to light. Output is fixed the day it starts. Everything about pricing, capacity discipline, and who survives a downturn follows from that one piece of engineering. Nothing else here comes close.
Commercial advantage belongs to producers making glass other people cannot rather than those making more of the same, because specialty and electronics grades escape the capacity cycle that governs commodity roving. High-modulus and specialty glass grows fastest at 10.6%, roughly 1.71 times the market. East Asia holds the largest position at 32% of value, above the standard band, because roughly 58% of world capacity sits in China alone.
Concentration is high at roughly 62% for the top five, sustained by furnace capital rather than by any technology nobody else has. Wind turbine blades take 23% of volume and the blade makers negotiate accordingly. Electronics-grade yarn for circuit board substrate is the one part of this market where supply genuinely cannot meet demand. Laminators building server boards now accept allocated volumes rather than tendering, which happens nowhere else in this industry at all.
Market Definition
The market comprises glass fibre reinforcement products supplied to composite and electronics manufacturers, covering direct and assembled roving, chopped strands, chopped strand and continuous filament mat, woven fabrics and multiaxial reinforcements, glass fibre yarn for electronics substrate, and high-modulus or specialty glass. Value is measured at fibre producer level. Glass wool building insulation, carbon and aramid fibre, resin systems and sizing chemistry sold separately, finished composite parts, and downstream laminate manufacture fall outside scope.
Base Year Value
$14.6B in 2025 (MMA Primary Research Dataset, August 2026)
Forecast Period
2026 to 2036, eleven discrete annual values
CAGR
6.2% base case. Bull 7.4%. Bear 5.0%.
Fastest Growth Segment
High-Modulus and Specialty Glass: 10.6% CAGR
Fastest Growth Country
India: 9.2% CAGR
Fastest Growth Region
South Asia and Pacific: 8.4% CAGR
Largest Region
East Asia: 32% of 2025 global value
Market Leaders
China Jushi, Owens Corning, Chongqing Polycomp International, Taishan Fiberglass, and Nippon Electric Glass lead on glass fibre reinforcement revenue. Source: company annual reports and MMA Analysis, July 2026.
Primary Survey
n=3,800 procurement and R&D decision-makers, Q4 2025, six countries
Methodology
Demand-side build-up, cross-validated against public data, 47 expert interviews

Fiberglass Electrical Enclosure Market Forecast Scenarios

fiberglass-electrical-enclosure-market-size-forecast-scenario-1787551294137
Between 2020 and 2025, fiberglass electrical enclosure demand grew at an estimated 5.8% annually as utility infrastructure investment recovered from pandemic-era disruption and telecommunications operators expanded outdoor equipment deployment. Hubbell and Robroy Industries both expanded production capacity through the period to meet growing utility and telecom customer demand. Customers reported growing satisfaction with supply reliability.
MMA's base case projects 6.6% annual growth to 2036 on three mechanisms: continued utility grid modernization requiring corrosion-resistant switchgear enclosures across expanding electricity networks, growing telecommunications infrastructure deployment requiring outdoor equipment cabinets in harsh environments, and steady oil and gas facility investment requiring hazardous-location certified enclosures. Wastewater treatment modernization is adding a fourth, smaller growth channel through expanding municipal infrastructure investment. Marine and offshore demand is emerging as a smaller fifth growth contributor across the category.
A bull catalyst comes from faster-than-expected utility grid hardening investment driven by extreme weather resilience initiatives across multiple major economies. The bear risk is material substitution: if advanced polymer or coated-steel alternatives close the corrosion resistance gap at meaningfully lower cost, some fiberglass enclosure applications could shift toward these alternatives, slowing category growth. Manufacturers hedging against this risk are diversifying into broader non-metallic product lines simultaneously.

Nine Years of Fixed Output

Three things drive this market and the first is thermodynamic. A melting furnace runs continuously for around nine years, costs hundreds of millions to build, and cannot be throttled down when demand falls without damaging the refractory. So output is fixed, capacity arrives in enormous discrete blocks, and pricing swings violently between the moments when new furnaces light.
TOP-FIVE CONCENTRATION62%Combined output share held by leading fibre producers globally
FURNACE CAMPAIGN LENGTH9 yearsTypical continuous run before a melting furnace requires rebuild
AVERAGE REALISED PRICEUSD 1,340 per tonneBlended across roving, mat, fabric, and yarn products
ENERGY COST SHARE27%Portion of production cost consumed by furnace melting
WIND APPLICATION SHARE23%Portion of reinforcement volume entering turbine blade manufacture
TOP PRODUCING COUNTRY SHARE58%Portion of global capacity located in the leading producing country
Chinese capacity is the second, and roughly 58% of world melting sits there. Jushi, CPIC, and Taishan built at a pace nobody else attempted and export aggressively, which drew anti-dumping duties in Europe and North America. Those producers then built furnaces in Egypt, India, and the United States, which relocated the capacity without reducing it at all.
The third is that specialty glass escapes all of this. Electronics-grade yarn for circuit board substrate, particularly the low dielectric grades that high-frequency server boards require, comes from a handful of Japanese and Taiwanese producers and cannot be expanded quickly. High-modulus glass for long turbine blades is similarly constrained. Those grades price on scarcity rather than on where the furnace cycle happens to sit. Nothing in the capacity cycle touches those grades at all.
"People model this like a chemicals business and it behaves like a smelter. You cannot turn it down, you cannot turn it up, and the only decision that ever really mattered was what you chose to melt when you rebuilt. Everything else is commentary on somebody else's furnace schedule."
Practice Director, Composite Materials and Industrial Fibres · MMA Composite Reinforcement Materials Practice · August 2026

Market Trends

Low Dielectric Yarn Becomes the Constraint on Server Boards

High-frequency circuit boards for artificial intelligence servers require glass cloth with dielectric properties ordinary E-glass cannot deliver, and the low dielectric compositions that work come from a very small number of Japanese and Taiwanese producers. Weaving capacity for the finest yarn counts is equally scarce. Furnace conversion to those compositions takes years and cannot be rushed by capital alone. Electronics-grade yarn grows at 9.4% and is the only part of this market where customers routinely accept allocation rather than negotiating price down. Price negotiation has effectively stopped in that segment altogether.
Market Impact: Chopped strands grow at 6.2%
Blade Length Pushes Specification Toward Higher Modulus Glass

Offshore turbine blades have passed lengths where standard E-glass stiffness limits the design, and manufacturers have moved to high-modulus compositions or hybrid glass and carbon layups to control tip deflection. That raises value per tonne even when installation volumes disappoint, which matters because wind volumes are genuinely cyclical. High-modulus and specialty glass grows at 10.6%, fastest in this market. Blade makers still negotiate hard on commodity roving, so the specification shift is where suppliers recover margin they lose everywhere else. Hybrid layups with carbon complicate the picture without removing the glass content.
Market Impact: China holds 58% of capacity

Market Opportunities and Growth Drivers

Automotive Lightweighting Converts Metal Parts Continuously

Glass reinforced thermoplastics keep replacing stamped and cast metal in structural brackets, front end modules, battery enclosure components, and underbody panels, driven by weight targets that apply to combustion and electric platforms alike. Chopped strand demand for compounding grows steadily as a result, and electric vehicle battery housings have added a genuinely new application with demanding flame and impact requirements. The conversion is incremental rather than dramatic, which makes it one of the steadier demand lines in a market defined by cycles. Compounders rather than vehicle manufacturers make the fibre purchasing decision here.
Market Impact: Campaigns lock output for 9 years

Chinese Capacity Relocation Reshapes Regional Supply

Anti-dumping duties in Europe and North America made direct Chinese exports uneconomic on commodity grades, and the response was to build furnaces in Egypt, India, and the United States rather than to reduce output. Those plants carry Chinese engineering, capital discipline, and cost structures into markets that had assumed duties would protect them. Regional producers now face the same competitor from inside their own tariff walls. Capacity relocated rather than disappeared, which is a different problem from the one duties were designed to solve. Egyptian energy costs made that particular decision straightforward.
Market Impact: Blade buyers control 23% of volume

Market Restraints and Challenges

Furnace Economics Prevent Any Supply Discipline

A melting furnace cannot be throttled without damaging refractory, so a producer facing weak pricing keeps running and sells into the weakness rather than idling capital worth hundreds of millions. The root cause is that fixed cost dominates and marginal cost is low, which makes running at a loss rational for the individual producer and ruinous collectively. Mitigation runs through composition changes at rebuild that move a furnace into specialty grades, through export market development, and through downstream integration that captures value the fibre price cannot. None of it restores discipline to the cycle itself.
Market Impact: Electronics yarn grows at 9.4%

Wind Blade Buyers Squeeze Commodity Roving Pricing

Turbine blade manufacture takes 23% of reinforcement volume through a small number of buyers who tender aggressively and switch suppliers on price for standard grades. The root cause is that commodity roving is genuinely interchangeable between qualified producers, so nothing holds the business beyond cost. Suppliers mitigate by moving into high-modulus and hybrid specifications where qualification is harder and alternatives fewer, by supplying multiaxial fabrics rather than raw roving, and by diversifying toward applications with less buyer concentration. Blade programmes also run for years, so a lost tender removes volume for far longer than a single contract period.
Market Impact: Specialty glass grows at 10.6%
4 additional market trends, 3 additional growth drivers, and 2 additional restraints and challenges are covered in the full report. Contact sales@marketmindsadvisory.com to access the complete intelligence.

Segment CAGR and Growth Architecture

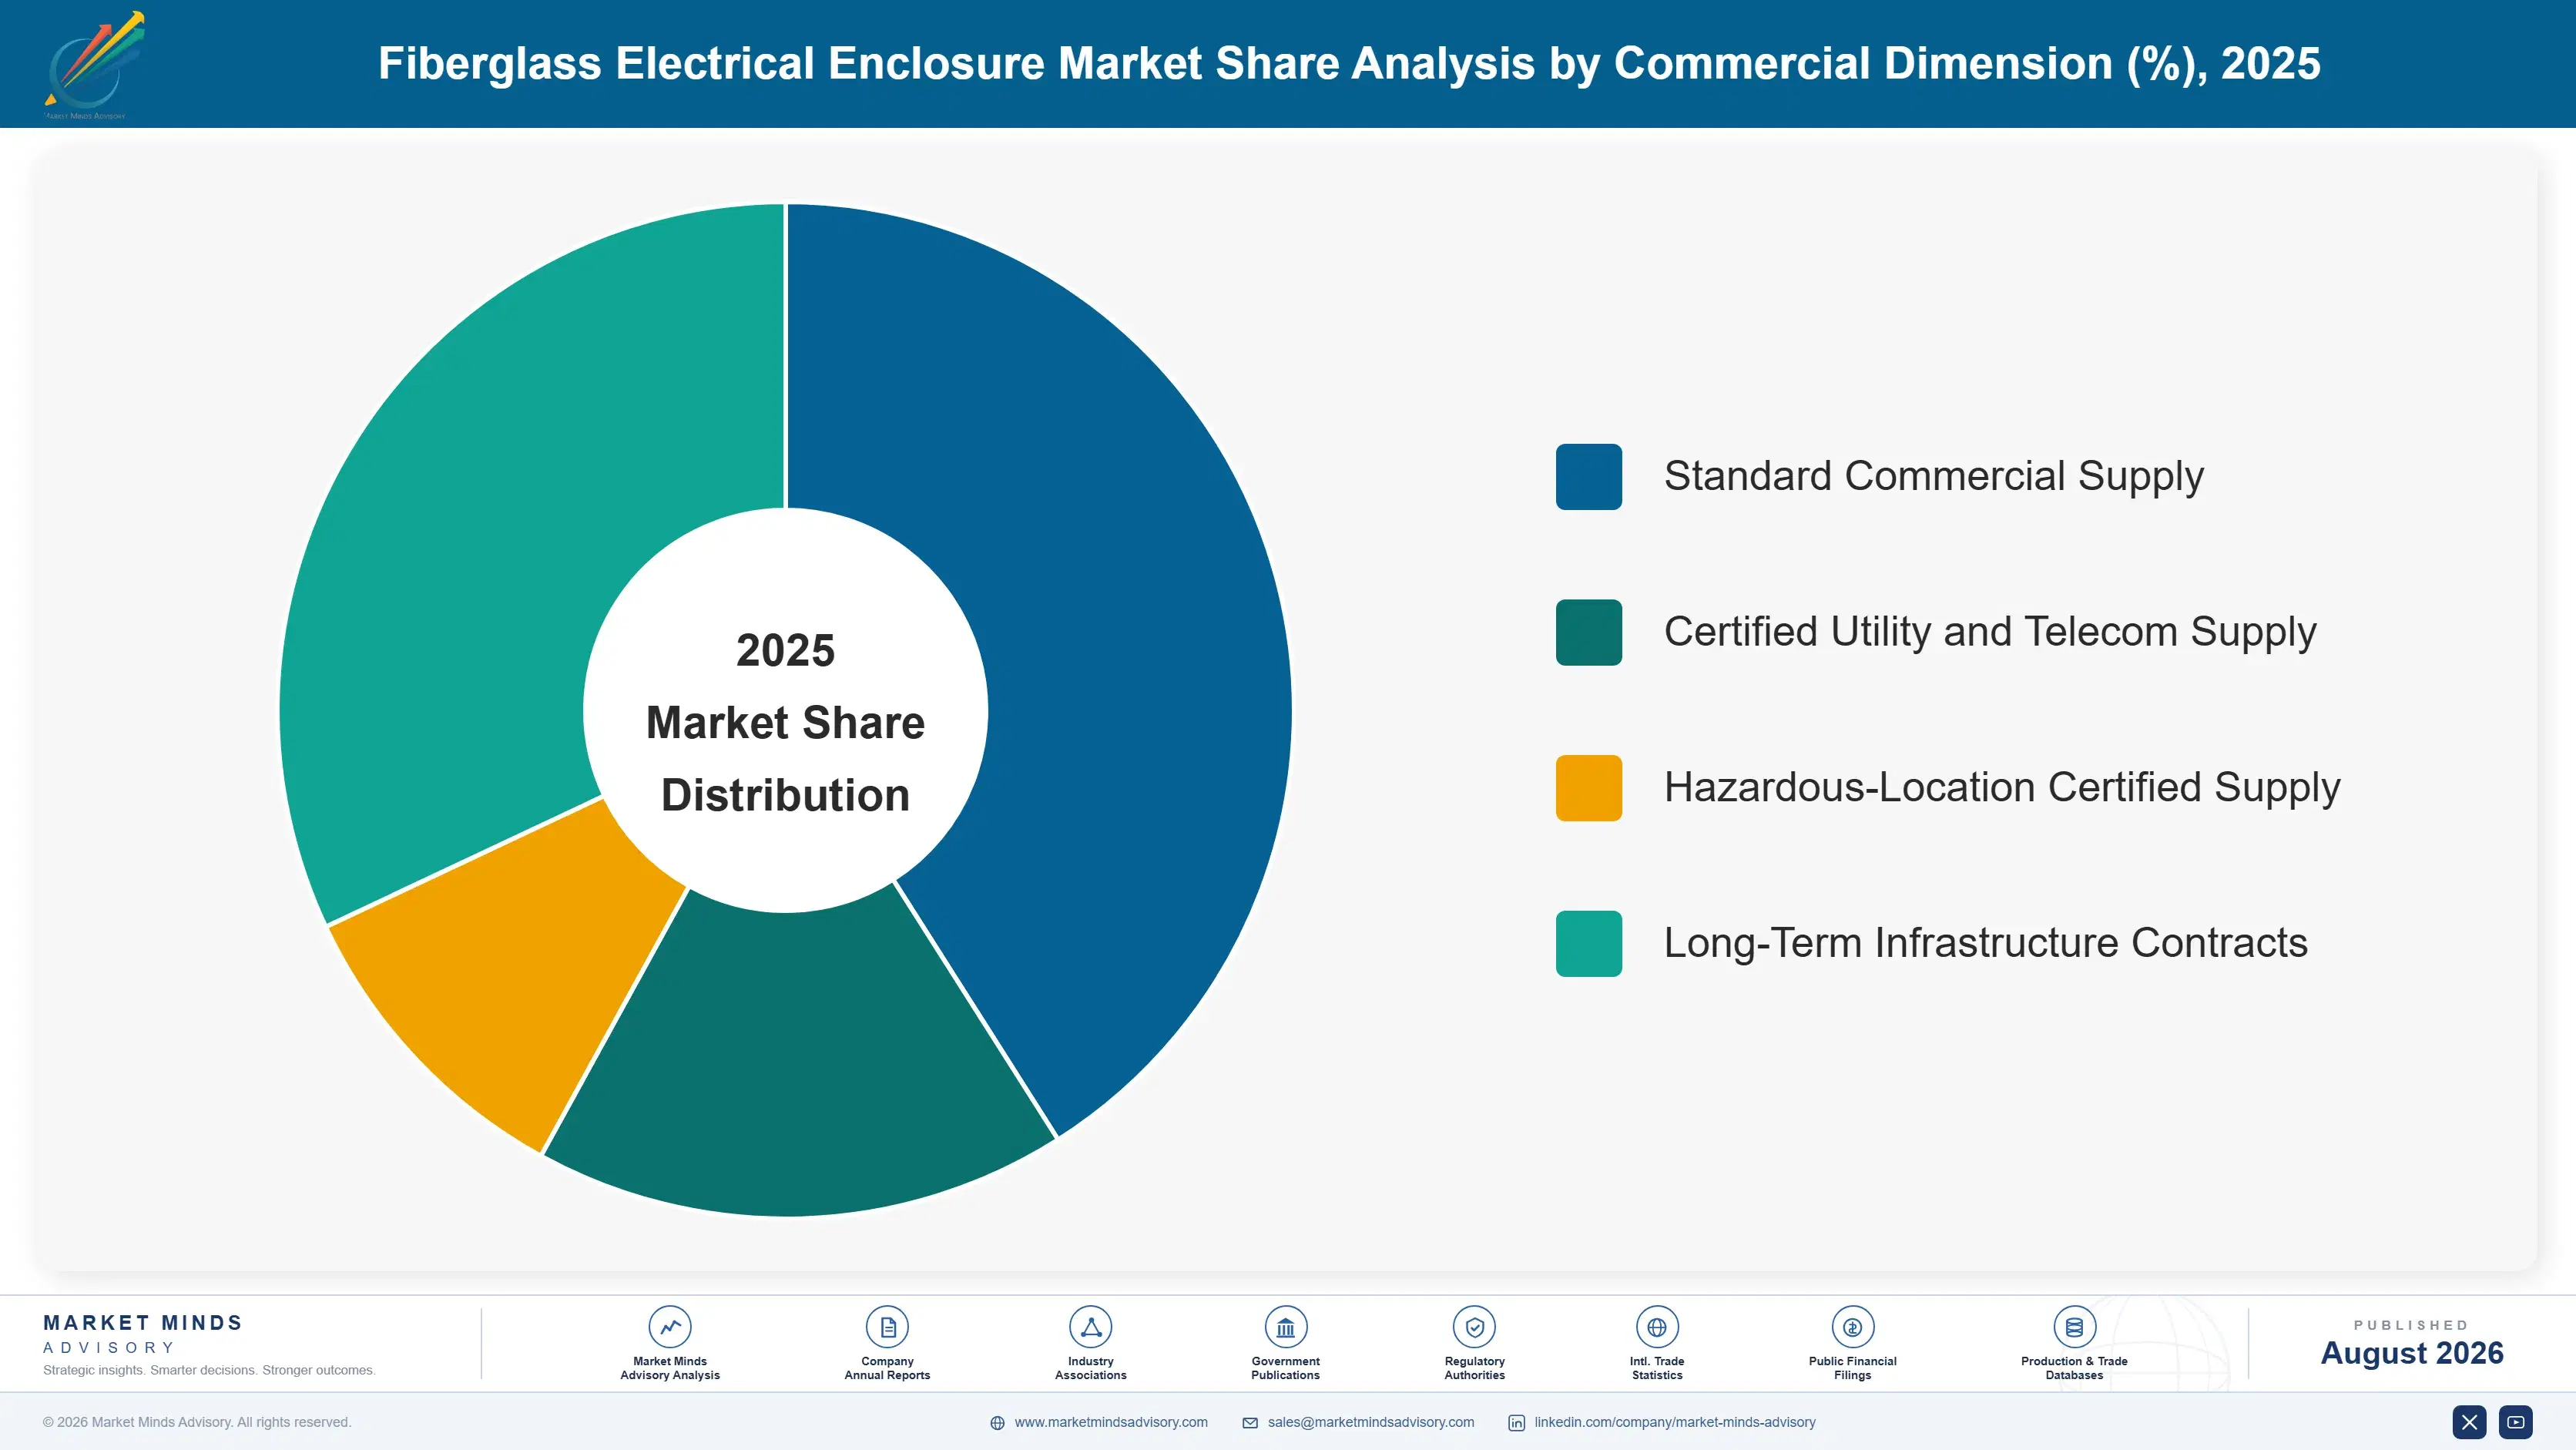
Segmentation follows fibre product form, because each form carries a distinct manufacturing route, customer set, and position relative to the furnace capacity cycle that governs commodity pricing. Six forms cover commercial supply, and the divide between standard compositions competing on cost and specialty compositions competing on scarcity matters more than any distinction between product shapes.
fiberglass-electrical-enclosure-market-market-share-analysis-1787551294673

High-Modulus and Specialty Glass

The fastest form at 10.6%, roughly 1.71 times the market, covering high-modulus compositions for long turbine blades, corrosion-resistant ECR glass for pipe and tank service, and boron-free formulations developed partly for cost and partly for emissions. Furnace conversion to these compositions happens only at rebuild, which means a nine-year campaign decides a producer's specialty position for most of a decade. Qualification with blade and pressure vessel manufacturers runs long and holds afterwards. Pricing reflects scarcity and switching difficulty rather than the commodity cycle governing standard roving alongside it. Boron-free formulations also remove exposure to a concentrated mineral supply base, which is a second reason producers revisit composition when rebuild capital comes up for approval.
CAGR 10.6%

Glass Fibre Yarn for Electronics Substrate

Second fastest at 9.4%, supplying the woven cloth that carries copper in printed circuit boards, and the only part of this market where customers accept allocation rather than pushing price down. Low dielectric compositions required by high-frequency server boards come from a handful of Japanese and Taiwanese producers, and the finest yarn counts need weaving capacity equally scarce. Furnace conversion takes years and capital alone does not accelerate it. Artificial intelligence infrastructure demand has tightened this considerably, and no announced capacity resolves it inside the forecast period. Weaving is a separate business from melting, and producers holding both the yarn and the cloth capability occupy a position almost nobody else can assemble quickly.
CAGR 9.4%
Full segment breakdown across 6 segments available in the complete report.

Regional Architecture and Country Demand Map

Regional shares follow melting capacity and composite manufacturing rather than end demand, since fibre is shipped globally and duties reshape rather than block trade. East Asia sits above the standard band for reasons stated below, and every other region falls inside its range. Consumption maps poorly onto production here.

North America

Owens Corning and Johns Manville operate substantial domestic melting capacity serving construction, transportation, and industrial composite markets across the region. Anti-dumping duties on Chinese imports were expected to protect that position, and Chinese producers responded by building furnaces inside the United States instead, which brought the competition through the tariff wall rather than stopping it. Wind blade manufacture, pipe and tank fabrication, and automotive compounding absorb most volume. Growth of 6.0% depends on infrastructure spending and automotive conversion rather than on any change in the domestic supply position. Electronics substrate cloth is imported almost entirely, since no domestic producer holds the low dielectric composition capability that high-frequency server boards now require.
Share: 22% | CAGR: 6.0% (2026 to 2036)

Western Europe

European melting capacity has contracted as energy costs made furnace operation uncompetitive against Asian and Middle Eastern supply, and several campaigns ended without rebuild rather than continuing. What remains is weighted toward specialty compositions, multiaxial fabrics, and technical applications where proximity to customers still matters commercially. 3B Fibreglass, Saertex, and Chomarat hold positions built on fabric conversion rather than raw fibre melting. Wind blade manufacture is significant but under sustained cost pressure. Growth of 4.6% is the slowest anywhere, reflecting energy costs and industrial demand that has not recovered. Regional producers that kept only conversion capability retained their customer relationships and lost the melting economics, which is proving the more survivable of the two positions.
Share: 19% | CAGR: 4.6% (2026 to 2036)
Regional intelligence for 5 additional markets available in the complete report: East Asia, South Asia and Pacific, Latin America, Middle East and Africa, Eastern Europe. Contact sales@marketmindsadvisory.com.
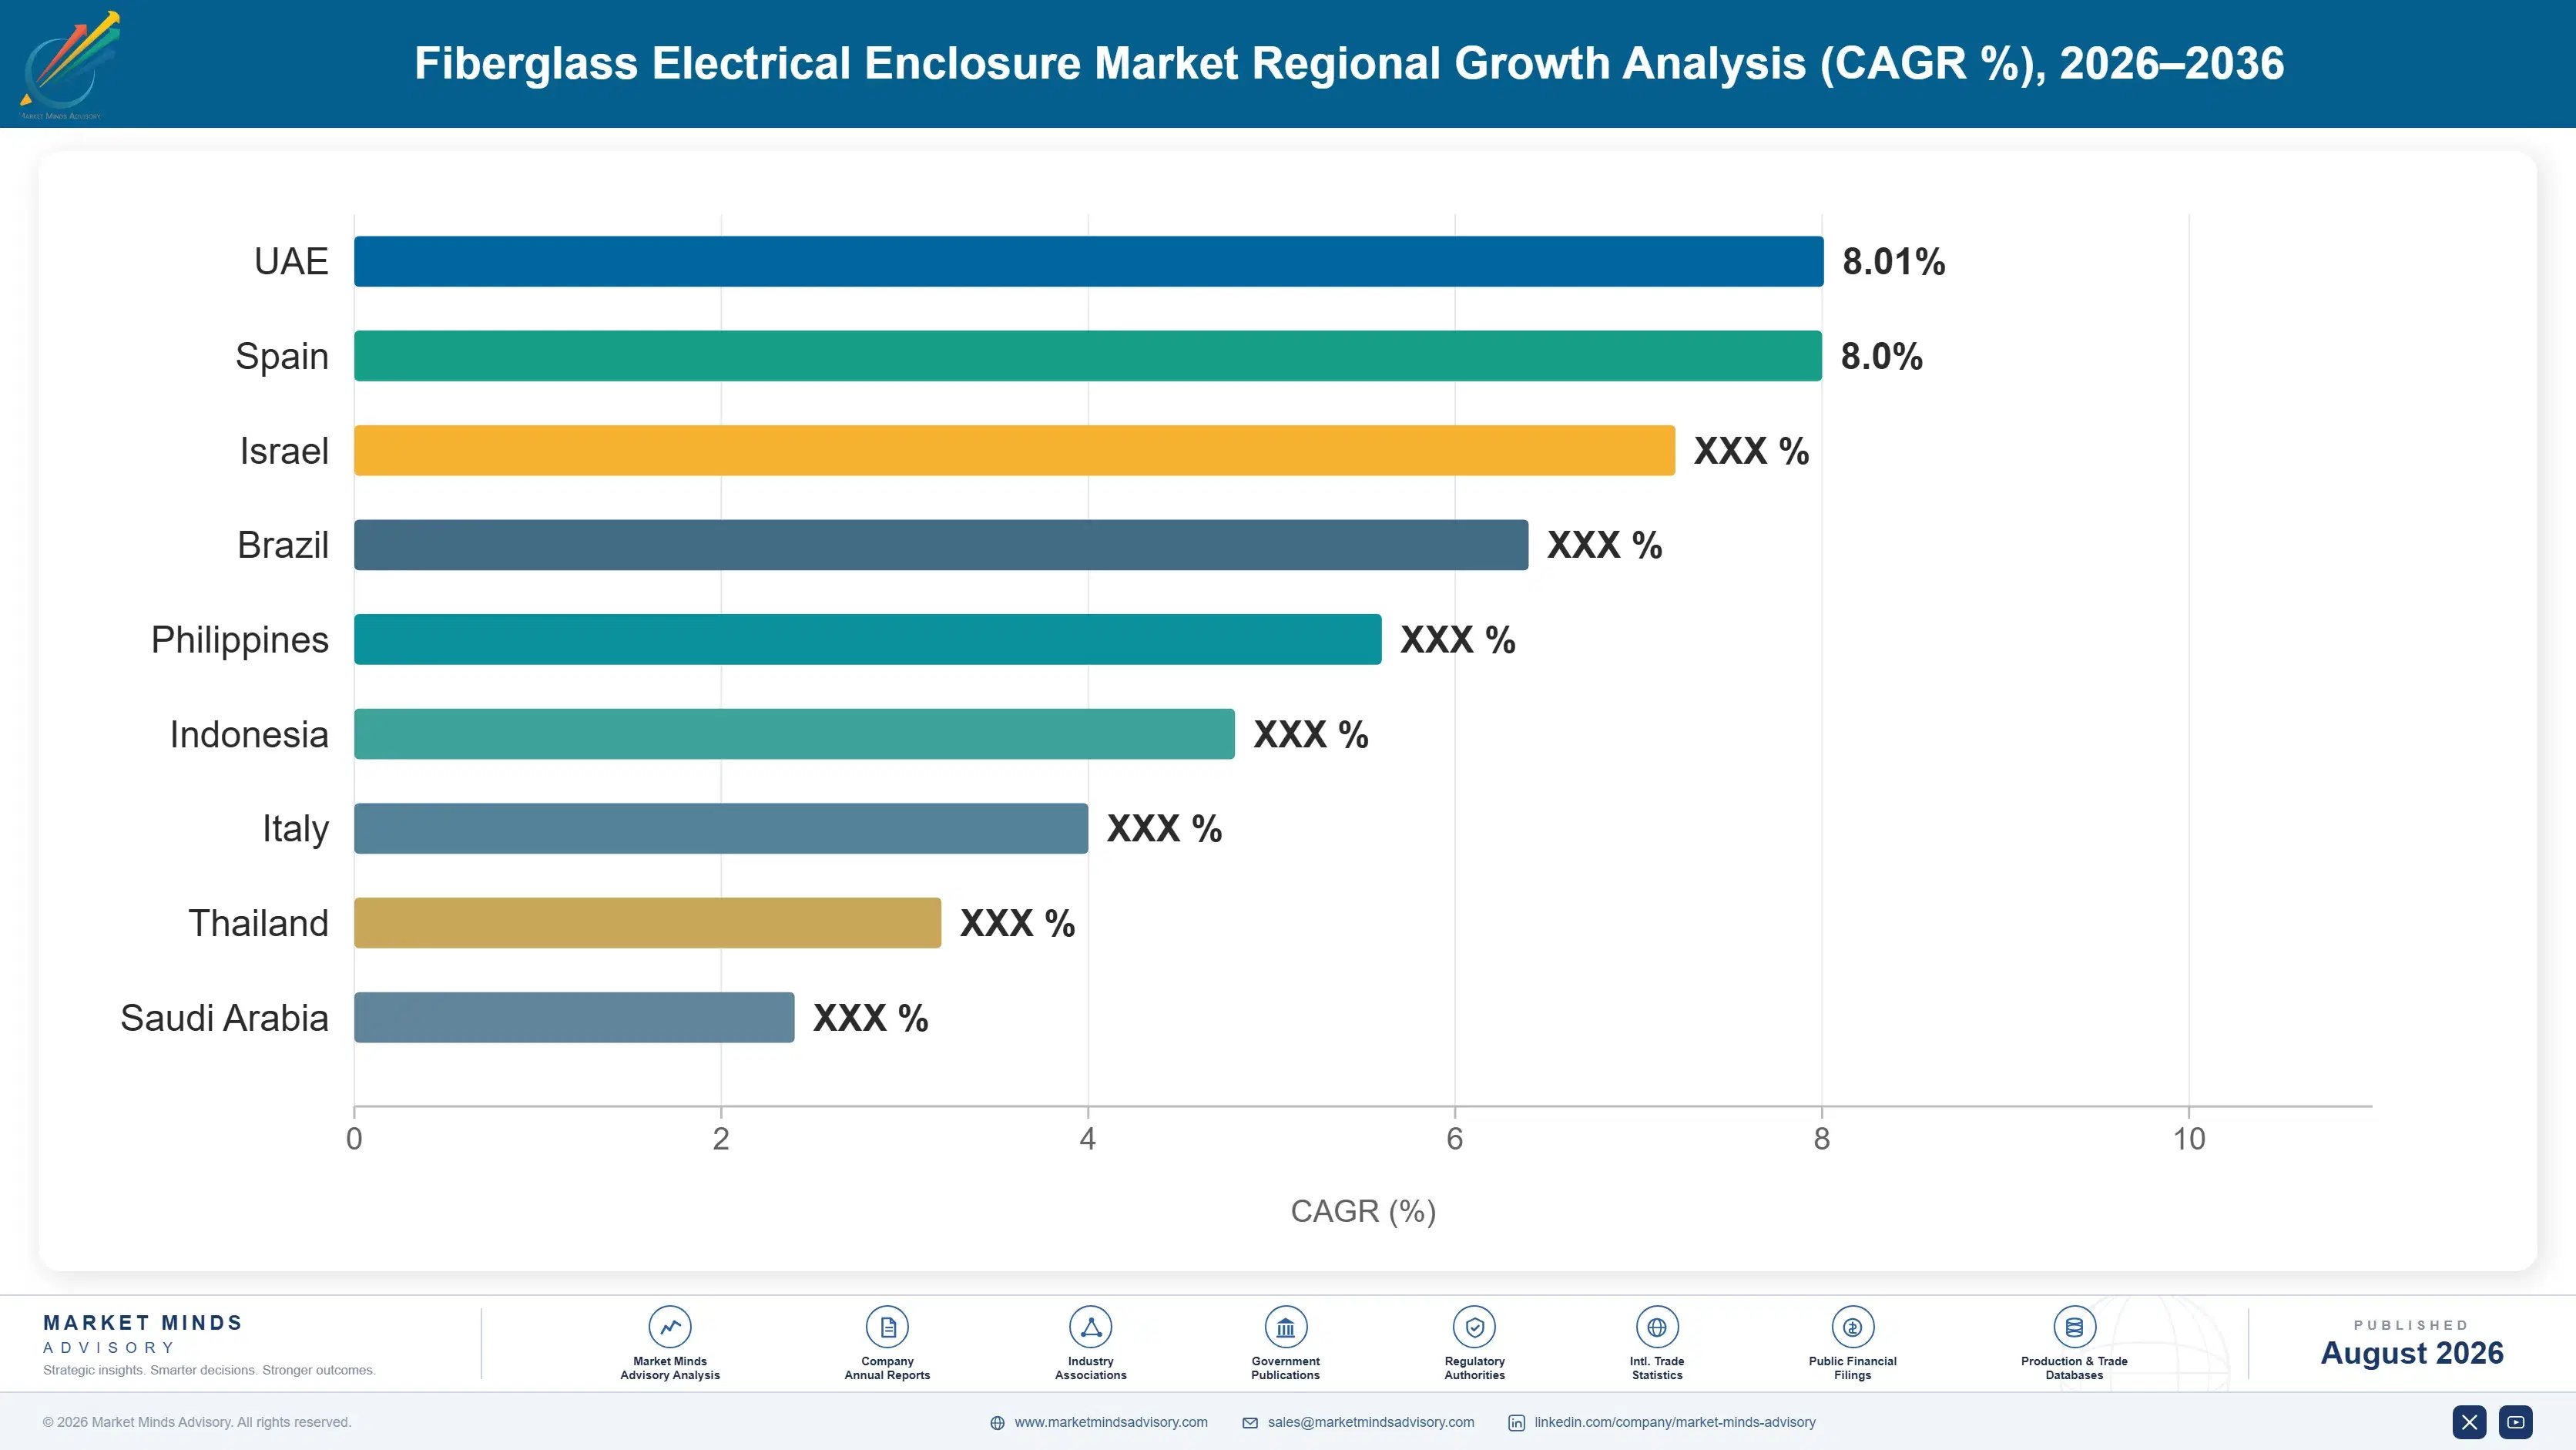
fiberglass-electrical-enclosure-market-country-cagr-analysis-1787551295205

Four Moves Around the Furnace Cycle

Advantage here is decided at rebuild rather than in any sales meeting, because a campaign fixes what a producer can melt for nine years. Four moves justify capital across the forecast period, and the first is the only one that genuinely escapes the pricing cycle governing everything else in this industry. Sales effort cannot fix a composition decision.

Convert furnaces to specialty compositions at rebuild

A campaign runs around nine years and composition can only change when the furnace is rebuilt, which means one decision fixes a producer's position for most of a decade. High-modulus and specialty glass grows at 10.6% against a market rate of 6.2%, and it prices on scarcity rather than on where the capacity cycle sits. Producers who rebuild into commodity roving because that is what they already make are choosing another nine years inside the price war. Qualification with blade designers and pressure vessel fabricators runs long, so the commercial groundwork has to start well before rebuild capital is committed.
Market Impact: Locks a specialty position for 9 full years

Pursue electronics substrate positions despite the timeline

Low dielectric yarn for high-frequency server boards is the only place in this market where customers accept allocation rather than negotiating price down, and it grows at 9.4% with no announced capacity resolving the shortage inside the forecast period. Furnace conversion and yarn qualification both take years, which is exactly why the position is defensible once held. Producers waiting for clearer demand signals will find the qualification queue closed by producers who moved earlier. Weaving capability matters as much as melting here, since the finest yarn counts need looms that are equally scarce and equally slow to add.
Market Impact: Enters an allocated segment growing 9.4% each year

Sell fabric and multiaxial rather than raw roving

Blade manufacturers take 23% of volume and tender commodity roving aggressively because qualified producers are genuinely interchangeable at that specification. Multiaxial fabrics and engineered reinforcement packages carry conversion value, design engagement, and switching cost that raw fibre never does. Conversion is also far less energy intensive than melting, which matters where power costs 27% of production. European producers who moved downstream survived campaigns that pure melters could not justify rebuilding at all. Design engagement with the part maker also arrives years before production, which is a different commercial rhythm from tendering and rewards entirely different capabilities.
Market Impact: Moves beyond the 23% exposed to blade tenders

Site new melting where energy is genuinely cheap

Energy consumes 27% of production cost and a furnace burns it continuously for nine years, which makes power price the single largest variable in any new capacity decision. Chinese producers building in Egypt understood this precisely, and European campaigns ended without rebuild for the same reason in reverse. Duties do not change the arithmetic, since capacity relocates rather than disappearing. Any producer evaluating a rebuild against a greenfield site elsewhere should treat the energy contract as the decision itself. A nine-year campaign multiplies whatever energy differential exists at the moment of commitment.
Market Impact: Energy alone consumes 27% of total production cost

Who Controls the Margin Pool

Concentration runs at roughly 62% for the top five on reinforcement revenue, sustained by the capital required to light a furnace rather than by any proprietary technology. China Jushi leads on scale nobody approaches, with CPIC and Taishan close behind on domestic and export volume. Owens Corning holds the strongest Western position across melting and downstream conversion. Nippon Electric Glass anchors the electronics substrate business alongside Nittobo.
Competition runs on three dimensions. Furnace cost position is the first, and energy price plus capital discipline decide it before anybody sells anything. Composition capability is the second, since specialty and electronics grades escape commodity pricing entirely. Downstream conversion is the third, because fabric and multiaxial work carries value that raw fibre pricing has surrendered. Nothing about melting scale reaches either of the other two.

Pressure is building from Chinese producers relocating capacity inside tariff walls in Egypt, India, and the United States, which brings their cost structure into markets duties were meant to protect. Rankings will shift toward producers holding specialty compositions and electronics positions rather than toward whoever melts the most tonnes each year. Tonnage melted has stopped being the measure that decides who earns anything.
fiberglass-electrical-enclosure-market-company-positioning-matrix-1787551295728

Competitive Moat and Risk Dimensions

CHINA JUSHI

Moat: Furnace scale and capital discipline

Jushi operates melting capacity at a scale no competitor matches, built with capital costs and timelines Western producers cannot replicate. That gives a cost position which holds through the price troughs its own capacity additions frequently create. Overseas plants in Egypt, India, and the United States extend the same approach into markets that expected duties to keep it out.
CHINA JUSHI

Risk: Commodity composition concentration

The portfolio is weighted heavily toward standard compositions competing purely on cost, which is exactly where pricing swings hardest through the capacity cycle. Electronics substrate and the highest modulus specialty grades sit largely with Japanese producers. Converting furnaces to those compositions takes a rebuild cycle and qualification time that scale advantages do nothing whatsoever to shorten.
NIPPON ELECTRIC GLASS

Moat: Electronics substrate composition capability

Low dielectric glass compositions for high-frequency circuit board substrate come from a very small group of producers, and Nippon Electric Glass sits at the centre with both melting and yarn capability. Customers accept allocation rather than negotiating price in that segment, which is unique in this industry. Qualification cycles measured in years protect the position against new capital elsewhere.
NIPPON ELECTRIC GLASS

Risk: Limited commodity volume scale

Standard roving and chopped strand volumes are modest against Chinese producers, which leaves the company exposed if electronics substrate demand moderates and it needs commodity tonnage to keep furnaces loaded. Specialty focus is a strength while the shortage lasts and a concentration risk afterwards. Building commodity scale against Jushi's cost base is not a realistic response at any point.

Players Tracked

Prominent Players

China Jushi
Owens Corning
Chongqing Polycomp International
Taishan Fiberglass
Nippon Electric Glass

Other Key Players

Johns Manville
3B Fibreglass
AGY Holding
Nittobo
PFG Fiber Glass
Sichuan Weibo
Jiangsu Changhai Composite
KCC Corporation
Taiwan Glass
Sisecam
Valmiera Glass
Goa Glass Fibre
Saertex
Chomarat
Hexcel

Recent Developments

FEBRUARY 2025

Substrate customers accept allocation on low dielectric yarn

Circuit board laminators supplying artificial intelligence server programmes accepted allocated volumes of low dielectric glass yarn rather than tendering on price, after qualified capacity proved unable to meet demand across the year. No announced expansion resolves the shortage inside the forecast period. Pricing power moved entirely upstream.
Signal: Allocation rather than price negotiation marks a segment where furnace conversion timelines genuinely bind available supply
JUNE 2025

Chinese producer commissions United States melting capacity

A Chinese glass fibre producer started a new furnace inside the United States, bringing its engineering and cost structure through anti-dumping duties that had been expected to protect domestic manufacturers. Regional producers now face the same competitor from within their own trade protection. Local rivals had assumed otherwise.
Signal: Duties relocated capacity rather than removing it, which is a different problem from the one they addressed
OCTOBER 2025

European melter ends campaign without rebuild decision

A Western European producer allowed a furnace campaign to expire without committing rebuild capital, citing regional energy costs against Egyptian and Asian alternatives. Downstream fabric conversion at the same site continues using imported fibre rather than material melted locally. Customer relationships survived that closure entirely intact.
Signal: Energy at 27% of cost is deciding where furnaces exist, and conversion survives where melting no longer can

What the Furnace Actually Costs

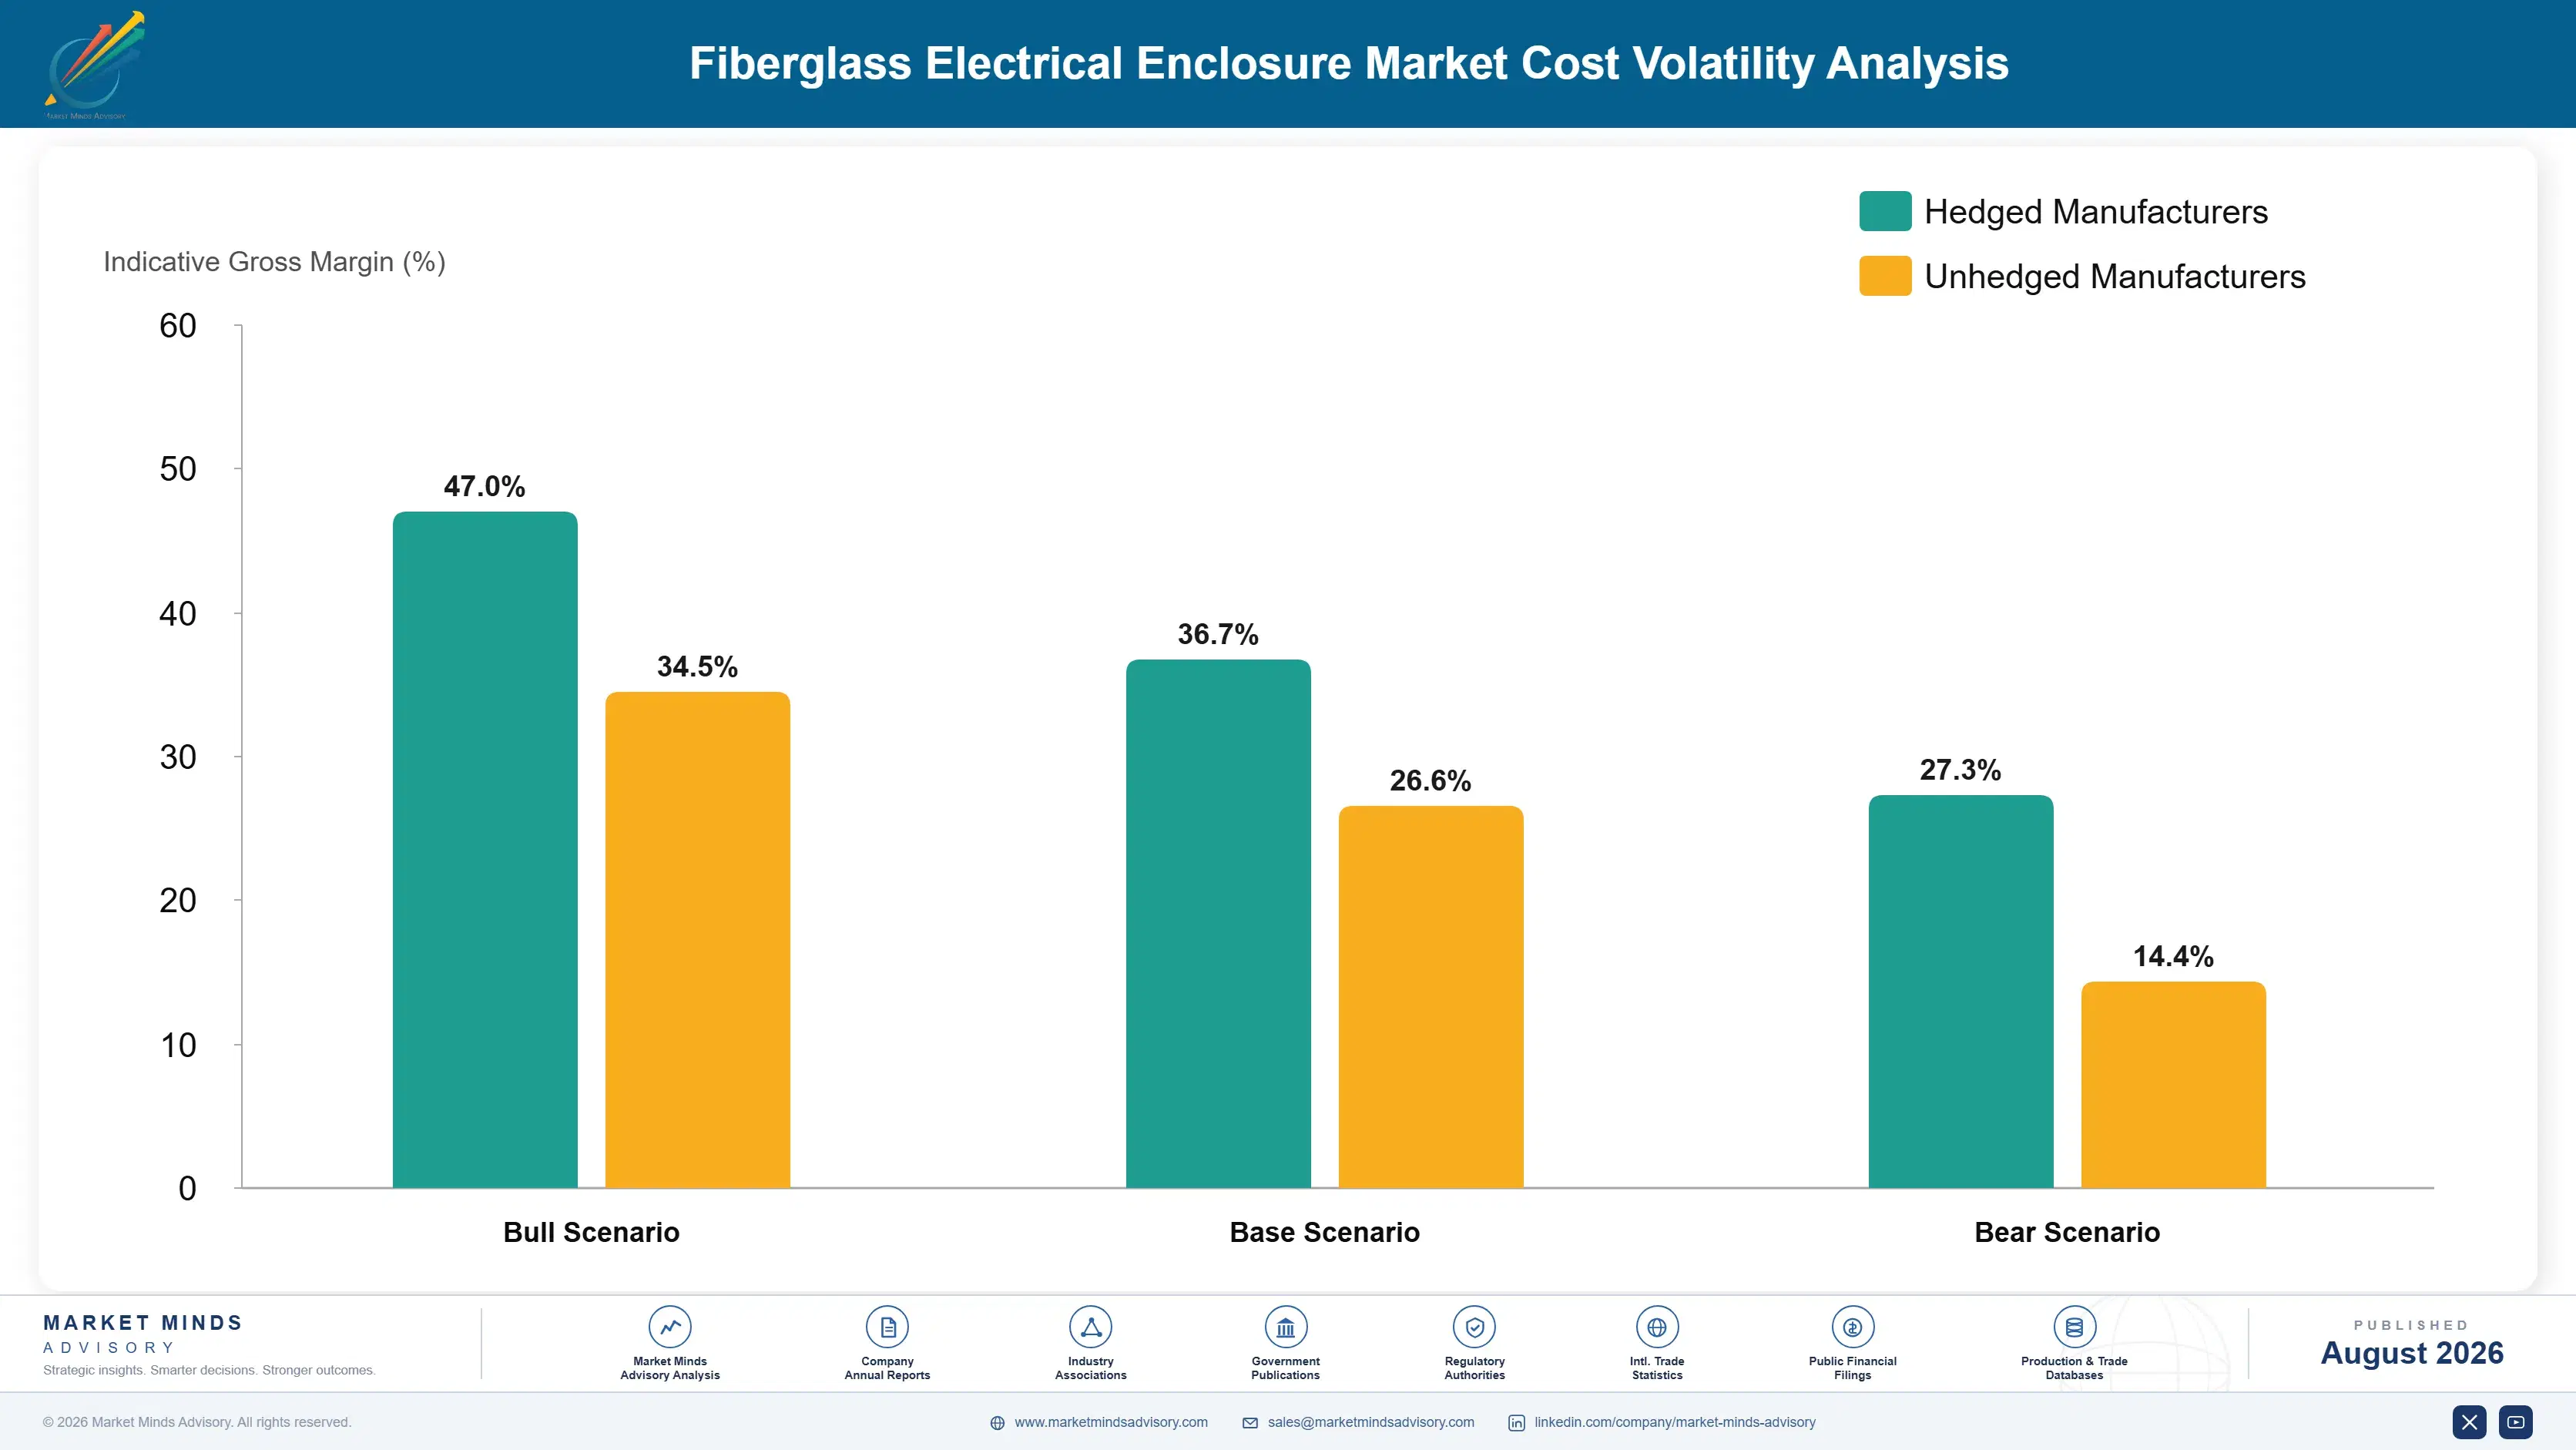
Energy for melting dominates at roughly 27% of production cost, drawn from natural gas and electricity depending on furnace design and regional supply. Batch minerals take a further 21%, covering silica sand, kaolin, limestone, and boron compounds sourced largely from Turkey and the United States. Sizing chemistry and binders absorb 14%. Furnace rebuild capital amortised across a nine-year campaign forms a substantial fixed layer beneath everything else.
European natural gas and electricity prices moved violently through 2022 and into 2023, and glass fibre melting is among the most exposed industrial processes to exactly that movement. Owens Corning and Sisecam both discussed energy cost pressure and its effect on regional competitiveness in their reporting for those years. Boron compound supply is concentrated enough that pricing moved separately, which accelerated interest in boron-free ECR compositions across several producers.

Exposure divides on furnace location and composition rather than on scale. A producer melting in Egypt or the Gulf carries energy costs a fraction of European equivalents on identical technology, and no operational improvement closes that gap. Specialty and electronics compositions carry margins wide enough to absorb energy movement comfortably. Commodity roving producers in high-cost energy regions have no cushion when power prices rise.
fiberglass-electrical-enclosure-market-cost-volatility-analysis-1787551295923

Treat the energy contract as the rebuild decision

Energy consumes 27% of production cost continuously across a nine-year campaign, which makes the power price the dominant variable in any melting investment rather than one input among several. Producers evaluating a rebuild against a greenfield site elsewhere should model the energy contract first and the market position second. European campaigns have ended on precisely this arithmetic.

Move furnaces toward boron-free compositions

Boron compound supply is concentrated in few origins and priced accordingly, and ECR and other boron-free formulations remove that exposure while offering corrosion resistance customers value independently. The composition change only happens at rebuild, so the decision arrives once every nine years. Producers who did not consider it at the last rebuild are carrying the exposure until the next one.

Expand conversion where melting is uneconomic

Fabric weaving, multiaxial stitching, and chopping consume a small fraction of the energy melting requires, which lets a producer keep customer relationships and downstream value in a region where furnace economics have failed. European sites have done exactly this, importing fibre and converting locally. The commercial position survives even when the melting capacity does not.

Portfolio Architecture for Margin Defence

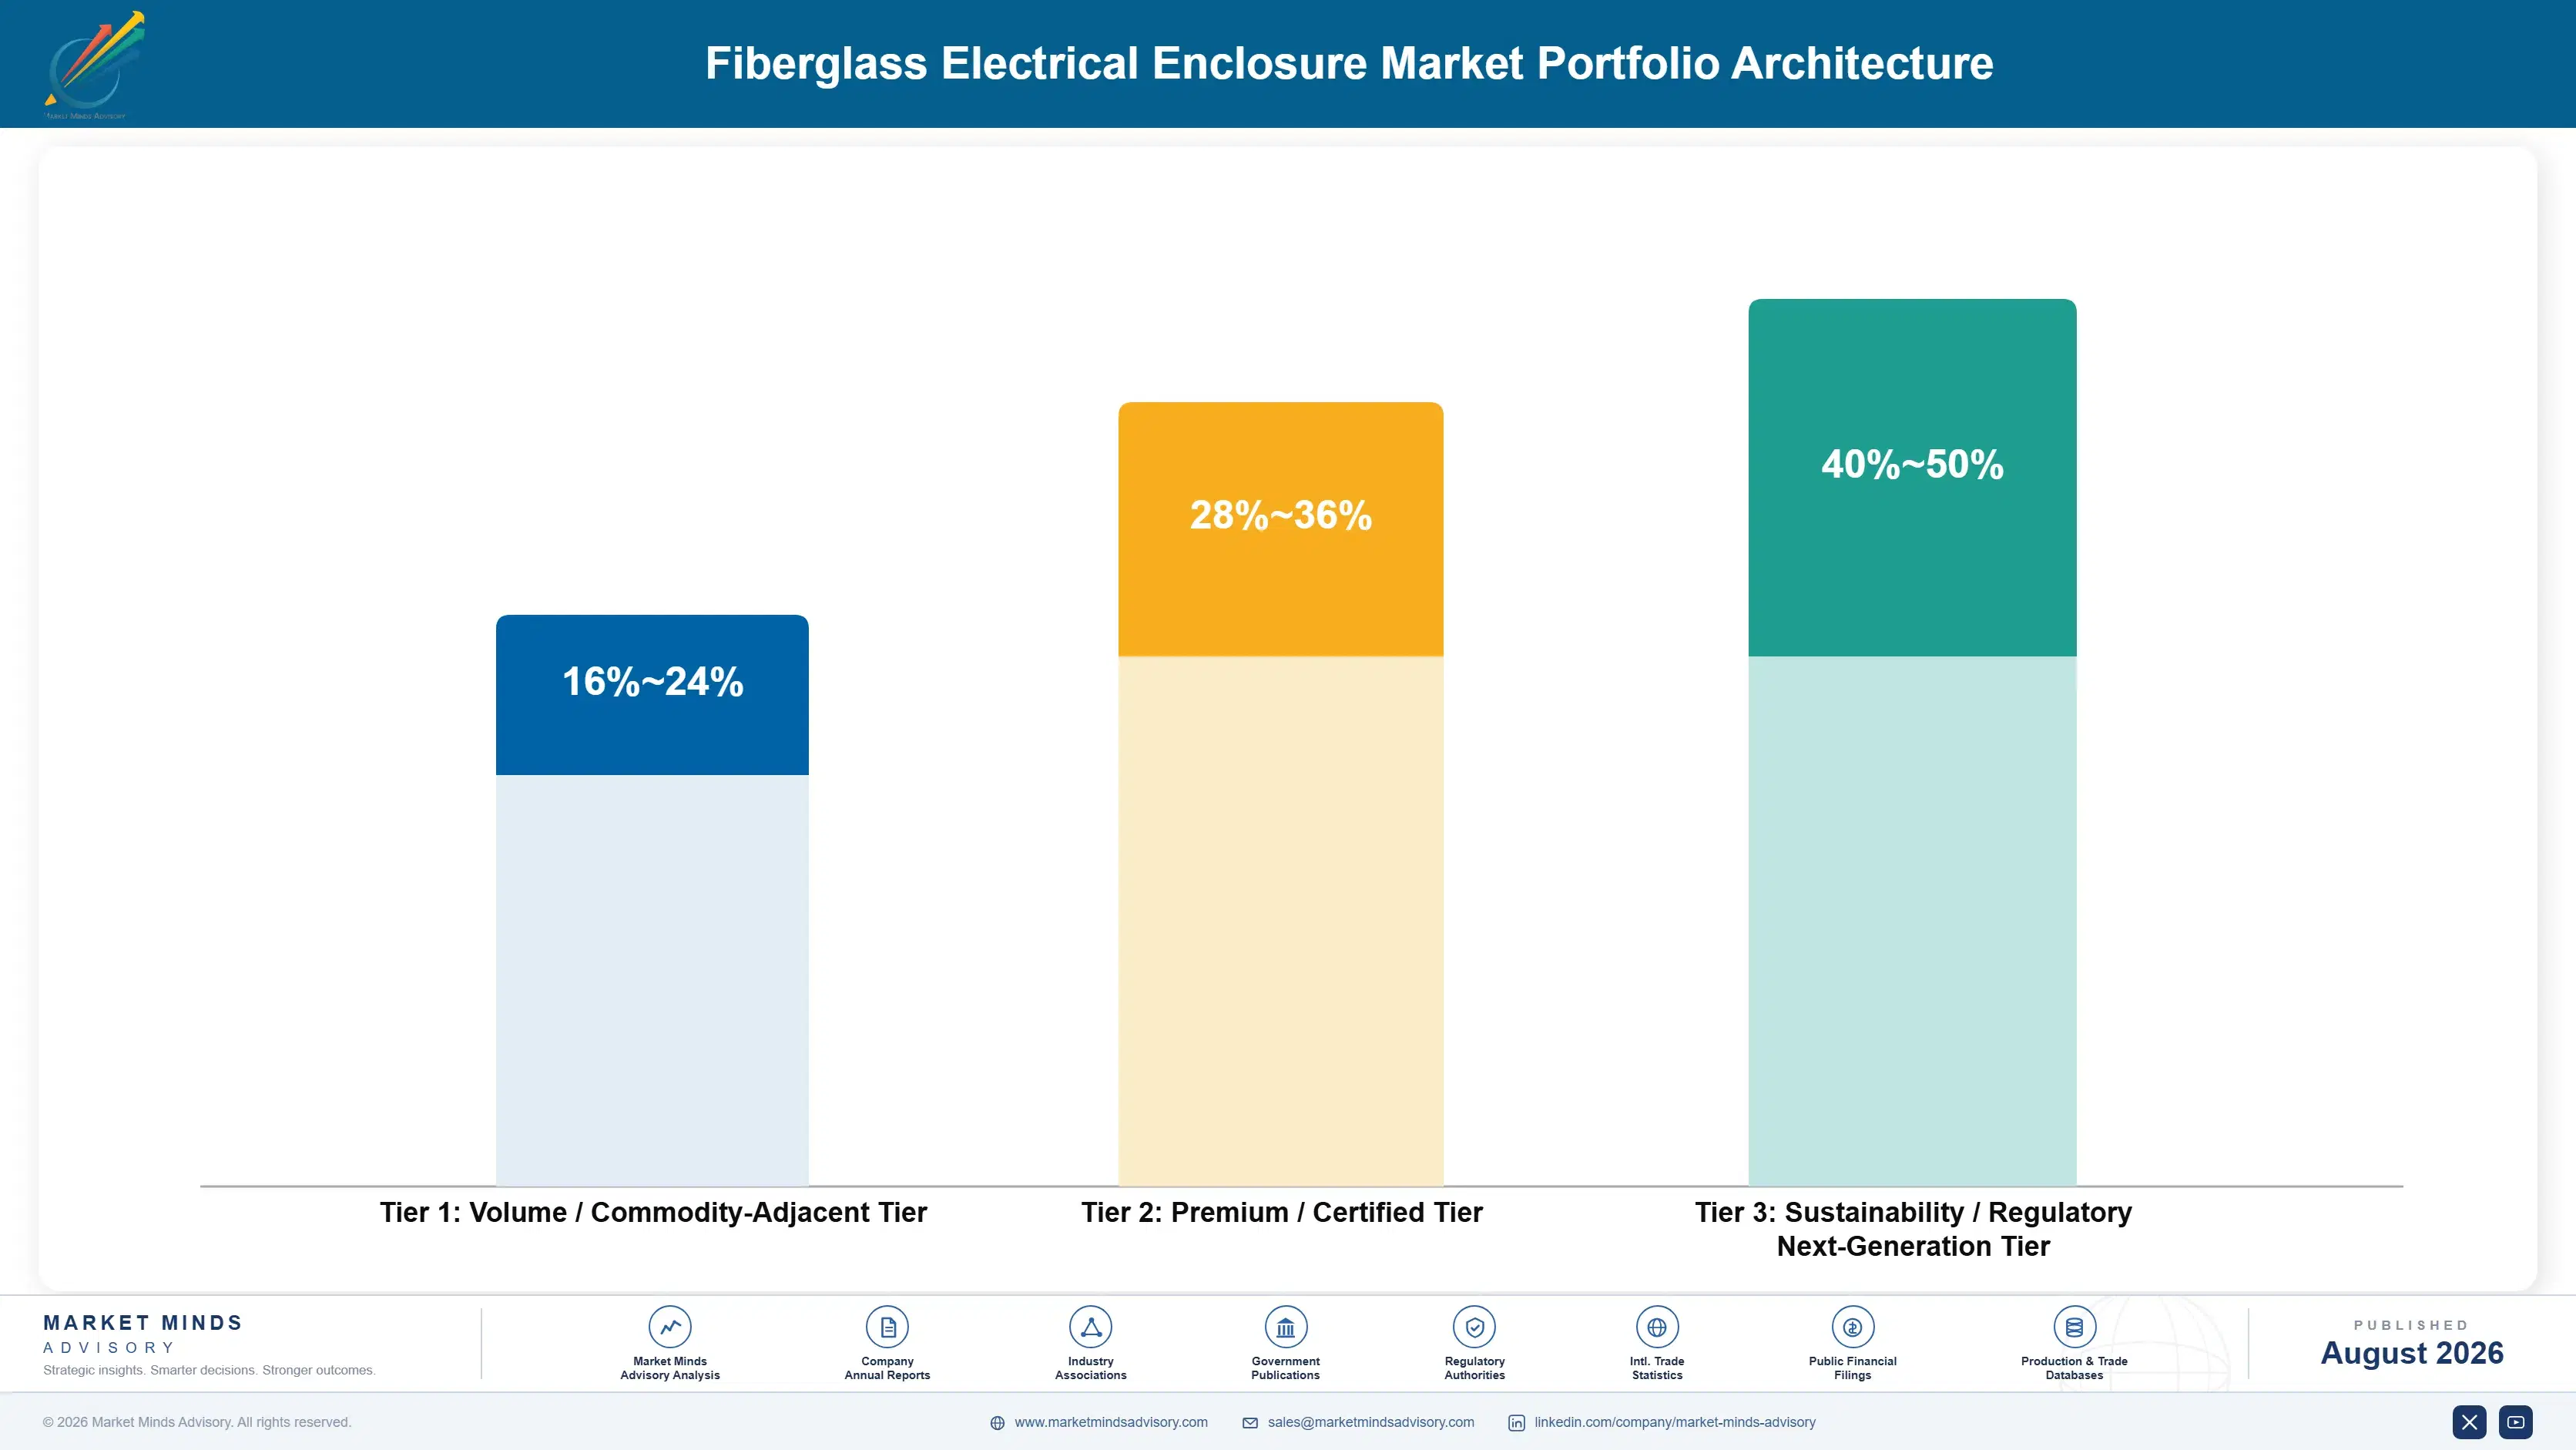
Margin architecture follows composition and furnace location rather than volume, and the difference between the ends of it is far wider than the tonnages suggest. Standard roving into wind blades and construction competes purely on cost against producers with cheaper energy and capital. Fabric and multiaxial conversion earns more on engineering content. Specialty and electronics compositions earn most, because customers cannot readily source them elsewhere.
The volume and premium tension is settled at rebuild rather than negotiated commercially. A producer rebuilding into commodity composition has chosen nine more years of competing on cost against Chinese furnaces. One converting to high-modulus or electronics grades accepts qualification delay and lower initial loading in exchange for pricing the capacity cycle does not reach. Almost nothing about that decision can be revisited afterwards.

High-value pools concentrate in low dielectric electronics yarn, high-modulus glass for long blades, and engineered fabric conversion close to customers. Each is defended by composition capability, qualification history, or design engagement rather than by melting cost, which is the one advantage Chinese producers hold absolutely and permanently. Melting cost is the one thing that cannot be bought back later.

Volume / Commodity-Adjacent Tier

Standard E-glass direct roving and chopped strand into wind blades, construction, and general composites. Interchangeable between qualified producers and tendered accordingly. Energy and capital cost decide outcomes before anybody quotes anything.
Gross Margin: 10%-19%

Premium / Certified Tier

Woven fabrics, multiaxial reinforcements, and engineered packages carrying conversion value and design engagement with the part maker. Less energy intensive than melting. The range reflects wide differences between commodity fabric and engineered structural reinforcement.
Gross Margin: 22%-36%

Sustainability / Regulatory / Next-Generation Tier

Low dielectric electronics substrate yarn, high-modulus blade glass, and boron-free corrosion-resistant compositions. Scarcity and qualification history support pricing. The range is wide because electronics allocation economics differ completely from specialty structural grades.
Gross Margin: 32%-50%
fiberglass-electrical-enclosure-market-portfolio-architecture-1787551296420

High-value Sub-segments and Strategic Watch-out

Low Dielectric Substrate Yarn

Growing at 9.4% with customers accepting allocation rather than negotiating price, which happens nowhere else in this market. Furnace conversion and weaving capacity both take years and no announced expansion closes the gap. Weaving capacity for the finest yarn counts is as scarce as the glass itself.
Gross Margin: 36%-50%

High-Modulus Blade Glass

Growing at 10.6% as offshore blade length passes what standard E-glass stiffness supports, which raises value per tonne even when installation volumes disappoint. Qualification with blade designers runs long and holds afterwards. Hybrid glass and carbon layups extend much the same argument without removing glass content.
Gross Margin: 30%-42%

Engineered Fabric Conversion

Carries design engagement and switching cost that raw roving surrendered, and consumes a fraction of the energy melting requires. European sites have kept commercial positions this way after furnace campaigns ended entirely. Design engagement arrives years before any production, which rewards entirely different capabilities from tendering.
Gross Margin: 24%-36%

Standard Roving Into Wind

The strategic watch-out. Blade makers take 23% of volume, tender aggressively, and switch between qualified producers freely because the product is genuinely interchangeable. Chinese furnace cost sets the price everywhere it reaches. A lost tender also removes volume for the length of a whole blade programme.
Gross Margin: 10%-19%

How Fibre Volume Gets Placed

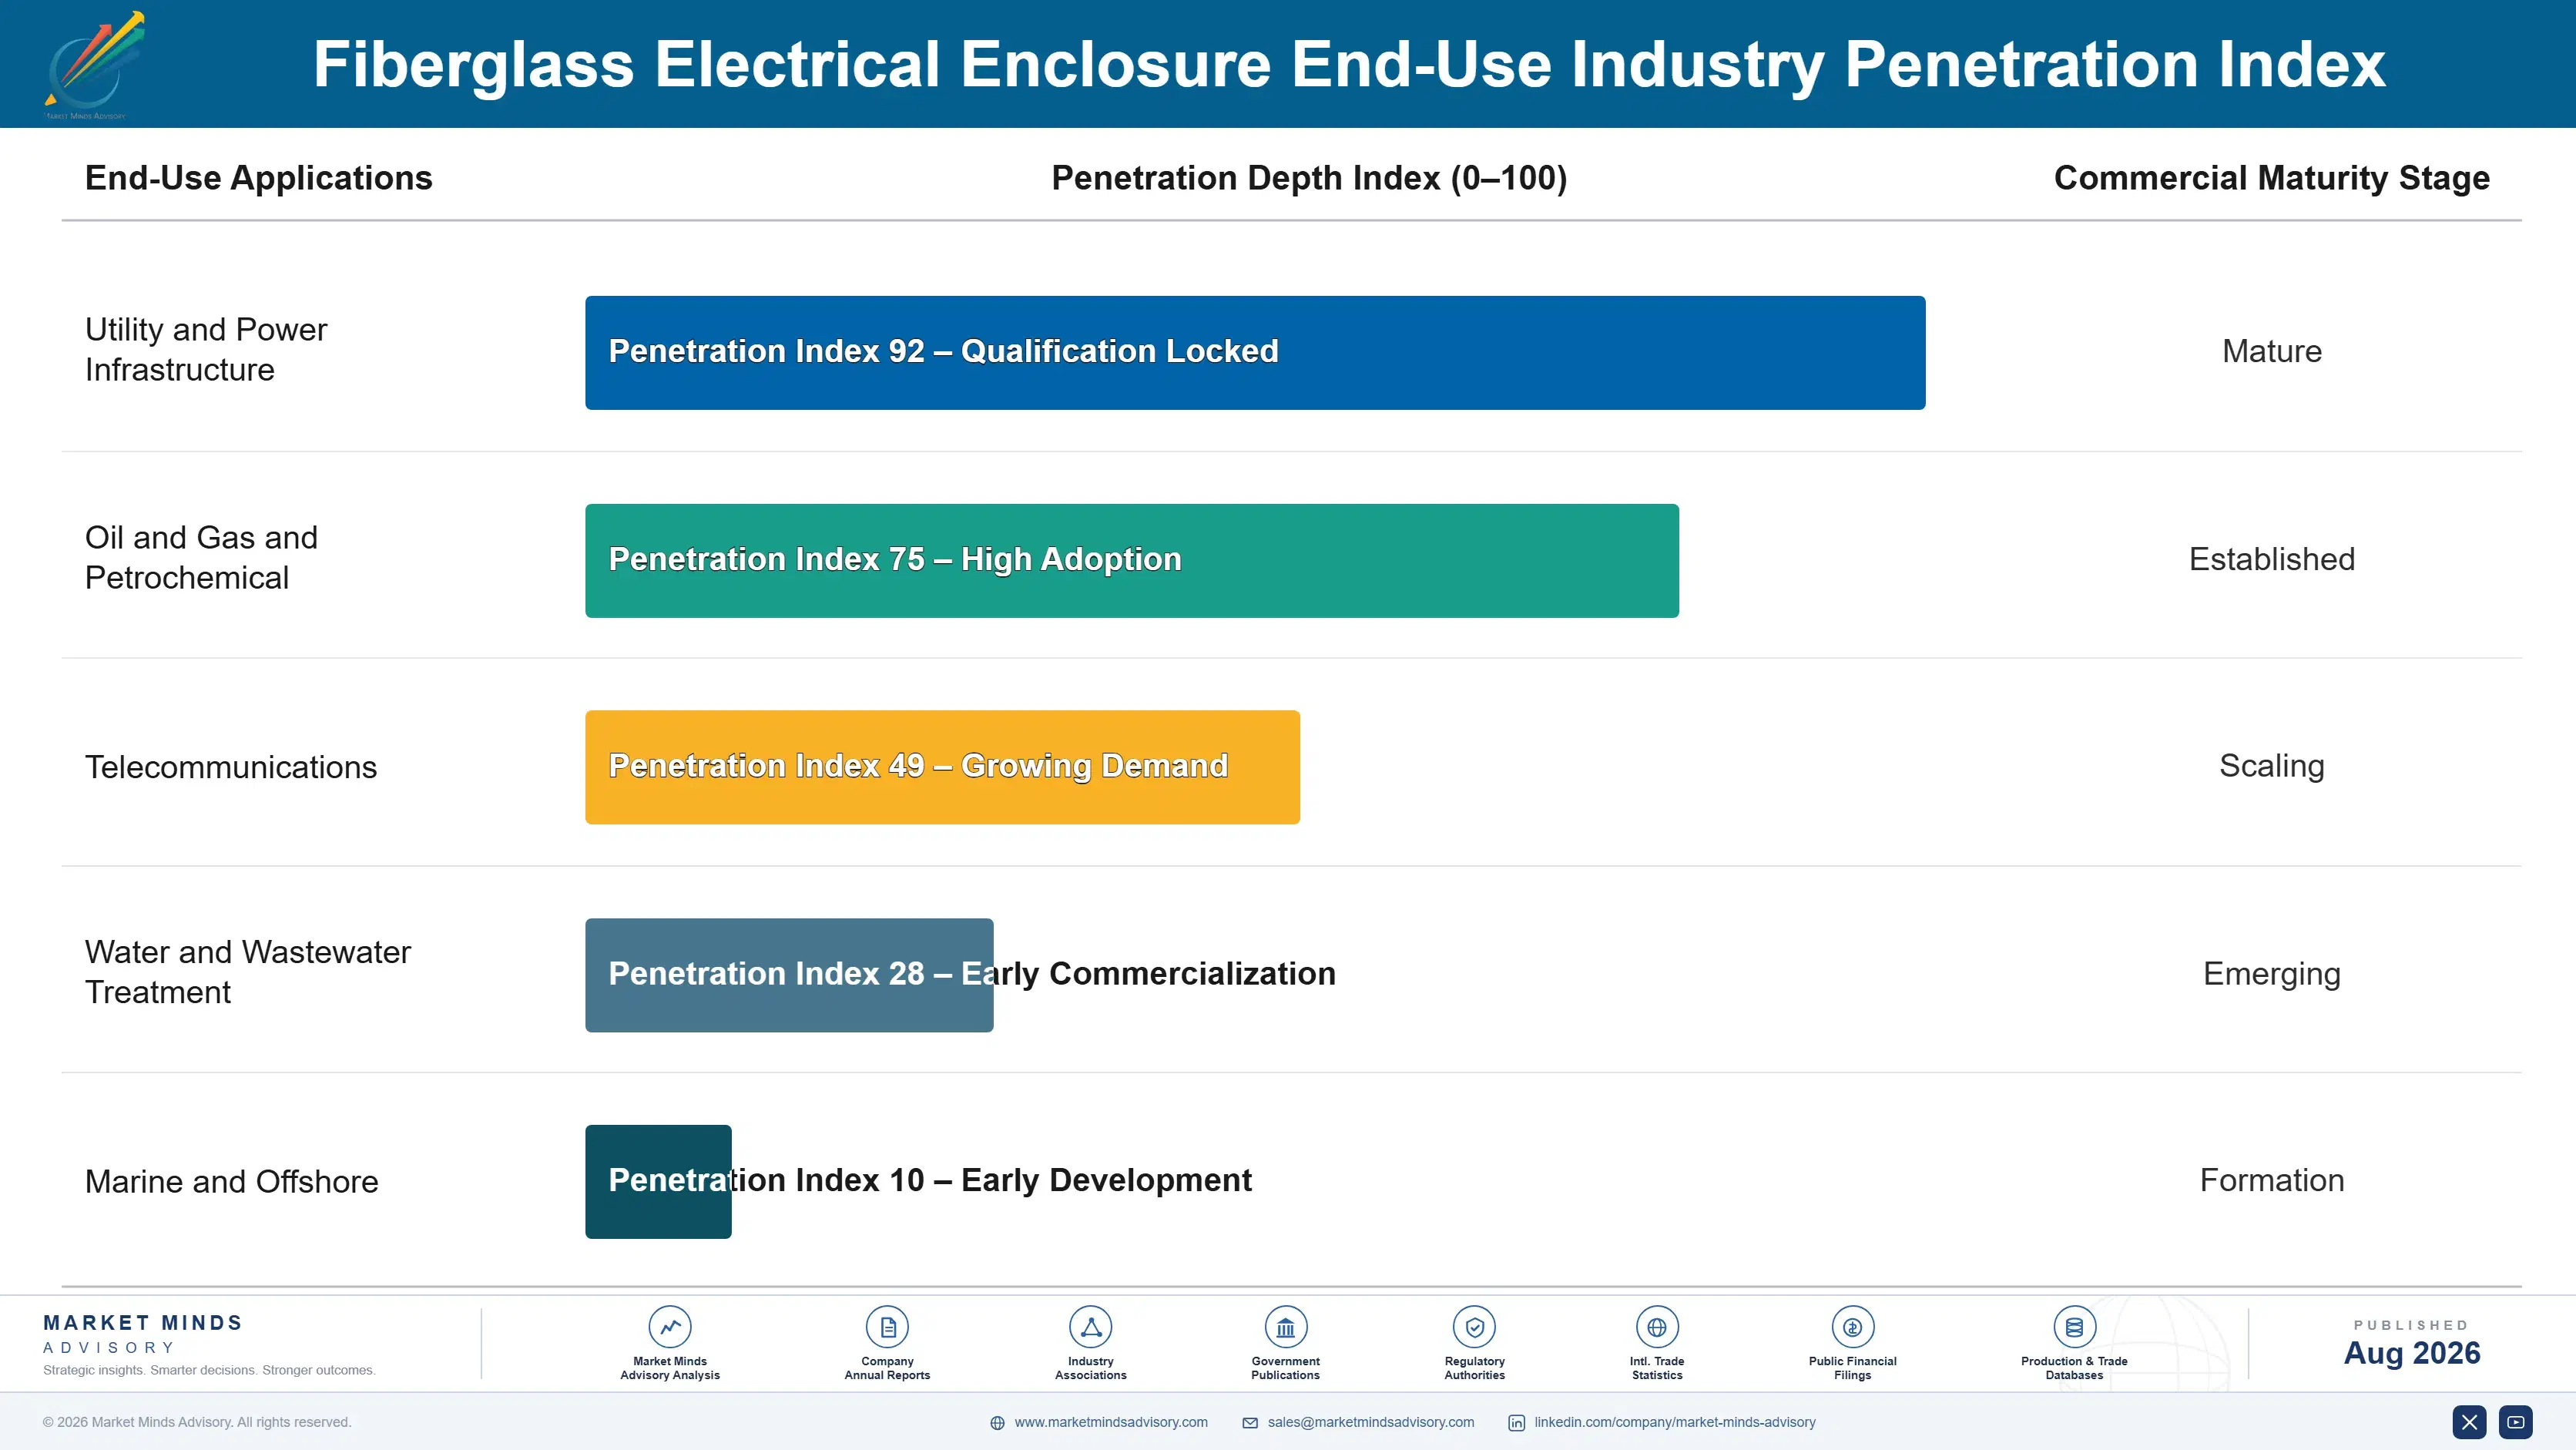
Demand reaches producers through three routes that behave nothing alike. Commodity roving goes out on annual or spot tenders to blade makers, pipe fabricators, and compounders who treat qualified suppliers as interchangeable and buy accordingly. Engineered fabric moves through design engagement with part manufacturers months or years before production. Electronics substrate yarn is allocated rather than sold, because qualified supply cannot meet demand and the laminator's alternative is not buying at all. Those three routes rarely sit inside the same commercial organisation.
Stickiness tracks qualification depth almost exactly. Electronics substrate holds through multi-year laminator and board maker approval. High-modulus blade glass holds through structural design validation. Engineered fabric holds through part tooling. Commodity roving holds until the next tender closes. Nothing about the fibre itself creates any of that stickiness.

The deciding buyer differs by route as well. Procurement runs commodity tenders on delivered cost per tonne. Composite design engineers specify fabric and specialty compositions during part development. Electronics substrate decisions sit with laminators managing an allocation they cannot influence, which is an unusual position for any buyer to occupy. Producers organised entirely around procurement relationships never see the design decisions that actually place the volume.
fiberglass-electrical-enclosure-market-end-use-penetration-index-1787551296914

Where the Decision Gets Made

These are among the four positions where our research anticipates prominent divergence between winners and laggards over the coming forecast period. Each is grounded in the demand model, the regulatory perimeter, and the announced capacity pipeline.
01 / REBUILD COMPOSITION CHOICE

The furnace rebuild is the whole strategy

A melting campaign runs around nine years and composition can only change when the furnace is rebuilt, which means one capital decision fixes what a producer competes on for most of a decade afterwards. High-modulus and specialty glass grows at 10.6% against a market rate of 6.2% and prices on scarcity rather than on where the capacity cycle happens to sit. Producers rebuilding into commodity roving because it is what they already melt have chosen another nine years inside the price war.
02 / ELECTRONICS SUBSTRATE ENTRY

Join the allocation queue before it closes

Low dielectric yarn for high-frequency server boards is the only segment here where customers accept allocation rather than pushing the price down, growing at 9.4% with no announced capacity resolving the shortage inside the whole forecast period. Furnace conversion and laminator qualification each take years, which is precisely why the position stays defensible once a producer actually holds it. Anyone waiting for a clearer demand signal will find the qualification queue already occupied by producers who committed capital considerably earlier.
03 / DOWNSTREAM CONVERSION DEPTH

Weave and stitch where melting cannot pay

Blade manufacturers take 23% of reinforcement volume and tender commodity roving hard precisely because qualified producers are genuinely interchangeable at standard specification. Fabric weaving and multiaxial stitching carry design engagement and part tooling commitment that raw fibre supply never generates at all, and they consume a small fraction of the energy that melting at 27% of production cost requires. European sites kept their commercial positions this way after furnace campaigns ended without any rebuild capital ever being committed to them.
04 / ENERGY SITE SELECTION

Put new furnaces where power is cheap

Energy consumes roughly 27% of production cost and a furnace burns it continuously across nine full years, which makes the power contract the largest single variable in any melting investment decision taken anywhere. Chinese producers building furnaces in Egypt understood this exactly, and European campaigns have ended without rebuild for the same reason working in exactly reverse. Anti-dumping duties do not alter the arithmetic at all, since capacity simply relocates inside the tariff wall rather than disappearing from the market entirely.

Engagement Snapshot From the Field

A live engagement with an industry participant carrying material or product regulatory and market exposure ahead of a defining policy shift, showing how our research translates into a defensible multi-year portfolio strategy.
MARKET MINDS ADVISORY · CLIENT ENGAGEMENT SUMMARY
Fiberglass Producer Strategic Portfolio Review and Transition Roadmap 2026·Investment Scenario on Fiberglass Exposure Evaluation 2025-26
CLIENT PROFILE
A Western European glass fibre producer with revenue near EUR 420 million (client-reported, unverified by MMA), operating two melting furnaces supplying standard roving and chopped strand into wind, construction, and automotive composite markets. Both campaigns were approaching end of life, no specialty compositions were produced, and energy costs had eroded margin for four consecutive years.
STRATEGIC CHALLENGE
Rebuild capital on both furnaces would commit the business to another nine years of competing on cost against Egyptian and Chinese supply at a fraction of European energy prices. Wind blade customers were tendering annually and switching freely. No electronics or high-modulus qualification existed anywhere in the portfolio. Both campaigns would expire within eighteen months.
MMA APPROACH
MMA modelled rebuild economics under alternative compositions against a conversion-only scenario using imported fibre, assessed qualification timelines for high-modulus and electronics grades, and compared regional energy contracts across candidate greenfield sites. Forty-seven expert interviews with blade designers, laminators, and composite part makers established what qualification actually requires and how long it takes.
KEY FINDINGS
  1. Rebuilding either furnace on standard composition returned less over a full campaign than importing fibre and running conversion alone, once European energy costs were projected honestly.
  2. High-modulus qualification with two blade designers was achievable inside three years, and both had explicitly asked for a European source rather than depending on Asian supply.
  3. Electronics substrate entry was not realistic within the client's capital or timeline, since yarn qualification and weaving capability would both need building from nothing at all.
  4. Downstream multiaxial conversion at the existing sites was earning materially better margin than the melting operation feeding it, and had never been analysed as a business in its own right.
CLIENT PROFILE
A Western European glass fibre producer with revenue near EUR 420 million (client-reported, unverified by MMA), operating two melting furnaces supplying standard roving and chopped strand into wind, construction, and automotive composite markets. Both campaigns were approaching end of life, no specialty compositions were produced, and energy costs had eroded margin for four consecutive years.
STRATEGIC CHALLENGE
Rebuild capital on both furnaces would commit the business to another nine years of competing on cost against Egyptian and Chinese supply at a fraction of European energy prices. Wind blade customers were tendering annually and switching freely. No electronics or high-modulus qualification existed anywhere in the portfolio. Both campaigns would expire within eighteen months.
MMA APPROACH
MMA modelled rebuild economics under alternative compositions against a conversion-only scenario using imported fibre, assessed qualification timelines for high-modulus and electronics grades, and compared regional energy contracts across candidate greenfield sites. Forty-seven expert interviews with blade designers, laminators, and composite part makers established what qualification actually requires and how long it takes.
KEY FINDINGS
  1. Rebuilding either furnace on standard composition returned less over a full campaign than importing fibre and running conversion alone, once European energy costs were projected honestly.
  2. High-modulus qualification with two blade designers was achievable inside three years, and both had explicitly asked for a European source rather than depending on Asian supply.
  3. Electronics substrate entry was not realistic within the client's capital or timeline, since yarn qualification and weaving capability would both need building from nothing at all.
  4. Downstream multiaxial conversion at the existing sites was earning materially better margin than the melting operation feeding it, and had never been analysed as a business in its own right.
RECOMMENDED STRATEGY
Phase 1: Phase one: rebuild the larger furnace on high-modulus composition against blade designer commitments, and let the second campaign expire without any rebuild capital. Phase 2: Phase two: expand multiaxial and fabric conversion capacity at both sites, sourcing standard fibre externally where melting economics no longer justify the capital. Phase 3: Phase three: deepen design engagement with composite part makers across Europe, converting fabrication capability into specified programme positions rather than annually tendered supply.
OUTCOME
The client committed rebuild capital on one furnace with high-modulus composition and secured letters of intent from two blade designers. The second campaign expired as planned, conversion capacity expanded, and blended gross margin improved 6.8 percentage points (client-reported, unverified by MMA). The second site now converts imported fibre exclusively.

Frequently Asked Questions

Foundational context covering the market sizes, CAGR, scope, country, region and competition that inform every finding below. This section is provided to cover basics and most often pre-purchase conversations, answered from the MMA Primary Research Dataset.

What is the current size of the Fiberglass Market?

The market was valued at USD 14.6 billion in 2025, rising to an estimated USD 15.51 billion in 2026. East Asia holds the largest regional share at 32% of value.

How large will the Fiberglass Market be by 2036?

MMA forecasts USD 28.3 billion by 2036 under the base case, an expansion multiple of 1.82 times the 2026 value. That represents USD 12.79 billion of incremental value.

What is the CAGR for the Fiberglass Market 2026 to 2036?

The base case CAGR is 6.2%, with a bull case of 7.4% and a bear case of 5.0%. The spread reflects uncertainty over Chinese capacity additions and wind installation timing.

Which segment is growing fastest?

High-modulus and specialty glass grows fastest at 10.6%, roughly 1.71 times the market rate. Electronics substrate yarn follows at 9.4% under genuine supply constraint that no announced capacity resolves.

Who are the major companies in the Fiberglass Market?

China Jushi, Owens Corning, Chongqing Polycomp International, Taishan Fiberglass, and Nippon Electric Glass lead, holding roughly 62% between them. Furnace capital rather than technology sustains that concentration.

Which country is growing fastest?

India grows fastest at 9.2%, driven by domestic melting capacity expansion under production-linked incentives and by composite demand across wind, infrastructure, and automotive applications simultaneously.

Report Segmentation Architecture

The full report scope spans multiple orthogonal segmentation dimensions, with cross-tabulated demand data provided for each dimension pair. Coverage extends further to regional breakdowns, trend trajectories, and the competitive detail needed to support segment-level decision-making.

By Fibre Product Form

  • Direct and Assembled Roving
  • Chopped Strands
  • Chopped Strand and Continuous Filament Mat
  • Woven Fabrics and Multiaxial Reinforcements
  • Glass Fibre Yarn for Electronics Substrate
  • High-Modulus and Specialty Glass

By End-Use Industry

  • Wind Turbine Blade Manufacture
  • Automotive and Transportation Composites
  • Construction and Infrastructure
  • Pipe, Tank and Corrosion Service
  • Electronics and Circuit Board Substrate
  • Marine and Industrial Equipment

By Sales Model

  • Annual Tender Supply Contracts
  • Design-Specified Programme Supply
  • Allocated Substrate Yarn Supply
  • Distributor and Converter Channels
  • Spot and Trader Sales

By Region

  • North America
  • Western Europe
  • East Asia
  • South Asia and Pacific
  • Latin America
  • Middle East and Africa
  • Eastern Europe

Scope, Methodology, and Coverage

Every figure in this report is reproducible from documented input assumptions. The scope below maps the historical period, the forecast horizon, the segmentation dimensions, and the countries covered, alongside the underlying primary and qualitative methodology.
Historical Period
2020 to 2025
Forecast Period
2026 to 2036
Base Year
2025 (USD billions; MMA Primary Research Dataset, August 2026)
Market Definition
The market comprises glass fibre reinforcement products supplied to composite and electronics manufacturers, covering direct and assembled roving, chopped strands, chopped strand and continuous filament mat, woven fabrics and multiaxial reinforcements, glass fibre yarn for electronics substrate, and high-modulus or specialty glass compositions. Value is measured at fibre producer level across tendered, specified, and allocated supply. Glass wool building insulation, carbon and aramid fibre, resin systems and sizing chemistry sold separately, finished composite parts, printed circuit board laminate, and downstream moulding operations fall outside scope.
Quantitative Units
USD billions (current prices); million tonnes of fibre produced annually; USD per tonne by product form and glass composition
Segmentation Dimensions
By Fibre Product Form; By End-Use Industry; By Sales Model; By Region
Regions Covered
North America, Western Europe, East Asia, South Asia and Pacific, Latin America, Middle East and Africa, Eastern Europe
Countries Covered
China, Japan, South Korea, Taiwan, India, Indonesia, Vietnam, Thailand, Australia, United States, Canada, Mexico, Germany, France, Italy, Spain, Netherlands, Belgium, United Kingdom, Denmark, Poland, Czechia, Romania, Latvia, Brazil, Chile, Argentina, Egypt, Saudi Arabia, Turkey
Key Companies Profiled
China Jushi, Owens Corning, Chongqing Polycomp International, Taishan Fiberglass, Nippon Electric Glass, Johns Manville, 3B Fibreglass, AGY Holding, Nittobo, PFG Fiber Glass, Sichuan Weibo, Jiangsu Changhai Composite, KCC Corporation, Taiwan Glass, Sisecam, Valmiera Glass, Goa Glass Fibre, Saertex, Chomarat, Hexcel
Quantitative Methodology
Primary survey, n=3,800 respondents, Q4 2025, six countries; demand-side model with trade association cross-validation
Qualitative Methodology
47 expert interviews, Q4 2025; applied to validate demand model assumptions, identify emerging dynamics, and assess competitive positioning
Report Format
PDF and XLSX data workbook (Word format preview document)
Publisher
Market Minds Advisory
Report Code
MMA-2026-CHM-321
Published
August 2026
Contact
sales@marketmindsadvisory.com | www.marketmindsadvisory.com

Purchase the full Fiberglass Market Report (2026 to 2036).

The full report sizes glass fibre reinforcement demand across six product forms, six end-use industries, and seven regions with 2026 to 2036 forecasts under base, bull, and bear cases. It separates commodity compositions competing on furnace cost from specialty and electronics grades that price on scarcity, since the two behave completely differently through the capacity cycle. Competitive profiles cover twenty producers assessed consistently on reinforcement revenue, composition capability, and furnace cost position. Cost analysis traces energy, batch mineral, and rebuild capital exposure by region. Commercial guidance addresses rebuild composition choice, electronics entry, conversion depth, and energy site selection.
Six product forms sized separately by region
Commodity compositions separated from specialty and electronics grades
Furnace campaign timing mapped across major producing regions
Electronics substrate allocation dynamics assessed against announced capacity
Energy cost position modelled by melting location
Anti-dumping duty effects traced through capacity relocation

Built For The People Who Decide

From boardroom strategy to bench-side execution, this report is read cover-to-cover by leaders shaping the next decade of their industry, turning demand scenarios, market dynamics and valuation benchmarks into decisions.
CXOs/ Presidents/ VPs/ Managers
M&A and Corporate Development
Strategy Teams and R&D Heads
Procurement and Product Directors
Regulatory and Compliance Leaders
Investor Relations and Equity Analysts