Market Minds Advisory
Fiber Optic Development Tools Market

Fiber Optic Development Tools Market: Fiber Optic Development Tools Market. Coherent Testing and FTTH Rollout Reset Field Instrument Demand

Coherent 800G data center testing and fiber-to-the-home mass rollout are pushing fiber optic development tools well past legacy single-function instruments across telecom, hyperscale, and enterprise networks everywhere worldwide right now

Lead Analyst

Published

September 2026

Make Smarter Decisions with Customized Research Insights

Request a free sample report and evaluate market opportunities, growth trends, and competitive dynamics relevant to your business needs.

2025 MARKET VALUE$1.9BMarket Size 2025
2036 FORECAST VALUE$4.4BBase Case , 2026 to 2036
CAGR 2026 TO 20368.2 %Bull 9.5% / Bear 6.9%
INCREMENTAL OPPORTUNITY$2.4BNet 10- year value creation
EXPANSION MULTIPLE2.20x2036 value over 2026 base
Strategic Levers
M&A Pipeline
Regional Outlook
Country Rankings
Competitive Intelligence
Segmental Deep-dive
Call-Us : 91 93563 13602

Executive Snapshot and Market Trajectory.

Coherent optical testing is reshaping the fiber optic development tools market right now, as hyperscale data center operators upgrade interconnect speeds toward 800G and beyond, demanding test instruments far more capable than legacy single-wavelength equipment could ever support across most facilities, network types, and vendor roadmaps today.
Fiber-to-the-home mass rollout is pulling demand toward handheld, field-portable splicing and certification tools, since telecom operators and government-funded broadband programs are deploying fiber to millions of new premises simultaneously across most major economies today, a shift concentrated most heavily across East Asian and South Asian markets with the deepest broadband infrastructure investment already committed and further expansion planned across coming procurement cycles and rollout phases still well ahead of most operators.
Competitive character is splitting between test equipment incumbents defending legacy single-function instrument franchises and newer entrants building cloud-connected, AI-assisted diagnostic platforms for both hyperscale and field technician customers at meaningful scale. Calibration standards and technician training requirements are increasingly determining which vendors win procurement contracts across network operators launching infrastructure upgrade programs over the coming several years and beyond, favoring vendors with genuine field support depth. today.
Market Definition
The Fiber Optic Development Tools Market covers test, measurement, and development equipment used to design, install, and maintain fiber optic networks, including reflectometers, spectrum analyzers, splicing tools, and fiber characterization instruments. It excludes fiber optic cable and transceiver products themselves, and downstream network management software not tied to physical layer testing.
Base Year Value
$1.9B in 2025 (MMA Primary Research Dataset, September 2026)
Forecast Period
2026 to 2036, eleven discrete annual values
CAGR
8.2% base case. Bull 9.5%. Bear 6.9%.
Fastest Growth Segment
Optical Spectrum and Signal Analyzers: 13.6% CAGR
Fastest Growth Country
India: 11.8% CAGR
Fastest Growth Region
South Asia and Pacific: 10.2% CAGR
Largest Region
East Asia: 29% of 2025 global value
Market Leaders
Viavi Solutions, EXFO, Keysight Technologies, Fluke, and Fujikura lead the competitive landscape.
Primary Survey
n=3,800 procurement and R&D decision-makers, Q4 2025, six countries
Methodology
Demand-side build-up, cross-validated against public data, 47 expert interviews

Fiber Optic Development Tools Market Forecast Scenarios

fiber-optic-development-tools-market-size-forecast-scenario-1790009698811
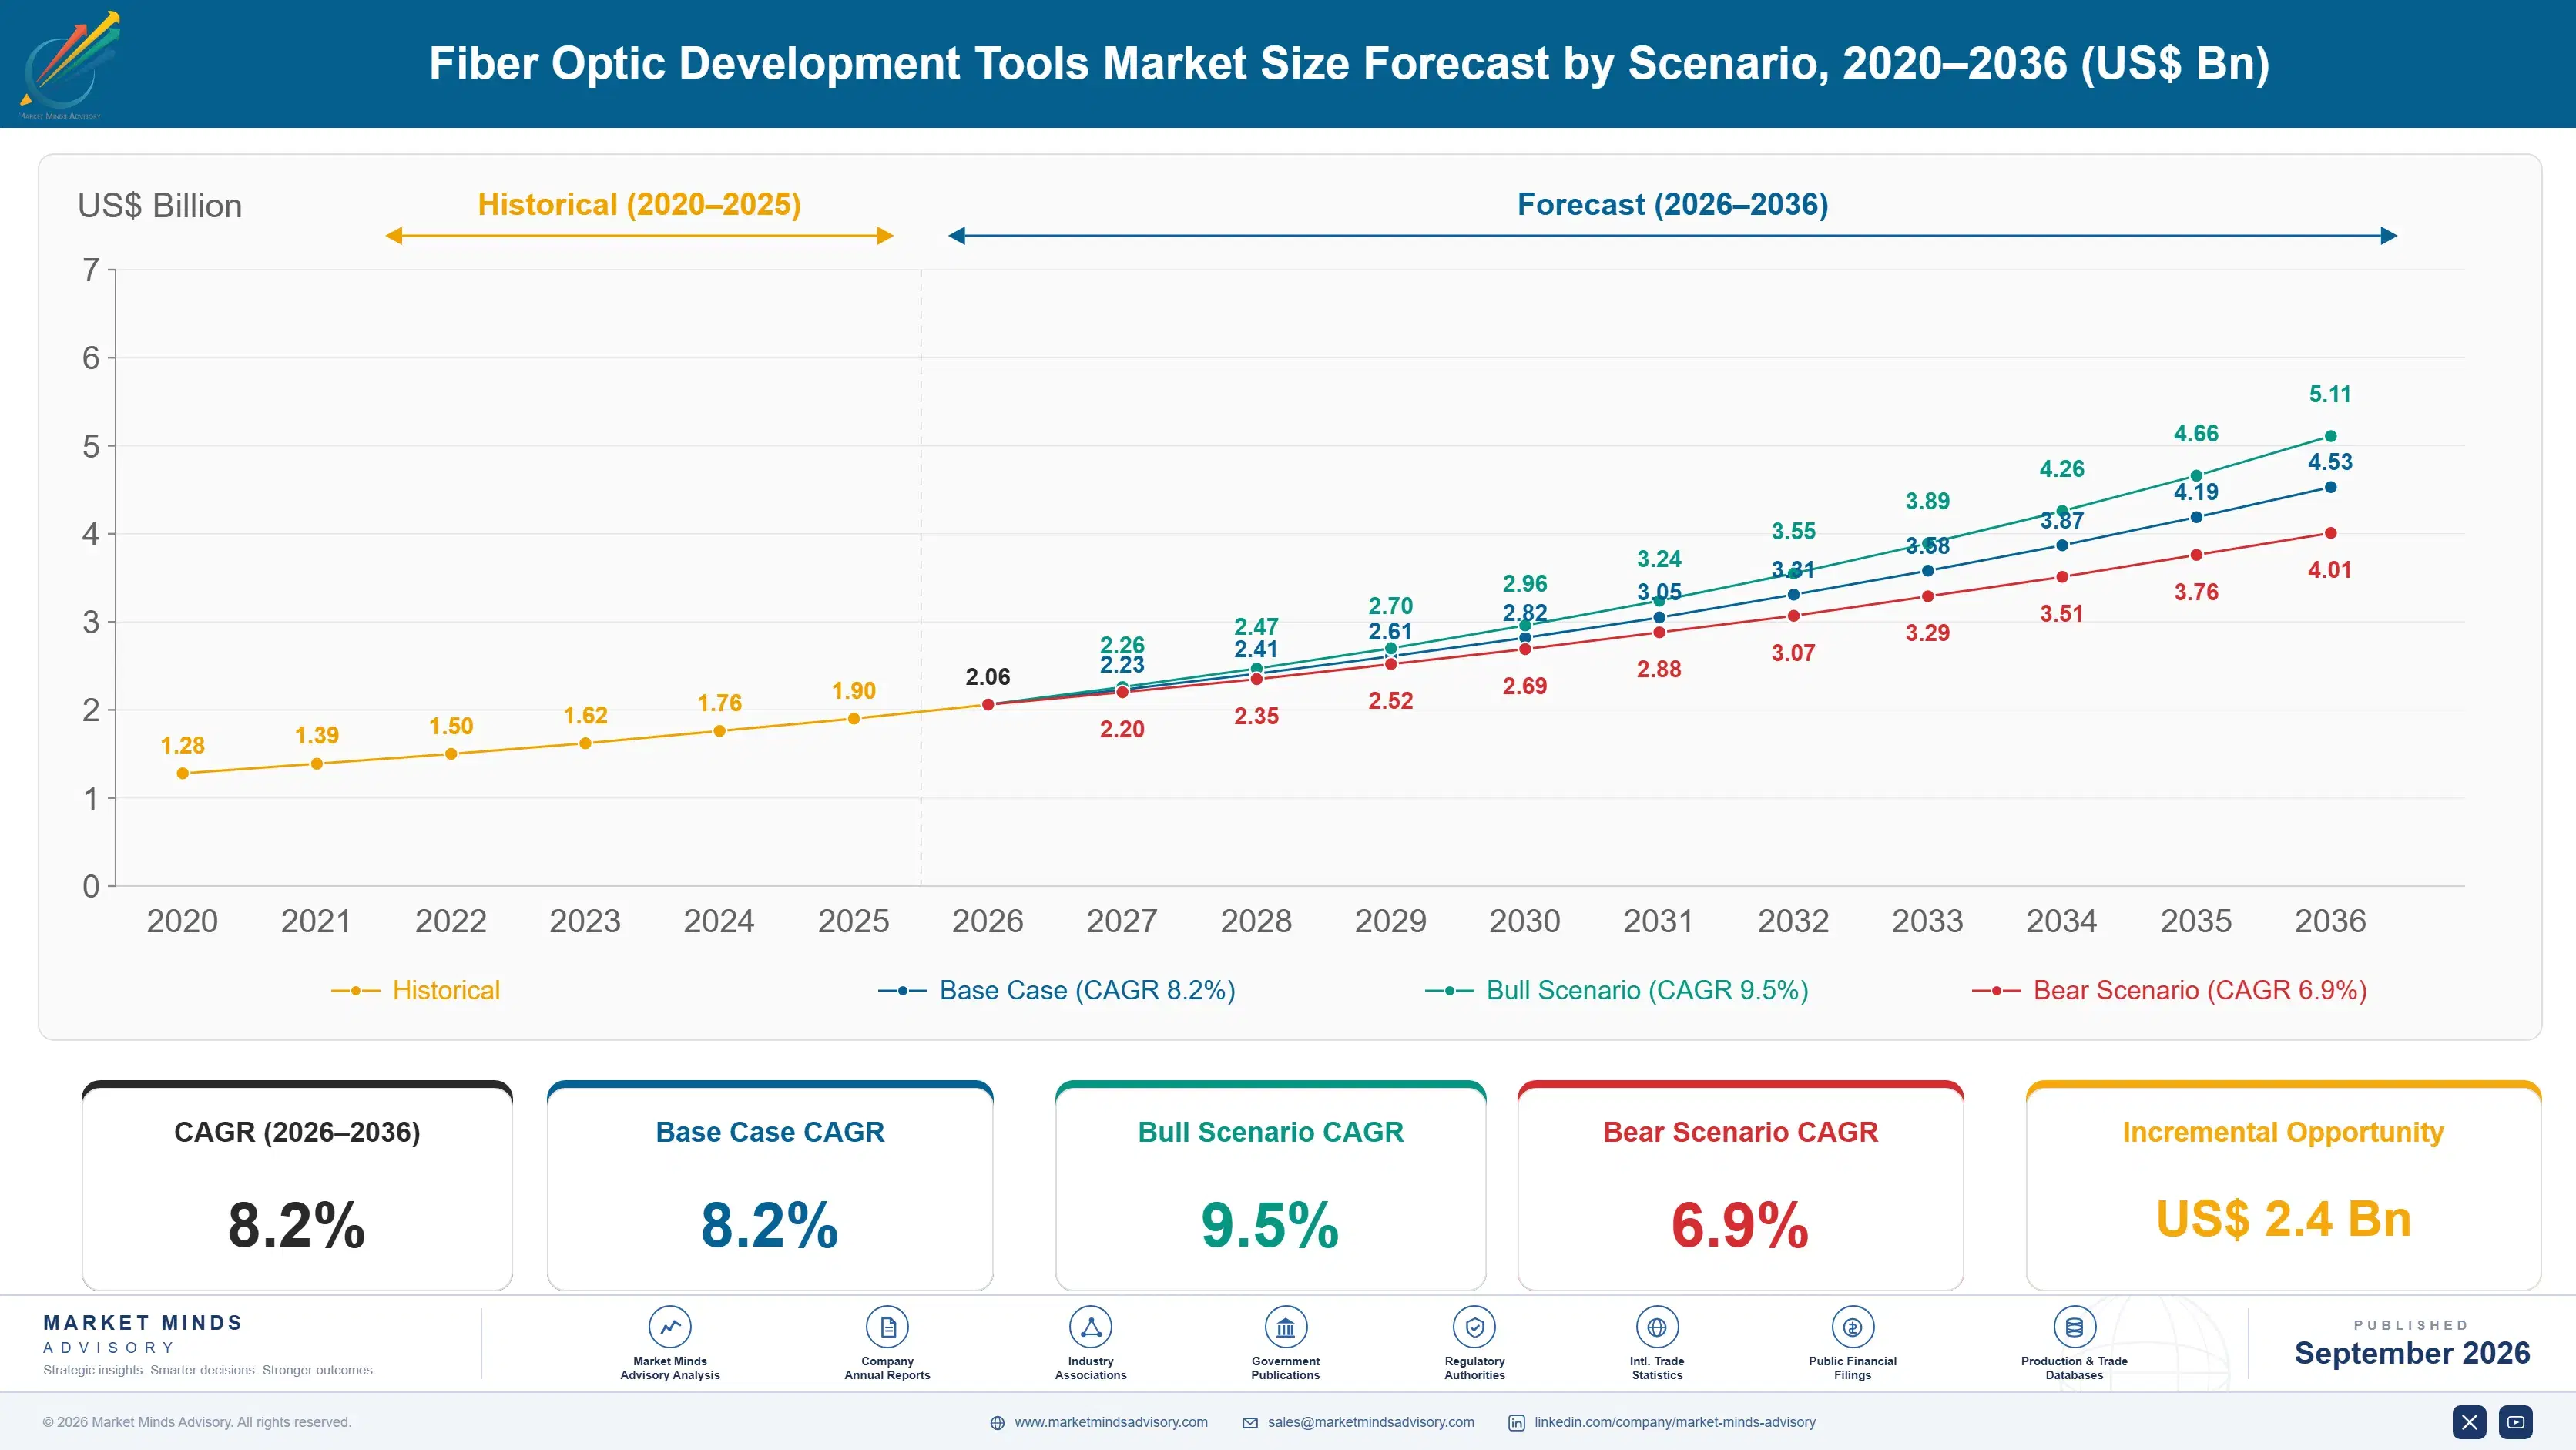
The 2020 to 2025 period grew a steady 7.4 percent annually as fiber deployment resumed following pandemic-era supply disruption, with telecom operators prioritizing broadband expansion budgets over discretionary network upgrades across most major markets worldwide during that stretch, cushioning broader demand volatility as government subsidy programs took effect and accelerated rollout timelines across most regions and operator segments.
The base case rests on three named commercial mechanisms: coherent test equipment reaching mainstream price points as hyperscale interconnect speeds climb rapidly, fiber-to-the-home rollout expanding field technician tool demand meaningfully across emerging broadband markets worldwide, and cloud-connected diagnostic platforms standardizing on continuous network monitoring data. Together these push compounded annual growth to 8.2 percent through 2036, with instrument vendors capturing rising design-in share across every major network operator tracked in this report.
The bull case hinges on faster-than-expected hyperscale data center interconnect upgrades across major cloud providers, pushing growth toward 9.5 percent as operators compete on network throughput and reliability. The bear case reflects prolonged broadband subsidy funding delays that slow fiber rollout and depress growth to roughly 6.9 percent, favoring incumbent vendors with existing installed base relationships.

Coherent Testing Resets Instrument Economics

Fiber optic development tool demand is splitting between legacy single-wavelength instrument replacement and new coherent, multi-wavelength testing platforms built for hyperscale interconnect speeds across nearly every network operator segment tracked. Single-wavelength replacement remains steady across smaller telecom operators that have not yet upgraded network infrastructure, while coherent testing platforms are expanding meaningfully faster as hyperscale operators complete data center interconnect upgrades and retire legacy single-function instruments.
MARKET CONCENTRATIONCR5 42%Top five vendors hold a substantial combined market share currently
AVERAGE SELLING PRICE$8,600Blended price per fiber test instrument unit shipped globally
TOP PRODUCING COUNTRY SHAREJapan 24%Share of global unit production concentrated in one country
CAPACITY UTILIZATION72%Average manufacturing capacity utilization across leading instrument producers
TRADE INTENSITY61%Share of production volume crossing international borders each year
OPTICAL COMPONENT COST SHARE29% of COGSOptical component cost share of total production cost overall
Pricing power is shifting toward vendors who support cloud-connected diagnostic data management, since network operators increasingly value centralized fault tracking that reduces field technician dispatch time across large installed networks at scale. That connectivity premium is compressing margins for vendors still selling standalone instruments lacking any cloud data integration capability, a shrinking category as connected diagnostics adoption keeps accelerating across nearly every operator segment.
Optical component lead times occasionally tighten during broader telecom demand spikes, particularly for specialized laser sources and detectors used in coherent testing instruments and diagnostic platforms alike. Vendors with diversified component sourcing relationships are proving meaningfully more resilient through these periodic supply constraints than smaller competitors dependent on single-source component procurement and spot-market purchasing. That resilience gap keeps widening as procurement cycles compress.
"A reflectometer that just measures loss is table stakes now. Operators want the instrument that tells them exactly which splice to fix before a customer ever notices."
Senior Analyst, Optical Networking and Test Instrumentation Practice · MMA Technology Practice · September 2026

Market Trends

Coherent Testing Shifts Toward 800G Data Center Interconnects

Hyperscale operators upgrading data center interconnect speeds toward 800G and beyond require coherent optical test instruments capable of characterizing signal quality across multiple wavelengths simultaneously, a capability legacy single-wavelength equipment cannot provide. Major cloud providers in North America and East Asia have adopted coherent testing as the default requirement for new interconnect deployments, and mid-tier data center operators are following as instrument cost declines with production scale. This shift is reshaping which vendors win design slots, favoring companies with proven coherent signal analysis depth over those still defending legacy single-wavelength instrument franchises built over previous decades.
Market Impact: Adds 2.1 billion in interconnect demand
Fiber-To-The-Home Rollout Drives Portable Tool Demand

Government-funded broadband subsidy programs and telecom operator fiber-to-the-home initiatives are driving substantial and sustained demand for handheld, field-portable splicing and certification tools capable of rapid deployment across residential fiber installations nationwide and abroad. This convergence is pulling instrument design toward lightweight, battery-powered hardware rather than benchtop equipment that field technicians cannot easily transport to installation sites. Telecom operators increasingly specify portable, ruggedized tooling as a baseline requirement for field technician crews, accelerating vendor investment in compact instrument architectures across every major broadband rollout program and technician workforce tracked in this report.
Market Impact: Cuts technician training time 25 percent

Market Opportunities and Growth Drivers

Hyperscale Interconnect Buildout Demands Higher-Speed Test Equipment

Rapidly expanding hyperscale data center interconnect capacity is driving substantial demand for coherent test equipment capable of validating signal integrity at 800G and higher transmission speeds across dense fiber networks. Cloud providers are investing heavily in new interconnect infrastructure to support AI workload growth, and every new interconnect deployment requires test equipment validation before entering production service. This shift is turning data center buildout into a direct multiplier for instrument demand, since higher transmission speeds require substantially more sophisticated and expensive test equipment than the legacy infrastructure it replaces across most facility types.
Market Impact: Adds 4 to 8 weeks

Government Broadband Subsidies Accelerate Fiber-To-The-Home Deployment

Government broadband subsidy programs across multiple countries are funding fiber-to-the-home deployment at a pace that consistently outstrips available field technician capacity nationwide, driving sustained demand for splicing and certification tools that let technicians work faster and more efficiently across every installation type. National broadband targets have accelerated deployment timelines in several major markets over the past three years, giving instrument vendors visibility into a growing pipeline of subsidized procurement extending well into the next decade. This mandate-driven demand is proving more resilient to economic cycles than discretionary telecom capital spending.
Market Impact: Adds 20 to 30 percent

Market Restraints and Challenges

Skilled Technician Shortage Constrains Deployment Pace

Fiber optic installation and testing requires specialized technician training that many telecom operators and contractors struggle to source at the pace their fiber-to-the-home rollout targets require, particularly in regions experiencing simultaneous large-scale deployment programs. The root cause is a broader skilled trades workforce shortage that predates fiber-specific training needs, leaving the industry competing for technicians against other infrastructure sectors facing similar labor constraints. Some vendors are mitigating exposure by designing simplified, guided-workflow instruments that reduce the training burden for new technicians, letting operators onboard field crews faster without sacrificing installation quality or certification accuracy.
Market Impact: Adds 35 percent to instrument price

High Capital Cost Limits Coherent Equipment Adoption

Coherent test equipment capable of validating 800G and higher transmission speeds carries substantially higher upfront capital cost than legacy single-wavelength instruments, creating a genuine adoption barrier for smaller telecom operators and contractors without hyperscale-scale procurement budgets. The root cause is the sophisticated signal processing and calibration hardware required for multi-wavelength coherent analysis, which cannot be simplified without compromising measurement accuracy. Vendors are mitigating exposure by offering equipment leasing and instrument-as-a-service pricing models that spread capital cost over multiple years, letting smaller operators access coherent testing capability without large upfront capital outlays.
Market Impact: Cuts installation time 30 percent
3 additional market trends, 4 additional growth drivers, and 2 additional restraints and challenges are covered in the full report. Contact sales@marketmindsadvisory.com to access the complete intelligence.

Segment CAGR and Growth Architecture

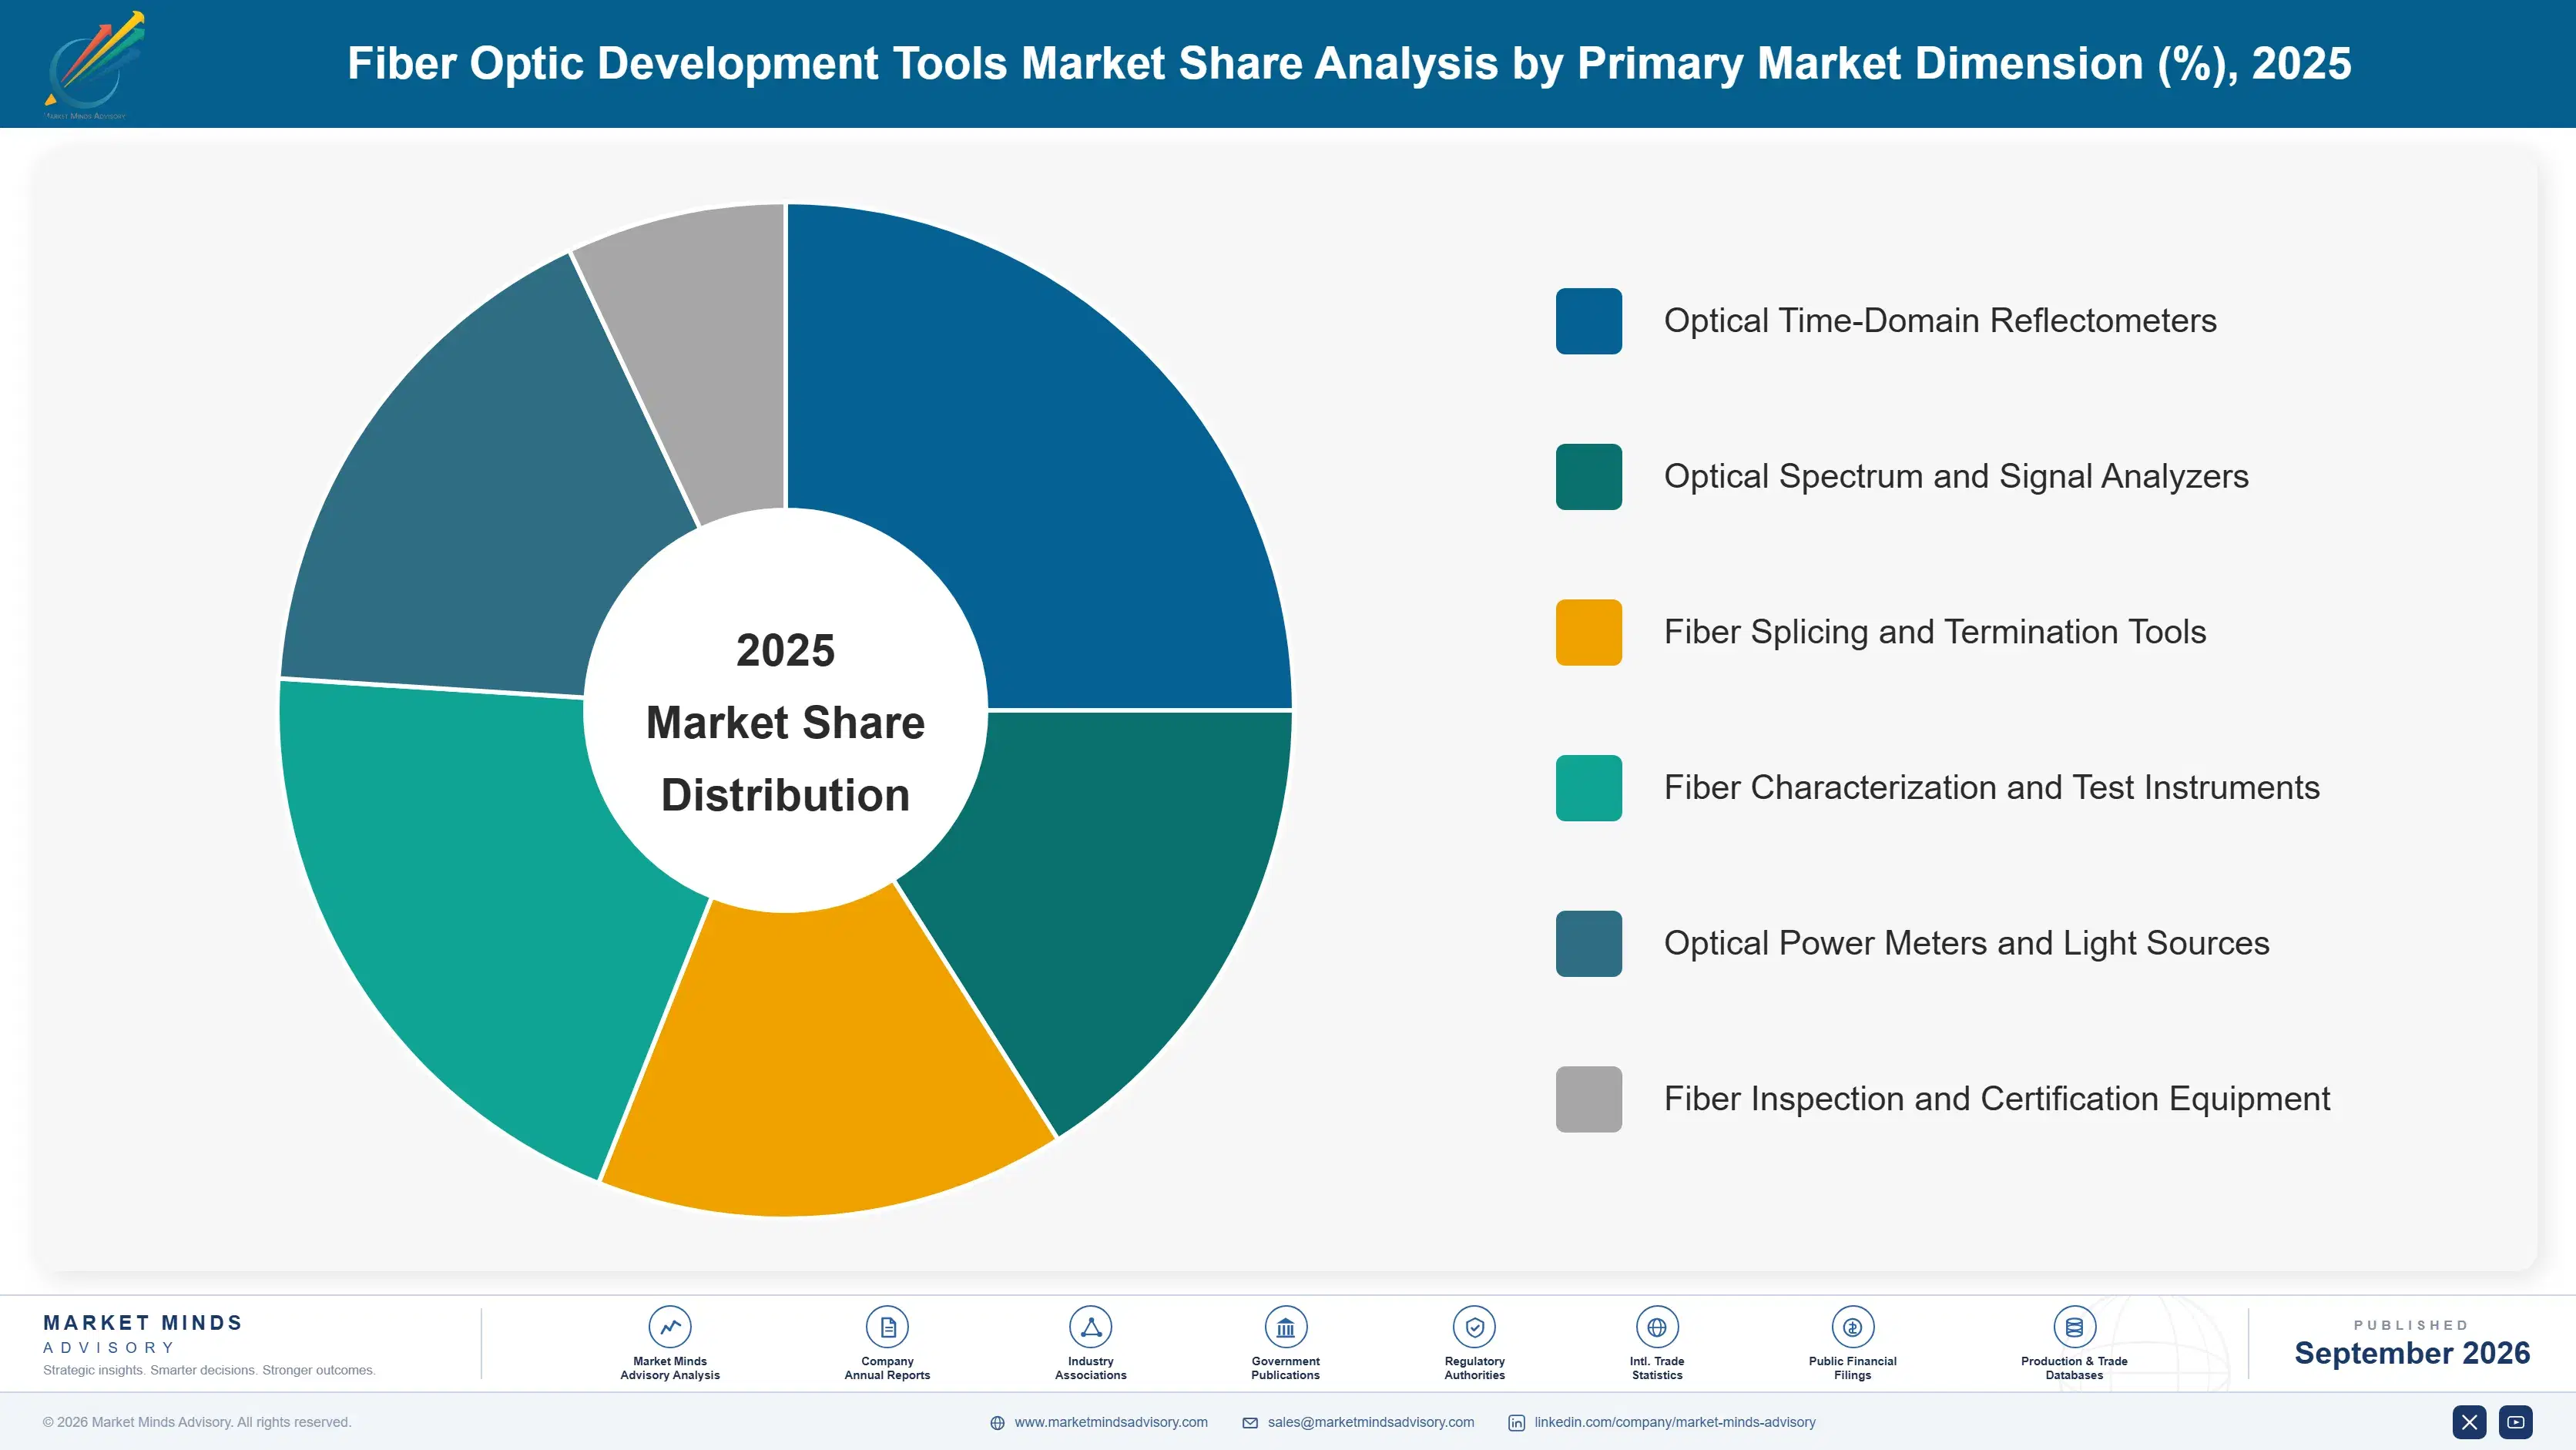
The market splits across six distinct product and technology segments spanning reflectometers, spectrum analyzers, splicing tools, and characterization instruments sold to telecom and hyperscale customers worldwide today across every region. Spectrum analyzers and splicing tools are pulling ahead of legacy categories as coherent testing and fiber-to-the-home rollout expand rapidly across most markets. today. now.
fiber-optic-development-tools-market-market-share-analysis-1790009699410

Optical Spectrum and Signal Analyzers

Optical spectrum and signal analyzers characterize signal quality across multiple wavelengths simultaneously, a capability essential for validating coherent transmission systems that legacy single-wavelength power meters cannot support at comparable accuracy or speed at scale. Demand is concentrated among hyperscale data center operators and telecom backbone providers, with North America and East Asia leading adoption given deeper interconnect infrastructure investment and manufacturing scale. Vendors are racing to bring instrument cost down as coherent transmission becomes standard across more network tiers, since total cost of ownership increasingly determines which vendors win large-scale interconnect validation contracts ahead of smaller, higher-cost competitors still refining production processes and yield rates. Adoption momentum keeps building each fiscal quarter.
CAGR 13.6%

Fiber Splicing and Termination Tools

Fiber splicing and termination tools let field technicians join and terminate optical fiber cables with the precision required to minimize signal loss at connection points, a critical capability for fiber-to-the-home rollout reaching millions of new residential premises worldwide. Demand is accelerating as government broadband subsidy programs fund large-scale deployment, pulling tool vendors toward portable, ruggedized hardware capable of rapid field deployment across diverse installation environments. Telecom operators increasingly specify simplified, guided-workflow splicing tools as a baseline requirement for scaling technician crews quickly, and the segment is expanding fastest in markets pursuing aggressive national broadband targets and subsidy programs. Pricing has held steady even as unit volumes expand rapidly. today. and abroad.
CAGR 11.2%
Full segment breakdown across 6 segments available in the complete report.

Regional Architecture and Country Demand Map

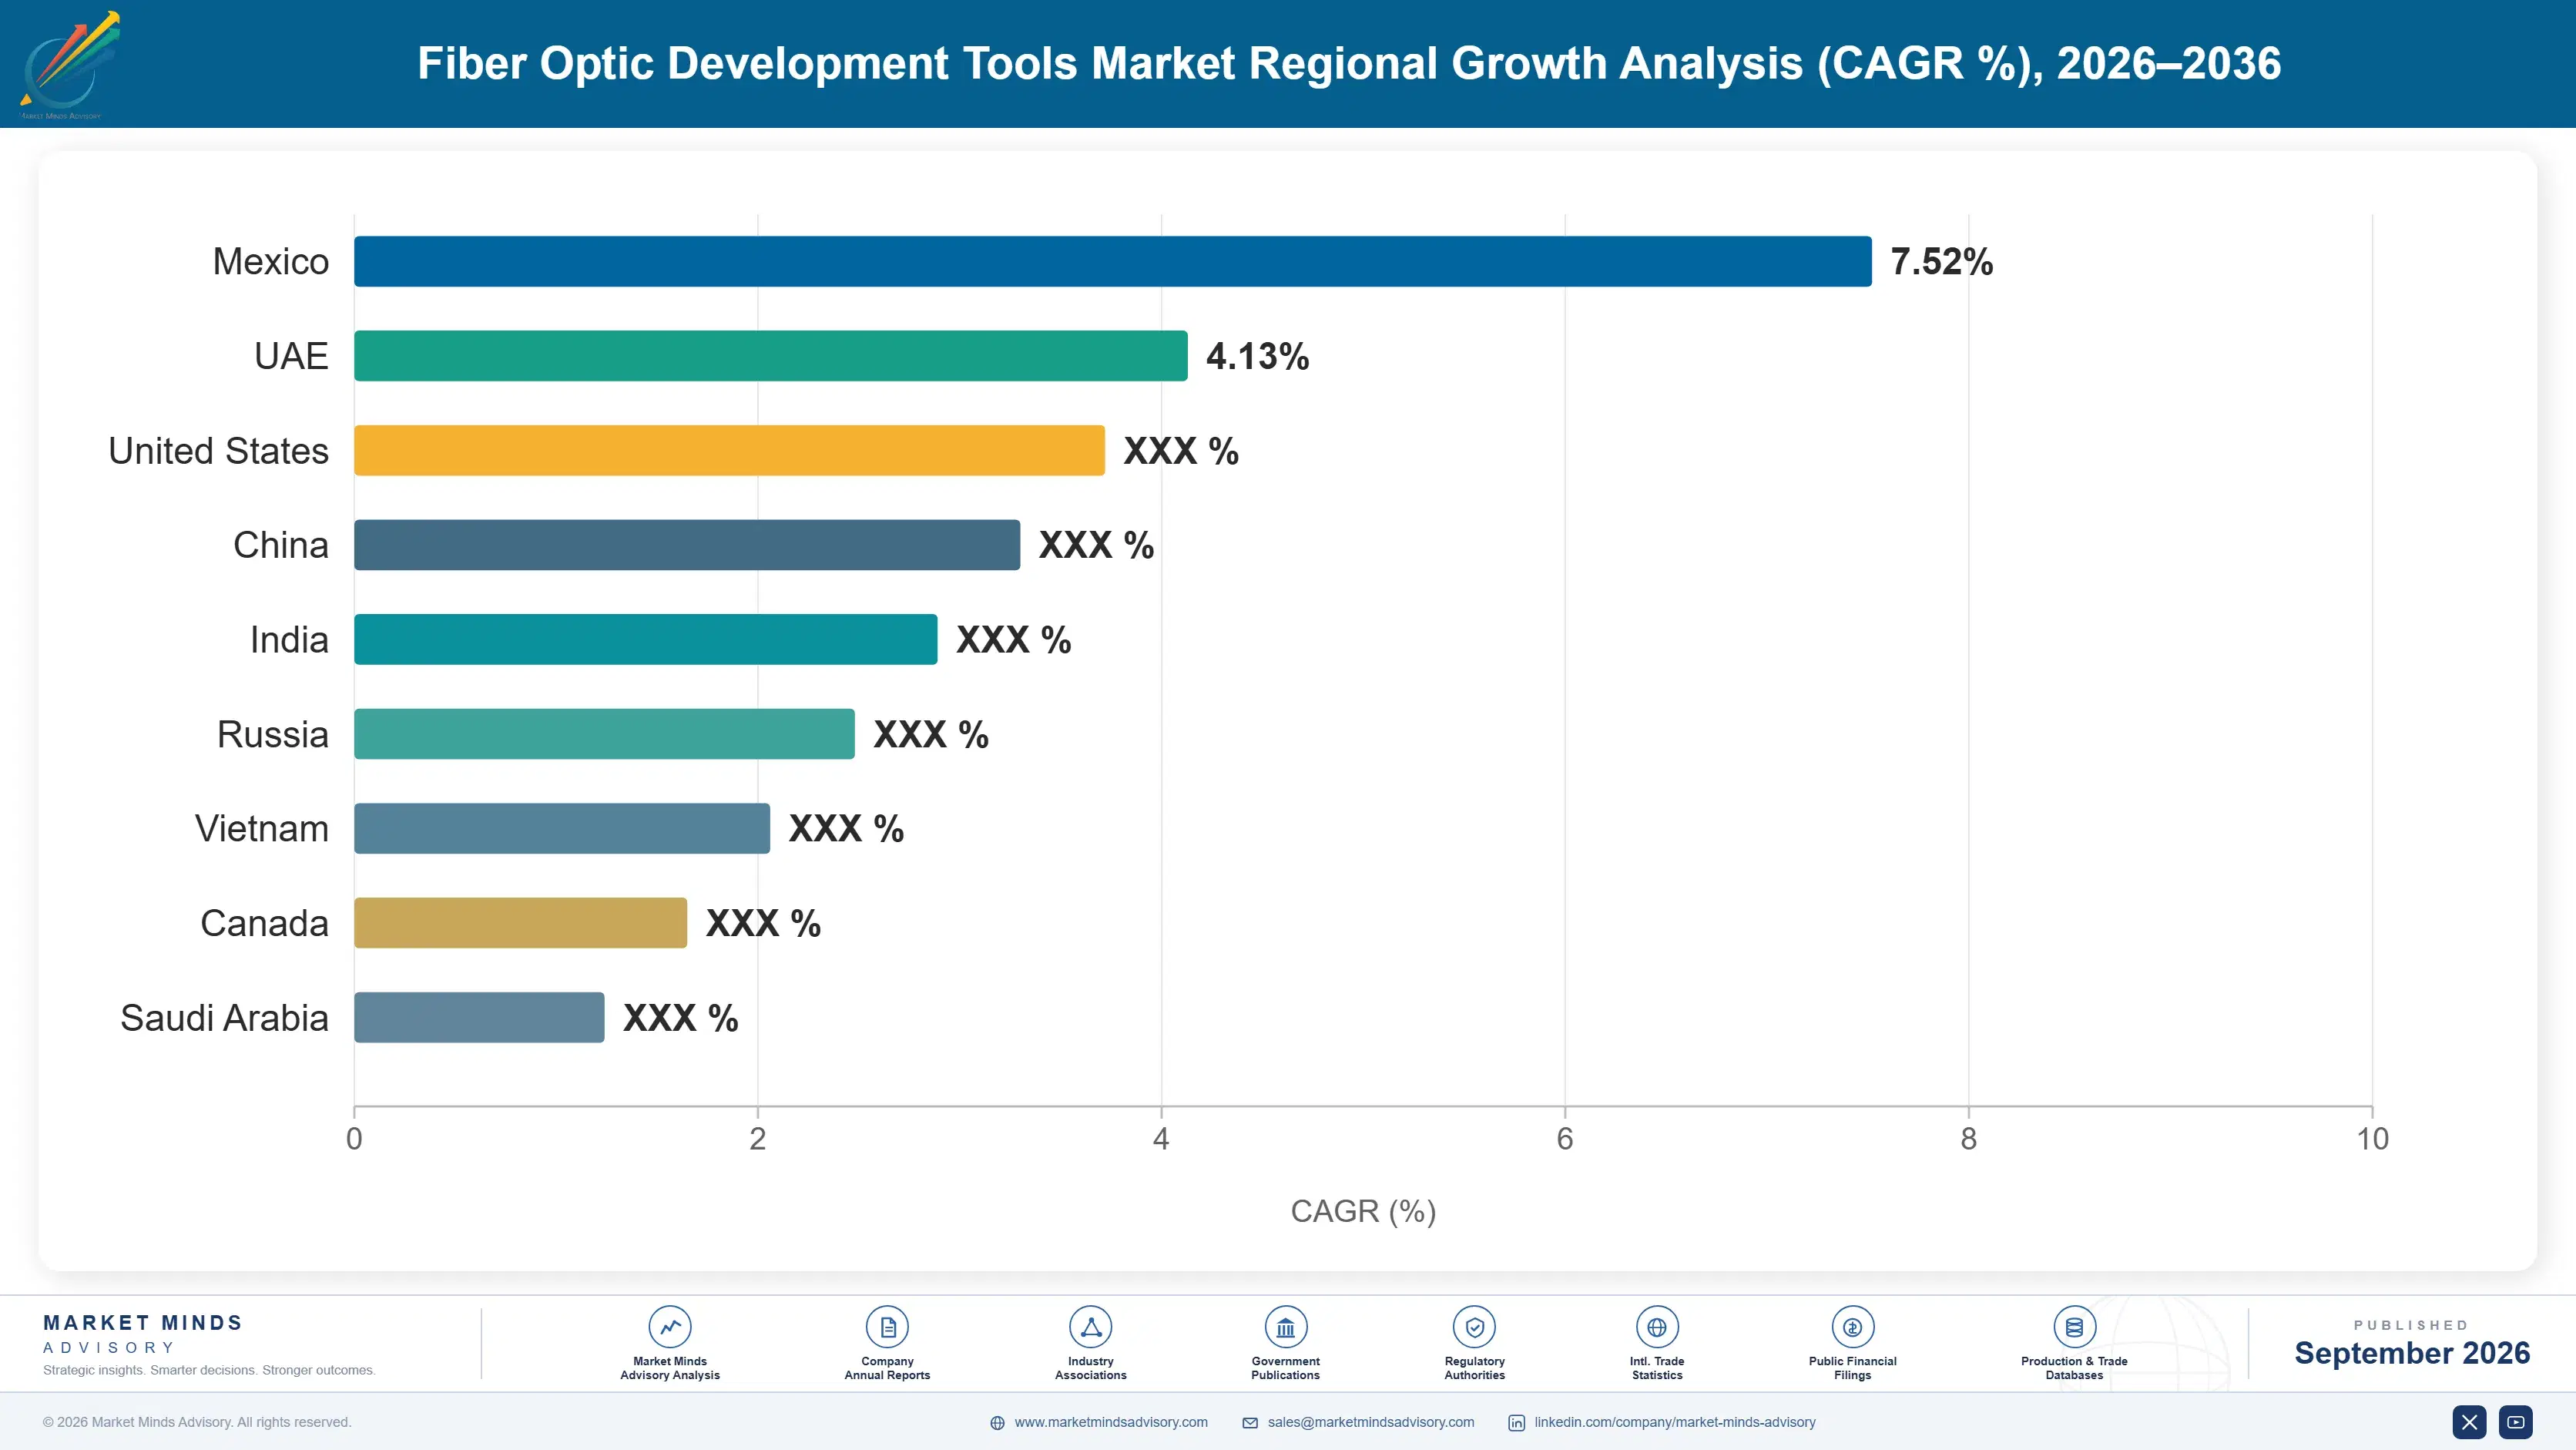
East Asia leads on dense instrument manufacturing capacity and enormous fiber deployment volume across China, Japan, and South Korea, with North America close behind on coherent hyperscale testing investment and interconnect spending. South Asia and Pacific posts the fastest regional growth rate as India's broadband rollout accelerates.

East Asia

China's enormous fiber-to-the-home deployment programs anchor East Asia's leadership in fiber optic development tool demand, with domestic telecom operators installing fiber to hundreds of millions of premises across the past decade and continuing at scale today. Japan and South Korea contribute deep optical instrument manufacturing expertise, with several of the world's leading test equipment vendors headquartered across the region. Regional optical component fabrication capacity, concentrated across Japan and Taiwan, gives local instrument vendors proximity advantages over foreign competitors serving this market from farther away. Growth here remains strong rather than merely steady, since coherent testing adoption continues expanding alongside ongoing fiber deployment across the wider region. Vendor relationships here span multiple decades of continuous supply.
Share: 29% | CAGR: 8.9% (2026 to 2036)

North America

Hyperscale data center interconnect upgrades are the defining demand driver across North America, with major cloud providers in the United States driving substantial coherent test equipment procurement to validate 800G and higher transmission speeds across dense fiber networks. Fiber-to-the-home rollout adds a second steady demand channel, as telecom operators expand broadband access supported by federal subsidy programs across underserved regions. Canada contributes a smaller but growing share through both hyperscale infrastructure and rural broadband expansion programs. Reshoring of critical telecom infrastructure manufacturing is adding incremental demand as domestic instrument production capacity expands across multiple states and regions. Certification pipelines here remain among the deepest in the world. Domestic vendors continue expanding capacity to meet rising demand.
Share: 26% | CAGR: 7.6% (2026 to 2036)
Regional intelligence for 5 additional markets available in the complete report: Western Europe, South Asia and Pacific, Latin America, Middle East and Africa, Eastern Europe. Contact sales@marketmindsadvisory.com.
fiber-optic-development-tools-market-country-cagr-analysis-1790009699938

Where Instrument Margin Actually Concentrates

Margin in the fiber optic development tools market increasingly concentrates around coherent testing depth and cloud connectivity rather than raw instrument manufacturing volume alone across most segments. Vendors capturing design wins across hyperscale and broadband modernization programs hold pricing power that pure-play, single-function instrument suppliers have steadily lost over recent years and continue losing today.

Coherent Testing Capability Commands Design Wins

Vendors offering coherent test instruments capable of validating 800G and higher transmission speeds are winning hyperscale procurement contracts that single-wavelength competitors cannot bid on at all, since data center operators increasingly refuse to commit to legacy test infrastructure. This coherent capability commands roughly 50 percent higher average selling price than standard single-wavelength instruments of comparable manufacturing quality, since hyperscale buyers value validated interconnect reliability highly. Hyperscale buyers increasingly favor vendors who can support multi-generation upgrade paths, letting a single instrument platform serve evolving transmission speed requirements without full hardware replacement.
Market Impact: Commands a 50 percent higher average selling price

Cloud-Connected Diagnostic Service Contracts Lock In Revenue

Vendors bundling cloud-connected diagnostic data management alongside instrument hardware capture recurring subscription revenue tied to ongoing network monitoring relationships rather than one-time hardware sales, generating far more predictable, durable revenue streams. These service relationships typically span 4 or more years once a vendor's diagnostic platform becomes embedded in an operator's network monitoring workflow, since switching costs and data migration requirements discourage vendor changes. This mechanism is increasingly favored by vendors seeking revenue stability, since it insulates them from the cyclical nature of pure hardware procurement cycles and capital budget timing.
Market Impact: Secures 4-plus year recurring diagnostic service terms now

Portable Splicing Tool Early Adoption Advantage

Vendors that moved early to bring lightweight, ruggedized splicing tools to mainstream price points are winning broadband deployment contracts from operators eager to skip an intermediate benchtop-equipment procurement phase entirely. This early-mover positioning is generating a persistent design-in advantage worth an estimated 24 percent of new fiber-to-the-home procurement contracts annually as operators standardize on portable, guided-workflow tooling across their technician crews. Vendors slower to adopt are increasingly relegated to smaller, budget-constrained accounts still specifying legacy benchtop equipment, a shrinking category as portable tool adoption keeps accelerating across nearly every broadband rollout program tracked.
Market Impact: Wins 24 percent of all new deployment contracts

Calibration and Certification Service Revenue Add-On

Vendors offering ongoing calibration and certification services tuned specifically for regulatory compliance requirements, combined with technician training programs, are capturing premium pricing from network operators facing persistent workforce and compliance challenges. This service positioning adds roughly 15 percent to per-unit revenue for vendors able to demonstrate reliable calibration turnaround and comprehensive training curricula directly to procurement teams evaluating competing instrument platforms. Network operators increasingly specify service capability explicitly in vendor selection criteria, giving established vendors a durable, defensible advantage over less-equipped competitors bidding for the same large-scale deployment contracts today.
Market Impact: Adds roughly 15 percent to total per-unit revenue

Who Controls the Margin Pool

The fiber optic development tools market holds meaningful concentration, with the top five players controlling 42 percent of revenue on a combined instrument manufacturing and calibration services basis measured consistently. Viavi Solutions and EXFO lead comfortably given decades of optical test equipment depth, while the gap to mid-tier challengers like Fujikura has widened as coherent testing development demands capital smaller vendors struggle to match. That gap keeps widening each quarter.
Current competitive activity centers on coherent testing capability, cloud-connected diagnostics, and portable splicing tool development rather than pure instrument accuracy claims that dominated pricing conversations a decade ago. Vendors are racing to embed diagnostic software directly into instrument hardware, and several have pursued acquisitions to close coherent testing and connectivity capability gaps rather than build technology internally.

Emerging pressure is coming from network equipment manufacturers building integrated testing capability directly into their transmission hardware, threatening to disintermediate standalone instrument vendors for basic validation tasks specifically. Rankings could shift meaningfully over the next few years if equipment manufacturers succeed in commoditizing routine testing, pushing traditional instrument vendors toward deeper diagnostic, calibration, and coherent analysis capability as their primary competitive differentiator.
fiber-optic-development-tools-market-company-positioning-matrix-1790009700470

Competitive Moat and Risk Dimensions

VIAVI SOLUTIONS INC.

Moat: Optical Test Portfolio Breadth

Viavi holds decades of accumulated optical test equipment portfolio depth and calibration service relationships across telecom and hyperscale customers, giving it default incumbency in large-scale network validation programs that newer entrants struggle to displace quickly. This installed base generates recurring calibration and service orders that provide a stable revenue floor even as growth concentrates in newer coherent applications.
VIAVI SOLUTIONS INC.

Risk: Cloud Diagnostics Transition Pace

Viavi's legacy hardware-centric portfolio has moved more cautiously into fully cloud-connected diagnostic platforms than newer competitors built specifically for connected data management from the outset. That slower pace risks ceding design wins in fast-growing network monitoring segments to vendors with more agile, cloud-native product roadmaps and faster iteration cycles.
EXFO INC.

Moat: Field Instrument Reliability Depth

EXFO's field instrument heritage gives it deep, proven expertise in ruggedized, technician-friendly hardware design that translates directly into competitive portable splicing and certification tools bundled with broader field service platforms customers already use. That platform depth lets EXFO capture wallet share across entire field deployment programs rather than instrument sales alone.
EXFO INC.

Risk: Hyperscale Coherent Limited Presence

EXFO has comparatively limited presence in hyperscale-grade coherent testing relative to competitors more focused on that channel, leaving that fast-growing revenue pool underrepresented in its current portfolio mix. Expanding hyperscale coherent share would require deeper data center relationships that EXFO has not prioritized at the same pace as some rivals.

Players Tracked

Prominent Players

Viavi Solutions Inc.
EXFO Inc.
Keysight Technologies Inc.
Fluke Corporation
Fujikura Ltd.

Other Key Players

Anritsu Corporation
Yokogawa Electric Corporation
Corning Incorporated
Sumitomo Electric Industries Ltd
AFL Telecommunications LLC
Nokia Corporation
Coherent Corp
Thorlabs Inc
MKS Instruments Inc
Ideal Industries Inc
Greenlee Textron Inc
Ribbon Communications Inc
Grandway Technology Suzhou Corp
Sichuan Tianyi Comheart Telecommunication Co Ltd
Shinho Communication Corp

Recent Developments

MARCH 2025

Viavi Launches Cloud-Connected Coherent Test Platform

Viavi announced a new coherent test platform integrating cloud-connected diagnostic data management directly into the instrument, targeting hyperscale operators pursuing 800G interconnect validation without separate monitoring infrastructure investment. Analysts view this as a defining test case for connected coherent demand. The platform is expected to enter volume production next year.
Signal: Signals accelerating vendor investment in cloud-connected coherent testing across the industry and beyond current product cycles
JULY 2025

EXFO Expands Field Technician Training Partnership

EXFO expanded its technician training partnership with a major telecom operator, embedding guided-workflow instrument training directly into the operator's fiber-to-the-home deployment program for existing field crews across multiple regions nationwide. The partnership extends an existing long-standing service relationship. Financial terms were not disclosed publicly at this time.
Signal: Reinforces technician training as a primary growth vector for incumbents today between two long-standing service partners
NOVEMBER 2025

Keysight Acquires Coherent Testing Software Startup

Keysight acquired a smaller coherent testing software startup to strengthen its diagnostic analytics roadmap, adding signal processing algorithm capability that complements its existing hyperscale test instrument product portfolio. Terms of the transaction were not fully disclosed. Integration is expected to complete within three fiscal quarters.
Signal: Confirms acquisition remains the fastest path to analytics capability for hardware vendors as consolidation activity keeps accelerating

Optical Component Cost and Calibration Exposure

Specialized optical components represent the largest cost input for coherent test instruments, typically 29 to 36 percent of total cost of goods sold, sourced predominantly from laser source and photodetector manufacturers concentrated in Japan, the United States, and Taiwan. Calibration and certification testing add a second meaningful cost layer, particularly for vendors pursuing multi-jurisdiction regulatory approval across several major telecom markets simultaneously today.
Fujikura's 2024 annual report noted specialized optical component lead times extending meaningfully through much of the year, with telecom and hyperscale customers competing for the same limited laser source and detector fabrication capacity across the industry. That tightness forced several instrument vendors to extend delivery schedules or accept smaller production batches during peak fiber deployment and interconnect upgrade periods across nearly every major regional market tracked in this report.

Vendors dependent on a single optical component supplier or lacking scale to negotiate priority allocation face genuine competitive disadvantage relative to larger rivals with diversified sourcing relationships and greater purchasing leverage in negotiations. This exposure varies meaningfully by player type: smaller specialized vendors absorb the brunt of allocation squeezes, while Viavi Solutions and EXFO secure preferential terms through decade-long supplier partnerships.
fiber-optic-development-tools-market-cost-volatility-analysis-1790009700667

Diversified Multi-Supplier Optical Sourcing Strategy

Larger vendors are qualifying instrument designs across multiple optical component suppliers simultaneously, trading some process optimization for reduced dependence on any single supplier relationship during allocation squeezes and demand spikes across product cycles. This flexibility comes at meaningfully higher qualification cost but protects delivery schedules during periods of industry-wide component tightness and constrained supply.

Modular Multi-Jurisdiction Certification Architecture

Vendors are designing modular instrument platforms that share a common certified core across multiple regulatory jurisdictions, letting them validate new market entry incrementally rather than pursuing full-system requalification for each new country entered across the business and product line. This reduces certification cost and timeline exposure meaningfully for vendors expanding into new markets and jurisdictions.

Long-Term Component Supply Reservation Agreements

Larger vendors are signing multi-year optical component supply agreements with priority allocation guarantees, securing predictable access to specialized laser sources and detectors even during industry-wide demand spikes affecting smaller competitors more severely and persistently over time and across cycles. Smaller vendors generally lack the volume commitments required to access comparable terms from major suppliers today.

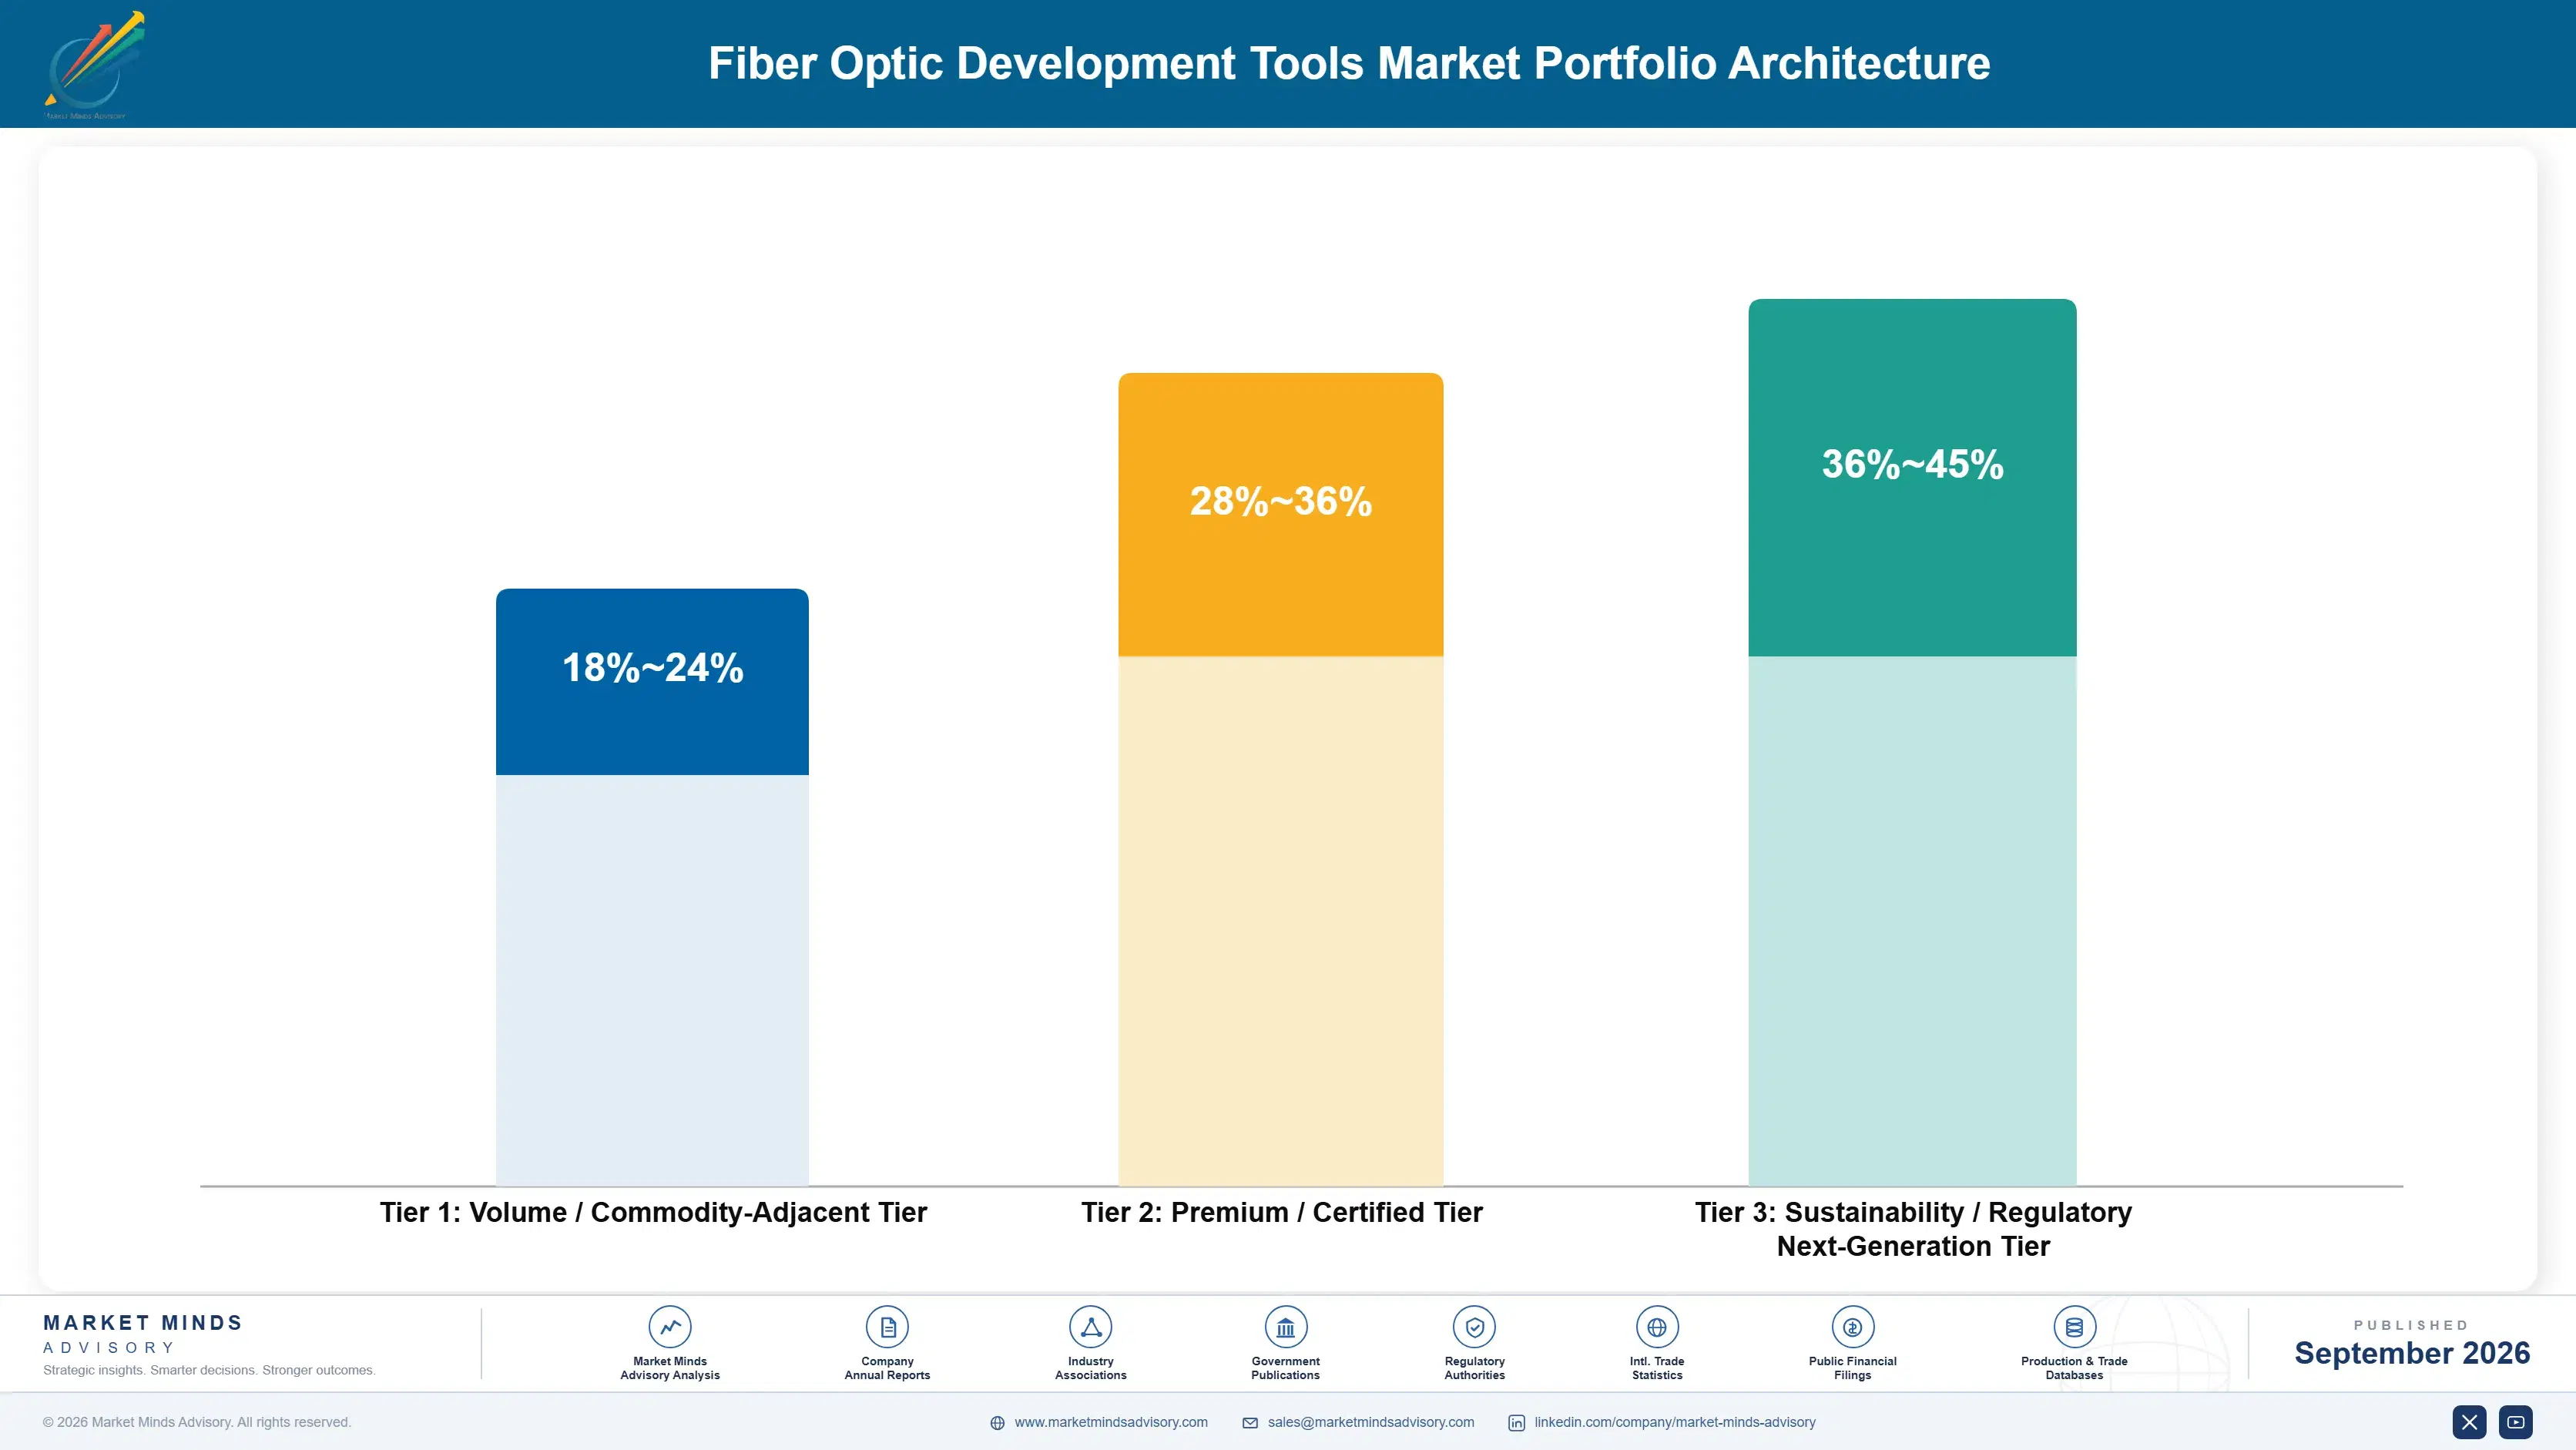
Portfolio Architecture for Margin Defence

Instrument margin structure runs on three distinct tiers separating on coherent testing depth and cloud connectivity rather than raw manufacturing volume alone across most segments served. Commodity single-wavelength instruments compete almost entirely on unit price, while coherent and cloud-connected platforms command genuine premiums buyers pay for reduced network risk and proven, validated interconnect reliability across facilities and network tiers.
The volume tier still ships the most units by count but claims a shrinking share of industry profit pools, increasingly squeezed between rising optical component cost and price-sensitive smaller operators treating basic instruments as commoditized hardware. Premium and next-generation tiers absorb heavier engineering investment upfront but return it through longer design-in relationships and materially stronger renewal pricing power across multi-year deployment contracts. Buyers increasingly reward proven integration track records.

High-value pools concentrate heavily in coherent test platforms and cloud-connected diagnostic services, where technical depth and genuine switching cost together create durable competitive advantage that commodity producers cannot easily replicate. That concentration is steadily reshaping where vendors deploy research spending, favoring coherent capability and connectivity investment over legacy single-wavelength instrument development entirely, a shift accelerating industry-wide. Vendors slow to adapt risk permanent margin erosion.

Volume / Commodity-Adjacent Tier

Standard single-wavelength instruments and legacy benchtop test hardware sold primarily on price and delivery reliability, with thin margins and intense competition from low-cost regional producers chasing volume contracts each cycle.
Gross Margin: 18-24%

Premium / Certified Tier

Multi-wavelength certified platforms carrying calibration accreditation across defined regulatory jurisdictions, validated for performance requirements with long design-in relationships and multi-year deployment contract commitments already firmly in place across most operators.
Gross Margin: 28-36%

Sustainability / Regulatory / Next-Generation Tier

Coherent test platforms and cloud-connected diagnostic instruments engineered for emerging transmission standards and AI-native network monitoring architectures that command sustained pricing power over legacy alternatives across most segments and jurisdictions today.
Gross Margin: 36-45%
fiber-optic-development-tools-market-portfolio-architecture-1790009701171

High-value Sub-segments and Strategic Watch-out

Optical Spectrum and Signal Analyzers

Fastest-growing and highest-margin segment today, driven by coherent transmission adoption that pushes testing well beyond single-wavelength measurement into premium, design-in-locked product commanding sustained pricing power throughout the qualification cycle across every major hyperscale operator worldwide today. Vendors here set the pace industry-wide. today. today. now.
Gross Margin: 38-46%

Fiber Splicing and Termination Tools

Large, high-value pool growing steadily on broadband subsidy programs, where portability and reliability requirements sustain durable premium pricing over standard benchtop instruments across most customer segments and regions served by major national deployment programs today. Contract renewal rates stay consistently high. today. and abroad. now.
Gross Margin: 30-38%

Optical Power Meters and Light Sources

Volume core of the market, supplying baseline network testing capability at steady but thinner margins, dependent on long-standing customer relationships and reliable delivery windows across multi-year procurement contracts and repeat purchasing patterns from established telecom customers worldwide. Vendors here compete mostly on price and reliability.
Gross Margin: 20-26%

Fiber Inspection and Certification Equipment

Strategic watch-out segment facing commoditization as automated inspection features absorb into broader multi-function instrument platforms, shrinking legacy standalone certification revenue steadily year over year across most major telecom markets and pressuring vendors reliant on that revenue base. Few vendors are reinvesting in this category. today.
Gross Margin: 14-19%

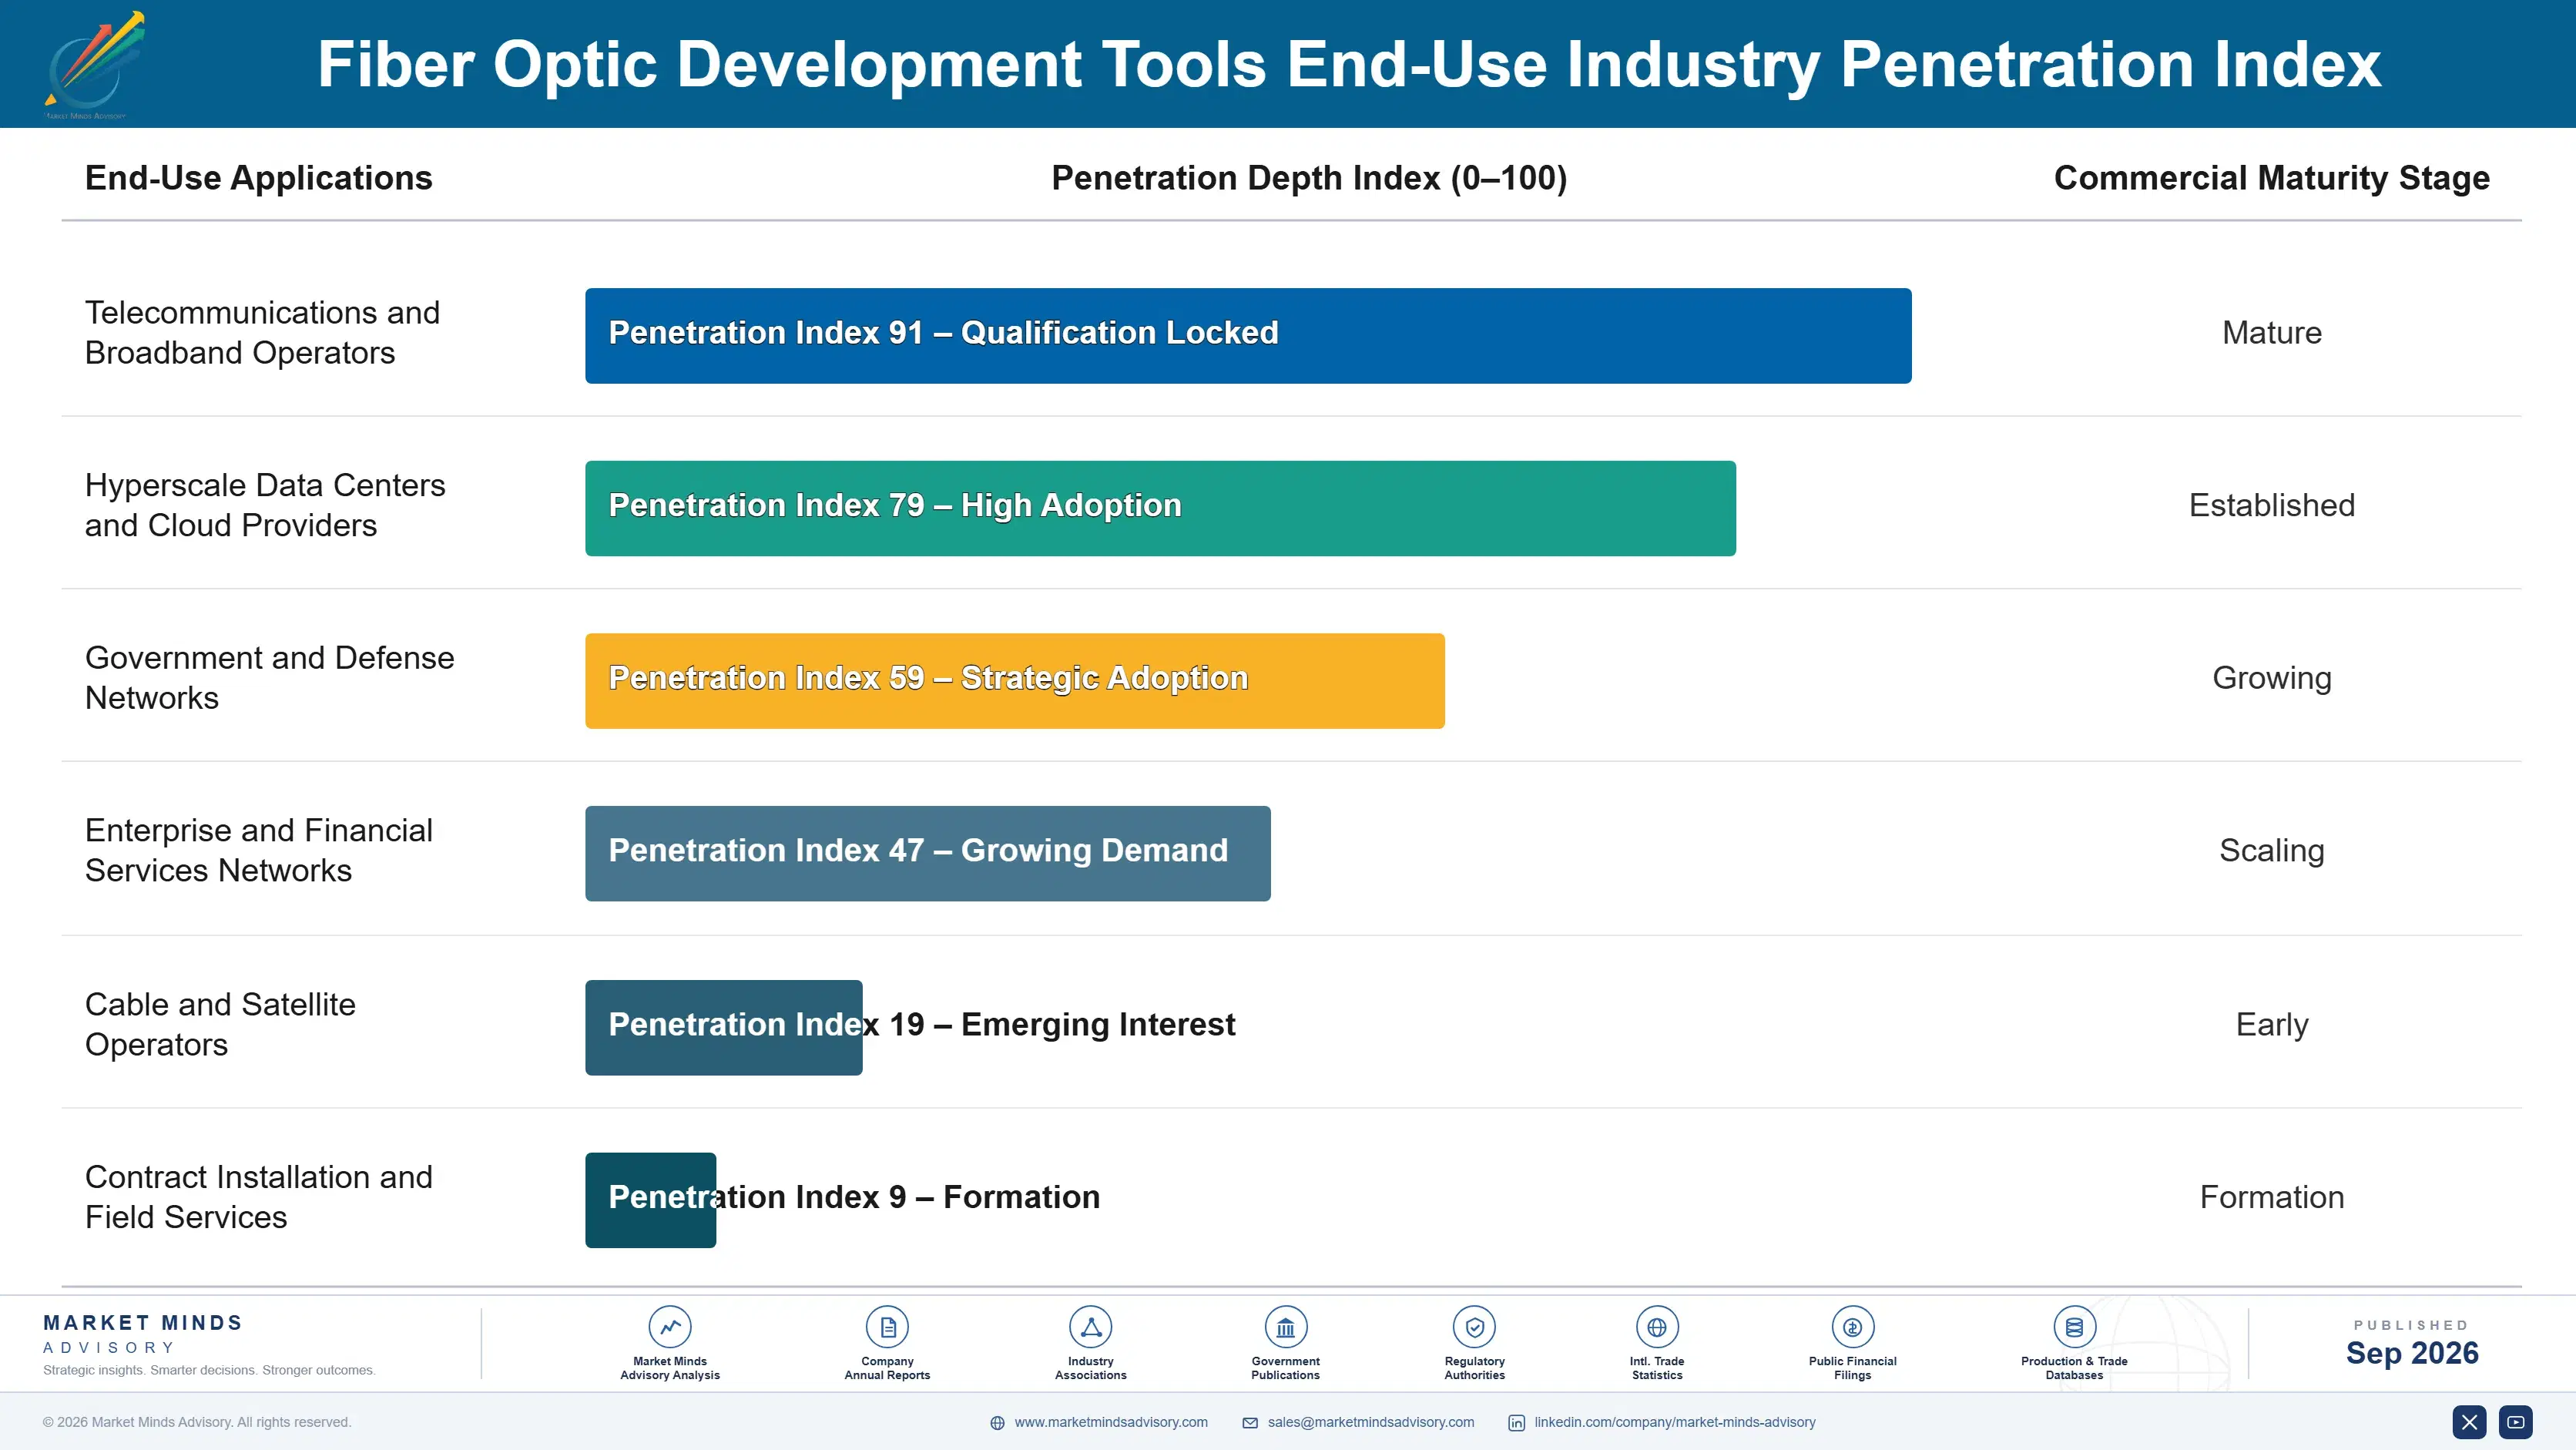
Recurring Demand Beneath Test Instruments

Fiber optic development tool demand runs closer to a network operations annuity than a one-time capital purchase for most telecom and hyperscale customers. Once an instrument platform wins qualification across a network operator's technician fleet or hyperscale test lab, replacement units, calibration services, and upgrade orders flow for years without a fresh competitive bid, giving incumbent vendors a durable, multi-cycle revenue stream new entrants find genuinely hard to interrupt.
Stickiness varies sharply by end-use vertical, though. Hyperscale relationships run deepest, anchored by multi-year interconnect validation programs and rigorous certification requirements that discourage switching mid-deployment entirely. Telecom operator relationships show comparable depth once an instrument platform becomes standardized across a technician fleet, though the relationship is more exposed to competitive re-bidding at major network modernization cycles than hyperscale accounts tend to be. Field contractor relationships sit in between, growing quickly but younger and less tested than either account type.

Buyer profiles are shifting generationally as procurement leadership at network operators turns over across most networks. Younger technical buyers increasingly favor vendors offering cloud-connected diagnostics and portable, guided-workflow tools over pure incumbency, a change legacy benchtop suppliers with strong historical relationships are still adjusting to across multiple regions and customer categories simultaneously.
fiber-optic-development-tools-market-end-use-penetration-index-1790009701681

Where Instrument Strategy Should Focus Next

These are among the four positions where our research anticipates prominent divergence between winners and laggards over the coming forecast period. Each is grounded in the demand model, the regulatory perimeter, and the announced capacity pipeline.
01 / COHERENT TESTING INVESTMENT

Build coherent capability into every new instrument line

Coherent test instruments are capturing meaningfully higher pricing and design wins than single-wavelength hardware, and that gap is widening as hyperscale operators standardize on 800G and higher transmission speeds across their interconnect networks worldwide today. Vendors still shipping single-wavelength-only instruments risk losing hyperscale contracts to competitors offering coherent capability at comparable manufacturing cost and validated reliability across facilities. Building coherent capability now, even at higher upfront engineering cost, protects design-in share before hyperscale operators fully standardize on coherent test infrastructure and monitoring.
02 / PORTABLE TOOL EXPANSION

Accelerate portable splicing tool manufacturing cost reduction

Portable splicing tool demand is outrunning available manufacturing capacity as broadband subsidy programs accelerate fiber-to-the-home deployment across multiple countries simultaneously, and vendors slow to scale production risk ceding the fastest-growing segment to more efficient competitors. Vendors that achieve mainstream price points now position themselves to bid on the full range of national broadband procurement programs launching over the coming several years rather than a narrow subset of premium accounts. Vendors that delay risk permanent exclusion from the segment defining this market's growth.
03 / OPTICAL COMPONENT SUPPLY SECURITY

Lock in optical component supply ahead of demand spikes

Specialized laser source and detector capacity remains tightly allocated amid broader telecom demand growth, leaving vendors without long-term supply agreements vulnerable to extended lead times during peak fiber deployment periods that recur unpredictably across the calendar year. Larger competitors already secure preferential allocation through decade-long supplier relationships that smaller rivals cannot easily replicate on short notice or comparable terms. Establishing multi-year supply reservations now, even at higher committed volume requirements, protects delivery reliability through the next inevitable industry-wide capacity crunch.
04 / REGIONAL DEPLOYMENT POSITIONING

Expand presence across East Asian and Indian broadband markets

East Asia anchors both manufacturing capacity and deployment volume for this market, while India posts the fastest country-level growth rate on ambitious national broadband rollout outpacing most other emerging markets tracked in this report. Vendors under-invested in either region face longer lead times or missed design-in opportunities relative to competitors already embedded in local supply chains and operator relationships. Building deeper regional presence now, through partnerships or direct investment, secures proximity to both the manufacturing base and the fastest-growing demand pool.

Engagement Snapshot From the Field

A live engagement with an industry participant carrying material or product regulatory and market exposure ahead of a defining policy shift, showing how our research translates into a defensible multi-year portfolio strategy.
MARKET MINDS ADVISORY · CLIENT ENGAGEMENT SUMMARY
Fiber Optic Development Tools Producer Strategic Portfolio Review and Transition Roadmap 2026·Investment Scenario on Fiber Optic Development Tools Exposure Evaluation 2025-26
CLIENT PROFILE
The client is a regional telecom operator serving a mid-sized national market, historically relying on legacy single-wavelength test equipment across its fiber network operations and field technician workforce. Annual capital expenditure on network infrastructure is approximately one hundred fifty million dollars (client-reported, unverified by MMA), with a growing share allocated to fiber-to-the-home expansion under a national broadband subsidy program.
STRATEGIC CHALLENGE
The operator faced pressure to accelerate fiber-to-the-home deployment under a government subsidy program with strict completion timelines, but its existing field technician workforce lacked the tools and training needed to meet aggressive rollout targets. Leadership needed an independent assessment of tooling and training investment priorities before the next capital budget cycle.
MMA APPROACH
MMA conducted structured interviews with the operator's network engineering and field operations leadership, benchmarked competitor deployment timelines against primary survey data, and modeled rollout outcomes under different tooling investment scenarios for leadership review. The engagement combined qualitative expert interviews with MMA's proprietary segment growth forecasts to prioritize which capability mattered most.
KEY FINDINGS
  1. Field technician crews using legacy benchtop equipment were completing installations at roughly half the pace of competitors using portable, guided-workflow tools nationwide.
  2. Subsidy program completion deadlines left the operator only eighteen months to hit deployment targets across the remaining unserved territory in the region.
  3. Competitors using cloud-connected diagnostic platforms were reportedly identifying and resolving fiber faults in a fraction of the time previously required at each site.
  4. A phased tooling upgrade targeting only the highest-volume deployment regions first could meaningfully accelerate progress without requiring immediate full fleet replacement upfront.
CLIENT PROFILE
The client is a regional telecom operator serving a mid-sized national market, historically relying on legacy single-wavelength test equipment across its fiber network operations and field technician workforce. Annual capital expenditure on network infrastructure is approximately one hundred fifty million dollars (client-reported, unverified by MMA), with a growing share allocated to fiber-to-the-home expansion under a national broadband subsidy program.
STRATEGIC CHALLENGE
The operator faced pressure to accelerate fiber-to-the-home deployment under a government subsidy program with strict completion timelines, but its existing field technician workforce lacked the tools and training needed to meet aggressive rollout targets. Leadership needed an independent assessment of tooling and training investment priorities before the next capital budget cycle.
MMA APPROACH
MMA conducted structured interviews with the operator's network engineering and field operations leadership, benchmarked competitor deployment timelines against primary survey data, and modeled rollout outcomes under different tooling investment scenarios for leadership review. The engagement combined qualitative expert interviews with MMA's proprietary segment growth forecasts to prioritize which capability mattered most.
KEY FINDINGS
  1. Field technician crews using legacy benchtop equipment were completing installations at roughly half the pace of competitors using portable, guided-workflow tools nationwide.
  2. Subsidy program completion deadlines left the operator only eighteen months to hit deployment targets across the remaining unserved territory in the region.
  3. Competitors using cloud-connected diagnostic platforms were reportedly identifying and resolving fiber faults in a fraction of the time previously required at each site.
  4. A phased tooling upgrade targeting only the highest-volume deployment regions first could meaningfully accelerate progress without requiring immediate full fleet replacement upfront.
RECOMMENDED STRATEGY
Phase 1: Phase one: equip the highest-volume deployment regions with new portable, guided-workflow splicing tools within four months of the project's start. Phase 2: Phase two: roll out cloud-connected diagnostic platforms across the technician fleet, targeting full deployment within ten months of the pilot. Phase 3: Phase three: expand tooling upgrades to remaining regions as subsidy funding milestones are reached and deployment pace continues to accelerate further.
OUTCOME
Within fourteen months the operator reported (client-reported, unverified by MMA) a 40 percent improvement in average installation pace and successfully met its subsidy program deployment deadline with several months of buffer remaining, avoiding potential funding penalties tied to missed completion targets and delayed program milestones.

Frequently Asked Questions

Foundational context covering the market sizes, CAGR, scope, country, region and competition that inform every finding below. This section is provided to cover basics and most often pre-purchase conversations, answered from the MMA Primary Research Dataset.

What is the current size of the Fiber Optic Development Tools Market?

The Fiber Optic Development Tools Market reached an estimated 1.85 billion dollars globally in 2025. Coherent testing and fiber-to-the-home rollout are the primary growth drivers today.

How large will the Fiber Optic Development Tools Market be by 2036?

MMA forecasts the market will reach approximately 4.4 billion dollars by 2036 under the base case scenario. That represents roughly a 2.2 times expansion from 2026 levels.

What is the CAGR for the Fiber Optic Development Tools Market 2026 to 2036?

The base case CAGR is 8.2 percent annually across the forecast period. Bull and bear scenarios range from 9.5 percent down to 6.9 percent respectively.

Which segment is growing fastest?

Optical Spectrum and Signal Analyzers is growing fastest at 13.6 percent CAGR, roughly 1.66 times the overall market rate. Coherent transmission testing demand drives that pace.

Who are the major companies in the Fiber Optic Development Tools Market?

Leading players include Viavi Solutions, EXFO, Keysight Technologies, Fluke, and Fujikura, spanning test and measurement categories. Together the top five hold an estimated 42 percent combined share.

Which country is growing fastest?

India leads country-level growth at 11.8 percent CAGR, well ahead of the regional and global averages. Ambitious national broadband rollout and field technician expansion are the main contributing factors.

Report Segmentation Architecture

The full report scope spans multiple orthogonal segmentation dimensions, with cross-tabulated demand data provided for each dimension pair. Coverage extends further to regional breakdowns, trend trajectories, and the competitive detail needed to support segment-level decision-making.

By Primary Market Dimension

  • Optical Time-Domain Reflectometers
  • Optical Spectrum and Signal Analyzers
  • Fiber Splicing and Termination Tools
  • Fiber Characterization and Test Instruments
  • Optical Power Meters and Light Sources
  • Fiber Inspection and Certification Equipment

By End-Use Industry

  • Telecommunications and Broadband Operators
  • Hyperscale Data Centers and Cloud Providers
  • Government and Defense Networks
  • Enterprise and Financial Services Networks
  • Cable and Satellite Operators
  • Contract Installation and Field Services

By Commercial Dimension

  • Direct Operator and Enterprise Sales
  • Distributor and Reseller Channels
  • Equipment Leasing and Rental Services
  • Calibration and Certification Service Contracts
  • Field Technician Training Programs

By Region

  • North America
  • Western Europe
  • East Asia
  • South Asia and Pacific
  • Latin America
  • Middle East and Africa
  • Eastern Europe

Scope, Methodology, and Coverage

Every figure in this report is reproducible from documented input assumptions. The scope below maps the historical period, the forecast horizon, the segmentation dimensions, and the countries covered, alongside the underlying primary and qualitative methodology.
Historical Period
2020 to 2025
Forecast Period
2026 to 2036
Base Year
2025 (USD billions; MMA Primary Research Dataset, September 2026)
Market Definition
The Fiber Optic Development Tools Market covers test, measurement, and development equipment used to design, install, and maintain fiber optic networks, including reflectometers, spectrum analyzers, splicing tools, and fiber characterization instruments. It excludes fiber optic cable and transceiver products themselves, and downstream network management software not tied to physical layer testing.
Quantitative Units
USD Billion
Segmentation Dimensions
Product and technology type, end-use industry, and commercial distribution channel
Regions Covered
North America, Western Europe, East Asia, South Asia and Pacific, Latin America, Middle East and Africa, Eastern Europe
Countries Covered
United States, China, Japan, South Korea, Germany, India, Brazil, and 14 additional countries
Key Companies Profiled
Viavi Solutions Inc., EXFO Inc., Keysight Technologies Inc., Fluke Corporation, Fujikura Ltd., Anritsu Corporation, Yokogawa Electric Corporation, Corning Incorporated, Sumitomo Electric Industries Ltd, AFL Telecommunications LLC, Nokia Corporation, Coherent Corp, Thorlabs Inc, MKS Instruments Inc, Ideal Industries Inc, Greenlee Textron Inc, Ribbon Communications Inc, Grandway Technology Suzhou Corp, Sichuan Tianyi Comheart Telecommunication Co Ltd, Shinho Communication Corp
Quantitative Methodology
Primary survey, n=3,800 respondents, Q4 2025, six countries; demand-side model with trade association cross-validation
Qualitative Methodology
47 expert interviews, Q4 2025; applied to validate demand model assumptions, identify emerging dynamics, and assess competitive positioning
Report Format
PDF and XLSX data workbook (Word format preview document)
Publisher
Market Minds Advisory
Report Code
MMA-2026-TEC-744
Published
September 2026
Contact
sales@marketmindsadvisory.com | www.marketmindsadvisory.com

Purchase the full Fiber Optic Development Tools Market Report (2026 to 2036).

This report provides a comprehensive assessment of the global Fiber Optic Development Tools Market across all major product categories, end-use industries, and geographic regions through 2036. It combines MMA's primary survey dataset of 3,800 respondents with 47 expert interviews to quantify segment-level growth, competitive positioning, and regional demand mechanisms. Coverage spans market sizing, segmentation, regional dynamics, competitive benchmarking, input cost exposure, and portfolio economics. The analysis is designed to support product roadmap planning, sourcing strategy, and procurement decisions for instrument vendors, telecom operators, and hyperscale buyers evaluating this space.
Ten-year quantitative forecast by product segment
Seven-region demand and pricing breakdown analysis
Competitive benchmarking of top twenty players
Optical component cost exposure and mitigation analysis
Margin tier and portfolio economics mapping
Primary survey and expert interview data

Built For The People Who Decide

From boardroom strategy to bench-side execution, this report is read cover-to-cover by leaders shaping the next decade of their industry, turning demand scenarios, market dynamics and valuation benchmarks into decisions.
CXOs/ Presidents/ VPs/ Managers
M&A and Corporate Development
Strategy Teams and R&D Heads
Procurement and Product Directors
Regulatory and Compliance Leaders
Investor Relations and Equity Analysts