Market Minds Advisory
Fiber Optic Connectors Market

Fiber Optic Connectors Market: Precision Interconnect Components for Optical Networks.

Hyperscale AI cluster buildout is pulling fiber optic connector demand toward high-density MPO and MTP formats faster than legacy telecom connector categories, rewarding suppliers who clear tightening qualification barriers over rivals still competing on price.

Lead Analyst

Published

September 2026

Make Smarter Decisions with Customized Research Insights

Request a free sample report and evaluate market opportunities, growth trends, and competitive dynamics relevant to your business needs.

2025 MARKET VALUE$3.8BMarket Size 2025
2036 FORECAST VALUE$9.3BBase Case , 2026 to 2036
CAGR 2026 TO 20368.5 %Bull 9.7% / Bear 7.3%
INCREMENTAL OPPORTUNITY$5.2BNet 10- year value creation
EXPANSION MULTIPLE2.26x2036 value over 2026 base
Strategic Levers
M&A Pipeline
Regional Outlook
Country Rankings
Competitive Intelligence
Segmental Deep-dive
Call-Us : 91 93563 13602

Executive Snapshot and Market Trajectory.

Fiber optic connector demand has shifted decisively toward high-density interconnect formats as hyperscale operators race to wire AI training clusters, pushing MPO and MTP connector volumes ahead of traditional single-mode formats used in metro networks, a reordering few suppliers anticipated even three years ago.
Hyperscale data center buildout and nationwide fiber broadband rollout are the two dominant commercial forces, concentrating volume in East Asia, where connector manufacturing scale and domestic network expansion both outpace most other regions of the world. MPO and MTP high-density connectors for hyperscale interconnects absorb an increasing share of spend, since AI cluster architectures require far higher fiber density per rack than legacy enterprise network designs ever demanded from suppliers.
Competitive intensity spans established precision manufacturers alongside specialized connector makers competing on insertion loss performance and polish quality, a dynamic reshaping supplier qualification criteria across hyperscale accounts worldwide. Falling per-connector cost from automated polishing and inspection equipment is pulling higher-density formats into mid-tier enterprise and telecom deployments that previously relied on cheaper legacy connector types entirely, widening the addressable base for suppliers who can hold tight manufacturing tolerances at high volume and low defect rates.
Market Definition
The Fiber Optic Connectors Market covers precision interconnect components, including LC, SC, ST, MPO, and MTP connector formats, used to terminate and join optical fiber cable in telecom, data center, and enterprise networks. It excludes fiber optic cable manufacturing itself, active optical transceivers, and network switching equipment.
Base Year Value
$3.8B in 2025 (MMA Primary Research Dataset, September 2026)
Forecast Period
2026 to 2036, eleven discrete annual values
CAGR
8.5% base case. Bull 9.7%. Bear 7.3%.
Fastest Growth Segment
MPO/MTP High-Density Connectors for Hyperscale Data Center Interconnects: 14.5% CAGR
Fastest Growth Country
India: 13.0% CAGR
Fastest Growth Region
South Asia and Pacific: 10.5% CAGR
Largest Region
East Asia: 30% of 2025 global value
Market Leaders
Corning Incorporated, Amphenol Corporation, US Conec, Senko Advanced Components, and Furukawa Electric lead the global Fiber Optic Connectors Market. Source: MMA Primary Research Dataset, July 2026, and company disclosures.
Primary Survey
n=3,800 procurement and R&D decision-makers, Q4 2025, six countries
Methodology
Demand-side build-up, cross-validated against public data, 47 expert interviews

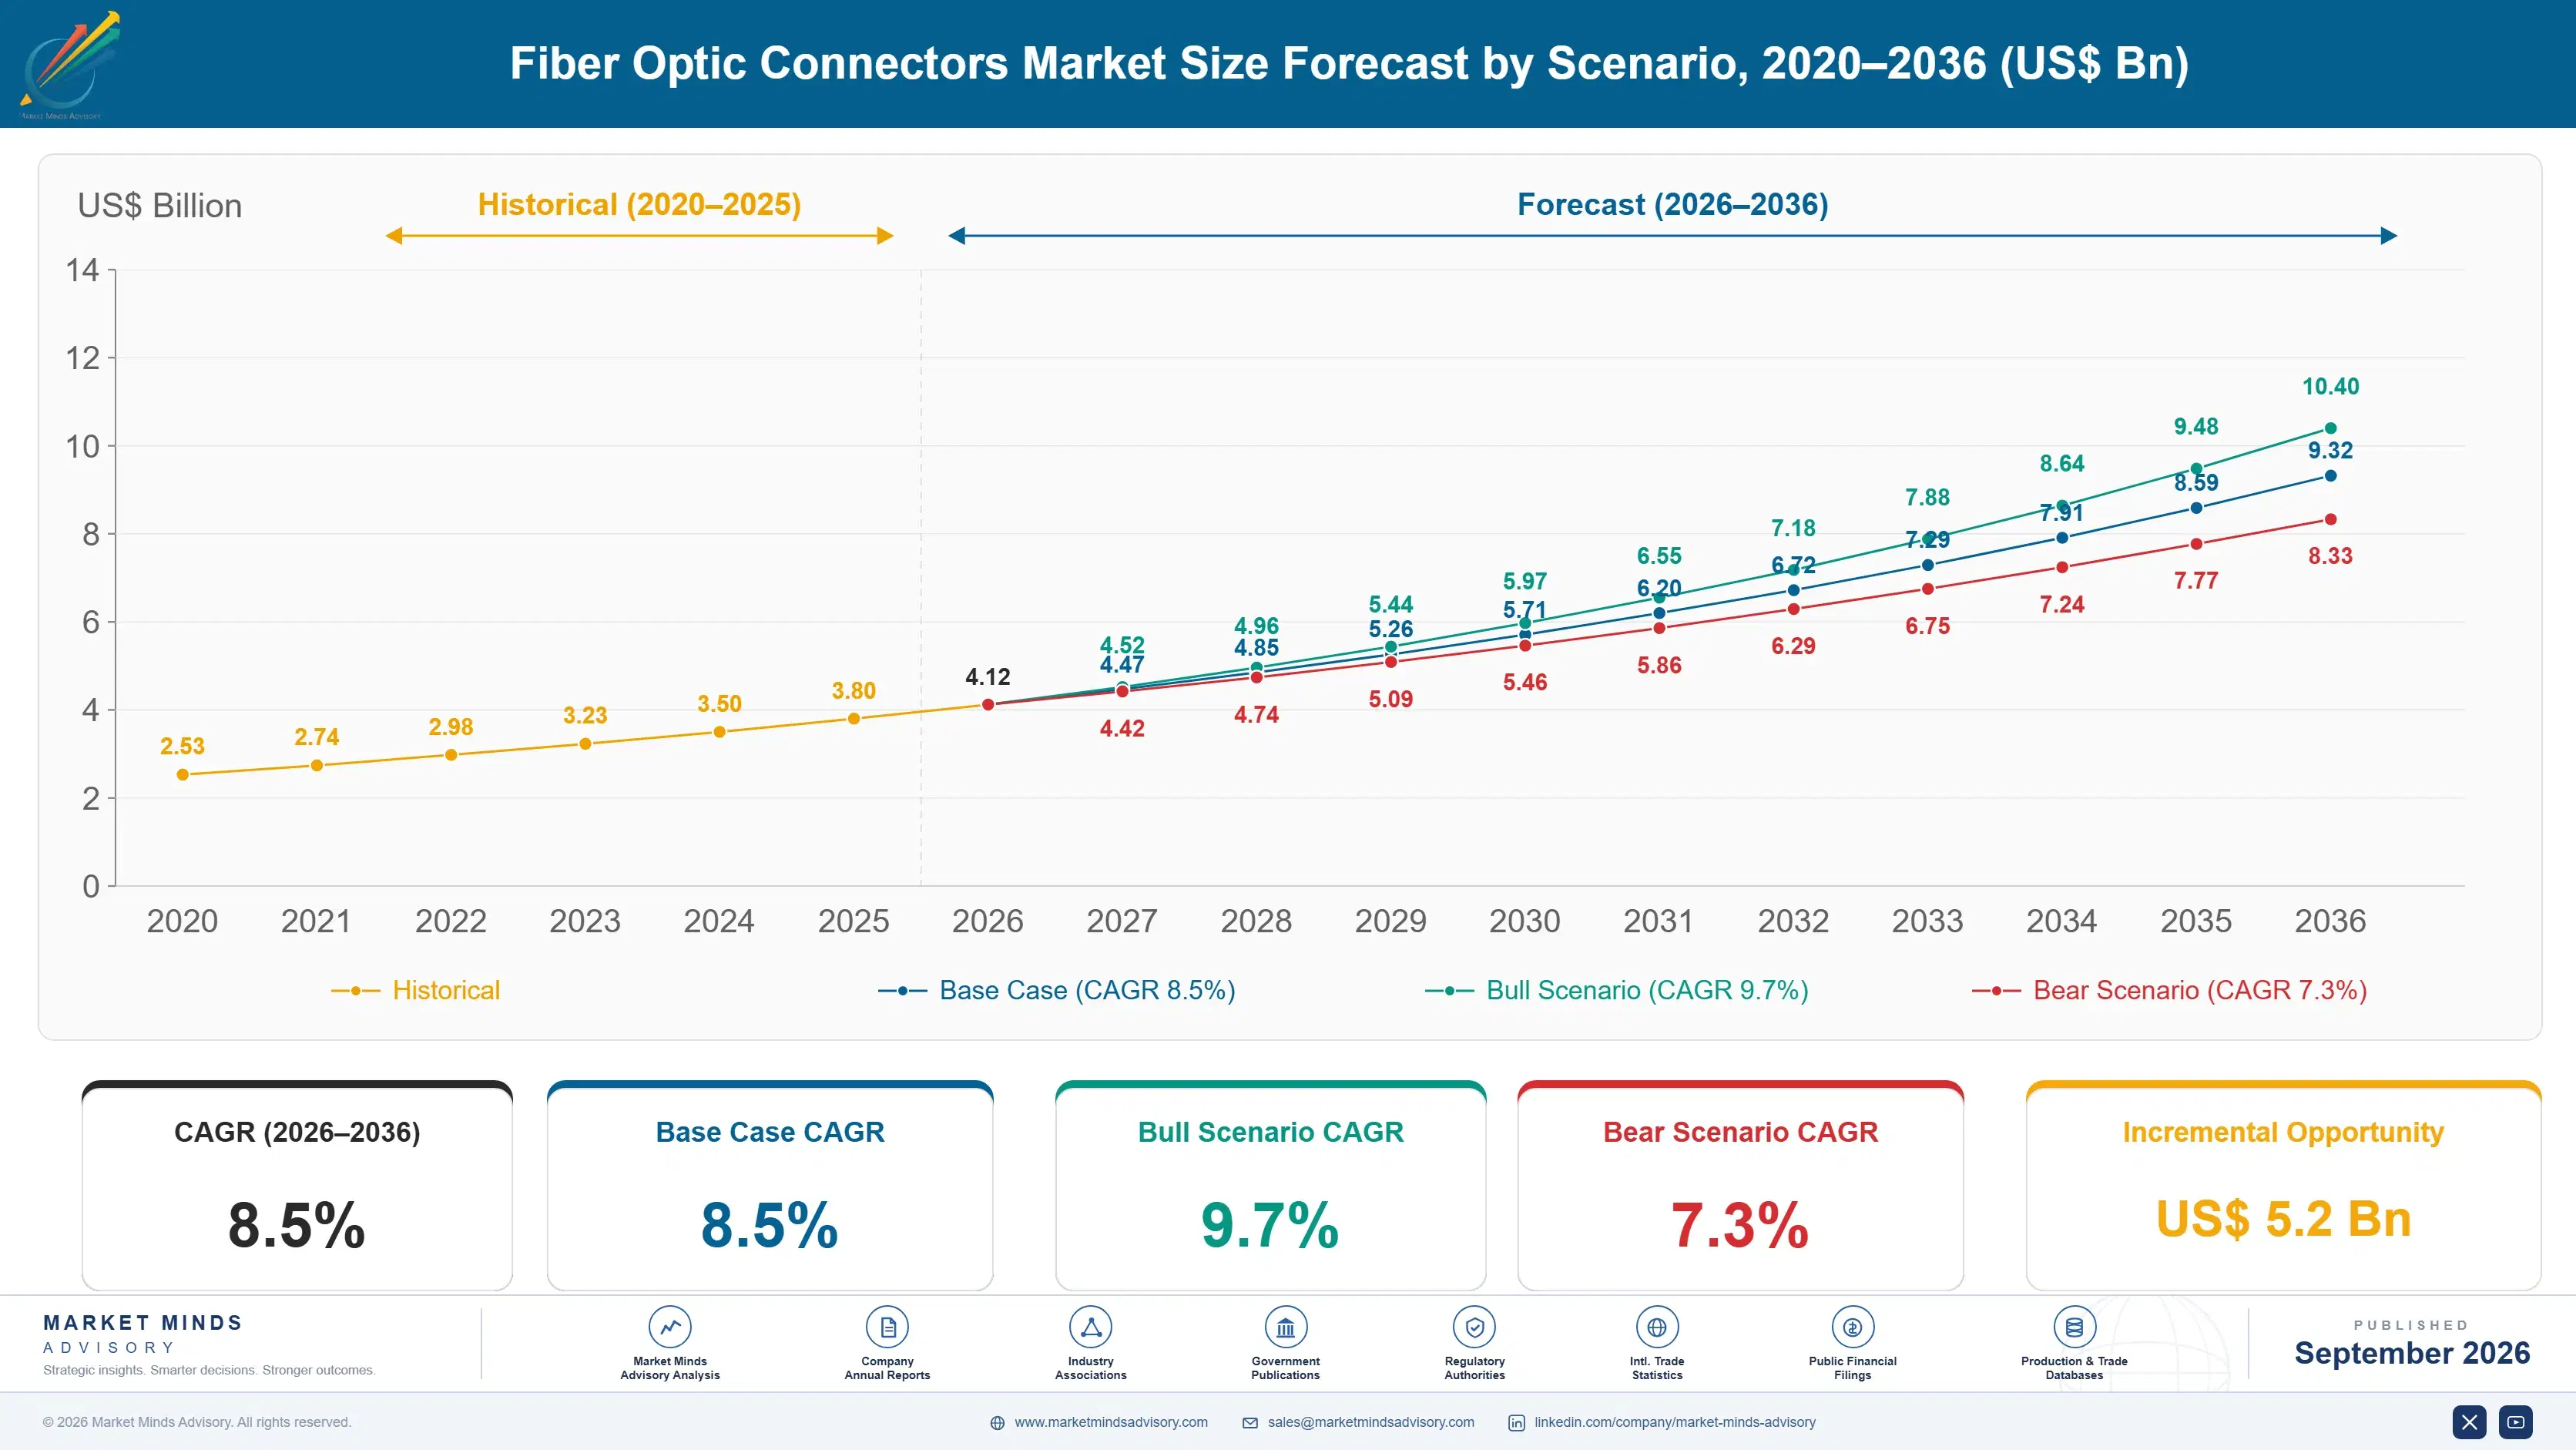
Fiber Optic Connectors Market Forecast Scenarios

fiber-optic-connector-market-size-forecast-scenario-1790007584620
Fiber optic connector demand grew steadily but unevenly across 2020 to 2025, as pandemic-era supply disruption slowed enterprise network upgrades even while telecom operators continued fiber broadband buildout largely uninterrupted throughout the period, given its status as essential infrastructure investment that stayed protected from most of the discretionary capital spending cuts seen elsewhere across the technology sector industry-wide during that stretch.
The base case assumes continued hyperscale data center capacity expansion, sustained government-backed fiber broadband subsidy programs across developing markets, and gradual enterprise migration from copper to fiber interconnect within campus networks. These three mechanisms together sustain double-digit growth in high-density connector formats even as legacy connector categories mature toward low single-digit growth rates by the decade's end, a divergence reshaping supplier product mix and manufacturing capacity allocation decisions across the industry.
A bull scenario centers on accelerated AI infrastructure buildout pulling connector demand well beyond current hyperscale capital expenditure plans industry-wide, forcing suppliers to add polishing capacity faster than currently planned. A bear scenario centers on a broader data center capital expenditure slowdown should AI investment returns disappoint investors, delaying planned capacity additions across the largest cloud operators globally.

Density and Precision Reshape Connector Economics

Connector demand increasingly tracks data center fiber density rather than aggregate cable mileage, since a single hyperscale rack now terminates far more fiber endpoints than an equivalent enterprise rack did five years earlier. This density shift is rewriting how suppliers plan manufacturing capacity and qualify new polishing lines against tightening customer specifications, particularly for the high-fiber-count MPO and MTP formats that hyperscale interconnect architectures increasingly favor.
MARKET CONCENTRATIONCR5 42%Moderately fragmented across many specialized precision component manufacturers
AVERAGE SELLING PRICE$1.20-$8.50Price varies sharply by connector format and fiber density
TOP PRODUCING REGIONEast Asia 44%Output heavily concentrated among established optical component manufacturers
TRADE INTENSITY58% Cross-BorderHigh share of finished output shipped across international borders
INPUT COST SHARE38% of COGSCeramic ferrules and precision polishing materials dominate total cost
REPLACEMENT CYCLE7-10 YearsConnectors rarely replaced absent a network topology change event
Commercial character has shifted from a largely commoditized telecom supply business toward a precision manufacturing discipline, where insertion loss performance and polish consistency increasingly determine hyperscale supplier qualification outcomes ahead of unit price. Suppliers unable to hold tight tolerances at volume increasingly lose qualification renewals to rivals who can, a shift that has compressed margins for legacy connector makers slow to modernize their polishing and inspection processes.
Automation in polishing and inspection, AI cluster architecture standardization, and continued fiber broadband subsidy programs will shape connector demand through the next decade across both hyperscale and telecom access network segments. Suppliers investing early in automated inspection capacity stand to capture disproportionate share as qualification standards keep tightening across hyperscale, telecom, and enterprise buyer segments alike over the coming decade.
"Connector suppliers spent a decade competing on price. The ones winning hyperscale qualification today compete on defect rates measured in parts per million instead."
Director, Optical Components and Interconnect Practice · MMA Technology Practice · September 2026

Market Trends

Hyperscale AI Clusters Drive High-Density Connector Adoption

Major cloud operators are deploying AI training clusters that require dramatically higher fiber density per rack than traditional enterprise networking, pushing MPO and MTP connector formats into positions previously held by simpler LC and SC connectors across data center interconnect layers. Several hyperscale operators have publicly disclosed capital expenditure plans exceeding tens of billions of dollars annually dedicated specifically to AI infrastructure buildout, a meaningful share of which flows toward fiber interconnect and optical component procurement across their global facility footprint, a spending pattern most industry forecasters expect to persist through the remainder of the decade.
Market Impact: FTTH connector demand up 11% yearly

Automated Polishing Equipment Lowers Manufacturing Defect Rates

Connector manufacturers are adopting automated polishing and inspection equipment that reduces insertion loss defect rates well below levels achievable through manual quality control processes used throughout most of the industry's history. This automation investment is reshaping competitive dynamics, since hyperscale customers increasingly require defect rates measured in single-digit parts per million before granting supplier qualification, a bar that only automated production lines can consistently clear across large manufacturing volumes without significant yield loss or costly downstream rework at the customer site, a cost that automated lines avoid almost entirely at meaningful production scale.
Market Impact: Enterprise fiber share up 6pp

Market Opportunities and Growth Drivers

Government Fiber Broadband Subsidy Programs Expand Access Networks

National broadband subsidy programs across multiple countries are funding fiber-to-the-home network expansion into previously underserved rural and suburban areas, directly driving connector demand for FTTH-specific formats deployed at the network edge and inside customer premises equipment. India's national broadband mission alone targets connecting several hundred million additional households to fiber networks over the coming years, requiring enormous volumes of outdoor-rated connectors engineered to withstand humidity, temperature swings, and rough field installation conditions across diverse terrain and climate zones nationwide, conditions that demand consistently reliable outdoor connector sealing and mechanical strain relief performance.
Market Impact: Legacy connector margins down 8pp

Enterprise Networks Migrate From Copper to Fiber Interconnect

Enterprise campus networks are gradually replacing copper interconnect with fiber to support higher bandwidth applications, video conferencing infrastructure, and distributed computing workloads that copper cabling increasingly struggles to support at required distances and speeds. This migration favors multi-mode connector formats optimized for shorter enterprise building runs, creating a growing replacement market distinct from both hyperscale data center and telecom access network segments, with its own qualification and pricing dynamics that reward suppliers offering simplified field-terminable connector designs that meaningfully reduce on-site installation labor time and total project deployment cost across large campus rollouts.
Market Impact: Ferrule lead times extend 8 weeks

Market Restraints and Challenges

Connector Standardization Pressure Compresses Legacy Product Margins

Industry-wide standardization efforts around MPO and MTP interfaces are commoditizing formats that once carried premium pricing for proprietary or semi-proprietary connector designs, a shift whose root cause lies in hyperscale buyers demanding multi-supplier interoperability to avoid single-source dependency risk. The commercial impact falls hardest on smaller specialty manufacturers that historically differentiated through proprietary interfaces rather than manufacturing scale. Several mid-tier suppliers are pursuing mitigation through vertical integration into ferrule and connector housing production, seeking cost advantages that partially offset lost pricing power on standardized connector formats going forward across most product lines.
Market Impact: MPO connector volume up 45% annually

Ceramic Ferrule Supply Concentration Creates Input Cost Risk

Precision ceramic ferrule production remains concentrated among a small number of specialized manufacturers primarily located in East Asia, creating input cost and supply risk whose root cause traces to the highly specialized zirconia processing and precision grinding equipment required, which few facilities worldwide can operate at qualification-grade tolerances. This concentration hands ferrule suppliers meaningful pricing power over connector assemblers. Some larger connector manufacturers are pursuing backward integration into ferrule production or qualifying second-source ferrule suppliers as mitigation against this ongoing concentrated supply exposure across their entire qualified ferrule vendor base.
Market Impact: Defect rates fall below 5 PPM
3 additional market trends, 3 additional growth drivers, and 3 additional restraints and challenges are covered in the full report. Contact sales@marketmindsadvisory.com to access the complete intelligence.

Segment CAGR and Growth Architecture

The Fiber Optic Connectors Market segments by connector product format and application, since insertion loss requirements, polish specifications, and density needs differ fundamentally between hyperscale interconnect, telecom access, and enterprise campus deployment contexts across the industry. This dimension reflects how buyers actually specify and qualify connectors rather than how suppliers organize internal product lines.
fiber-optic-connector-market-market-share-analysis-1790007585190

MPO/MTP High-Density Connectors for Hyperscale Data Center Interconnects

MPO and MTP high-density connectors terminate multiple fibers within a single ferrule, enabling the fiber density that AI training clusters and hyperscale interconnect architectures increasingly require across their rack-to-rack and pod-to-pod cabling layers. Demand here grows fastest because hyperscale operators are expanding AI infrastructure capital expenditure well beyond prior data center buildout cycles, and each new rack generation packs more fiber endpoints than the last. Suppliers qualified for these formats increasingly command premium pricing tied to defect rate performance rather than unit cost alone, a meaningful shift from prior telecom-driven connector market dynamics where unit price alone determined most supplier selection decisions across the broader industry for the better part of two decades.
CAGR 14.5%

Fiber Optic Connectors for FTTH Access Networks

FTTH connectors terminate fiber at the customer premises and within outdoor distribution cabinets, engineered to withstand field installation conditions that indoor data center connectors never encounter. This segment grows fastest among non-hyperscale categories because government broadband subsidy programs across multiple countries are funding fiber network expansion into previously underserved rural and suburban areas at a pace unmatched by prior private-sector-only rollout efforts. Suppliers offering simplified field-terminable connector designs increasingly win share from traditional factory-terminated pigtail approaches that require more skilled field labor and longer average installation windows per household connection, particularly across rural deployment areas where technician availability runs thin relative to urban markets with denser technician networks already in place.
CAGR 11.0%
Full segment breakdown across 6 segments available in the complete report.

Regional Architecture and Country Demand Map

Fiber optic connector demand concentrates wherever hyperscale data center construction and fiber broadband rollout intersect, with East Asia leading on manufacturing scale while North America anchors substantial hyperscale interconnect demand and South Asia leads on broadband access buildout pace worldwide today across every major national market.

North America

North American demand centers on hyperscale data center construction, where cloud operators are deploying AI training clusters that require dense MPO and MTP connector arrays across every rack and pod interconnect layer. Multiple hyperscale operators headquartered in the United States have disclosed capital expenditure plans exceeding tens of billions of dollars annually dedicated specifically to AI infrastructure buildout, a meaningful share of which flows toward optical interconnect procurement across their global facility footprint, sustaining connector demand well above the broader market's average growth pace through the forecast period as new facility construction continues across several major metropolitan and rural data center corridors alike, from established hyperscale campuses in Virginia and Oregon to newer build-out sites across Texas and the Southeast.
Share: 28% | CAGR: 9.0% (2026 to 2036)

Western Europe

Western European demand draws on telecom operator fiber network modernization and enterprise campus migration from copper to fiber interconnect, though hyperscale data center construction here trails the pace seen in the United States and East Asia. Germany, France, and the United Kingdom anchor most regional connector consumption, driven by national broadband target commitments and steady enterprise network refresh cycles across financial services and manufacturing sectors that continue upgrading legacy copper infrastructure toward higher-bandwidth fiber alternatives at a measured, well-established pace that continues even as hyperscale-driven demand growth accelerates elsewhere across the broader global market, with regional operators generally prioritizing incremental network upgrades over the large greenfield facility construction seen in the United States.
Share: 20% | CAGR: 7.0% (2026 to 2036)
Regional intelligence for 5 additional markets available in the complete report: East Asia, South Asia and Pacific, Latin America, Middle East and Africa, Eastern Europe. Contact sales@marketmindsadvisory.com.
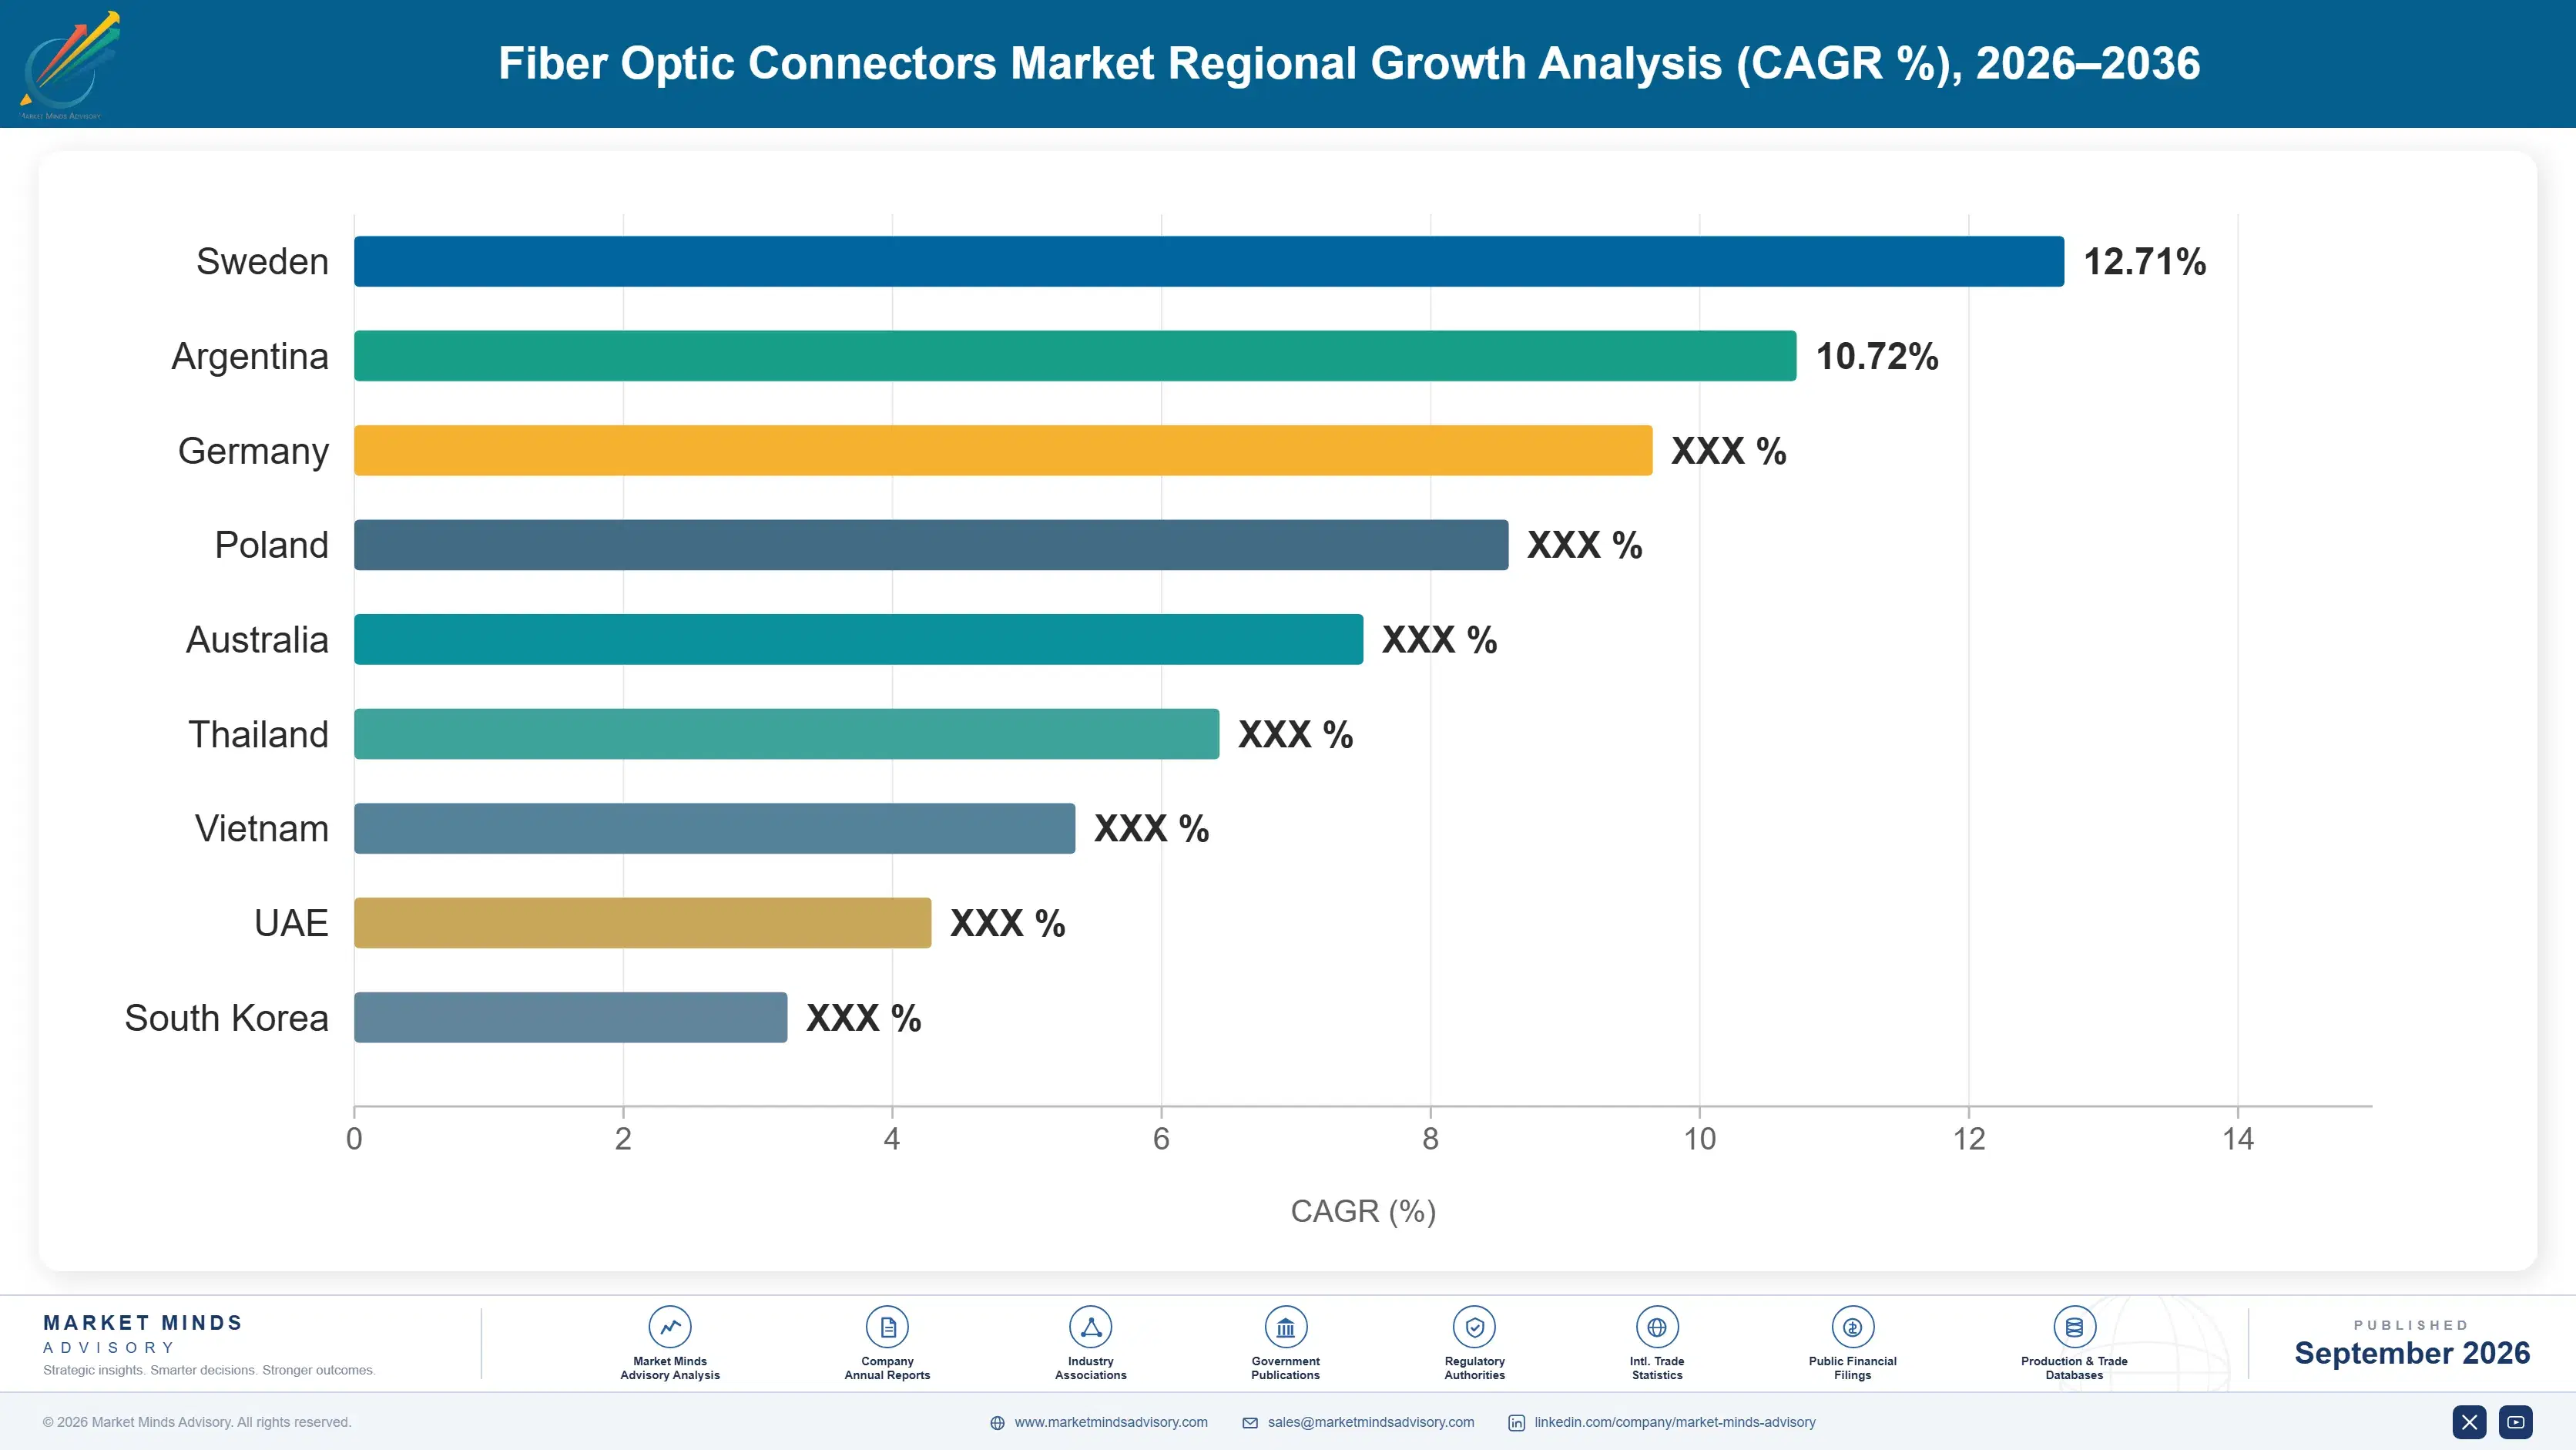
fiber-optic-connector-market-country-cagr-analysis-1790007585702

How Connector Suppliers Actually Capture Margin

Fiber optic connector suppliers capture value beyond baseline unit pricing through four commercial mechanisms that reward manufacturing precision and qualification depth over commodity volume alone across the whole industry. Hyperscale qualification programs, custom assembly services, ferrule vertical integration, and multi-year supply agreements all matter more today than spot pricing competition across this entire market.

Achieving Formal Hyperscale Supplier Qualification Status

Suppliers that clear hyperscale qualification programs capture premium pricing tied to defect rate performance rather than unit cost, since qualification typically requires demonstrating defect rates below 10 parts per million across sustained production volume. This qualification barrier locks in multi-year purchase commitments once cleared, since hyperscale buyers rarely requalify alternative suppliers absent a specific performance or supply problem, giving qualified suppliers meaningful pricing power and revenue visibility that unqualified rivals competing purely on price simply cannot access at all across their existing hyperscale relationships and pending qualification pipeline across every major hyperscale account they serve.
Market Impact: Qualified suppliers earn 15 to 25% pricing premiums

Offering Custom Assembly and Rapid Prototyping Services

Suppliers offering custom connector assembly configurations and rapid prototyping services for new data center or network architecture designs capture specialized project revenue beyond standard catalog connector sales. This service layer typically commands 20 to 30% higher margins than commodity catalog products, since customers value fast turnaround on custom specifications when deploying novel rack architectures ahead of broader industry standardization. Suppliers with in-house design engineering capability increasingly win these specialized project mandates over catalog-only competitors lacking equivalent technical support resources, comparable engineering staff depth, or matching the fastest available prototype turnaround speed in the market.
Market Impact: Custom assembly work adds 20 to 30% margin

Vertically Integrating Into Ceramic Ferrule Production

Connector manufacturers that vertically integrate into ceramic ferrule production capture margin previously paid to third-party ferrule suppliers, while simultaneously reducing exposure to the supply concentration risk affecting assemblers dependent on external ferrule sourcing. This integration typically requires capital investment often exceeding $20 million in specialized zirconia processing and precision grinding equipment, but pays back through both direct cost savings and improved supply reliability during periods of industry-wide ferrule shortage that regularly disrupt less integrated competitors' production schedules, customer delivery commitments, and overall delivered unit cost structure across every product line and customer segment they sell into.
Market Impact: Integration cuts ferrule input cost 12 to 18%

Securing Long-Term Multi-Year Hyperscale Supply Agreements

Suppliers that negotiate multi-year supply agreements with hyperscale operators lock in predictable revenue tied to disclosed capital expenditure and facility construction roadmaps, rather than competing project-by-project against spot market pricing pressure. These agreements typically span 3 to 5 years aligned with hyperscale facility construction cycles, providing suppliers the revenue visibility needed to justify capacity expansion investment decisions with genuine confidence. This approach favors established suppliers with dedicated hyperscale account teams over smaller rivals competing purely on transactional, order-by-order volume relationships lacking any forward volume, pricing, or capacity reservation commitment whatsoever.
Market Impact: Supply agreements typically span 3 to 5 years

Who Controls the Margin Pool

Five firms hold roughly 42% of global fiber optic connector revenue, a moderate concentration level reflecting the precision manufacturing and hyperscale qualification barriers that separate leaders from a long tail of smaller regional producers. Corning and Amphenol lead through decades of optical component manufacturing scale, while the gap to challenger firms remains wide on hyperscale qualification depth specifically, though that gap narrows steadily in telecom-focused connector categories.
Current competitive activity centers on automated polishing capacity expansion, MPO and MTP format qualification programs, and backward integration into ceramic ferrule production, as suppliers race to meet tightening hyperscale defect rate requirements. Specialized connector makers increasingly compete directly against larger diversified interconnect manufacturers for hyperscale qualification slots, a contest that increasingly rewards manufacturing precision and defect rate consistency over simple production scale or headline unit pricing.

Emerging pressure comes from vertically integrated hyperscale operators exploring in-house connector assembly for their most specialized rack configurations, potentially disintermediating traditional suppliers on the highest-volume, highest-margin product lines. Rankings shift fastest in high-density hyperscale formats, where suppliers with early automated inspection investment increasingly out-compete established telecom-focused rivals lacking comparable manufacturing precision, automated inspection capacity, or dedicated hyperscale account relationships built over several years.
fiber-optic-connector-market-company-positioning-matrix-1790007586227

Competitive Moat and Risk Dimensions

CORNING INCORPORATED

Moat: Vertically Integrated Ferrule Production

Corning's ownership of both fiber and connector component manufacturing gives it cost and supply reliability advantages that pure assemblers cannot match, particularly during industry-wide ferrule shortage periods when vertically integrated capacity becomes a decisive competitive advantage across large hyperscale accounts that value uninterrupted delivery schedules above nearly everything else.
CORNING INCORPORATED

Risk: High Fixed Manufacturing Cost Base

Corning's extensive vertical integration carries a heavy fixed cost base that becomes a disadvantage during demand downturns, when asset-light assemblers can scale production down faster and preserve margin more effectively than a fully integrated manufacturer carrying substantial owned capital equipment across multiple specialized production facilities worldwide.
AMPHENOL CORPORATION

Moat: Broad Multi-Format Product Portfolio Depth

Amphenol's presence across nearly every connector format and application segment lets it serve hyperscale, telecom, and enterprise customers from a single relationship, reducing customer procurement complexity and giving Amphenol cross-selling opportunities that narrower specialist competitors simply cannot access given their narrower single-category product focus and smaller overall account footprint.
AMPHENOL CORPORATION

Risk: Diluted Specialization in Fastest Segments

Amphenol's broad portfolio focus means it invests somewhat less intensively in the highest-density hyperscale formats than pure-play specialists, risking share loss in the fastest-growing segment to competitors dedicating their entire engineering and manufacturing focus specifically and exclusively to that single fastest-growing hyperscale interconnect connector category alone.

Players Tracked

Prominent Players

Corning Incorporated
Amphenol Corporation
US Conec
Senko Advanced Components
Furukawa Electric

Other Key Players

TE Connectivity
Fujikura
Sumitomo Electric Industries
Panduit
CommScope
Molex
Diamond SA
Optical Cable Corporation
HUBER+SUHNER
Radiall
Nexans
Prysmian Group
LEONI
Yamaichi Electronics
Shenzhen Gongjin Electronics

Recent Developments

FEBRUARY 2026

Corning Expands Ferrule Manufacturing Capacity to Meet Hyperscale Demand

Corning announced a capacity expansion at its ceramic ferrule manufacturing facility, adding production lines dedicated to meeting rising hyperscale demand for high-density MPO and MTP connector formats. The expansion reflects Corning's strategy of maintaining vertical integration advantages as hyperscale qualification requirements around defect rate performance continue tightening across the industry.
Signal: Signals vertically integrated suppliers are investing capacity ahead of anticipated hyperscale demand growth curves over the coming years.
SEPTEMBER 2025

Amphenol Acquires Specialty Connector Manufacturer to Expand Format Portfolio

Amphenol completed the acquisition of a specialty connector manufacturer with established high-density format expertise, adding engineering talent and existing hyperscale customer relationships to its broader portfolio. The acquisition strengthens Amphenol's position in the fastest-growing hyperscale segment against specialist competitors that had held an edge there.
Signal: Signals diversified connector manufacturers increasingly prefer acquiring specialist expertise rather than building it organically from scratch.
MAY 2025

US Conec Forms Supply Agreement With Major Hyperscale Operator

US Conec entered a multi-year supply agreement with a major hyperscale cloud operator covering high-density MPO connector formats across the operator's global data center construction pipeline. The agreement includes committed capacity reservations tied to the operator's disclosed AI infrastructure buildout roadmap through the decade's end.
Signal: Signals hyperscale operators are locking in dedicated supplier capacity well ahead of anticipated future industry-wide supply constraints.

Ceramic Ferrule Concentration Drives Cost Exposure

Ceramic ferrules and precision polishing consumables account for roughly 38% of connector manufacturing cost, sourced primarily from a small number of specialized zirconia processing facilities concentrated in Japan, Taiwan, and China. This geographic concentration means most connector assemblers worldwide, regardless of their own manufacturing location, depend on the same narrow East Asian supply base for their single largest cost input.
A documented ferrule shortage during 2024 pushed lead times out to 8 to 10 weeks and raised ferrule prices by roughly 22%, according to Japan's METI industrial supply chain monitoring reports, as multiple simultaneous hyperscale data center buildout programs competed for the same limited zirconia processing capacity. Several connector assemblers delayed customer deliveries by four to six weeks as a direct consequence, straining hyperscale qualification relationships that depend heavily on delivery reliability.

Smaller connector assemblers face a genuine competitive disadvantage here since they lack the purchase volume needed to secure priority allocation from constrained ferrule suppliers during shortage periods, unlike larger vertically integrated manufacturers. This dynamic favors companies like Corning that produce ferrules internally, while assembly-only competitors increasingly pursue long-term supply contracts or partial backward integration as mitigation against recurring supply volatility.
fiber-optic-connector-market-cost-volatility-analysis-1790007586431

Backward Integration Into Ferrule Production

Larger connector manufacturers are pursuing backward integration into ceramic ferrule production, reducing dependence on external supply and capturing margin previously paid to third-party ferrule vendors. This approach requires meaningful upfront capital investment in specialized processing equipment but pays back through improved supply reliability during shortage periods and reduced exposure to future ferrule price volatility overall.

Qualifying Multiple Second-Source Ferrule Suppliers

Assembly-focused manufacturers are qualifying second and third ferrule suppliers beyond their primary vendor, reducing single-source dependency risk even if it means carrying slightly higher qualification and testing overhead costs across multiple approved vendor relationships simultaneously, a tradeoff most now consider worthwhile given recent shortage experience across the industry and the real cost of missed hyperscale delivery deadlines.

Negotiating Long-Term Ferrule Supply Contracts

Mid-sized connector assemblers are negotiating multi-year ferrule supply contracts with committed volume and pricing terms, trading some short-term flexibility for protection against future price spikes and improved allocation priority during periods of industry-wide supply constraint, particularly during the peak hyperscale buildout years still ahead when spot market pricing is expected to run consistently well above contract rates.

Portfolio Architecture for Margin Defence

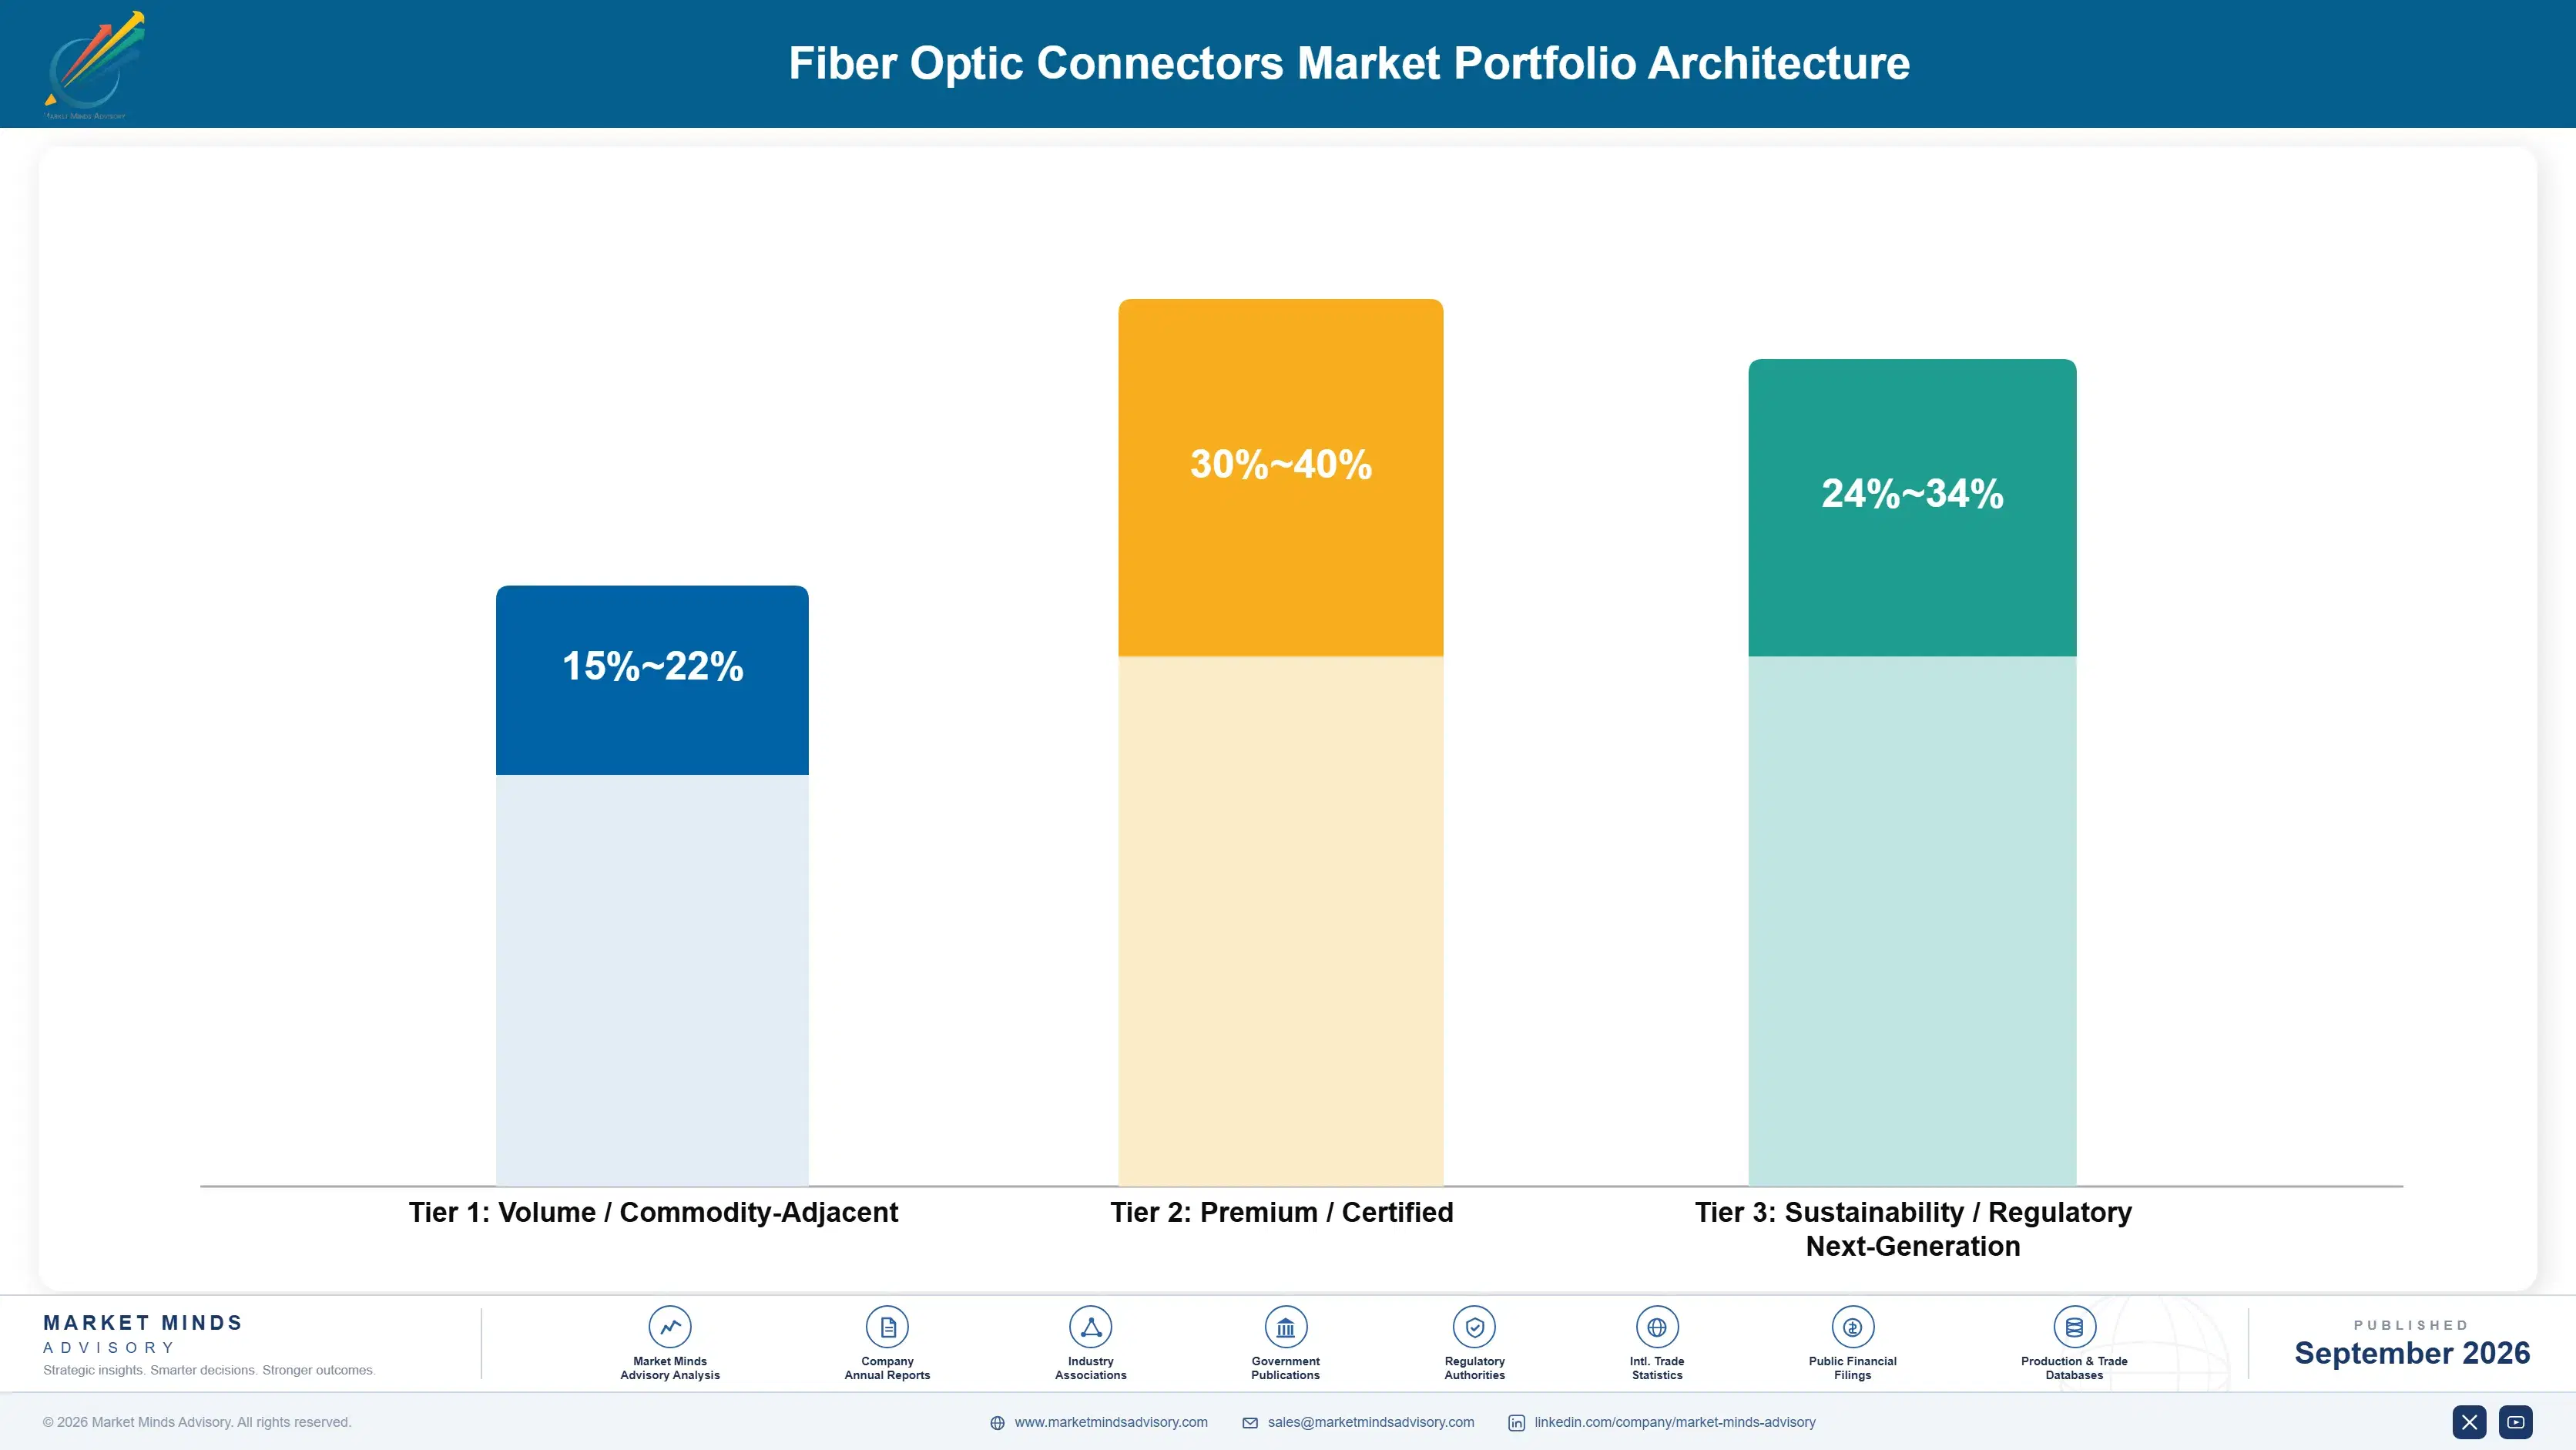
Margin architecture in fiber optic connectors splits between commoditized standard LC and SC formats and specialized high-density MPO or MTP hyperscale interconnect products. Standard formats run thin gross margins given intense competitive bidding among many qualified manufacturers worldwide, while hyperscale-qualified high-density formats command substantially richer margins tied to defect rate performance and manufacturing precision that only a smaller pool of suppliers can consistently deliver.
Volume telecom and enterprise connector sales still generate the majority of industry revenue today, but margin economics increasingly favor premium hyperscale-qualified formats as AI infrastructure buildout accelerates well beyond prior data center construction cycles. Suppliers positioned only in commoditized legacy formats face genuine margin pressure as buyers push pricing down through competitive tenders each cycle, forcing many to pursue hyperscale qualification as a defensive necessity rather than a pure growth opportunity.

High-value margin pools concentrate in hyperscale-qualified high-density connectors, custom assembly services, and vertically integrated ferrule production, where specialized manufacturing precision commands premium pricing that generalist commodity connector production simply cannot match across the broader competitive landscape today. Suppliers building genuine hyperscale qualification depth and ferrule vertical integration together increasingly capture the richest margin pools within the entire industry.

Volume / Commodity-Adjacent

Standard LC and SC connector formats for telecom access and general enterprise networking, bid competitively among many qualified manufacturers worldwide with limited differentiation beyond delivery speed, unit price, and basic quality consistency across large production runs.
Gross Margin: 15-22%

Premium / Certified

Hyperscale-qualified MPO and MTP high-density formats priced for defect rate performance and manufacturing precision credentials that only a smaller pool of suppliers can consistently deliver at the volume and reliability hyperscale customers demand.
Gross Margin: 30-40%

Sustainability / Regulatory / Next-Generation

Next-generation ultra-high-density connector formats and automated field-terminable designs positioned ahead of emerging AI cluster architecture standards, commanding premium early-mover pricing before wider competitive entry compresses these margins across the broader market.
Gross Margin: 24-34%
fiber-optic-connector-market-portfolio-architecture-1790007586938

High-value Sub-segments and Strategic Watch-out

MPO/MTP High-Density Connectors for Hyperscale Data Center Interconnects

The fastest-growing and highest-value segment, combining a 14.5% forecast CAGR with premium margins tied to hyperscale qualification barriers and manufacturing precision. Suppliers with automated inspection capacity and defect rate performance capture the richest growth and margin combination across the entire connector market today, well ahead of every other product category.
Gross Margin: 32-40%

Fiber Optic Connectors for FTTH Access Networks

A high-value segment growing at 11.0% annually, tied to government broadband subsidy programs funding rural fiber network expansion worldwide. Margin economics here trail hyperscale formats though overall deployment volume remains substantial across multiple developing markets simultaneously, sustained by continued government infrastructure funding commitments through the forecast period.
Gross Margin: 22-28%

Multi-Mode Fiber Optic Connectors for Data Center and Enterprise Networks

The volume core of the market, generating the bulk of current industry revenue through standard enterprise and legacy data center connector sales, though maturing enterprise refresh cycles are slowing overall segment growth toward the market's lower end over the coming forecast period across most developed economies.
Gross Margin: 16-22%

Ruggedized and Hardened Fiber Connectors for Outside Plant and Military Applications

A strategic watch-out segment where specialized military and outside plant connector demand faces gradual pressure from defense budget uncertainty and slower legacy telecom infrastructure replacement cycles across several major national markets, a category facing gradual, sustained decline relative to the broader connector market over the coming decade.
Gross Margin: 20-28%

Where Connector Revenue Actually Recurs

Fiber optic connector revenue builds annuity-like characteristics through hyperscale qualification relationships and multi-year supply agreements, rather than through one-time catalog transactions. Hyperscale customers rarely requalify alternative suppliers once qualification clears, since replacing an established supplier requires re-validating defect rate performance across a full production cycle at real cost, schedule risk, and potential network downtime exposure that most customers strongly prefer to avoid entirely.
Adoption depth varies meaningfully by end-use vertical: hyperscale data center customers show the deepest supplier lock-in, since production-critical interconnect infrastructure cannot tolerate qualification transition risk once operational, while telecom access network customers show comparatively shallower stickiness given more standardized formats and multiple qualified alternative suppliers. Enterprise campus customers sit in between, with switching costs tied closely to network scale and installed base size.

A generational shift in buyer profile is underway as data center infrastructure and procurement teams, not just telecom network planning engineers, increasingly drive connector purchasing decisions. These newer buyers evaluate suppliers on defect rate performance and supply reliability metrics rather than pure unit price specifications, reshaping how suppliers must position, sell, and structure ongoing account relationships with their largest hyperscale customers going forward.
fiber-optic-connector-market-end-use-penetration-index-1790007587432

Where to Compete in Connectors

These are among the four positions where our research anticipates prominent divergence between winners and laggards over the coming forecast period. Each is grounded in the demand model, the regulatory perimeter, and the announced capacity pipeline.
01 / HYPERSCALE QUALIFICATION DEPTH

Prioritize hyperscale qualification programs over commodity catalog volume

MPO and MTP high-density connectors for hyperscale interconnects are growing at 14.5% annually, more than seventy percent faster than the market's average pace, yet many mid-tier suppliers still compete primarily on commodity catalog pricing rather than pursuing formal qualification programs. Suppliers that invest in automated polishing and inspection capacity now will capture disproportionate share as hyperscale AI infrastructure buildout accelerates over the next several years. Waiting until qualification barriers rise further cedes this position to already-invested competitors that moved first on qualification and automated inspection capacity.
02 / FERRULE VERTICAL INTEGRATION

Pursue backward integration into ferrule production to control cost

Ceramic ferrules account for roughly 38% of connector manufacturing cost, and a documented shortage during 2024 pushed prices up by roughly 22% while extending lead times industry-wide. Assembly-only manufacturers without vertical integration face real cost and supply disadvantages against integrated rivals like Corning that control their own ferrule production. Mid-sized suppliers should pursue partial backward integration or long-term supply contracts rather than continuing to rely purely on spot market ferrule purchasing during periods of tightening industry-wide supply availability and rising hyperscale qualification requirements around delivery reliability.
03 / RECURRING REVENUE STRUCTURES

Convert qualification wins into multi-year hyperscale supply agreements

Suppliers that negotiate multi-year supply agreements with hyperscale operators capture revenue visibility tied to disclosed capital expenditure roadmaps rather than competing project-by-project against spot market pricing. These agreements typically span three to five years aligned with facility construction cycles, providing the confidence needed to justify capacity expansion decisions. Firms still selling purely transactional catalog orders should prioritize building these longer-term relationships before rivals establish them first across the same hyperscale accounts each supplier is targeting, since qualification alone no longer guarantees ongoing volume.
04 / FTTH ACCESS NETWORK EXPANSION

Build outdoor-rated FTTH connector capacity ahead of subsidy rollout

FTTH connectors are growing at 11.0% annually, driven by national broadband subsidy programs in India and other developing markets targeting hundreds of millions of new fiber-connected households. Suppliers without field-terminable, outdoor-rated connector designs face disadvantages against rivals already qualified for these programs and their specific climate and installation requirements. Manufacturers should invest in simplified field-terminable designs now, well ahead of national subsidy programs reaching their peak disbursement volume over the next several years across every major participating national market and regional subsidy program.

Engagement Snapshot From the Field

A live engagement with an industry participant carrying material or product regulatory and market exposure ahead of a defining policy shift, showing how our research translates into a defensible multi-year portfolio strategy.
MARKET MINDS ADVISORY · CLIENT ENGAGEMENT SUMMARY
Fiber Optic Connectors Producer Strategic Portfolio Review and Transition Roadmap 2026·Investment Scenario on Fiber Optic Connectors Exposure Evaluation 2025-26
CLIENT PROFILE
The client is a global hyperscale cloud operator expanding AI training cluster capacity across multiple continents, with annual data center capital expenditure reportedly exceeding $30 billion (client-reported, unverified by MMA). The operator's procurement organization sought to diversify its qualified connector supplier base beyond two incumbent vendors that had historically supplied the vast majority of MPO and MTP connector volume across its global facility footprint.
STRATEGIC CHALLENGE
The client faced growing supply concentration risk after a 2024 ferrule shortage delayed several planned facility openings by multiple weeks, exposing the fragility of relying on just two qualified suppliers for a component critical to every new rack deployment. Leadership needed an objective framework for evaluating and qualifying additional suppliers without compromising the defect rate standards their AI cluster architecture required.
MMA APPROACH
MMA conducted a structured supplier capability assessment across twelve candidate connector manufacturers, evaluating manufacturing automation depth, ferrule sourcing resilience, and historical defect rate performance data disclosed through supplier interviews. The engagement combined primary interviews with the client's procurement and engineering teams alongside site-level capability scoring against the client's existing qualification benchmark criteria.
KEY FINDINGS
  1. Only four of twelve candidate suppliers met the client's defect rate threshold consistently across multiple production batches reviewed during the assessment period.
  2. Suppliers with backward integration into ferrule production showed meaningfully more stable lead times during simulated demand spike scenarios modeled across the engagement.
  3. Geographic diversification beyond the client's existing East Asian supplier base reduced simulated single-region disruption exposure by roughly 40% under the modeled stress testing scenarios.
  4. Two candidate suppliers offered custom high-density formats that could reduce the client's per-rack connector count by approximately 15%, lowering total installed cost.
CLIENT PROFILE
The client is a global hyperscale cloud operator expanding AI training cluster capacity across multiple continents, with annual data center capital expenditure reportedly exceeding $30 billion (client-reported, unverified by MMA). The operator's procurement organization sought to diversify its qualified connector supplier base beyond two incumbent vendors that had historically supplied the vast majority of MPO and MTP connector volume across its global facility footprint.
STRATEGIC CHALLENGE
The client faced growing supply concentration risk after a 2024 ferrule shortage delayed several planned facility openings by multiple weeks, exposing the fragility of relying on just two qualified suppliers for a component critical to every new rack deployment. Leadership needed an objective framework for evaluating and qualifying additional suppliers without compromising the defect rate standards their AI cluster architecture required.
MMA APPROACH
MMA conducted a structured supplier capability assessment across twelve candidate connector manufacturers, evaluating manufacturing automation depth, ferrule sourcing resilience, and historical defect rate performance data disclosed through supplier interviews. The engagement combined primary interviews with the client's procurement and engineering teams alongside site-level capability scoring against the client's existing qualification benchmark criteria.
KEY FINDINGS
  1. Only four of twelve candidate suppliers met the client's defect rate threshold consistently across multiple production batches reviewed during the assessment period.
  2. Suppliers with backward integration into ferrule production showed meaningfully more stable lead times during simulated demand spike scenarios modeled across the engagement.
  3. Geographic diversification beyond the client's existing East Asian supplier base reduced simulated single-region disruption exposure by roughly 40% under the modeled stress testing scenarios.
  4. Two candidate suppliers offered custom high-density formats that could reduce the client's per-rack connector count by approximately 15%, lowering total installed cost.
RECOMMENDED STRATEGY
Phase 1: Phase 1 (Qualification): Formally qualify two additional suppliers meeting defect rate and manufacturing automation benchmarks within the next two fiscal quarters of operation. Phase 2: Phase 2 (Diversification): Shift 25% of total connector procurement volume to newly qualified suppliers over the following twelve calendar months of the program. Phase 3: Phase 3 (Resilience): Negotiate multi-year supply agreements with all qualified suppliers, including committed capacity reservation, pricing, and delivery reliability clauses.
OUTCOME
The client qualified two additional suppliers within the recommended timeframe and began shifting incremental volume as planned. Internal tracking reportedly showed a 35% reduction in single-supplier concentration risk within twelve months (client-reported, unverified by MMA), alongside improved delivery reliability during a subsequent minor supply disruption that year.

Frequently Asked Questions

Foundational context covering the market sizes, CAGR, scope, country, region and competition that inform every finding below. This section is provided to cover basics and most often pre-purchase conversations, answered from the MMA Primary Research Dataset.

What is the current size of the Fiber Optic Connectors Market?

The Fiber Optic Connectors Market reached $3.8 billion in 2025, driven by hyperscale data center buildout and continued global fiber broadband network expansion across developing markets.

How large will the Fiber Optic Connectors Market be by 2036?

The market is projected to reach $9.32 billion by 2036, more than doubling from the 2026 base as high-density connector formats capture a growing share of total volume.

What is the CAGR for the Fiber Optic Connectors Market 2026 to 2036?

The market is forecast to grow at an 8.5% compound annual rate between 2026 and 2036, with high-density hyperscale formats growing considerably faster than legacy connector categories.

Which segment is growing fastest?

MPO and MTP high-density connectors for hyperscale data center interconnects lead at 14.5% CAGR, roughly 1.71 times the overall market's average growth pace through the forecast period.

Who are the major companies in the Fiber Optic Connectors Market?

Corning Incorporated, Amphenol Corporation, US Conec, Senko Advanced Components, and Furukawa Electric lead the market, together holding roughly 42% of global connector revenue across all product formats.

Which country is growing fastest?

India leads country-level growth at roughly 13.0% CAGR, driven by its national broadband mission targeting several hundred million additional fiber-connected households across rural and suburban regions.

Report Segmentation Architecture

The full report scope spans multiple orthogonal segmentation dimensions, with cross-tabulated demand data provided for each dimension pair. Coverage extends further to regional breakdowns, trend trajectories, and the competitive detail needed to support segment-level decision-making.

By Connector Format

  • LC Connectors
  • SC Connectors
  • ST Connectors
  • MPO/MTP Connectors
  • FC Connectors
  • Others

By End-Use Industry

  • Telecommunications
  • Data Centers
  • Enterprise Networking
  • Government and Defense
  • Healthcare and Industrial

By Commercial Dimension

  • OEM Direct Sales
  • Distributor Channel
  • Custom Assembly Services
  • Aftermarket Replacement

By Region

  • North America
  • Western Europe
  • East Asia
  • South Asia and Pacific
  • Latin America
  • Middle East and Africa
  • Eastern Europe

Scope, Methodology, and Coverage

Every figure in this report is reproducible from documented input assumptions. The scope below maps the historical period, the forecast horizon, the segmentation dimensions, and the countries covered, alongside the underlying primary and qualitative methodology.
Historical Period
2020 to 2025
Forecast Period
2026 to 2036
Base Year
2025 (USD billions; MMA Primary Research Dataset, September 2026)
Market Definition
The Fiber Optic Connectors Market covers precision interconnect components, including LC, SC, ST, MPO, and MTP connector formats, used to terminate and join optical fiber cable in telecom, data center, and enterprise networks. It excludes fiber optic cable manufacturing itself, active optical transceivers, and network switching equipment.
Quantitative Units
USD billions (current prices); connector unit shipment volume where applicable
Segmentation Dimensions
By Connector Format; By End-Use Industry; By Commercial Dimension; By Region
Regions Covered
North America, Western Europe, East Asia, South Asia and Pacific, Latin America, Middle East and Africa, Eastern Europe
Countries Covered
USA, China, Germany, France, UK, Japan, South Korea, India, Australia, Canada, Brazil, Mexico, Indonesia, Vietnam, Thailand, Malaysia, UAE, Saudi Arabia, South Africa, Nigeria, Turkey, Poland, Netherlands, Italy, Spain, Sweden, Switzerland, Argentina, Colombia, Singapore, and additional markets relevant to this sector
Key Companies Profiled
Corning Incorporated, Amphenol Corporation, US Conec, Senko Advanced Components, Furukawa Electric, TE Connectivity, Fujikura, Sumitomo Electric Industries, Panduit, CommScope, Molex, Diamond SA, Optical Cable Corporation, HUBER+SUHNER, Radiall, Nexans, Prysmian Group, LEONI, Yamaichi Electronics, Shenzhen Gongjin Electronics
Quantitative Methodology
Primary survey, n=3,800 respondents, Q4 2025, six countries; demand-side model with trade association cross-validation
Qualitative Methodology
47 expert interviews, Q4 2025; applied to validate demand model assumptions, identify emerging dynamics, and assess competitive positioning
Report Format
PDF and XLSX data workbook (Word format preview document)
Publisher
Market Minds Advisory
Report Code
MMA-2026-TEC-101
Published
September 2026
Contact
sales@marketmindsadvisory.com | www.marketmindsadvisory.com

Purchase the full Fiber Optic Connectors Market Report (2026 to 2036).

This report delivers a comprehensive analysis of the global Fiber Optic Connectors Market, covering sizing, segmentation, regional dynamics, and competitive positioning through 2036. It profiles the twenty leading connector manufacturers. The analysis examines hyperscale qualification barriers shaping supplier economics, and it quantifies input cost exposure tied to ceramic ferrule supply concentration across the industry's global manufacturing base. Readers gain access to detailed regional demand mechanisms across all seven global regions, alongside forward-looking scenario analysis spanning bull, base, and bear growth cases through the full ten-year 2026 to 2036 forecast period covered in this report.
Ten-year market sizing and forecast model
Twenty-company competitive benchmarking and profiling analysis
Seven-region demand and CAGR breakdown tables
Hyperscale qualification barrier and defect rate analysis
Input cost and ferrule supply risk assessment
Revenue lever and margin architecture framework

Built For The People Who Decide

From boardroom strategy to bench-side execution, this report is read cover-to-cover by leaders shaping the next decade of their industry, turning demand scenarios, market dynamics and valuation benchmarks into decisions.
CXOs/ Presidents/ VPs/ Managers
M&A and Corporate Development
Strategy Teams and R&D Heads
Procurement and Product Directors
Regulatory and Compliance Leaders
Investor Relations and Equity Analysts