Market Minds Advisory
Fiber Optic Connectivity Market

Fiber Optic Connectivity Market: Fiber Optic Connectivity Market. Optical Networks Racing To Keep Pace With AI Data Center Bandwidth

AI data center clusters are consuming optical transceivers and fiber cable faster than manufacturers can expand production, forcing hyperscalers into multi-year supply agreements just to secure the bandwidth their GPU clusters require.

Lead Analyst

Published

September 2026

Make Smarter Decisions with Customized Research Insights

Request a free sample report and evaluate market opportunities, growth trends, and competitive dynamics relevant to your business needs.

2025 MARKET VALUE$12.6BMarket Size 2025
2036 FORECAST VALUE$32.5BBase Case , 2026 to 2036
CAGR 2026 TO 20369.0 %Bull 10.3% / Bear 7.7%
INCREMENTAL OPPORTUNITY$18.8BNet 10- year value creation
EXPANSION MULTIPLE2.37x2036 value over 2026 base
Strategic Levers
M&A Pipeline
Regional Outlook
Country Rankings
Competitive Intelligence
Segmental Deep-dive
Call-Us : 91 93563 13602

Executive Snapshot and Market Trajectory.

AI data center clusters are consuming optical transceivers and fiber cable faster than manufacturers can expand production, forcing hyperscalers into multi-year supply agreements just to secure the interconnect bandwidth their GPU clusters require to function at the massive scale generative AI training now demands across the entire industry supply chain.
Data center interconnect and fiber-to-the-home broadband adopt fiber optic connectivity fastest, driven respectively by AI cluster bandwidth demand and national broadband expansion programs, and East Asia leads production given its concentration of both fiber cable manufacturing and cable system deployment scale, with telecom operators increasingly consolidating cable, connector, and transceiver procurement into single supplier relationships rather than sourcing each component category separately from a fragmented field of specialized regional suppliers.
Competitive intensity now centers on transceiver speed and manufacturing capacity rather than raw cable pricing, as Corning and Prysmian Group defend leading material science and manufacturing positions while Chinese suppliers push aggressive capacity expansion, and evolving submarine cable geopolitical concerns increasingly shape which vendors clear procurement review at government and hyperscaler buyers navigating sensitive national security and infrastructure resilience concerns across multiple allied jurisdictions closely.
Market Definition
The Fiber Optic Connectivity market covers optical fiber cable, connectors, and transceiver components used to transmit data as light signals across telecommunications, data center, and broadband access networks. It excludes copper-based networking cable, wireless transmission equipment, and network switching hardware that does not directly incorporate optical fiber transmission components.
Base Year Value
$12.6B in 2025 (MMA Primary Research Dataset, September 2026)
Forecast Period
2026 to 2036, eleven discrete annual values
CAGR
9.0% base case. Bull 10.3%. Bear 7.7%.
Fastest Growth Segment
Optical Transceivers and Connectors: 19.0% CAGR
Fastest Growth Country
India: 11.2% CAGR
Fastest Growth Region
South Asia and Pacific: 11.2% CAGR
Largest Region
East Asia: 30% of 2025 global value
Market Leaders
Corning, Prysmian Group, Nexans, Furukawa Electric, Yangtze Optical Fibre and Cable. Source: MMA Analysis based on company annual reports.
Primary Survey
n=3,800 procurement and R&D decision-makers, Q4 2025, six countries
Methodology
Demand-side build-up, cross-validated against public data, 47 expert interviews

Fiber Optic Connectivity Market Forecast Scenarios

fiber-optic-connectivity-market-size-forecast-scenario-1789989699947
Between 2020 and 2025 fiber optic connectivity demand moved from steady telecom infrastructure replacement to a market shaped increasingly by data center interconnect requirements, accelerated by rising broadband penetration targets and a historical CAGR near eight percent that reset how network operators budget for optical infrastructure spending overall, from a steady utility purchase into a capacity-constrained strategic priority.
The base case assumes continued fiber-to-the-home broadband expansion across underserved regions, expanding data center interconnect demand driven by AI cluster bandwidth requirements, and rising submarine cable system investment connecting new regional data hubs, three mechanisms that together sustain steady expansion through 2036 without requiring a fundamentally new transmission technology to emerge beyond optical fiber itself carrying data at ever-increasing transmission speeds across both terrestrial and submarine network segments alike across every region tracked in this report.
A bull scenario hinges on AI data center bandwidth demand growing even faster than currently modeled as cluster interconnect speeds keep climbing. The bear case centers on a broadband capital expenditure slowdown as national buildout programs approach saturation in several major developed markets that already reached near-universal broadband coverage across most household and small business segments.

Bandwidth Scarcity Redefining Optical Infrastructure Economics

Fiber optic connectivity sits at the physical foundation of nearly every digital service, and the category has shifted decisively from a steady telecom infrastructure replacement cycle toward a capacity-constrained input for AI data center buildout, since transceiver and cable availability now genuinely limits how quickly hyperscalers can bring new compute clusters online rather than software readiness or chip availability alone, a genuine reversal from the prior decade of ample optical component supply.
MARKET CONCENTRATIONCR5 45%top five manufacturers hold nearly half of spend
AVERAGE TRANSCEIVER SELLING PRICE$850typical price point for high-speed data center optical modules
DATA CENTER BUYER SHARE34%share of total spend from hyperscale data center operators
FTTH HOUSEHOLD PENETRATION48%share of eligible households connected to fiber broadband globally
SUBMARINE CABLE ROUTE GROWTH22%increase in new submarine cable system deployment activity annually
TRANSCEIVER LEAD TIME9 moaverage current wait time for high-speed data center modules
Commercially the market behaves like a specialized industrial component supplier rather than a generic telecom equipment vendor: multi-year supply agreements, expansion revenue from higher-speed transceiver generations, and margin concentrated in advanced optical components rather than the underlying glass fiber itself, which has become considerably more commoditized over time as manufacturing scale spread across additional global suppliers over the past decade.
Over the next decade, higher-speed transceiver generations, expanding submarine cable route diversity, and continued fiber-to-the-home broadband buildout will separate manufacturers capable of operating at true hyperscale production volume from smaller players confined to legacy telecom replacement niches unable to fund the capacity expansion this cycle demands without a large, stable customer base already secured.
"Nobody worries about running out of glass. Everyone worries about running out of the specific high-speed transceiver they need for their next data center buildout."
Director, Optical Networking and Data Center Infrastructure Practice · MMA Optical Fiber Cable And Interconnect Components Practice · September 2026

Market Trends

800G And Faster Transceivers Become AI Cluster Standard

Data center operators are rapidly moving past 400G optical transceivers toward 800G and even faster generations to keep pace with AI cluster interconnect bandwidth requirements, driving a compressed product replacement cycle that leaves less time for manufacturers to amortize development costs across each generation before the next one arrives. This acceleration has pushed component suppliers to invest heavily in advanced packaging and silicon photonics manufacturing capacity specifically for these faster generations, since generic optical component production lines cannot easily retool for the tighter tolerances these speeds require. Vendors with mature silicon photonics capability increasingly win the largest hyperscaler supply contracts.
Market Impact: Adds $6 billion AI interconnect demand

Submarine Cable Route Diversification Accelerates Amid Security Concerns

Governments and telecommunications operators are funding new submarine cable routes specifically to diversify away from congested existing corridors and reduce single-point-of-failure risk following several high-profile cable damage incidents attributed to both accidents and deliberate interference. This has expanded demand for submarine cable system manufacturing capacity considerably beyond what pure bandwidth growth alone would justify, and vendors capable of delivering complex multi-landing-point systems increasingly win strategic government-backed contracts that prioritize resilience over lowest-cost bidding alone across the broader procurement process for these strategically sensitive infrastructure projects spanning multiple national jurisdictions and ocean territories.
Market Impact: Connects 45 million new fiber households

Market Opportunities and Growth Drivers

AI Data Center Buildout Drives Unprecedented Transceiver Demand

Hyperscalers racing to add GPU compute capacity are consuming optical transceivers and interconnect fiber at a rate that has outpaced even aggressive supplier capacity expansion, creating multi-month waiting lists for high-speed modules that did not exist just a few years earlier. Data center interconnect requirements now demand vastly more optical bandwidth per compute cluster than traditional enterprise networking ever required, and each new generation of AI accelerator chips typically raises the interconnect bandwidth requirement further still, compounding demand growth beyond simple cluster count increases across the industry each successive generation cycle.
Market Impact: Extends lead times to 9 months

National Broadband Programs Mandate Fiber-To-The-Home Expansion

Government broadband subsidy programs across multiple countries are funding fiber-to-the-home network expansion into rural and underserved areas that private operators previously found commercially unattractive to serve without public support. These programs typically require specific fiber technology standards and minimum speed guarantees that only true fiber-to-the-home architecture can reliably deliver at scale, directly expanding addressable demand for passive optical network equipment across telecommunications operators competing for available subsidy funding allocated by national regulators overseeing broadband access expansion across both rural and semi-urban geographic coverage areas designated as priority under each national program.
Market Impact: Adds 4 to 8 months delay

Market Restraints and Challenges

Silicon Photonics Manufacturing Bottleneck Limits Transceiver Supply

Advanced silicon photonics manufacturing capacity for high-speed optical transceivers remains concentrated among a small number of specialized foundries, creating a bottleneck that pure demand growth alone cannot resolve quickly regardless of how much capital manufacturers commit to expansion. The root cause is that silicon photonics fabrication requires precision tooling and process expertise that takes years to develop and scale, unlike simpler optical component manufacturing that can be replicated more readily. Manufacturers are mitigating this by qualifying additional foundry partners and investing directly in dedicated capacity expansion at existing suppliers to secure priority allocation.
Market Impact: Raises 800G transceiver deployment share

Municipal Right-Of-Way Permitting Delays Fiber-To-The-Home Rollout Plans

Fiber-to-the-home network operators routinely face lengthy municipal permitting processes for trenching and pole attachment rights that can delay deployment schedules well beyond original project timelines, particularly across dense urban areas with multiple overlapping jurisdictional authorities. The root cause is that permitting authority typically sits with local governments lacking dedicated staff or efficient processes designed for the pace of modern fiber rollout programs. Operators are mitigating this through dedicated permitting liaison teams and increasing use of aerial deployment methods that avoid the most contentious underground right-of-way disputes entirely across the most contested project sites.
Market Impact: Adds 22 new cable routes
4 additional market trends, 3 additional growth drivers, and 4 additional restraints and challenges are covered in the full report. Contact sales@marketmindsadvisory.com to access the complete intelligence.

Segment CAGR and Growth Architecture

Fiber Optic Connectivity is segmented by product type, the framework manufacturers and network operators use to structure procurement, since cable, connector, and transceiver components carry fundamentally different manufacturing processes and buyer decision cycles, and this technical lens maps directly onto how competing manufacturers structure their product lines and negotiate pricing with major buyers across every regional market served.
fiber-optic-connectivity-market-market-share-analysis-1789989700500

Optical Transceivers and Connectors

Optical transceivers and connectors convert electrical signals into light and back again at each end of a fiber connection, forming the active component layer that determines actual usable bandwidth regardless of the underlying cable's raw transmission capacity. This segment is compounding fastest because AI data center interconnect requirements demand transceiver generations far faster than traditional telecom replacement cycles ever required, and hyperscalers increasingly treat transceiver supply security as a strategic procurement priority rather than a routine component purchase. Vendors increasingly differentiate on silicon photonics manufacturing capability rather than raw port count alone, and multi-year supply agreements have become standard practice among the largest data center buyers seeking to lock in guaranteed allocation years ahead of need.
CAGR 19.0%

Fiber-to-the-Home (FTTH) Passive Optical Network Equipment

Fiber-to-the-home passive optical network equipment delivers fiber connectivity directly to residential and small business premises, replacing copper-based broadband technologies with substantially higher available bandwidth and lower long-run maintenance cost. Growth remains strong as government broadband subsidy programs fund expansion into previously underserved rural and semi-urban areas that private operators found commercially unattractive without public support. Telecommunications operators managing large-scale rollout programs increasingly consolidate onto fewer equipment vendors to simplify installation training and negotiate better volume-based pricing across their entire deployment footprint spanning multiple regional markets with varying labor costs and installation standards, reducing per-connection deployment cost as scale increases across the entire program footprint as more households come online each quarter.
CAGR 14.0%
Full segment breakdown across 6 segments available in the complete report.

Regional Architecture and Country Demand Map

East Asia leads global demand given its concentration of fiber cable manufacturing and deployment scale, narrowly ahead of North America, while South Asia and Pacific posts the fastest regional growth off a smaller base as national broadband programs scale rapidly, with Western Europe trailing on slower fiber rollout budgets.

East Asia

China anchors East Asian demand as it houses the majority of the world's fiber cable manufacturing capacity alongside massive domestic 5G backhaul and broadband deployment programs that consume optical components at unmatched scale. Japan and South Korea contribute steady demand from data center interconnect and undersea cable landing infrastructure serving as regional connectivity hubs. Chinese manufacturers including Yangtze Optical Fibre and Cable and Hengtong Group are gaining international share given both cost advantage and expanding production capacity, while the broader region continues importing specialized transceiver components for applications requiring capability domestic suppliers have not yet fully matched at comparable speed and precision. Vendor investment keeps rising to match this demand.
Share: 30% | CAGR: 10.2% (2026 to 2036)

North America

North America trails East Asia narrowly, led by hyperscale data center operators consuming optical transceivers at a pace that has strained global supply chains considerably over the past two years. Enterprise and government submarine cable investment adds a substantial demand layer connecting the region to allied markets across the Atlantic and Pacific. Vendor headquarters concentration reinforces this position: Corning maintains its primary manufacturing and research organization here, giving North American buyers deeper reference relationships and faster technical support than most other regions typically receive from established optical component suppliers headquartered in this same market. Vendor investment in local manufacturing capacity keeps expanding to meet this rapidly escalating enterprise and hyperscaler demand.
Share: 25% | CAGR: 9.8% (2026 to 2036)
Regional intelligence for 5 additional markets available in the complete report: Western Europe, South Asia and Pacific, Latin America, Middle East and Africa, Eastern Europe. Contact sales@marketmindsadvisory.com.
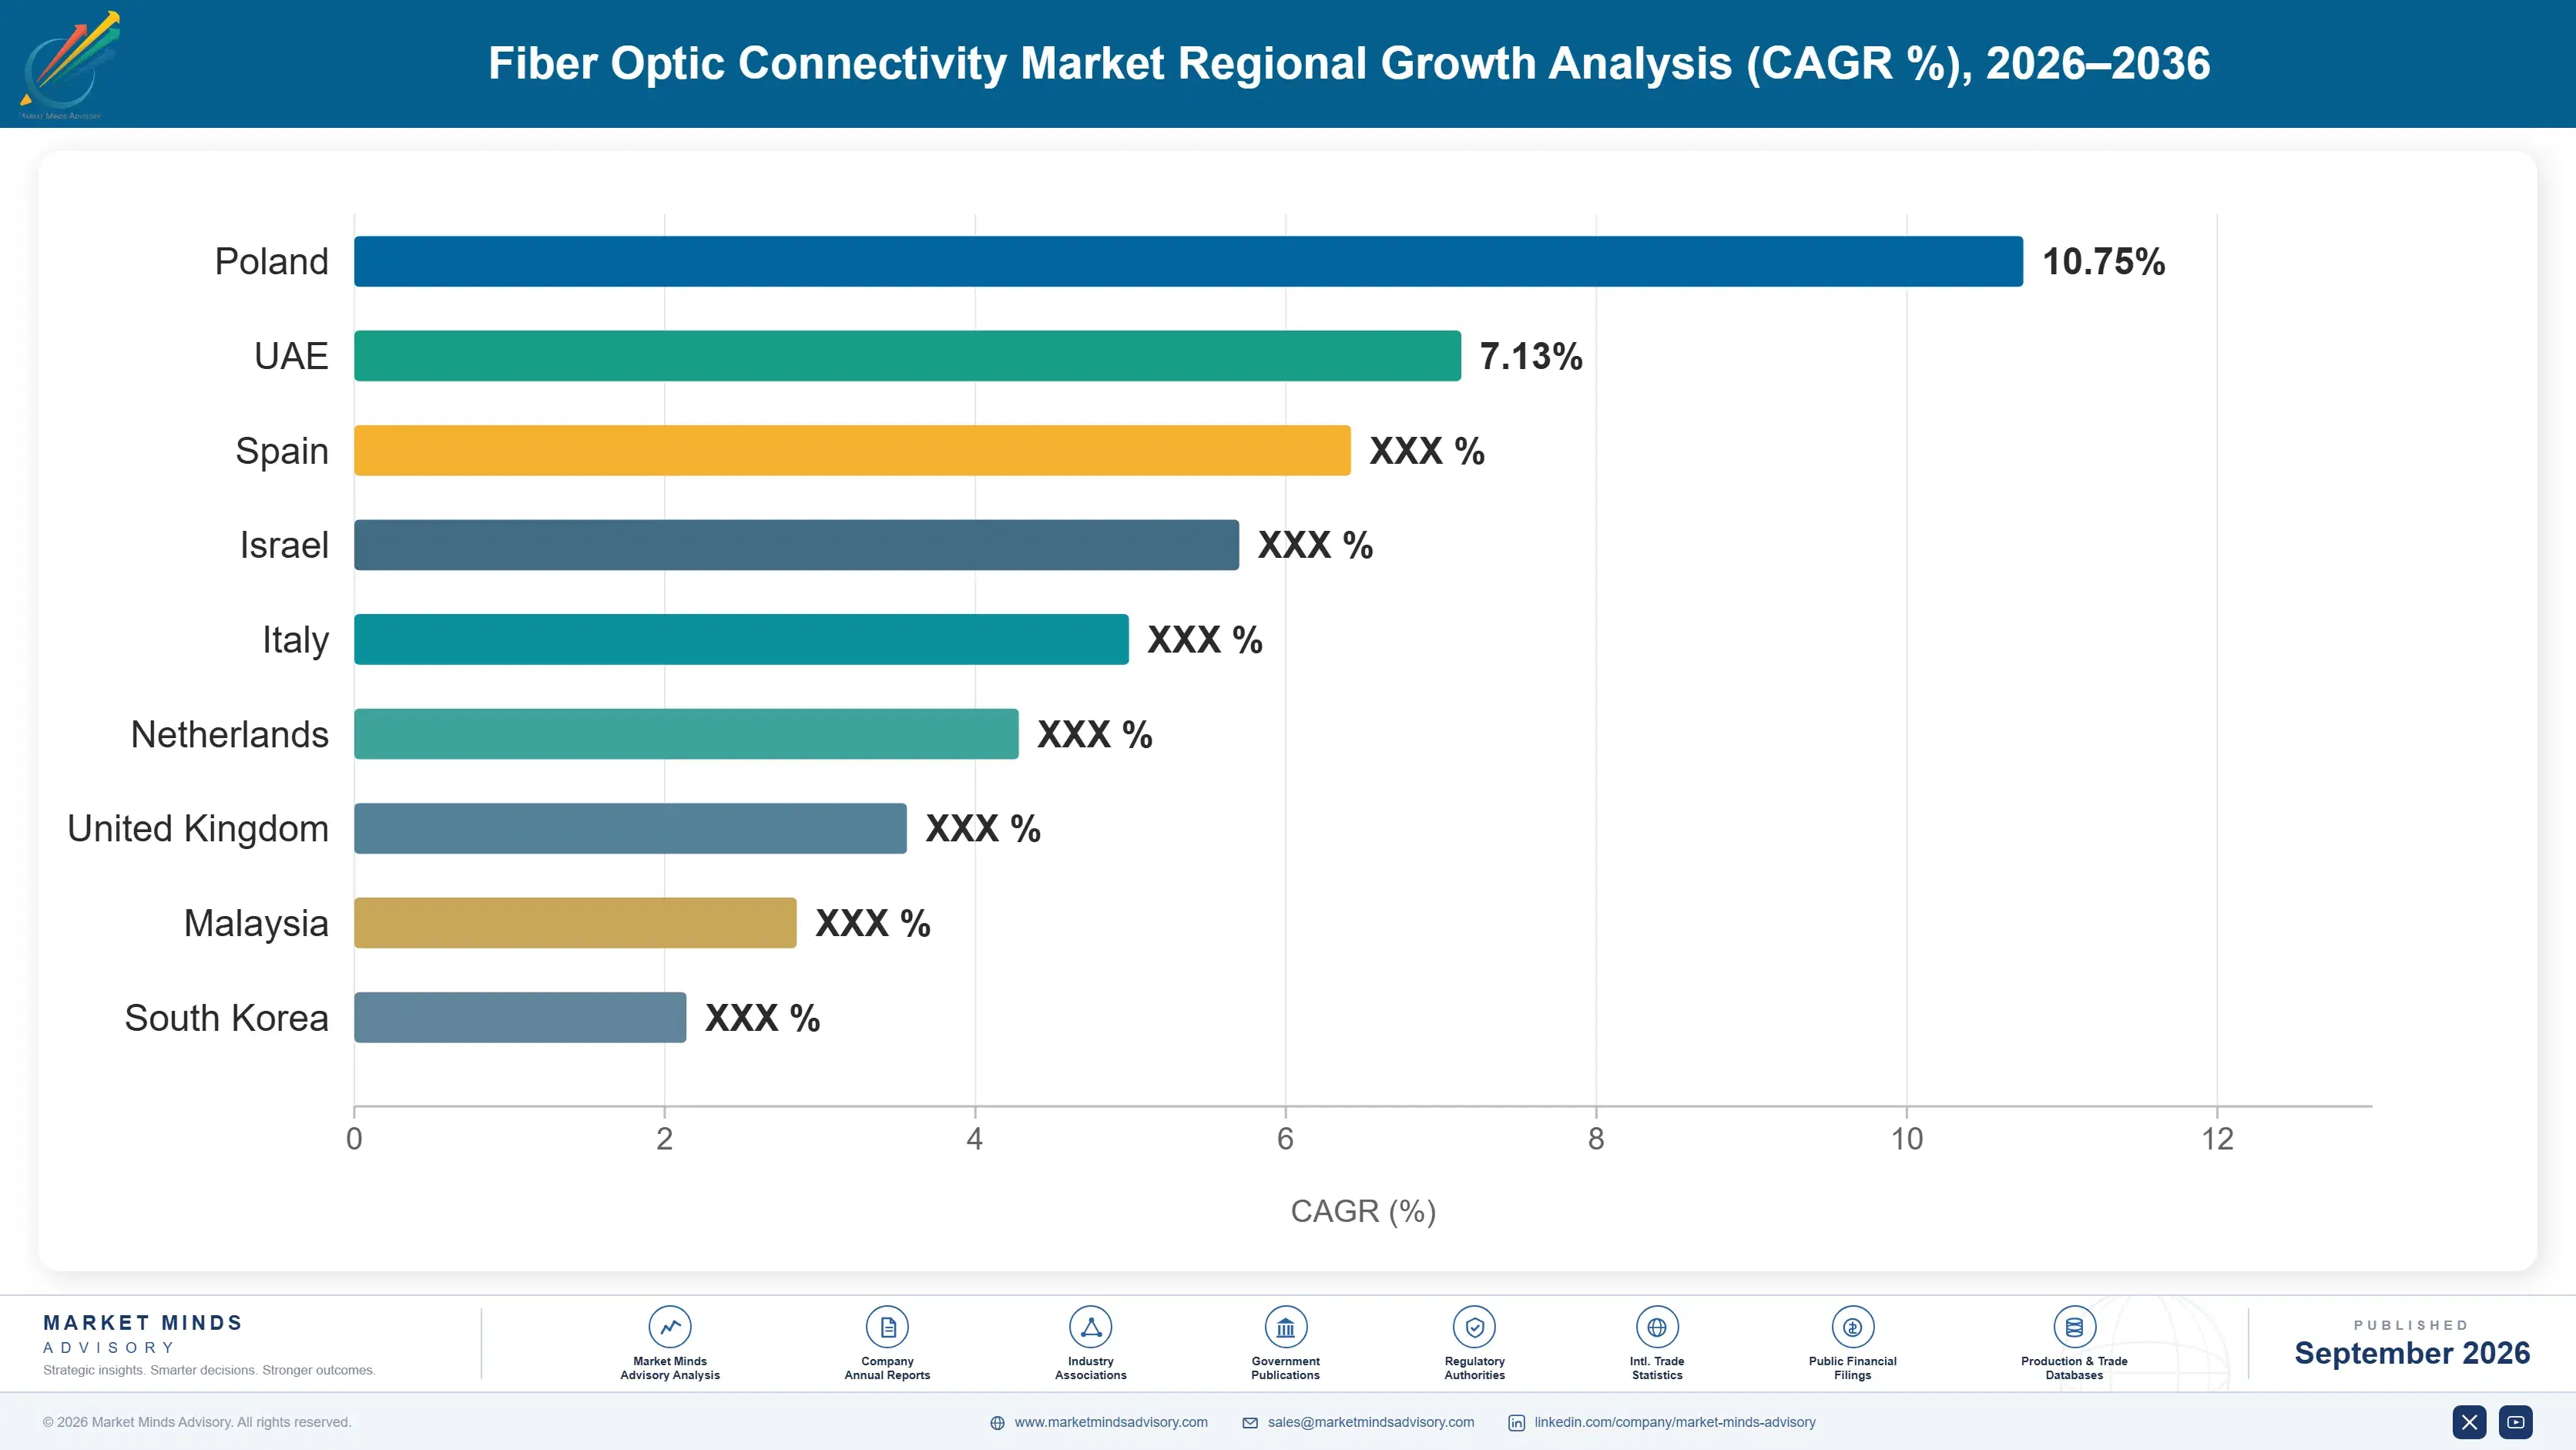
fiber-optic-connectivity-market-country-cagr-analysis-1789989701051

How Manufacturers Convert Scarcity Into Margin

Beyond base cable and component pricing, four commercial mechanisms determine which fiber optic manufacturers convert AI-driven demand growth into durable margin expansion rather than competing purely on commoditized per-meter cable pricing against every rival, since raw cable specifications have converged closely enough that they rarely decide a deal alone across the crowded competitive field.

Bundling Multi-Year Supply Agreements With Priority Allocation

Manufacturers now offer multi-year supply agreements guaranteeing priority allocation during periods of scarcity rather than selling purely on the spot market, a shift that raises average contract value substantially once hyperscaler customers see the value of guaranteed capacity access. Attach rates on priority allocation agreements have climbed past 45 percent among large data center customers, and because these agreements lock in demand years ahead, manufacturers can plan capacity expansion with far greater confidence and considerably lower financial risk when committing new capital to expansion across multiple manufacturing facilities simultaneously across every deployed facility they operate.
Market Impact: Raises average contract value by 28 percent overall

Expanding From Passive Cable Into Active Transceiver Components

Manufacturers historically selling primarily passive fiber cable are expanding into active transceiver and connector components that carry meaningfully higher margins than commoditized glass fiber alone. This expansion captures value previously stuck with specialized optical component vendors, and roughly 40 percent of traditional cable manufacturers have not yet completed this expansion into active components, leaving substantial unclaimed margin opportunity for those willing to invest in the specialized manufacturing capability required to compete in this higher-margin segment against established optical component specialists with years of accumulated manufacturing expertise built over multiple product generations.
Market Impact: Raises gross margin by roughly 15 points overall

Monetizing Silicon Photonics Manufacturing As A Premium Capability

Manufacturers with proprietary silicon photonics manufacturing capability increasingly price their most advanced transceiver generations as a premium tier above standard optical components, targeting hyperscaler customers who need the fastest available interconnect speeds regardless of cost. Early pricing data suggests these premium silicon photonics products carry list prices roughly 30 percent above standard transceiver generations, and adoption concentrates among the largest data center operators facing the most demanding AI cluster bandwidth requirements across their entire deployed fleet regardless of the incremental cost involved in securing that guaranteed performance level for their most critical workloads.
Market Impact: Prices premium modules 30 percent above standard overall

Capturing Installation And Field Service Revenue Upfront

Telecommunications operators deploying large-scale fiber-to-the-home programs increasingly purchase bundled installation and field maintenance services alongside core equipment procurement rather than managing installation with in-house or third-party crews separately. These service engagements carry materially higher margins than standalone equipment sales once field service teams reach sufficient regional scale, and roughly 35 percent of large broadband deployment contracts now include a bundled service component, up meaningfully from a smaller base only a few years earlier when installation remained a purely separate procurement line handled entirely by third-party field service contractors across each regional market served.
Market Impact: Adds a 35 percent service attach rate overall

Who Controls the Margin Pool

Market concentration sits moderate at a CR5 of 45 percent, evaluated on trailing twelve-month manufacturing revenue, leaving meaningful room between established leaders Corning and Prysmian Group and a wide field of Chinese and regional manufacturers still building comparable material science and manufacturing depth at matching global scale, particularly in the specialized silicon photonics segment driving most current growth across the industry overall.
Current competitive activity plays out across three fronts: aggressive silicon photonics manufacturing capacity investment by leading transceiver suppliers racing to meet hyperscaler demand, submarine cable system capacity expansion amid rising geopolitical infrastructure resilience concerns, and price competition from Chinese manufacturers expanding aggressively in commodity fiber cable segments where technical differentiation matters considerably less than raw production cost when purchase decisions come down to price alone.

Emerging pressure comes from vertically integrated hyperscalers exploring direct investment in optical component manufacturing capacity to secure supply independent of external suppliers, a dynamic that could reshuffle rankings among mid-tier manufacturers lacking either Corning's material science depth or Prysmian's submarine cable systems expertise built over decades of specialized project delivery that newer entrants cannot easily replicate quickly regardless of available capital.
fiber-optic-connectivity-market-company-positioning-matrix-1789989701578

Competitive Moat and Risk Dimensions

CORNING

Moat: Decades of proprietary glass science

Corning built its optical fiber business on decades of proprietary glass and material science research that competitors have struggled to fully replicate, giving it a durable technology edge in low-loss fiber performance that matters increasingly as data centers push transmission distances and speeds beyond what standard fiber comfortably supports.
CORNING

Risk: High customer concentration exposure

Corning's optical business carries meaningful revenue concentration among a small number of large hyperscaler and telecommunications customers, leaving it more exposed than diversified peers to demand cyclicality whenever a major customer pauses capital expenditure or shifts sourcing toward an alternative supplier temporarily during a routine procurement cycle.
PRYSMIAN GROUP

Moat: Broadest global manufacturing footprint

Prysmian Group operates the broadest global manufacturing footprint in the industry following its acquisition of General Cable, giving it geographic reach and submarine cable systems capability that smaller regional competitors cannot easily match, particularly for complex multi-landing-point projects requiring specialized vessel and installation expertise built over decades of operational experience.
PRYSMIAN GROUP

Risk: Lower-margin commodity cable exposure

Prysmian's broad commodity terrestrial cable business carries meaningfully lower margins than the specialized optical component segment, dragging blended profitability compared with more specialized peers and leaving Prysmian more exposed to raw material cost volatility, particularly copper and polymer inputs used across its wider cable portfolio.

Players Tracked

Prominent Players

Corning
Prysmian Group
Nexans
Furukawa Electric
Yangtze Optical Fibre and Cable

Other Key Players

CommScope
Sumitomo Electric Industries
LS Cable & System
Fujikura
Hengtong Group
ZTT (Jiangsu Zhongtian Technology)
Belden
Amphenol
Coherent Corp
Lumentum
Cisco
Ciena
Fiberhome Telecommunication Technologies
Nokia
Sterlite Technologies

Recent Developments

FEBRUARY 2025

Corning Expands Silicon Photonics Manufacturing With New Facility

Corning announced a new dedicated silicon photonics manufacturing facility aimed at expanding high-speed transceiver component production capacity, directly addressing the supply bottleneck constraining AI data center bandwidth deployment across the broader optical component industry that has persisted for well over a year across nearly every major hyperscaler.
Signal: Confirms silicon photonics capacity investment has become the primary competitive battleground across every serious optical component vendor now.
JUNE 2025

Prysmian Group Completes Acquisition Of A Submarine Cable Technology Startup

Prysmian Group acquired a smaller submarine cable technology vendor to accelerate advanced cable design capability, folding the acquired engineering team directly into its core product organization rather than operating the technology as a standalone product sold separately under a prior standalone pricing arrangement to existing customers.
Signal: Shows established cable manufacturers racing to close technology gaps against newer, more specialized entrants moving fast.
OCTOBER 2025

Furukawa Electric Deepens Data Center Partnership With Expanded Transceiver Supply

Furukawa Electric expanded its transceiver supply agreement with a major hyperscaler, extending the partnership beyond initial pilot volumes into a multi-year committed capacity arrangement, a bundling move aimed squarely at securing long-term revenue visibility across upcoming product generations well into the next decade of continued AI infrastructure buildout.
Signal: Shows optical component suppliers racing to secure long-term hyperscaler revenue visibility well ahead of the next capacity cycle.

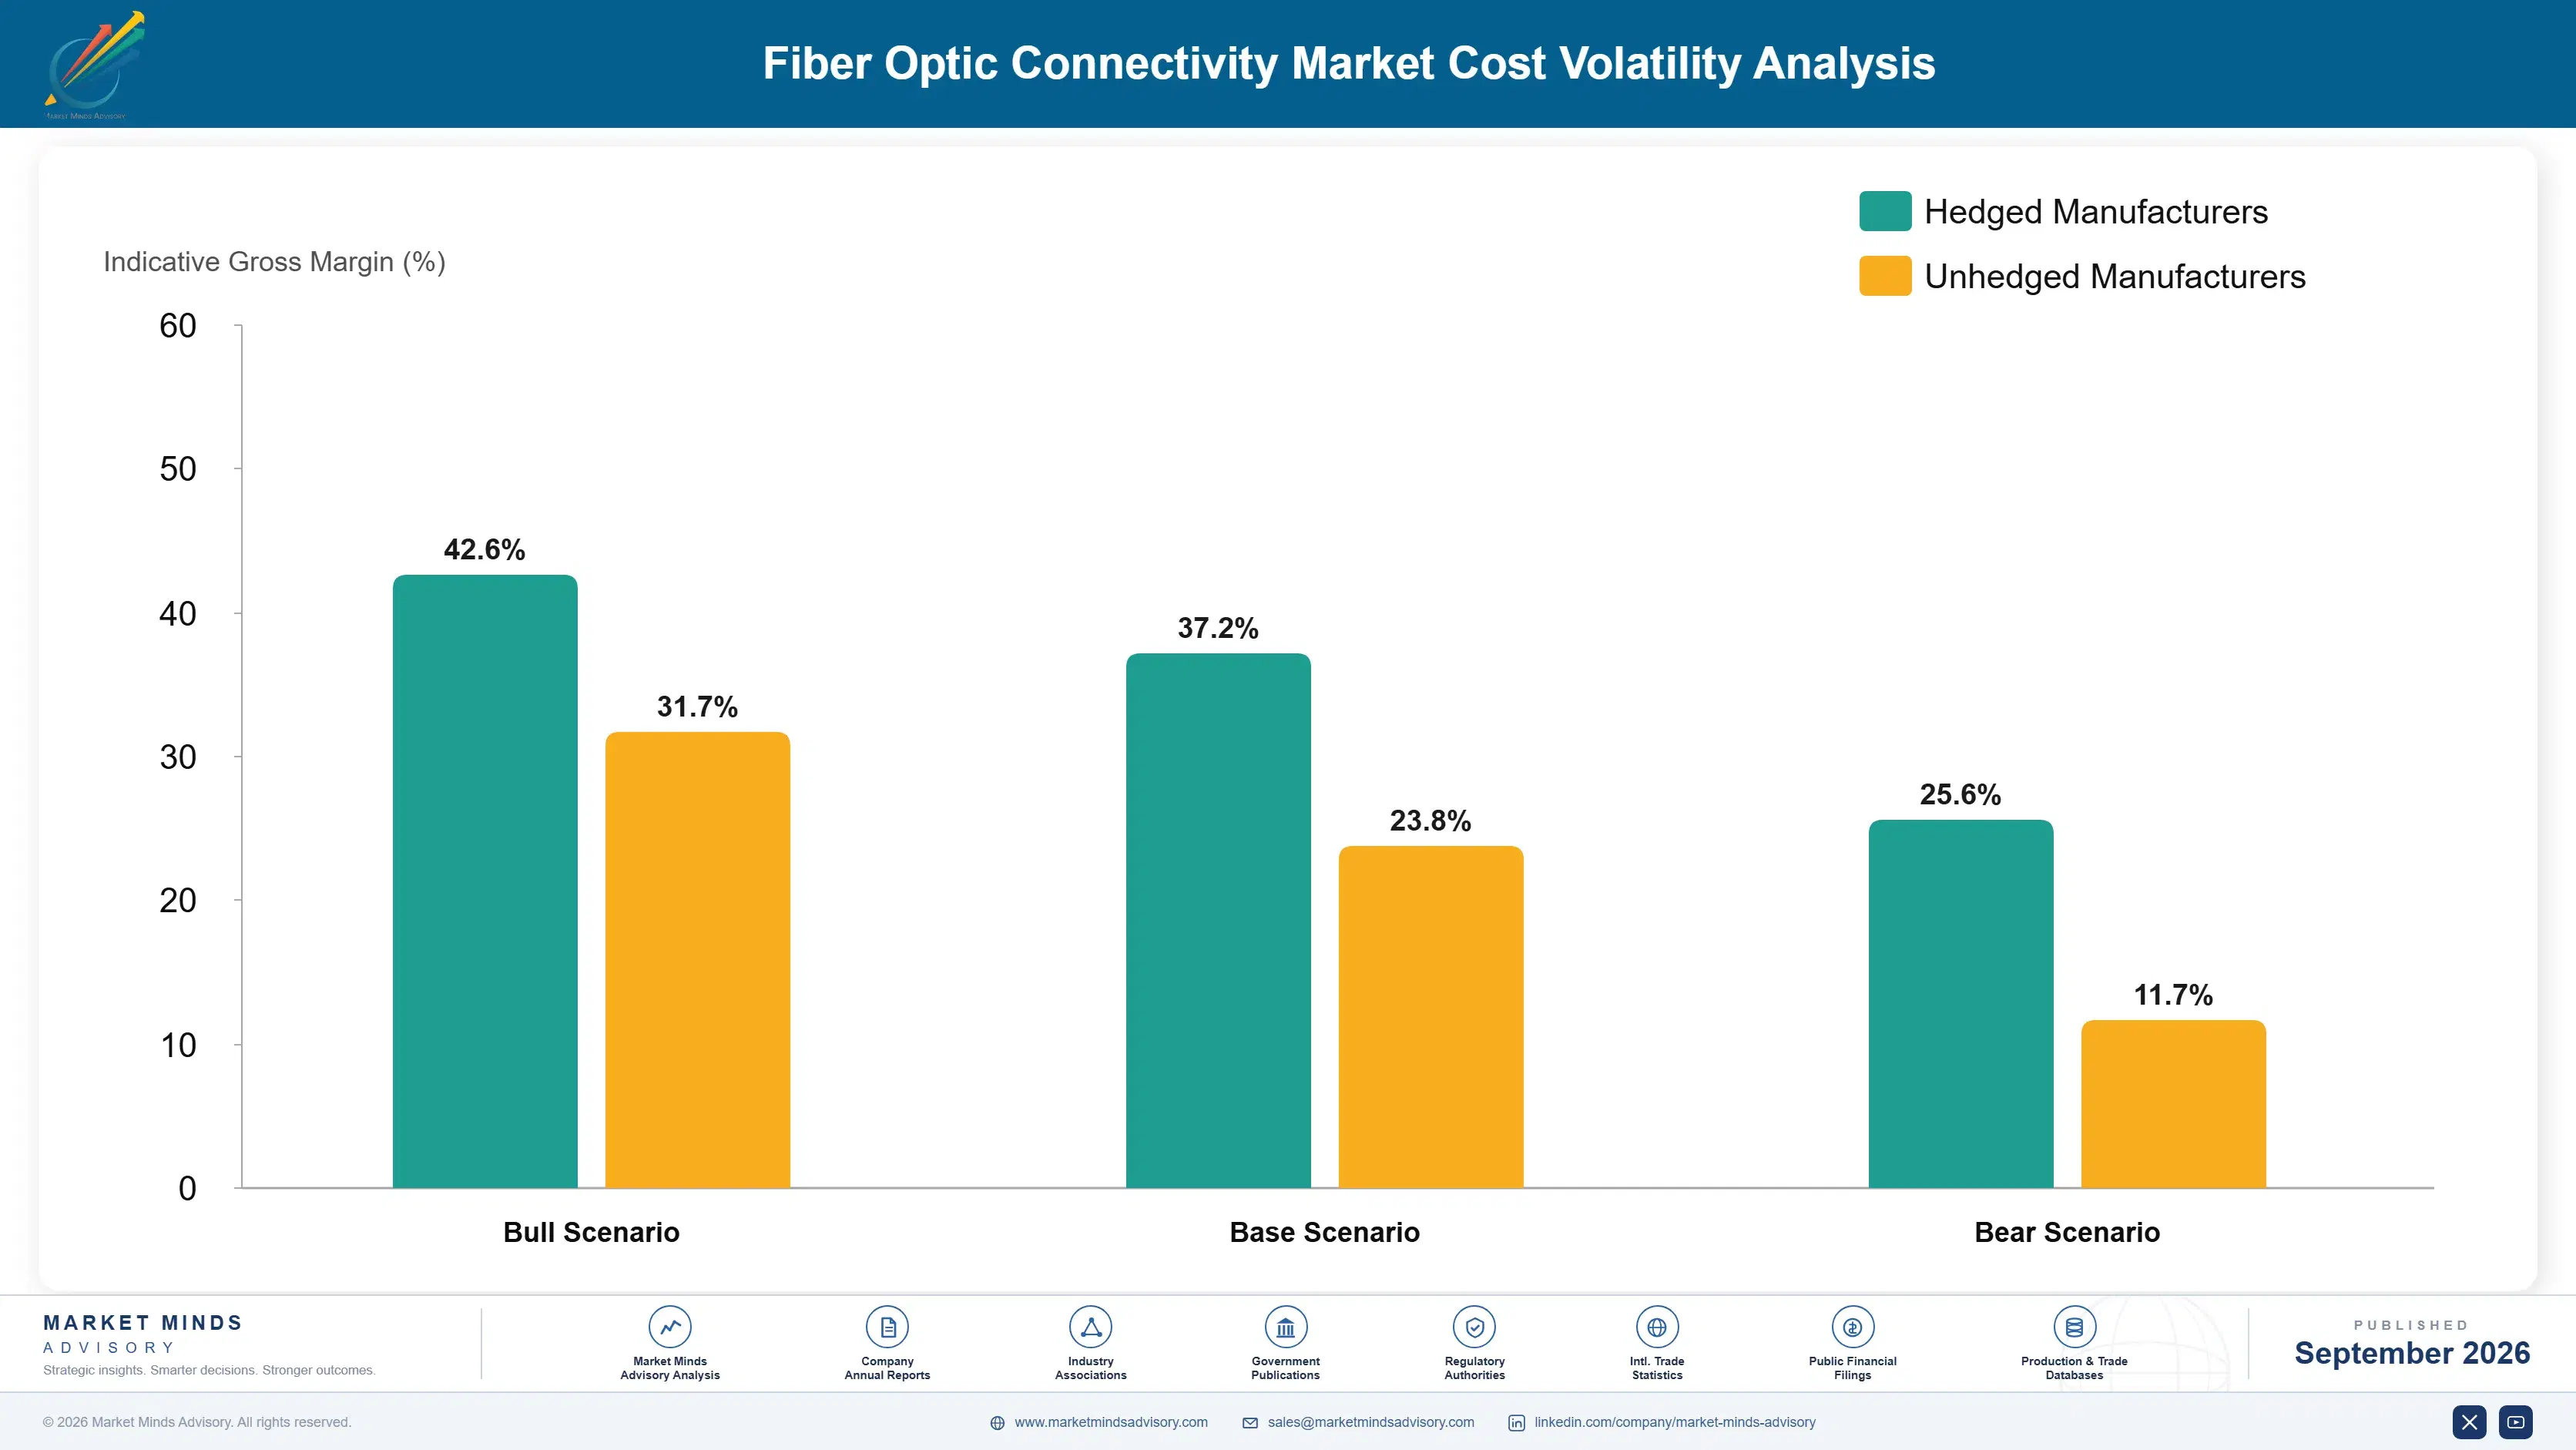
Raw Glass And Silicon Component Costs

The dominant cost inputs for fiber optic manufacturers are high-purity silica glass for cable production and specialized semiconductor components for active transceivers, together running roughly 42 to 50 percent of cost of goods sold, sourced primarily from a concentrated group of raw material refiners and advanced semiconductor foundries that supply precision photonic components for high-speed data transmission applications.
Semiconductor supply constraints in 2024 pushed lead times for specialized photonic chip components out considerably, a disruption documented in company annual report supply chain disclosures, forcing manufacturers to redesign transceiver bills of materials around more widely available components or absorb higher costs passing through to enterprise customers during the affected renewal and expansion cycles across the most component-intensive transceiver product lines specifically, a squeeze that hit smaller vendors lacking scale to negotiate favorable terms hardest.

Manufacturers that own proprietary glass preform production carry more control over raw material continuity than those purchasing preforms from third-party suppliers, creating a durable cost gap between vertically integrated incumbents and smaller challengers dependent entirely on external suppliers for every production run they undertake without the balance sheet room to build owned capacity at comparable scale.
fiber-optic-connectivity-market-cost-volatility-analysis-1789989701774

Diversifying Semiconductor Component Sourcing Across Suppliers

Leading manufacturers now qualify photonic chip components from two or more semiconductor suppliers per product category rather than relying on a single source, reducing exposure to any one foundry's capacity constraints or pricing decisions during periods of tight supply. This diversification typically adds modest coordination overhead but pays off during future capacity or pricing disruptions.

Investing In Proprietary Glass Preform Production Capacity

Vendors are building or expanding owned glass preform manufacturing capacity rather than purchasing raw preforms from third-party suppliers, reducing bill of materials risk while capturing margin previously paid to external material suppliers. This investment typically requires years of development but pays back substantially once production scale across the entire product line is fully reached.

Locking In Multi-Year Semiconductor Supply Agreements

Manufacturers increasingly commit to multi-year minimum purchase agreements with semiconductor foundries in exchange for locked-in pricing and priority allocation, trading flexibility for cost predictability that protects gross margin forecasts against sudden increases. These agreements typically span three to five years and are negotiated well ahead of expected demand across the largest strategic customer accounts.

Portfolio Architecture for Margin Defence

Vendor portfolios split across three margin tiers: commodity-adjacent standard fiber cable priced to win volume among telecom operators, certified premium transceiver components carrying steeper pricing for hyperscale data center buyers, and next-generation silicon photonics tiers commanding the steepest margins as differentiated capability rather than a simple cable-length checkbox, and manufacturers increasingly design roadmaps around moving customers upward through this hierarchy over time rather than leaving them parked on entry-level commodity contracts indefinitely.
Volume-tier deals win on price and reliable supply availability, while premium-tier deals win on transceiver speed and manufacturing precision, and the tension between the two shows up directly in how manufacturers allocate limited silicon photonics production capacity across their broader product portfolio each planning cycle, reshaping how sales teams prioritize expansion conversations with existing customers.

High-value margin pools concentrate in the next-generation tier, where silicon photonics transceivers and priority supply agreements command pricing well above standard fiber cable, and manufacturers capable of selling into that tier consistently outperform peers stuck competing on commodity cable pricing alone, a gap that widens as buyers grow comfortable paying for guaranteed performance rather than raw cable pricing alone.

Volume / Commodity-Adjacent Tier

Standard single-mode and multi-mode fiber cable sold to telecom operators and system integrators through regional distribution channels rather than direct sales, priced for volume over margin. Margins here trail the rest of the portfolio considerably.
Gross Margin: 18-26%

Premium / Certified Tier

High-speed optical transceivers and connectors sold to hyperscale data center operators requiring guaranteed supply and validated performance specifications, typically through direct enterprise sales. Renewal rates in this tier run consistently high across the customer base.
Gross Margin: 32-40%

Sustainability / Regulatory / Next-Generation Tier

Silicon photonics transceivers, priority supply agreements, and custom-designed submarine cable systems sold to the largest global enterprise accounts, where account teams work closely with customer infrastructure leadership. These accounts anchor the vendor most durable long-term revenue.
Gross Margin: 42-50%
fiber-optic-connectivity-market-portfolio-architecture-1789989702333

High-value Sub-segments and Strategic Watch-out

Silicon Photonics Transceiver Add-On Suites

Highest-value, highest-growth pool as manufacturers price advanced 800G and faster transceivers as standalone premium tiers above standard optical components, capturing disproportionate margin relative to incremental delivery cost. This makes it the single most important segment for margin-focused investors to track closely each and every fiscal quarter.
Gross Margin: 42-50%

Priority Supply Agreement Premium Contracts

High-value, moderate-growth pool serving hyperscalers who need guaranteed capacity access beyond what standard spot market purchasing already provides, a gap that widens as scarcity persists industry-wide. Vendors with mature manufacturing scale are best positioned to capture this expanding demand across new hyperscaler accounts each year.
Gross Margin: 35-43%

Core Standard Fiber Cable Manufacturing

Volume core of the market, generating the bulk of recurring revenue at moderate margin as the primary first-purchase most telecom operators make before expanding into premium components over subsequent cycles. Pricing here stays under steady competitive pressure from aggressive challenger discounting each and every renewal cycle.
Gross Margin: 20-28%

Commoditized Legacy Copper Alternative Products

Strategic watch-out as low-cost regional manufacturers offer basic legacy cable without advanced capability, threatening to commoditize the entry tier vendors rely on for new-logo growth among smaller telecom buyers. Vendors are responding by pushing differentiation higher up the value chain as quickly as they possibly can.
Gross Margin: 15-22%

Annuity Economics Of Supply Agreements

Fiber optic connectivity revenue behaves like an annuity once deployed: supply agreements become embedded into multi-year hyperscaler capacity planning, switching costs rise with every generation of qualified transceiver technology tied to a specific manufacturer, and renewal rates comfortably exceed those of most industrial component categories once a supplier clears its first full year without a quality or delivery incident forcing a costly re-evaluation of the entire supplier relationship.
Adoption depth varies sharply by vertical. Hyperscale data center operators push deep multi-year supply commitments covering multiple transceiver generations within the first contract year, while smaller telecommunications operators often start with standard cable purchases and expand gradually as budget and network buildout plans allow over subsequent renewal cycles, a gap suppliers actively work to close through account expansion programs.

Buyer profiles are shifting generationally too: network engineers who came up specifying basic cable characteristics are giving way to a cohort raised on data center interconnect architecture, and this newer generation evaluates suppliers on manufacturing capacity guarantees and technology roadmap depth rather than raw fiber count alone, and they expect transparent capacity forecasting tools earlier buyer generations rarely demanded.
fiber-optic-connectivity-market-end-use-penetration-index-1789989703102

Where To Place Fiber Optic Bets

These are among the four positions where our research anticipates prominent divergence between winners and laggards over the coming forecast period. Each is grounded in the demand model, the regulatory perimeter, and the announced capacity pipeline.
01 / VENDOR SELECTION DISCIPLINE

Prioritize manufacturing capacity guarantees over unit pricing

Buyers evaluating fiber optic suppliers should weight demonstrated manufacturing capacity guarantees well above raw unit pricing, since the two vendors leading the market, Corning and Prysmian Group, both compete on material science depth and manufacturing scale rather than any single pricing metric. Basic cable quality parity across serious manufacturers has become the norm rather than the exception. A supplier unable to guarantee delivery timelines will delay data center buildout regardless of how competitive its per-unit pricing looks on paper during a procurement evaluation.
02 / CONTRACT STRUCTURING APPROACH

Negotiate priority allocation agreements at initial signature

Enterprises consistently pay a premium to secure priority allocation after initial contract signature rather than negotiating guaranteed capacity upfront during the original procurement cycle. Vendors price incremental allocation commitments assuming reduced switching risk once supply relationships are already embedded into multi-year infrastructure planning. Procurement teams that anticipate future capacity needs during the first negotiation window capture meaningfully better pricing than those who return to the table each time demand spikes unexpectedly months or years into the contract once budget finally becomes available.
03 / REGIONAL EXPANSION TIMING

Weight India and Gulf state deployments earlier than budget cycles suggest

South Asia and Pacific and Middle East regional demand is compounding faster than mature Western markets, driven respectively by national broadband programs and government-backed connectivity infrastructure investment. Vendors and enterprise buyers alike who treat these regions as an afterthought behind North American rollout plans risk ceding ground to competitors building local manufacturing and distribution capacity now. Early regional investment compounds through reference customers that later anchor broader account expansion across neighboring markets well ahead of slower-moving competitors entering the same region.
04 / COMPETITIVE POSITIONING WATCH

Monitor vertically integrated hyperscaler manufacturing as the next threat

Hyperscalers exploring direct investment in optical component manufacturing capacity represent the clearest long-run threat to independent manufacturer pricing power in the most profitable transceiver segments specifically. Independent manufacturers should expect continued pressure to demonstrate irreplaceable technology depth as this vertical integration trend deepens over the coming several years. The strategic response is deepening silicon photonics material science advantage where hyperscalers currently lack comparable manufacturing expertise built carefully over many decades of sustained research investment that no capital infusion alone can shortcut.

Engagement Snapshot From the Field

A live engagement with an industry participant carrying material or product regulatory and market exposure ahead of a defining policy shift, showing how our research translates into a defensible multi-year portfolio strategy.
MARKET MINDS ADVISORY · CLIENT ENGAGEMENT SUMMARY
Fiber Optic Connectivity Producer Strategic Portfolio Review and Transition Roadmap 2026·Investment Scenario on Fiber Optic Connectivity Exposure Evaluation 2025-26
CLIENT PROFILE
The client is a regional telecommunications operator serving 850,000 broadband subscribers across a mixed urban and rural service territory, operating an aging copper-based network that could no longer support the bandwidth requirements a new government subsidy program required to qualify for continued rural connectivity funding under the newly tightened program requirements announced earlier that same fiscal year.
STRATEGIC CHALLENGE
The state broadband authority notified the operator that its network would lose subsidy eligibility unless it demonstrated a credible fiber-to-the-home deployment plan within nine months, threatening a funding stream that supported a substantial share of the operator's rural network revenue. Leadership needed vendor selection and a rollout sequence finalized quickly to preserve funding continuity.
MMA APPROACH
MMA conducted a structured vendor evaluation benchmarking three leading passive optical network equipment suppliers against the operator's specific terrain, existing infrastructure, and subsidy compliance requirements. The engagement combined interviews with field deployment teams, a total cost of ownership model spanning five contract years, and a phased rollout plan prioritizing the highest subsidy-risk service areas first.
KEY FINDINGS
  1. Prioritizing the highest-risk 40 percent of the service territory first was projected to secure ongoing subsidy eligibility within the required nine-month window.
  2. Existing utility pole attachment agreements required renegotiation that added an estimated six weeks to the original nine-month deployment timeline agreed at project kickoff.
  3. Two of the three evaluated equipment vendors could not fully support the operator's specific rural terrain deployment requirements without meaningful customization work spanning several additional months.
  4. Field deployment teams identified aerial installation methods as significantly faster than underground trenching across the operator's rural coverage areas with difficult terrain access.
CLIENT PROFILE
The client is a regional telecommunications operator serving 850,000 broadband subscribers across a mixed urban and rural service territory, operating an aging copper-based network that could no longer support the bandwidth requirements a new government subsidy program required to qualify for continued rural connectivity funding under the newly tightened program requirements announced earlier that same fiscal year.
STRATEGIC CHALLENGE
The state broadband authority notified the operator that its network would lose subsidy eligibility unless it demonstrated a credible fiber-to-the-home deployment plan within nine months, threatening a funding stream that supported a substantial share of the operator's rural network revenue. Leadership needed vendor selection and a rollout sequence finalized quickly to preserve funding continuity.
MMA APPROACH
MMA conducted a structured vendor evaluation benchmarking three leading passive optical network equipment suppliers against the operator's specific terrain, existing infrastructure, and subsidy compliance requirements. The engagement combined interviews with field deployment teams, a total cost of ownership model spanning five contract years, and a phased rollout plan prioritizing the highest subsidy-risk service areas first.
KEY FINDINGS
  1. Prioritizing the highest-risk 40 percent of the service territory first was projected to secure ongoing subsidy eligibility within the required nine-month window.
  2. Existing utility pole attachment agreements required renegotiation that added an estimated six weeks to the original nine-month deployment timeline agreed at project kickoff.
  3. Two of the three evaluated equipment vendors could not fully support the operator's specific rural terrain deployment requirements without meaningful customization work spanning several additional months.
  4. Field deployment teams identified aerial installation methods as significantly faster than underground trenching across the operator's rural coverage areas with difficult terrain access.
RECOMMENDED STRATEGY
Phase 1: Phase 1 (Months 1 to 3): Complete vendor selection and finalize pole attachment agreements across the highest-priority service areas identified during initial assessment. Phase 2: Phase 2 (Months 4 to 7): Deploy fiber infrastructure across the highest subsidy-risk rural areas first, validating installation pace against the compliance deadline. Phase 3: Phase 3 (Months 8 to 9): Complete remaining service territory coverage and formally confirm subsidy compliance documentation with the state broadband authority.
OUTCOME
The operator completed deployment within the nine-month window, preserving its subsidy eligibility and passing the subsequent compliance review without findings (client-reported, unverified by MMA). Subscriber satisfaction scores improved measurably following the fiber upgrade across the newly covered territory, exceeding internal targets set at project kickoff.

Frequently Asked Questions

Foundational context covering the market sizes, CAGR, scope, country, region and competition that inform every finding below. This section is provided to cover basics and most often pre-purchase conversations, answered from the MMA Primary Research Dataset.

What is the current size of the Fiber Optic Connectivity Market?

The Fiber Optic Connectivity market was valued at $12.6 billion in 2025. It is projected to reach $13.73 billion in 2026 as AI data center demand accelerates.

How large will the Fiber Optic Connectivity Market be by 2036?

MMA projects the market will reach $32.50 billion by 2036, a 2.37-times expansion from 2026 levels. Growth is driven by transceiver upgrades and broadband buildout programs.

What is the CAGR for the Fiber Optic Connectivity Market 2026 to 2036?

The market is forecast to grow at a 9.0 percent CAGR between 2026 and 2036. Bull and bear scenarios range from 7.7 percent to 10.3 percent depending on AI demand trends.

Which segment is growing fastest?

Optical Transceivers and Connectors lead at a 19.0 percent CAGR, roughly 2.1 times the overall market rate. Demand is compounding as AI clusters require faster interconnect speeds.

Who are the major companies in the Fiber Optic Connectivity Market?

Corning, Prysmian Group, Nexans, Furukawa Electric, and Yangtze Optical Fibre and Cable lead the competitive field. Together these five manufacturers hold roughly 45 percent of the market.

Which country is growing fastest?

India leads country-level growth at an 11.2 percent CAGR, driven by its ambitious national fiber broadband program. Australia follows closely on data center and submarine cable investment.

Report Segmentation Architecture

The full report scope spans multiple orthogonal segmentation dimensions, with cross-tabulated demand data provided for each dimension pair. Coverage extends further to regional breakdowns, trend trajectories, and the competitive detail needed to support segment-level decision-making.

By Primary Market Dimension

  • Optical Transceivers and Connectors
  • Fiber-to-the-Home (FTTH) Passive Optical Network Equipment
  • Single-Mode Fiber Optic Cable
  • Submarine Fiber Optic Cable Systems
  • Multi-Mode Fiber Optic Cable
  • Fiber Optic Testing and Measurement Equipment

By End-Use Industry

  • Telecommunications and Broadband
  • Data Centers and Cloud Infrastructure
  • Government and Defense
  • Enterprise Networking
  • Utilities and Energy

By Commercial Dimension

  • Direct Enterprise Sales Channel
  • Distributor and Reseller Channel
  • Government Procurement
  • System Integrator Channel

By Region

  • North America
  • Western Europe
  • East Asia
  • South Asia and Pacific
  • Latin America
  • Middle East and Africa
  • Eastern Europe

Scope, Methodology, and Coverage

Every figure in this report is reproducible from documented input assumptions. The scope below maps the historical period, the forecast horizon, the segmentation dimensions, and the countries covered, alongside the underlying primary and qualitative methodology.
Historical Period
2020 to 2025
Forecast Period
2026 to 2036
Base Year
2025 (USD billions; MMA Primary Research Dataset, September 2026)
Market Definition
This report defines the Fiber Optic Connectivity market as optical fiber cable, connectors, and transceiver components used to transmit data as light signals across telecommunications, data center, and broadband access networks. It excludes copper-based networking cable, wireless transmission equipment, and network switching hardware that does not directly incorporate optical fiber transmission components.
Quantitative Units
USD billions (current prices); year-over-year percentage growth; CAGR percentages
Segmentation Dimensions
By Product Type; By End-Use Industry; By Commercial Dimension; By Region
Regions Covered
North America, Western Europe, East Asia, South Asia and Pacific, Latin America, Middle East and Africa, Eastern Europe
Countries Covered
USA, China, Germany, France, UK, Japan, South Korea, India, Australia, Canada, Brazil, Mexico, Indonesia, Vietnam, Thailand, Malaysia, UAE, Saudi Arabia, South Africa, Nigeria, Turkey, Poland, Netherlands, Italy, Spain, Sweden, Switzerland, Argentina, Colombia, Singapore, and additional markets relevant to this sector
Key Companies Profiled
Corning, Prysmian Group, Nexans, Furukawa Electric, Yangtze Optical Fibre and Cable, CommScope, Sumitomo Electric Industries, LS Cable & System, Fujikura, Hengtong Group, ZTT (Jiangsu Zhongtian Technology), Belden, Amphenol, Coherent Corp, Lumentum, Cisco, Ciena, Fiberhome Telecommunication Technologies, Nokia, Sterlite Technologies
Quantitative Methodology
Primary survey, n=3,800 respondents, Q4 2025, six countries; demand-side model with trade association cross-validation
Qualitative Methodology
47 expert interviews, Q4 2025; applied to validate demand model assumptions, identify emerging dynamics, and assess competitive positioning
Report Format
PDF and XLSX data workbook (Word format preview document)
Publisher
Market Minds Advisory
Report Code
MMA-2026-TEC-897
Published
September 2026
Contact
sales@marketmindsadvisory.com | www.marketmindsadvisory.com

Purchase the full Fiber Optic Connectivity Market Report (2026 to 2036).

The full Fiber Optic Connectivity Market report delivers comprehensive segment-level forecasts, competitive benchmarking across twenty profiled manufacturers, and detailed regional demand analysis spanning all seven world regions through 2036. It includes proprietary MMA primary survey data covering 3,800 enterprise respondents alongside 47 expert interviews conducted in the fourth quarter of 2025. The report also provides input cost analysis, revenue lever benchmarking, and a strategic verdict section designed to support vendor selection and investment decisions. Buyers gain access to portfolio tier margin economics and a detailed case study illustrating a real fiber broadband expansion program.
Ten-year quantitative market forecasts by segment
Competitive benchmarking across twenty profiled manufacturers
Regional demand analysis across seven world regions
Primary survey data from 3,800 enterprise respondents
Expert interview insights from 47 qualitative interviews
Strategic verdict and revenue lever recommendations

Built For The People Who Decide

From boardroom strategy to bench-side execution, this report is read cover-to-cover by leaders shaping the next decade of their industry, turning demand scenarios, market dynamics and valuation benchmarks into decisions.
CXOs/ Presidents/ VPs/ Managers
M&A and Corporate Development
Strategy Teams and R&D Heads
Procurement and Product Directors
Regulatory and Compliance Leaders
Investor Relations and Equity Analysts