Market Minds Advisory
Fertilizer Additives Market

Fertilizer Additives Market: Handling Chemistry, Nitrogen Efficiency, and Two Businesses Sold to the Same Customer

Half this market stops urea turning into a warehouse-sized rock and sells on price. The other half stops nitrogen escaping into the air and sells on what that nitrogen was worth.

Lead Analyst

Bilal Shaikh

Published

September 2026

Make Smarter Decisions with Customized Research Insights

Request a free sample report and evaluate market opportunities, growth trends, and competitive dynamics relevant to your business needs.

2025 MARKET VALUE$3.2BMarket Size 2025
2036 FORECAST VALUE$6.6BBase Case , 2026 to 2036
CAGR 2026 TO 20366.8 %Bull 8.0% / Bear 5.6%
INCREMENTAL OPPORTUNITY$3.2BNet 10- year value creation
EXPANSION MULTIPLE1.93x2036 value over 2026 base
Strategic Levers
M&A Pipeline
Regional Outlook
Country Rankings
Competitive Intelligence
Segmental Deep-dive
Call-Us : 91 93563 13602

Executive Snapshot and Market Trajectory

Two businesses share this name and almost nothing else. Anti-caking chemistry costs a few dollars a tonne and stops fertilizer setting solid in storage. Nitrogen inhibitors cost considerably more and stop 38% of applied nutrient escaping into air and groundwater. Nobody buys the two for the same reason.
Commercial advantage belongs to suppliers selling efficiency rather than handling, because a producer buying anti-caking agent negotiates on cost while one buying inhibitors is chasing a 22% price uplift on treated product downstream. Nitrification inhibitors grow fastest at 11.2%, roughly 1.65 times the market. East Asia holds the largest position at 28% of value, following fertilizer production and consumption that no other region matches.
Concentration sits at roughly 38% for the top five, held up by inhibitor chemistry and regulatory approval rather than by anything in the handling business. Only 17% of nitrogen fertilizer volume currently carries an efficiency additive. Nitrous oxide emissions have turned that gap into a carbon question as much as an agronomic one. That reframing brought a payer into the decision, which is what forty years of field trial data had never managed to do.
Market Definition
The market comprises chemical additives applied to mineral fertilizers during or after manufacture, covering anti-caking agents, anti-dusting agents, hydrophobic coating agents, urease inhibitors, nitrification inhibitors, and colorants with granulation aids. Value is measured at additive supplier level on material sold to fertilizer producers and blenders. Fertilizer nutrients themselves, biostimulants and microbial inoculants, controlled-release polymer coatings sold as finished products, soil amendments, and crop protection chemicals fall outside scope.
Base Year Value
$3.2B in 2025 (MMA Primary Research Dataset, August 2026)
Forecast Period
2026 to 2036, eleven discrete annual values
CAGR
6.8% base case. Bull 8.0%. Bear 5.6%.
Fastest Growth Segment
Nitrification Inhibitors: 11.2% CAGR
Fastest Growth Country
India: 9.8% CAGR
Fastest Growth Region
South Asia and Pacific: 9.0% CAGR
Largest Region
East Asia: 28% of 2025 global value
Market Leaders
Koch Agronomic Services, Clariant, ArrMaz, Solvay, and Dorf Ketal lead on fertilizer additive supply revenue. Source: company annual reports and MMA Analysis, July 2026.
Primary Survey
n=3,800 procurement and R&D decision-makers, Q4 2025, six countries
Methodology
Demand-side build-up, cross-validated against public data, 47 expert interviews

Fertilizer Additives Market Forecast Scenarios

fertilizer-additives-market-trends-size-forecast-scenario-1787551275116
Growth from 2020 to 2025 came almost entirely from the efficiency side while handling additives tracked fertilizer tonnage and nothing else. European fertilising products rules created a defined regulatory category for inhibitors with efficacy requirements attached, which legitimised the claim. Expiry of the main urease patents then collapsed pricing and expanded volume. The 5.5% historical rate hides two trends moving in opposite directions.
The 6.8% base case rests on three mechanisms. Nitrous oxide accounting has turned nitrification inhibitors into a greenhouse gas tool rather than only an agronomic one, which brings sustainability budgets into a purchasing decision that used to sit with agronomy. Indian and Chinese nutrient efficiency programmes keep expanding treated volume. And only 17% of nitrogen fertilizer currently carries any inhibitor at all, which leaves substantial headroom. None of the three needs fertilizer volumes to grow at all.
The 8.0% bull case assumes nitrous oxide reporting requirements enter farm-level carbon accounting broadly, converting inhibitors into a compliance purchase. The 5.6% bear case reflects fertilizer affordability pressure squeezing every discretionary input, continued generic price erosion on off-patent inhibitor chemistry, and nutrient efficiency programmes losing budget priority in tighter agricultural economies. Handling chemistry demand barely moves under either scenario.

Cheap Insurance and Expensive Agronomy

The split between handling and efficiency additives explains almost everything commercially. Anti-caking agents, dust suppressants, and hydrophobic coatings solve a physical problem: urea and ammonium nitrate absorb moisture, agglomerate, and turn a warehouse into a solid mass. They cost very little, work reliably, and get bought on price by procurement teams who treat them as insurance.
TOP-FIVE CONCENTRATION38%Combined share of additive supply held by leading manufacturers
ADDITIVE COST PER TONNEUSD 4.20Typical blended additive spend for each fertilizer tonne treated
NITROGEN LOSS REDUCTION38%Average cut in applied nitrogen losses from inhibitor use
INHIBITOR TREATED SHARE17%Portion of nitrogen fertilizer volume treated with efficiency additives
ENHANCED EFFICIENCY PRICE UPLIFT22%Premium fertilizer producers realise on treated product over untreated
HANDLING ADDITIVE DOSE RATE0.2%Typical inclusion by weight for anti-caking and coating
Inhibitors are a different conversation entirely. Between 40% and 60% of applied nitrogen never reaches the crop, escaping as ammonia to the air or nitrate to groundwater, and urease and nitrification inhibitors cut those losses by roughly 38%. That is agronomic chemistry with efficacy data, regulatory approval, and a price justified by nitrogen saved rather than by manufacturing cost.
The buyer sits in the middle of both and is not the farmer. Fertilizer producers and blenders purchase additives, and they buy handling chemistry to protect product integrity and inhibitors only where they can realise the 22% uplift on enhanced efficiency product downstream. When that premium fails to materialise at the farm gate, inhibitor volume disappears from the plant regardless of the agronomy. That single dependency explains the adoption figure better than any agronomic argument does.
"The agronomy on nitrification inhibitors has been settled for twenty years and adoption sits at seventeen percent, which tells you the barrier was never scientific. It was that nobody could find a buyer willing to pay for nitrogen that did not get lost. Carbon accounting is finally producing one."
Practice Director, Crop Nutrition and Agricultural Inputs · MMA Agricultural Chemicals Practice · August 2026

Market Trends

Nitrous Oxide Accounting Turns Inhibitors Into Carbon Tools

Nitrous oxide carries roughly three hundred times the warming effect of carbon dioxide and comes largely from nitrogen applied to soil, which puts nitrification inhibitors directly into farm-level emissions arithmetic. Food companies setting supply chain reduction targets have begun funding inhibitor use in their grower programmes, bringing a payer into a decision agronomy alone never closed. That reframing is what drives 11.2% growth in a segment whose science settled decades ago. The buyer changed rather than the chemistry. Fertilizer producers found themselves supplying a product somebody else had already decided to buy.
Market Impact: India grows fastest at 9.8%
Generic Competition Reshapes Urease Inhibitor Economics

Patents covering the principal urease inhibitor chemistry expired, and generic suppliers entered at prices well below what the originator had held for years. Volume expanded considerably as a result, since the agronomic case works far better at lower cost, and treated tonnage grew even as revenue per tonne fell. Formulation stability and solvent systems became the remaining differentiation, because the active itself degrades in storage and handling. Suppliers competing on molecule alone found there was nothing left to defend. Producers who switched on active price alone reported handling degradation through summer storage afterwards.
Market Impact: Additives cost USD 4.20 per tonne

Market Opportunities and Growth Drivers

Asian Nutrient Efficiency Programmes Expand Treated Volume

Chinese and Indian policy has moved from maximising fertilizer application toward improving nutrient use efficiency, driven by water quality concerns and by subsidy costs that rise with every wasted tonne. Indian neem-coated urea policy demonstrated that a national mandate can convert an entire product category overnight. Both countries consume enormous nitrogen volumes at efficiency rates well below best practice. India grows fastest of any country at 9.8%, and East Asia holds 28% of value on production and consumption scale together. Subsidy arithmetic rather than agronomy is what moves policy in both countries.
Market Impact: Only 17% of volume treated

Storage and Handling Losses Justify Cheap Insurance

Urea and ammonium nitrate absorb atmospheric moisture, agglomerate under stack pressure, and generate dust during transfer that costs product and creates explosion risk in enclosed handling. Anti-caking and coating chemistry at roughly 0.2% inclusion prevents all of it for a few dollars a tonne. No fertilizer producer seriously debates whether to use it. That reliability is exactly why the segment is bought on price alone and why supplier differentiation there has been eroding steadily for years. Regional suppliers with lower overhead compete perfectly well here, which is exactly why the segment offers so little defensible position to anybody.
Market Impact: Inhibitor use falls 30% in downturns

Market Restraints and Challenges

Farm Gate Premium Fails to Reach the Producer

Fertilizer producers buy inhibitors only where enhanced efficiency product commands a premium downstream, and distributors frequently capture that margin without passing it back up the chain. The root cause is that nitrogen saved accrues to the farmer while the additive cost sits with the manufacturer. Suppliers mitigate through direct grower agronomy programmes that build pull demand, through food company sustainability funding that pays from outside the chain entirely, and through regulatory categories that make efficacy claims defensible enough to price against. None of that changes where the cost and the benefit sit.
Market Impact: Cuts emissions across 17% treated

Fertilizer Affordability Squeezes Every Discretionary Input

Nitrogen prices moved violently through recent years on natural gas costs, and when fertilizer itself becomes unaffordable, growers cut application rates before they add anything optional to the bag. The root cause is that inhibitors improve efficiency rather than delivering nutrient, so they read as discretionary at exactly the moment efficiency matters most. Mitigation runs through demonstrating return per dollar under reduced application, through blended product pricing that hides the additive line, and through regulatory or buyer mandates that remove the choice. Nitrogen price volatility makes the timing almost impossible to plan around.
Market Impact: Urease inhibitors still grow 9.8%
4 additional market trends, 3 additional growth drivers, and 2 additional restraints and challenges are covered in the full report. Contact sales@marketmindsadvisory.com to access the complete intelligence.

Segment CAGR and Growth Architecture

Segmentation follows additive functional type, because each function solves a different problem, carries a different regulatory position, and is bought by a different part of the fertilizer producer's organisation. Six functions cover commercial supply, and the divide between physical handling chemistry and agronomic efficiency chemistry governs pricing far more than any formulation difference does.
fertilizer-additives-market-trends-market-share-analysis-1787551275657

Nitrification Inhibitors

The fastest function at 11.2%, roughly 1.65 times the market, and the one whose growth comes from a change in who pays rather than any change in what it does. These compounds slow the bacterial conversion of ammonium to nitrate, which reduces leaching to groundwater and nitrous oxide release to air. Since nitrous oxide carries roughly three hundred times the warming effect of carbon dioxide, food companies with supply chain targets now fund adoption directly. European fertilising products rules created a defined category with efficacy requirements, which made the claim defensible. Soil temperature and type govern real-world performance considerably. Adoption still depends on somebody outside the fertilizer chain being willing to fund it.
CAGR 11.2%

Urease Inhibitors

Second fastest at 9.8%, addressing ammonia volatilisation from surface-applied urea, which can lose a substantial fraction of applied nitrogen within days under warm dry conditions. Patents on the principal chemistry expired and generic entry cut pricing sharply, expanding volume while compressing revenue per treated tonne considerably. Formulation is now the differentiation rather than the active, since the compound degrades in storage and requires solvent systems that hold it stable through handling and blending. Surface application without incorporation is where the agronomic case is strongest, which ties demand to tillage practice as much as to policy. Generic actives from Asian producers now supply most of the market, which concentrated sourcing into fewer qualified origins than most buyers appreciate.
CAGR 9.8%
Full segment breakdown across 6 segments available in the complete report.

Regional Architecture and Country Demand Map

Regional shares follow nitrogen fertilizer consumption weighted by how much of it carries an efficiency additive. Two regions sit above the standard bands for reasons named below, reflecting consumption volumes that the default ranges were not drawn around at all. Nitrogen tonnage on its own would mislead badly here.

North America

Inhibitor penetration runs higher here than almost anywhere, supported by nutrient management planning requirements in watershed states and by large-scale corn production where nitrogen is the dominant input cost. Koch Agronomic Services holds a substantial position built on urease inhibitor chemistry and grower-facing agronomy. Food company supply chain emissions programmes have begun funding adoption directly in the Midwest, which introduces a payer outside the fertilizer chain. Anti-caking demand tracks urea and ammonium nitrate handling at terminals and blenders. Growth of 6.6% is carried by efficiency chemistry rather than by any tonnage increase. Corn belt nitrogen economics make the return calculation straightforward, which is why penetration here runs well ahead of the global average.
Share: 22% | CAGR: 6.6% (2026 to 2036)

Western Europe

Fertilising products regulation created a defined inhibitor category with efficacy requirements, which turned an agronomic claim into a regulated one and gave suppliers something defensible to price against. Nitrate directive limits in vulnerable zones make loss reduction a compliance matter rather than an optimisation. Ammonium nitrate handling requires careful anti-caking and coating chemistry given its physical behaviour. Clariant, Solvay, and regional specialists serve producers across the region. Growth of 5.2% is the slowest anywhere, reflecting flat fertilizer consumption and inhibitor penetration already well above the global average. Fertilizer consumption itself has been flat or declining for years under nitrate compliance and land use change, which caps handling additive volume regardless of what inhibitor adoption does.
Share: 18% | CAGR: 5.2% (2026 to 2036)
Regional intelligence for 5 additional markets available in the complete report: East Asia, South Asia and Pacific, Latin America, Middle East and Africa, Eastern Europe. Contact sales@marketmindsadvisory.com.
fertilizer-additives-market-trends-country-cagr-analysis-1787551276173

Four Moves That Shift Position

Advantage here comes from selling nitrogen saved rather than chemistry supplied, and from finding somebody in the chain willing to pay for it. Four moves justify capital across the forecast period, and the first addresses why a settled agronomic case still reaches only 17% of the volume it should. The payer question comes before every other one.

Sell inhibitors to sustainability budgets, not agronomy

Nitrous oxide carries roughly three hundred times the warming effect of carbon dioxide and comes largely from applied nitrogen, which puts inhibitors inside food company supply chain emissions targets. Those companies have budgets agronomy departments never had and are funding grower adoption directly. The chemistry has been settled for decades and penetration sits at 17%, which proves the barrier was always the payer rather than the science. Suppliers still pitching agronomy to fertilizer procurement are addressing the wrong buyer entirely. Reaching those budgets requires commercial people who have never called on a fertilizer plant.
Market Impact: Addresses the untreated 83% of nitrogen fertilizer volume

Compete on formulation stability, not active molecule

Urease inhibitor patents expired and generic entry cut pricing sharply, which removed the molecule as any basis for differentiation across the segment. What remains is formulation: the active degrades in storage and requires solvent systems holding it stable through blending, bagging, and months in a humid warehouse. Suppliers who invested in that chemistry retained volume through the price collapse and hold it now. Those competing on active supply alone found there was nothing to defend once the patent lapsed. Independent stability testing costs relatively little and supports price recovery of 15 to 25% against generic quotations.
Market Impact: Defends volume even as active prices fall 40%

Build grower agronomy to create pull demand

Fertilizer producers buy inhibitors only where enhanced efficiency product realises the 22% premium downstream, and distributors frequently capture that margin instead of passing it back. Direct grower programmes with field trial data create demand the producer must then satisfy, which reverses the negotiation entirely. Building that capability costs field agronomists and several seasons of trial work before it returns anything at all. Suppliers who have it are selling into pull rather than arguing cost with procurement teams every year. Distributors capturing that margin have no reason to cooperate, which is exactly why the demand has to be created above them.
Market Impact: Targets the entire 22% price uplift realised downstream

Localise handling chemistry to regional conditions

Anti-caking and coating chemistry at 0.2% inclusion is bought on price because it works reliably everywhere, which makes it a commodity in temperate conditions. Tropical humidity, long ocean freight into Brazil, and Gulf export storage present genuinely harder problems where formulation performance still differs measurably between suppliers. Producers shipping into those conditions will pay for chemistry that arrives with product intact. Competing on price in temperate markets while ignoring where the difficulty actually sits leaves margin on the table. Applying one commercial approach across temperate and tropical destinations concedes margin in the only place it is still available.
Market Impact: Recovers margin above the USD 4.20 tonne benchmark

Who Controls the Margin Pool

Concentration sits at roughly 38% for the top five on additive supply revenue, and inhibitor chemistry rather than handling additives accounts for essentially all of it. Koch Agronomic Services holds the strongest urease inhibitor position with grower-facing agronomy behind it. Clariant and Solvay bring surfactant and formulation depth across both halves of the market. ArrMaz is entrenched in phosphate and granulation chemistry, and Dorf Ketal competes strongly across Asian producers.
Competition runs on three dimensions. Regulatory approval and efficacy data is the first, since European rules turned inhibitor claims into a defensible category. Formulation stability is the second, and it survived the patent expiry that removed molecule differentiation. Grower relationship is the third, because pull demand is what makes a producer buy at all.

Pressure is building from two directions. Generic inhibitor suppliers keep eroding pricing on off-patent chemistry with no formulation investment to recover. Regional producers in China and India serve local fertilizer manufacturers at costs international suppliers cannot match on handling additives. Rankings will shift toward suppliers holding efficacy data and grower access rather than toward whoever formulates cheapest. Chemistry supply alone has stopped being a defensible position in the growth half.
fertilizer-additives-market-trends-company-positioning-matrix-1787551276703

Competitive Moat and Risk Dimensions

KOCH AGRONOMIC SERVICES

Moat: Grower agronomy and field data

Koch built field trial data and grower-facing agronomy over many seasons, which creates demand the fertilizer producer must satisfy rather than a cost the producer negotiates down. That pull position survived patent expiry on the underlying chemistry because the relationship was never about molecule supply. Rebuilding it requires field agronomists and several seasons of trials before returning anything at all.
KOCH AGRONOMIC SERVICES

Risk: Generic pricing on core chemistry

The principal urease inhibitor active is off patent and generic suppliers price well below historical levels with no formulation or agronomy investment to recover. Defending realised price means proving formulation stability and field performance repeatedly to buyers who can see a cheaper active on the same specification sheet. That argument gets harder every season it has to be made again.
CLARIANT

Moat: Surfactant and formulation chemistry depth

Clariant brings genuine surfactant and coating expertise across anti-caking, dust control, and hydrophobic chemistry, which lets it solve the harder handling problems where tropical humidity and long freight defeat commodity products. That capability also transfers into inhibitor formulation stability, where the active degrades without a properly designed solvent system. Few competitors span both halves of this market credibly.
CLARIANT

Risk: Limited grower-facing agronomy

Inhibitor demand is increasingly created at grower and food company level rather than negotiated with fertilizer procurement, and Clariant's chemistry strength does not reach those conversations. Building field agronomy capability takes seasons and sits well outside a specialty chemicals operating model. Competitors who already have it sell into pull demand while Clariant argues formulation merit with purchasing departments.

Players Tracked

Prominent Players

Koch Agronomic Services
Clariant
ArrMaz
Solvay
Dorf Ketal

Other Key Players

Nouryon
Kao Corporation
Michelman
Novochem Group
Forbon Technology
Yara International
ICL Group
EuroChem
Timac Agro
Chemipol
Filtra Catalysts
Amit Trading
Sichuan Chuanhua Chemical
Tolsa
Kemira

Recent Developments

FEBRUARY 2025

Food company funds nitrification inhibitor use across grower programme

A multinational food manufacturer began paying for nitrification inhibitor application within its cereal supply chain, counting the nitrous oxide reduction against corporate emissions targets. The fertilizer producer supplying those growers carried none of the additive cost under the arrangement at all. The grower paid nothing either.
Signal: Funding is arriving from outside the fertilizer chain entirely, which changes who the supplier actually sells to
JUNE 2025

Generic urease inhibitor entry pressures established pricing

Additional generic suppliers entered the urease inhibitor market following patent expiry, quoting materially below established levels without accompanying formulation stability data or field trial support. Several fertilizer producers switched on price and reported handling degradation during summer storage afterwards. Several of them then reverted at considerable additional cost.
Signal: Formulation rather than active supply is what separates suppliers now that the molecule is freely available
OCTOBER 2025

Brazilian importer specifies tropical-grade coating chemistry

A major Brazilian fertilizer importer moved to a hydrophobic coating specification designed for ocean freight and tropical warehouse humidity, after repeated cargoes arrived caked despite carrying standard anti-caking treatment. Cost per tonne rose while total product loss fell substantially across the season. Standard treatment had never been enough.
Signal: Handling chemistry stops being a commodity wherever storage and freight conditions are genuinely difficult rather than temperate

What Sits Behind the Price

Active ingredient synthesis dominates inhibitor products at roughly 46% of cost, covering the phosphoric triamide and pyrazole chemistries produced in Europe, China, and India. Solvent systems holding those actives stable take a further 18%. On handling additives the picture inverts entirely: amine and surfactant feedstocks derived from fatty acids and petrochemicals account for 52%, with mineral oil, wax, and clay carriers adding 21%.
Fatty amine and surfactant feedstock costs moved sharply through 2022 and 2023 with palm and petrochemical pricing, and handling additive suppliers on annual fertilizer producer contracts absorbed most of it directly. Clariant and Solvay both discussed raw material cost pressure and pricing recovery in their reporting for those years. Inhibitor actives moved differently, driven by generic capacity entering from Asian producers rather than by any feedstock movement at all.

Exposure divides on portfolio position rather than on scale. Handling additive suppliers carry full feedstock exposure against thin commodity margins and annual contracts that reprice slowly, so any input move lands directly on profit. Inhibitor suppliers hold margins wide enough to absorb feedstock swings but face price erosion from generic entry that no procurement discipline addresses. Suppliers holding both are hedged against different risks in each half.
fertilizer-additives-market-trends-cost-volatility-analysis-1787551276901

Index handling additive contracts to feedstock references

Annual fertilizer producer agreements priced firm against volatile fatty amine and surfactant feedstocks transfer the entire input risk to the supplier for no compensating return. Indexation to published references removes that mismatch and rarely loses a contract outright. Suppliers pricing firm on twelve-month terms in a commodity business are carrying a risk they never chose to take on.

Recover formulation value where conditions are difficult

Handling chemistry is a commodity in temperate storage and genuinely differentiated under tropical humidity, long ocean freight, or Gulf export conditions. Suppliers should price accordingly rather than applying one commercial approach everywhere. Producers whose cargoes arrive caked will pay for chemistry that works, and the cost difference per tonne is small against the product loss they are already absorbing.

Secure second sources for inhibitor actives

Phosphoric triamide and pyrazole actives now come substantially from Asian generic producers, which lowered costs and concentrated supply into fewer qualified sources than most buyers realise. Qualifying alternates costs stability testing time across the formulation. Suppliers relying on a single active source are exposed on a product line where margins are otherwise the best they have.

Portfolio Architecture for Margin Defence

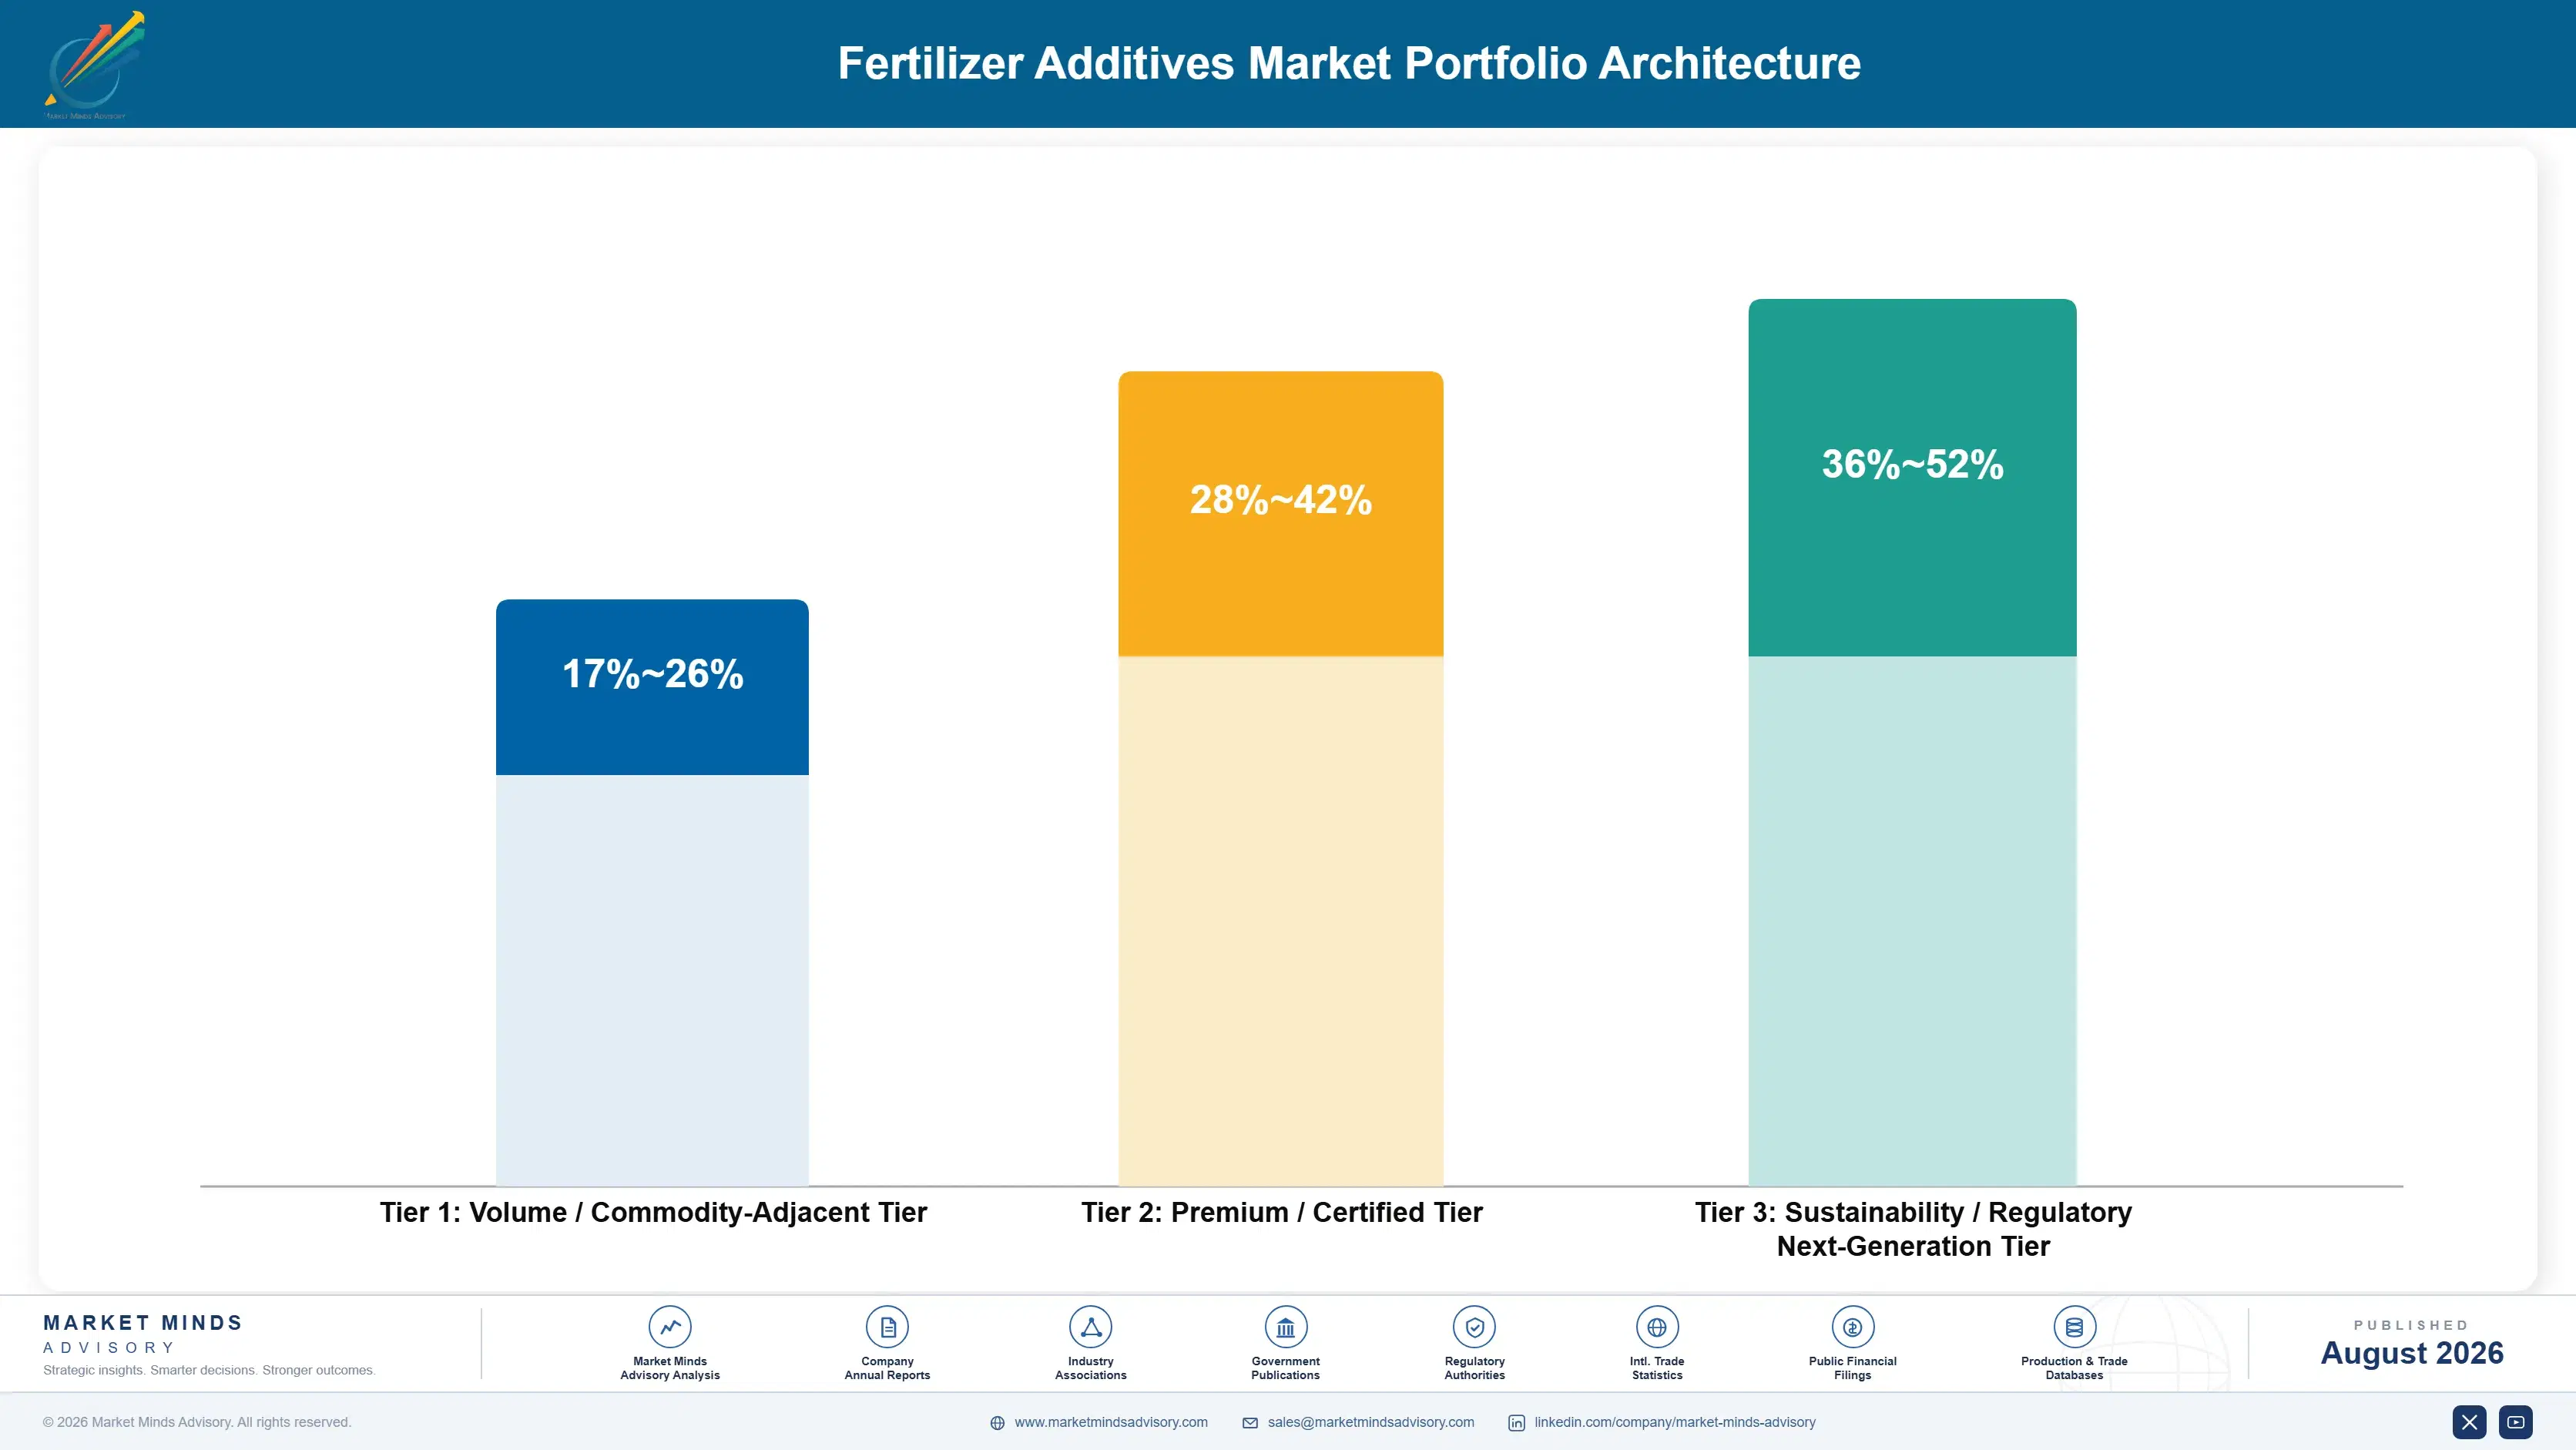
Margin architecture divides along the same line as everything else in this market. Anti-caking and dust control chemistry sold into temperate handling earns commodity returns, competes on feedstock cost, and faces regional suppliers with lower overhead everywhere. Coating chemistry for tropical and ocean freight conditions earns considerably more because product genuinely arrives caked without it. Inhibitors earn most, though generic entry has narrowed that gap on urease chemistry sharply.
The volume and premium tension is really about who the supplier can reach. Handling additives sell to fertilizer plant procurement in large predictable volumes at prices set by the cheapest credible alternative. Inhibitors sell into a decision that starts with a grower or a food company and only later becomes a purchase order. Reaching that far up the chain requires agronomy capability that specialty chemicals organisations rarely have.

High-value pools concentrate in nitrification inhibitors funded by sustainability budgets, formulation-stable urease products surviving generic pricing, and handling chemistry engineered for genuinely difficult storage. Each is defended by efficacy data, formulation capability, or grower relationship rather than by manufacturing cost, which is why concentration sits at 38% rather than lower.

Volume / Commodity-Adjacent Tier

Anti-caking, anti-dusting, and colorant chemistry into temperate storage and handling at around 0.2% inclusion. Bought on price by procurement treating it as insurance. Regional suppliers compete effectively with lower overhead everywhere.
Gross Margin: 17%-26%

Premium / Certified Tier

Hydrophobic coatings engineered for tropical humidity, ocean freight, and Gulf export storage, plus formulation-stable urease inhibitors surviving generic price pressure. Performance genuinely differs here. The range reflects wide variation between temperate and difficult conditions.
Gross Margin: 28%-42%

Sustainability / Regulatory / Next-Generation Tier

Nitrification inhibitors carrying regulatory efficacy approval and funded increasingly through food company emissions budgets rather than agronomy. The range is wide because funding source and regulatory status differ enormously between markets and buyers.
Gross Margin: 36%-52%
fertilizer-additives-market-trends-portfolio-architecture-1787551277399

High-value Sub-segments and Strategic Watch-out

Sustainability-Funded Nitrification Inhibitors

Growing at 11.2% because food companies with emissions targets now pay directly, which solves the payer problem that held penetration at 17% for decades. The agronomy was never the obstacle here at all. Programme duration follows the corporate commitment behind it rather than any agronomic cycle.
Gross Margin: 38%-52%

Formulation-Stable Urease Products

Growing at 9.8% despite generic pricing, because the active degrades in storage and solvent system design decides whether it survives blending and months of humid warehousing. Molecule supply alone defends nothing now. Independent stability testing against generic alternatives is what makes the price difference genuinely arguable.
Gross Margin: 28%-40%

Tropical and Freight Coating Chemistry

Handling additives stop being commodities where ocean transit and tropical humidity defeat standard products, and Brazilian and Gulf volumes are large. Producers absorbing caked cargo losses will pay for chemistry that actually works. Gulf export storage presents much the same problem from an entirely different direction.
Gross Margin: 30%-42%

Temperate Anti-Caking Supply

The strategic watch-out. Reliable, cheap, entirely undifferentiated, and bought annually on price by procurement teams with several credible alternatives. Feedstock exposure lands straight on profit with no margin cushion available. Regional suppliers with lower overhead win these tenders regularly and there is no answer beyond price.
Gross Margin: 17%-26%

How Additive Volume Gets Committed

Demand reaches suppliers through two chains that share a customer and nothing else. Handling additives are specified by plant operations, purchased annually by procurement, and renewed on price against alternatives that all work adequately. Inhibitor demand originates further away, with a grower deciding nitrogen efficiency is worth paying for, a food company funding emissions reduction, or a regulator making loss reduction a compliance matter. The fertilizer producer then buys because someone downstream has already decided.
Stickiness follows where the decision was made. Sustainability-funded inhibitor programmes hold for the length of the corporate commitment behind them. Regulated efficacy categories hold on approval status. Grower-pulled volume holds while trial data stays credible. Handling additive supply holds until the next annual tender. Nothing in the handling half generates loyalty of any kind.

The deciding buyer for the growth half of this market now sits outside the fertilizer industry altogether, in food company sustainability functions and grower advisory relationships. Those people evaluate emissions factors and yield response data. Fertilizer procurement still signs the purchase order, and increasingly signs what someone else has already specified. Suppliers organised entirely around fertilizer plant relationships cannot see any of that happening.
fertilizer-additives-market-trends-end-use-penetration-index-1787551277893

Where the Growth Actually Sits

These are among the four positions where our research anticipates prominent divergence between winners and laggards over the coming forecast period. Each is grounded in the demand model, the regulatory perimeter, and the announced capacity pipeline.
01 / EMISSIONS BUDGET ACCESS

Sell nitrogen loss to sustainability, not agronomy

Nitrous oxide carries roughly three hundred times the warming effect of carbon dioxide and comes largely from nitrogen applied to soil, which places inhibitors squarely inside food company supply chain emissions targets and the budgets attached to them. Penetration has sat at 17% for decades on chemistry that was scientifically settled long ago, which proves the constraint was always finding a payer rather than proving efficacy. Suppliers still pitching agronomy to fertilizer procurement teams are addressing the wrong buyer entirely.
02 / FORMULATION STABILITY DEFENCE

Compete on solvent systems, not the active

Patent expiry on the principal urease inhibitor removed the molecule as any basis for differentiation, and generic suppliers now quote well below historical pricing without formulation or agronomy investment to recover from anywhere. What remains defensible is stability chemistry, since the active degrades through blending, bagging, and months in a humid warehouse before it ever reaches soil. Suppliers who invested there retained volume through the price collapse while those selling active alone found there was nothing left at all to hold onto.
03 / GROWER PULL CREATION

Build field agronomy to reverse the negotiation

Fertilizer producers buy inhibitors only where enhanced efficiency product realises its roughly 22% premium downstream, and distributors frequently capture that margin rather than passing it back up the chain to the manufacturer. Direct grower programmes carrying credible field trial data create demand the producer then has to satisfy, which turns an annual cost negotiation into a specification the buyer has already requested. Building that capability costs field agronomists and several seasons of trials before it returns anything measurable back to the business.
04 / DIFFICULT CONDITION POSITIONING

Price handling chemistry where storage is hard

Anti-caking and coating additives at roughly 0.2% inclusion are commodities in temperate warehousing because every credible product works, which is exactly why procurement buys them on price alone every single year. Tropical humidity, long ocean freight into Brazil, and Gulf export storage present problems where formulation performance still differs measurably between suppliers and cargoes genuinely arrive caked. Producers absorbing that product loss will pay for chemistry that works, and the per-tonne difference is small against what those cargoes already cost them.

Engagement Snapshot From the Field

A live engagement with an industry participant carrying material or product regulatory and market exposure ahead of a defining policy shift, showing how our research translates into a defensible multi-year portfolio strategy.
MARKET MINDS ADVISORY · CLIENT ENGAGEMENT SUMMARY
Fertilizer Additives Producer Strategic Portfolio Review and Transition Roadmap 2026·Investment Scenario on Fertilizer Additives Exposure Evaluation 2025-26
CLIENT PROFILE
A European specialty chemicals producer with fertilizer additive revenue near EUR 145 million (client-reported, unverified by MMA), supplying anti-caking, dust control, and coating chemistry to fertilizer manufacturers across Europe and the Middle East. Inhibitor products had been developed but never commercialised at scale, and margins had declined for five consecutive years running. No grower-facing capability existed anywhere.
STRATEGIC CHALLENGE
Handling additives were being tendered annually against regional suppliers with lower overhead, and the client had no answer beyond price. Its inhibitor formulations sat unsold because no route to grower or food company demand existed. Every commercial conversation ran through fertilizer plant procurement, which cared only about cost per tonne.
MMA APPROACH
MMA separated realised margin by additive function and destination market, assessed food company emissions programmes funding grower adoption, and evaluated what field agronomy capability would cost against the inhibitor opportunity. Forty-seven expert interviews with fertilizer producers, grower advisers, and food company sustainability leads established where inhibitor purchasing decisions genuinely originate now.
KEY FINDINGS
  1. Handling additive margin on temperate European business had fallen below the cost of serving it, while Gulf export and tropical destinations returned substantially more for chemistry the client already made.
  2. Three food companies operating cereal supply chains in the client's markets were funding nitrification inhibitor adoption directly, and none had ever been contacted by the business.
  3. The client's inhibitor formulations showed better storage stability than generic competitors in independent testing, and that advantage had never been documented in any customer-facing material.
  4. Every commercial relationship ran through fertilizer plant procurement, giving the business no visibility of the grower and food company decisions that now determine inhibitor volume entirely.
CLIENT PROFILE
A European specialty chemicals producer with fertilizer additive revenue near EUR 145 million (client-reported, unverified by MMA), supplying anti-caking, dust control, and coating chemistry to fertilizer manufacturers across Europe and the Middle East. Inhibitor products had been developed but never commercialised at scale, and margins had declined for five consecutive years running. No grower-facing capability existed anywhere.
STRATEGIC CHALLENGE
Handling additives were being tendered annually against regional suppliers with lower overhead, and the client had no answer beyond price. Its inhibitor formulations sat unsold because no route to grower or food company demand existed. Every commercial conversation ran through fertilizer plant procurement, which cared only about cost per tonne.
MMA APPROACH
MMA separated realised margin by additive function and destination market, assessed food company emissions programmes funding grower adoption, and evaluated what field agronomy capability would cost against the inhibitor opportunity. Forty-seven expert interviews with fertilizer producers, grower advisers, and food company sustainability leads established where inhibitor purchasing decisions genuinely originate now.
KEY FINDINGS
  1. Handling additive margin on temperate European business had fallen below the cost of serving it, while Gulf export and tropical destinations returned substantially more for chemistry the client already made.
  2. Three food companies operating cereal supply chains in the client's markets were funding nitrification inhibitor adoption directly, and none had ever been contacted by the business.
  3. The client's inhibitor formulations showed better storage stability than generic competitors in independent testing, and that advantage had never been documented in any customer-facing material.
  4. Every commercial relationship ran through fertilizer plant procurement, giving the business no visibility of the grower and food company decisions that now determine inhibitor volume entirely.
RECOMMENDED STRATEGY
Phase 1: Phase one: reprice or exit temperate handling business below cost to serve, and redirect commercial effort toward Gulf export and tropical destinations where chemistry still differs. Phase 2: Phase two: document formulation stability against generic alternatives in independent testing, giving the sales organisation something defensible beyond price comparison. Phase 3: Phase three: open direct engagement with food company sustainability functions funding grower inhibitor adoption, building the demand route the business has never had.
OUTCOME
The client exited three unprofitable temperate contracts and won two tropical coating specifications within a year. Stability testing supported price recovery on inhibitor products, a food company grower programme agreement was signed, and blended gross margin improved 7.1 percentage points (client-reported, unverified by MMA). Two more tropical specifications are in trial.

Frequently Asked Questions

Foundational context covering the market sizes, CAGR, scope, country, region and competition that inform every finding below. This section is provided to cover basics and most often pre-purchase conversations, answered from the MMA Primary Research Dataset.

What is the current size of the Fertilizer Additives Market?

The market was valued at USD 3.2 billion in 2025, rising to an estimated USD 3.42 billion in 2026. East Asia holds the largest regional share at 28% of value.

How large will the Fertilizer Additives Market be by 2036?

MMA forecasts USD 6.6 billion by 2036 under the base case, an expansion multiple of 1.93 times the 2026 value. That represents USD 3.18 billion of incremental value.

What is the CAGR for the Fertilizer Additives Market 2026 to 2036?

The base case CAGR is 6.8%, with a bull case of 8.0% and a bear case of 5.6%. The spread reflects uncertainty over emissions accounting and fertilizer affordability.

Which segment is growing fastest?

Nitrification inhibitors grow fastest at 11.2%, roughly 1.65 times the market rate, funded increasingly by food company emissions budgets. Urease inhibitors follow at 9.8% despite generic pricing.

Who are the major companies in the Fertilizer Additives Market?

Koch Agronomic Services, Clariant, ArrMaz, Solvay, and Dorf Ketal lead, holding roughly 38% between them. Inhibitor chemistry rather than handling additives accounts for essentially all that concentration.

Which country is growing fastest?

India grows fastest at 9.8%, driven by nutrient efficiency policy and nitrogen consumption second only to China's. Neem-coated urea showed how quickly a national mandate converts a category.

Report Segmentation Architecture

The full report scope spans multiple orthogonal segmentation dimensions, with cross-tabulated demand data provided for each dimension pair. Coverage extends further to regional breakdowns, trend trajectories, and the competitive detail needed to support segment-level decision-making.

By Additive Functional Type

  • Anti-Caking Agents
  • Anti-Dusting Agents
  • Hydrophobic Coating Agents
  • Urease Inhibitors
  • Nitrification Inhibitors
  • Colorants and Granulation Aids

By End-Use Industry

  • Urea and Nitrogen Fertilizer Production
  • Phosphate Fertilizer Production
  • Potash and Compound Fertilizer Blending
  • Bulk Storage and Terminal Handling
  • Enhanced Efficiency Fertilizer Manufacture

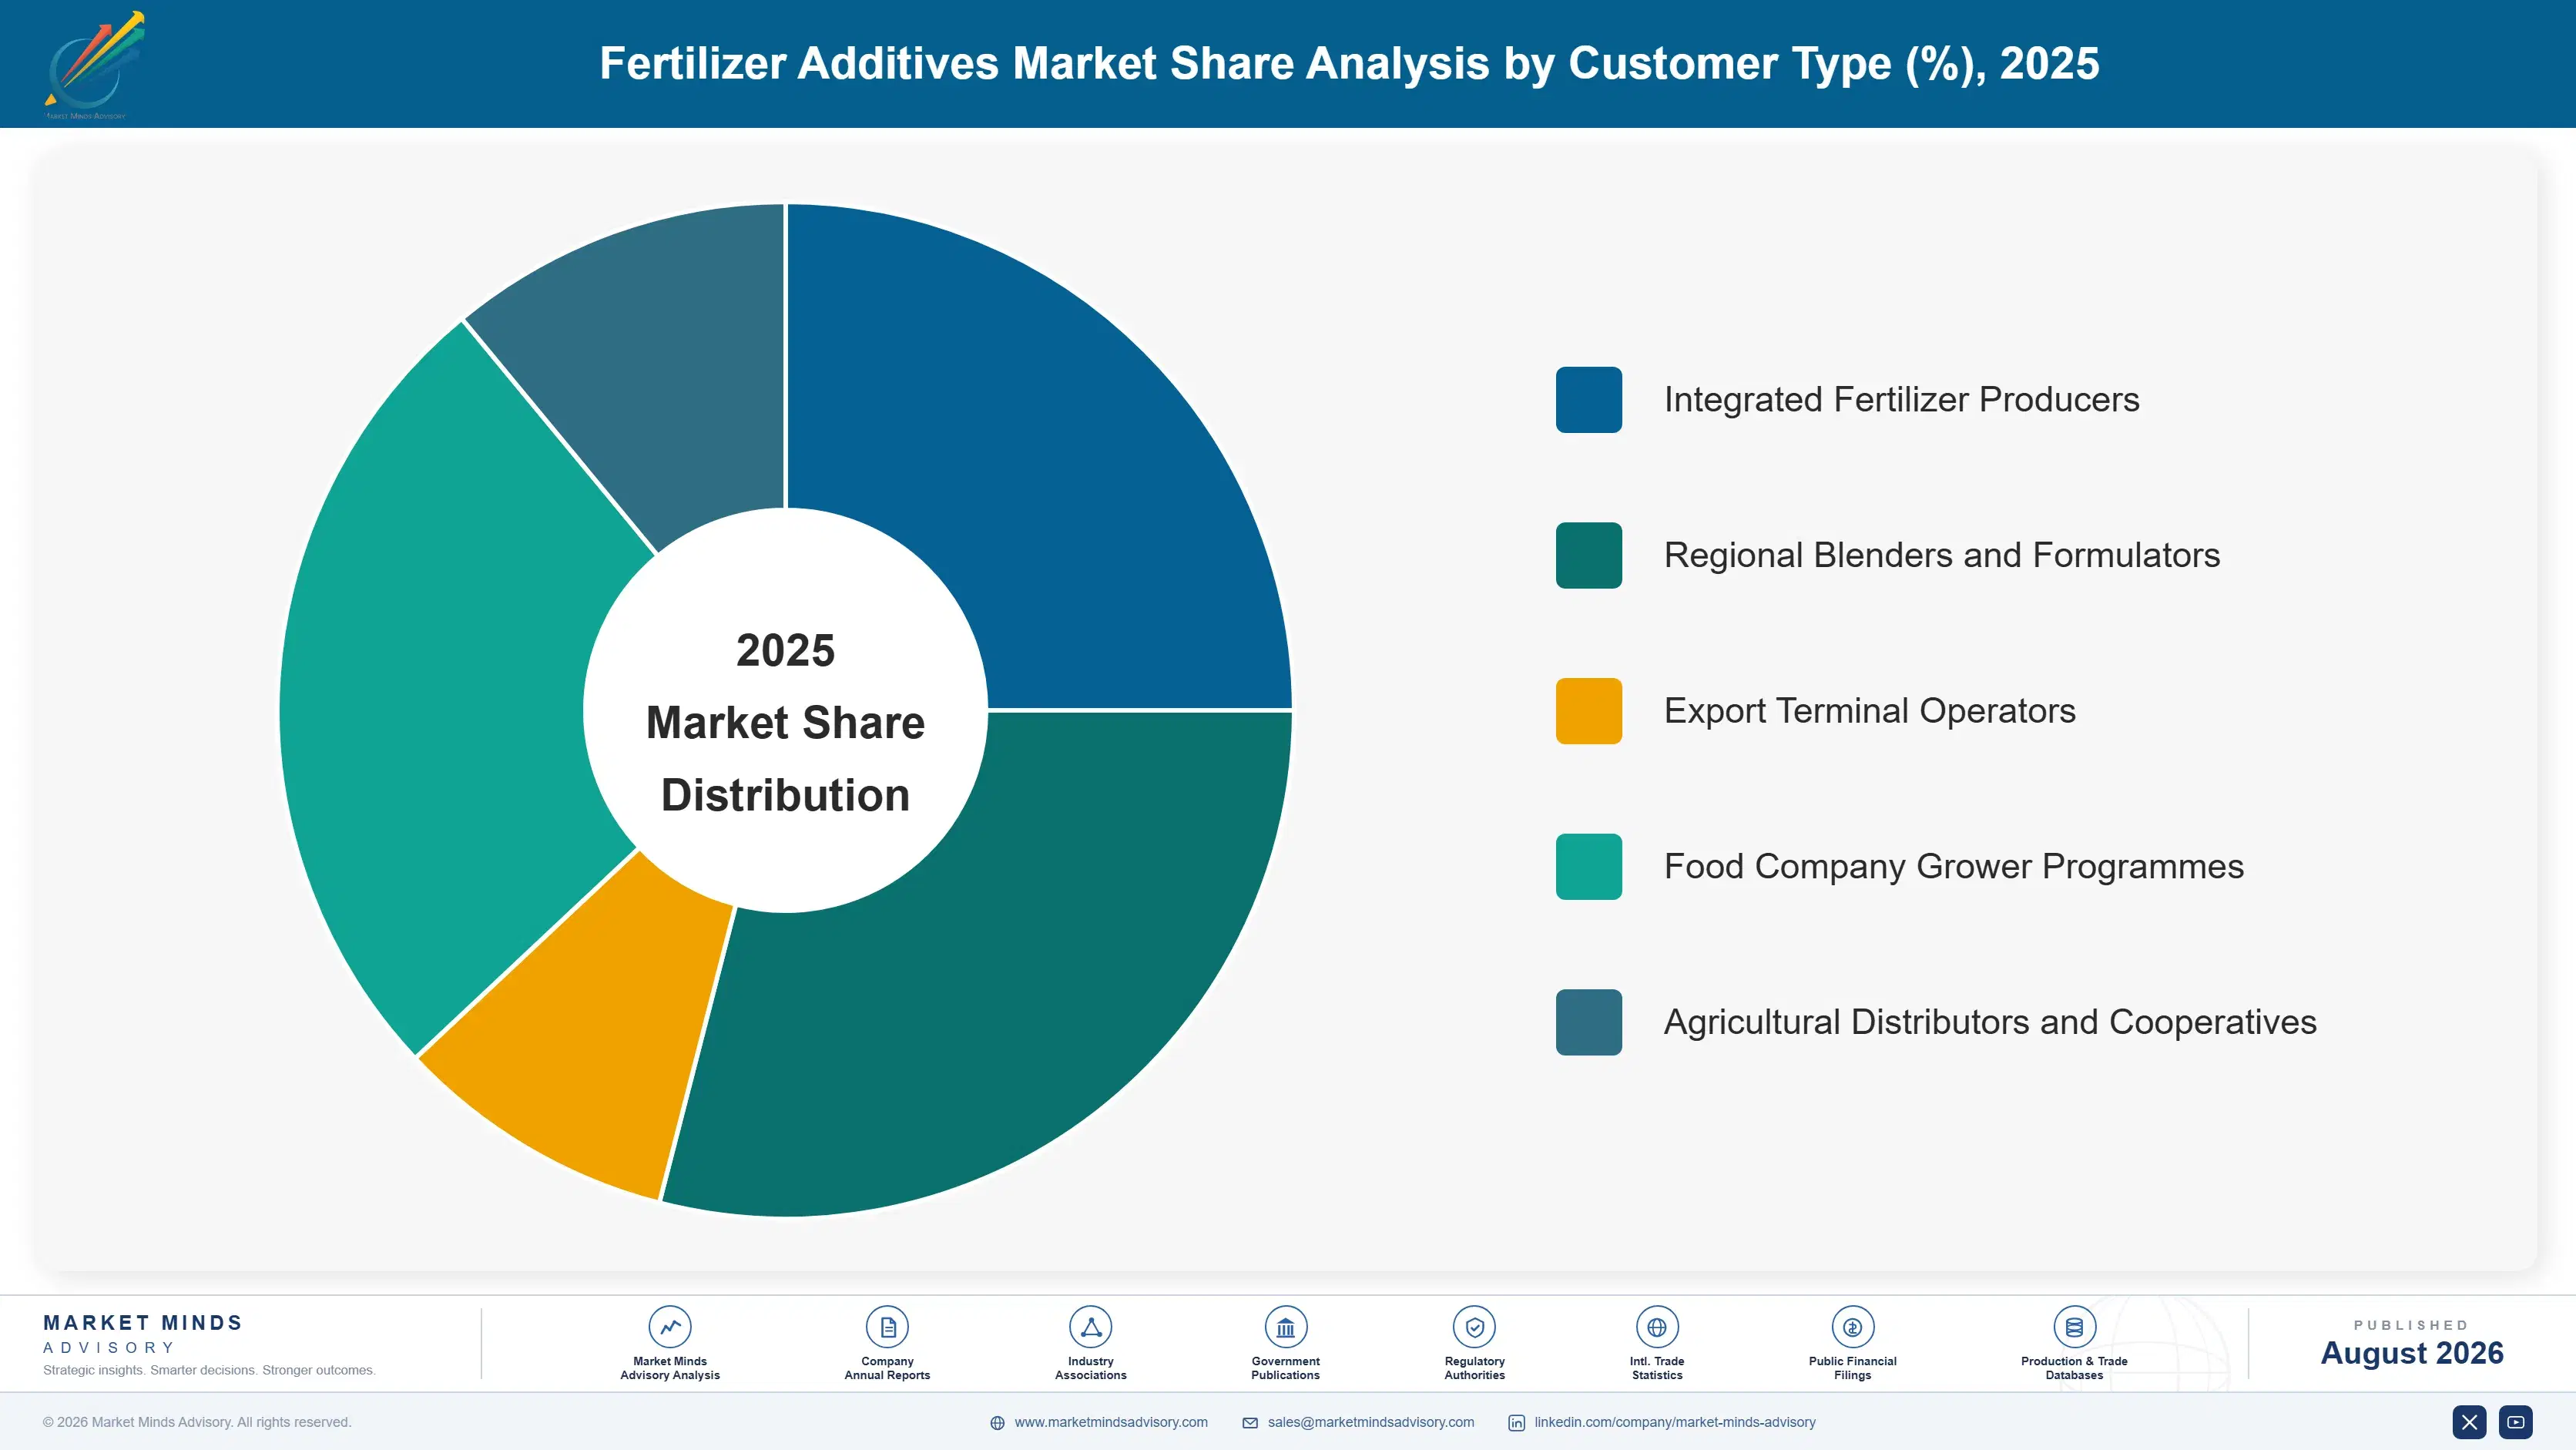
By Customer Type

  • Integrated Fertilizer Producers
  • Regional Blenders and Formulators
  • Export Terminal Operators
  • Food Company Grower Programmes
  • Agricultural Distributors and Cooperatives

By Region

  • North America
  • Western Europe
  • East Asia
  • South Asia and Pacific
  • Latin America
  • Middle East and Africa
  • Eastern Europe

Scope, Methodology, and Coverage

Every figure in this report is reproducible from documented input assumptions. The scope below maps the historical period, the forecast horizon, the segmentation dimensions, and the countries covered, alongside the underlying primary and qualitative methodology.
Historical Period
2020 to 2025
Forecast Period
2026 to 2036
Base Year
2025 (USD billions; MMA Primary Research Dataset, August 2026)
Market Definition
The market comprises chemical additives applied to mineral fertilizers during or after manufacture, covering anti-caking agents, anti-dusting agents, hydrophobic coating agents, urease inhibitors, nitrification inhibitors, and colorants with granulation aids. Value is measured at additive supplier level on material sold to fertilizer producers, blenders, and terminal operators. Fertilizer nutrients themselves, biostimulants and microbial inoculants, controlled-release polymer coated products sold as finished fertilizer, soil amendments and liming materials, and crop protection chemicals fall outside scope.
Quantitative Units
USD billions (current prices); thousand tonnes of additive supplied annually; USD per tonne of fertilizer treated by additive function
Segmentation Dimensions
By Additive Functional Type; By End-Use Industry; By Customer Type; By Region
Regions Covered
North America, Western Europe, East Asia, South Asia and Pacific, Latin America, Middle East and Africa, Eastern Europe
Countries Covered
China, Japan, South Korea, Indonesia, India, Vietnam, Thailand, Australia, Pakistan, United States, Canada, Mexico, Germany, France, Netherlands, United Kingdom, Spain, Italy, Belgium, Poland, Romania, Ukraine, Brazil, Argentina, Colombia, Chile, Saudi Arabia, Qatar, Egypt, Nigeria
Key Companies Profiled
Koch Agronomic Services, Clariant, ArrMaz, Solvay, Dorf Ketal, Nouryon, Kao Corporation, Michelman, Novochem Group, Forbon Technology, Yara International, ICL Group, EuroChem, Timac Agro, Chemipol, Filtra Catalysts, Amit Trading, Sichuan Chuanhua Chemical, Tolsa, Kemira
Quantitative Methodology
Primary survey, n=3,800 respondents, Q4 2025, six countries; demand-side model with trade association cross-validation
Qualitative Methodology
47 expert interviews, Q4 2025; applied to validate demand model assumptions, identify emerging dynamics, and assess competitive positioning
Report Format
PDF and XLSX data workbook (Word format preview document)
Publisher
Market Minds Advisory
Report Code
MMA-2026-AGR-142
Published
August 2026
Contact
sales@marketmindsadvisory.com | www.marketmindsadvisory.com

Purchase the full Fertilizer Additives Market Report (2026 to 2036).

The full report sizes fertilizer additive demand across six functional types, five end-use categories, and seven regions with 2026 to 2036 forecasts under base, bull, and bear cases. It separates physical handling chemistry from agronomic efficiency additives, since the two are bought by different people for different reasons at entirely different margins. Competitive profiles cover twenty suppliers assessed consistently on additive supply revenue, formulation capability, and grower channel access. Cost analysis traces active ingredient, surfactant, and solvent exposure by product line. Commercial guidance addresses emissions budget access, formulation defence, grower pull creation, and difficult-condition positioning.
Six additive functions sized separately by region
Handling chemistry separated from agronomic efficiency additives
Inhibitor penetration rates mapped by crop and geography
Food company emissions funding tracked across grower programmes
Generic price erosion modelled on off-patent inhibitor chemistry
Storage condition severity assessed against coating performance requirements

Built For The People Who Decide

From boardroom strategy to bench-side execution, this report is read cover-to-cover by leaders shaping the next decade of their industry, turning demand scenarios, market dynamics and valuation benchmarks into decisions.
CXOs/ Presidents/ VPs/ Managers
M&A and Corporate Development
Strategy Teams and R&D Heads
Procurement and Product Directors
Regulatory and Compliance Leaders
Investor Relations and Equity Analysts