Market Minds Advisory
Ferrovanadium Market

Ferrovanadium Market: Rebar Standards, Niobium Substitution, and Supply That Ignores Its Own Price

Most vanadium arrives as a by-product of making steel, so supply answers to steel output rather than to vanadium prices. That single fact explains why this market swings 6.4 times between peak and trough.

Lead Analyst

Bilal Shaikh

Published

September 2026

Make Smarter Decisions with Customized Research Insights

Request a free sample report and evaluate market opportunities, growth trends, and competitive dynamics relevant to your business needs.

2025 MARKET VALUE$3.4BMarket Size 2025
2036 FORECAST VALUE$6.1BBase Case , 2026 to 2036
CAGR 2026 TO 20365.4 %Bull 6.6% / Bear 4.2%
INCREMENTAL OPPORTUNITY$2.5BNet 10- year value creation
EXPANSION MULTIPLE1.69x2036 value over 2026 base
Strategic Levers
M&A Pipeline
Regional Outlook
Country Rankings
Competitive Intelligence
Segmental Deep-dive
Call-Us : 91 93563 13602

Executive Snapshot and Market Trajectory

Roughly 72% of primary vanadium comes out of slag from processing titanium-bearing iron ore, which means the supply of it answers to how much steel gets made rather than to what vanadium is worth. Producers cannot respond to price. Buyers know this. That asymmetry sets everything else here.
Commercial position depends on holding supply that responds to price rather than to somebody else's steelmaking schedule, which is why secondary recovery matters far beyond its 14% share. Recycled and secondary ferrovanadium grows fastest at 8.8%, roughly 1.63 times the market. East Asia holds the largest position at 34% of consumption, above the standard band, because Chinese steel output exceeds the rest of the world combined.
Concentration is high at roughly 54% for the top five, reflecting deposit geography and slag access rather than any processing advantage. Steel takes 88% of consumption and rebar takes most of that. Niobium substitutes directly in the same microalloying role, which caps what vanadium can charge whenever prices run ahead of it. A mill can change microalloy inside a single production week, and metallurgical sign-off on the substitute only ever works one way.
Market Definition
The market comprises ferrovanadium and vanadium alloy products supplied to steel and metals producers, covering FeV50 standard grade, FeV80 high grade, nitrided vanadium alloy, vanadium-aluminium master alloy, vanadium carbide alloy, and recycled or secondary ferrovanadium. Value is measured at producer level. Vanadium pentoxide sold as a chemical, catalyst, or battery electrolyte, vanadium metal, ferroniobium and other microalloy additions, vanadium mining before conversion, and redox flow battery systems fall outside scope.
Base Year Value
$3.4B in 2025 (MMA Primary Research Dataset, August 2026)
Forecast Period
2026 to 2036, eleven discrete annual values
CAGR
5.4% base case. Bull 6.6%. Bear 4.2%.
Fastest Growth Segment
Recycled and Secondary Ferrovanadium: 8.8% CAGR
Fastest Growth Country
India: 8.4% CAGR
Fastest Growth Region
South Asia and Pacific: 7.6% CAGR
Largest Region
East Asia: 34% of 2025 global value
Market Leaders
Pangang Group Vanadium and Titanium, EVRAZ, Glencore, Largo, and Bushveld Minerals lead on ferrovanadium production revenue. Source: company annual reports and MMA Analysis, July 2026.
Primary Survey
n=3,800 procurement and R&D decision-makers, Q4 2025, six countries
Methodology
Demand-side build-up, cross-validated against public data, 47 expert interviews

Ferrovanadium Market Forecast Scenarios

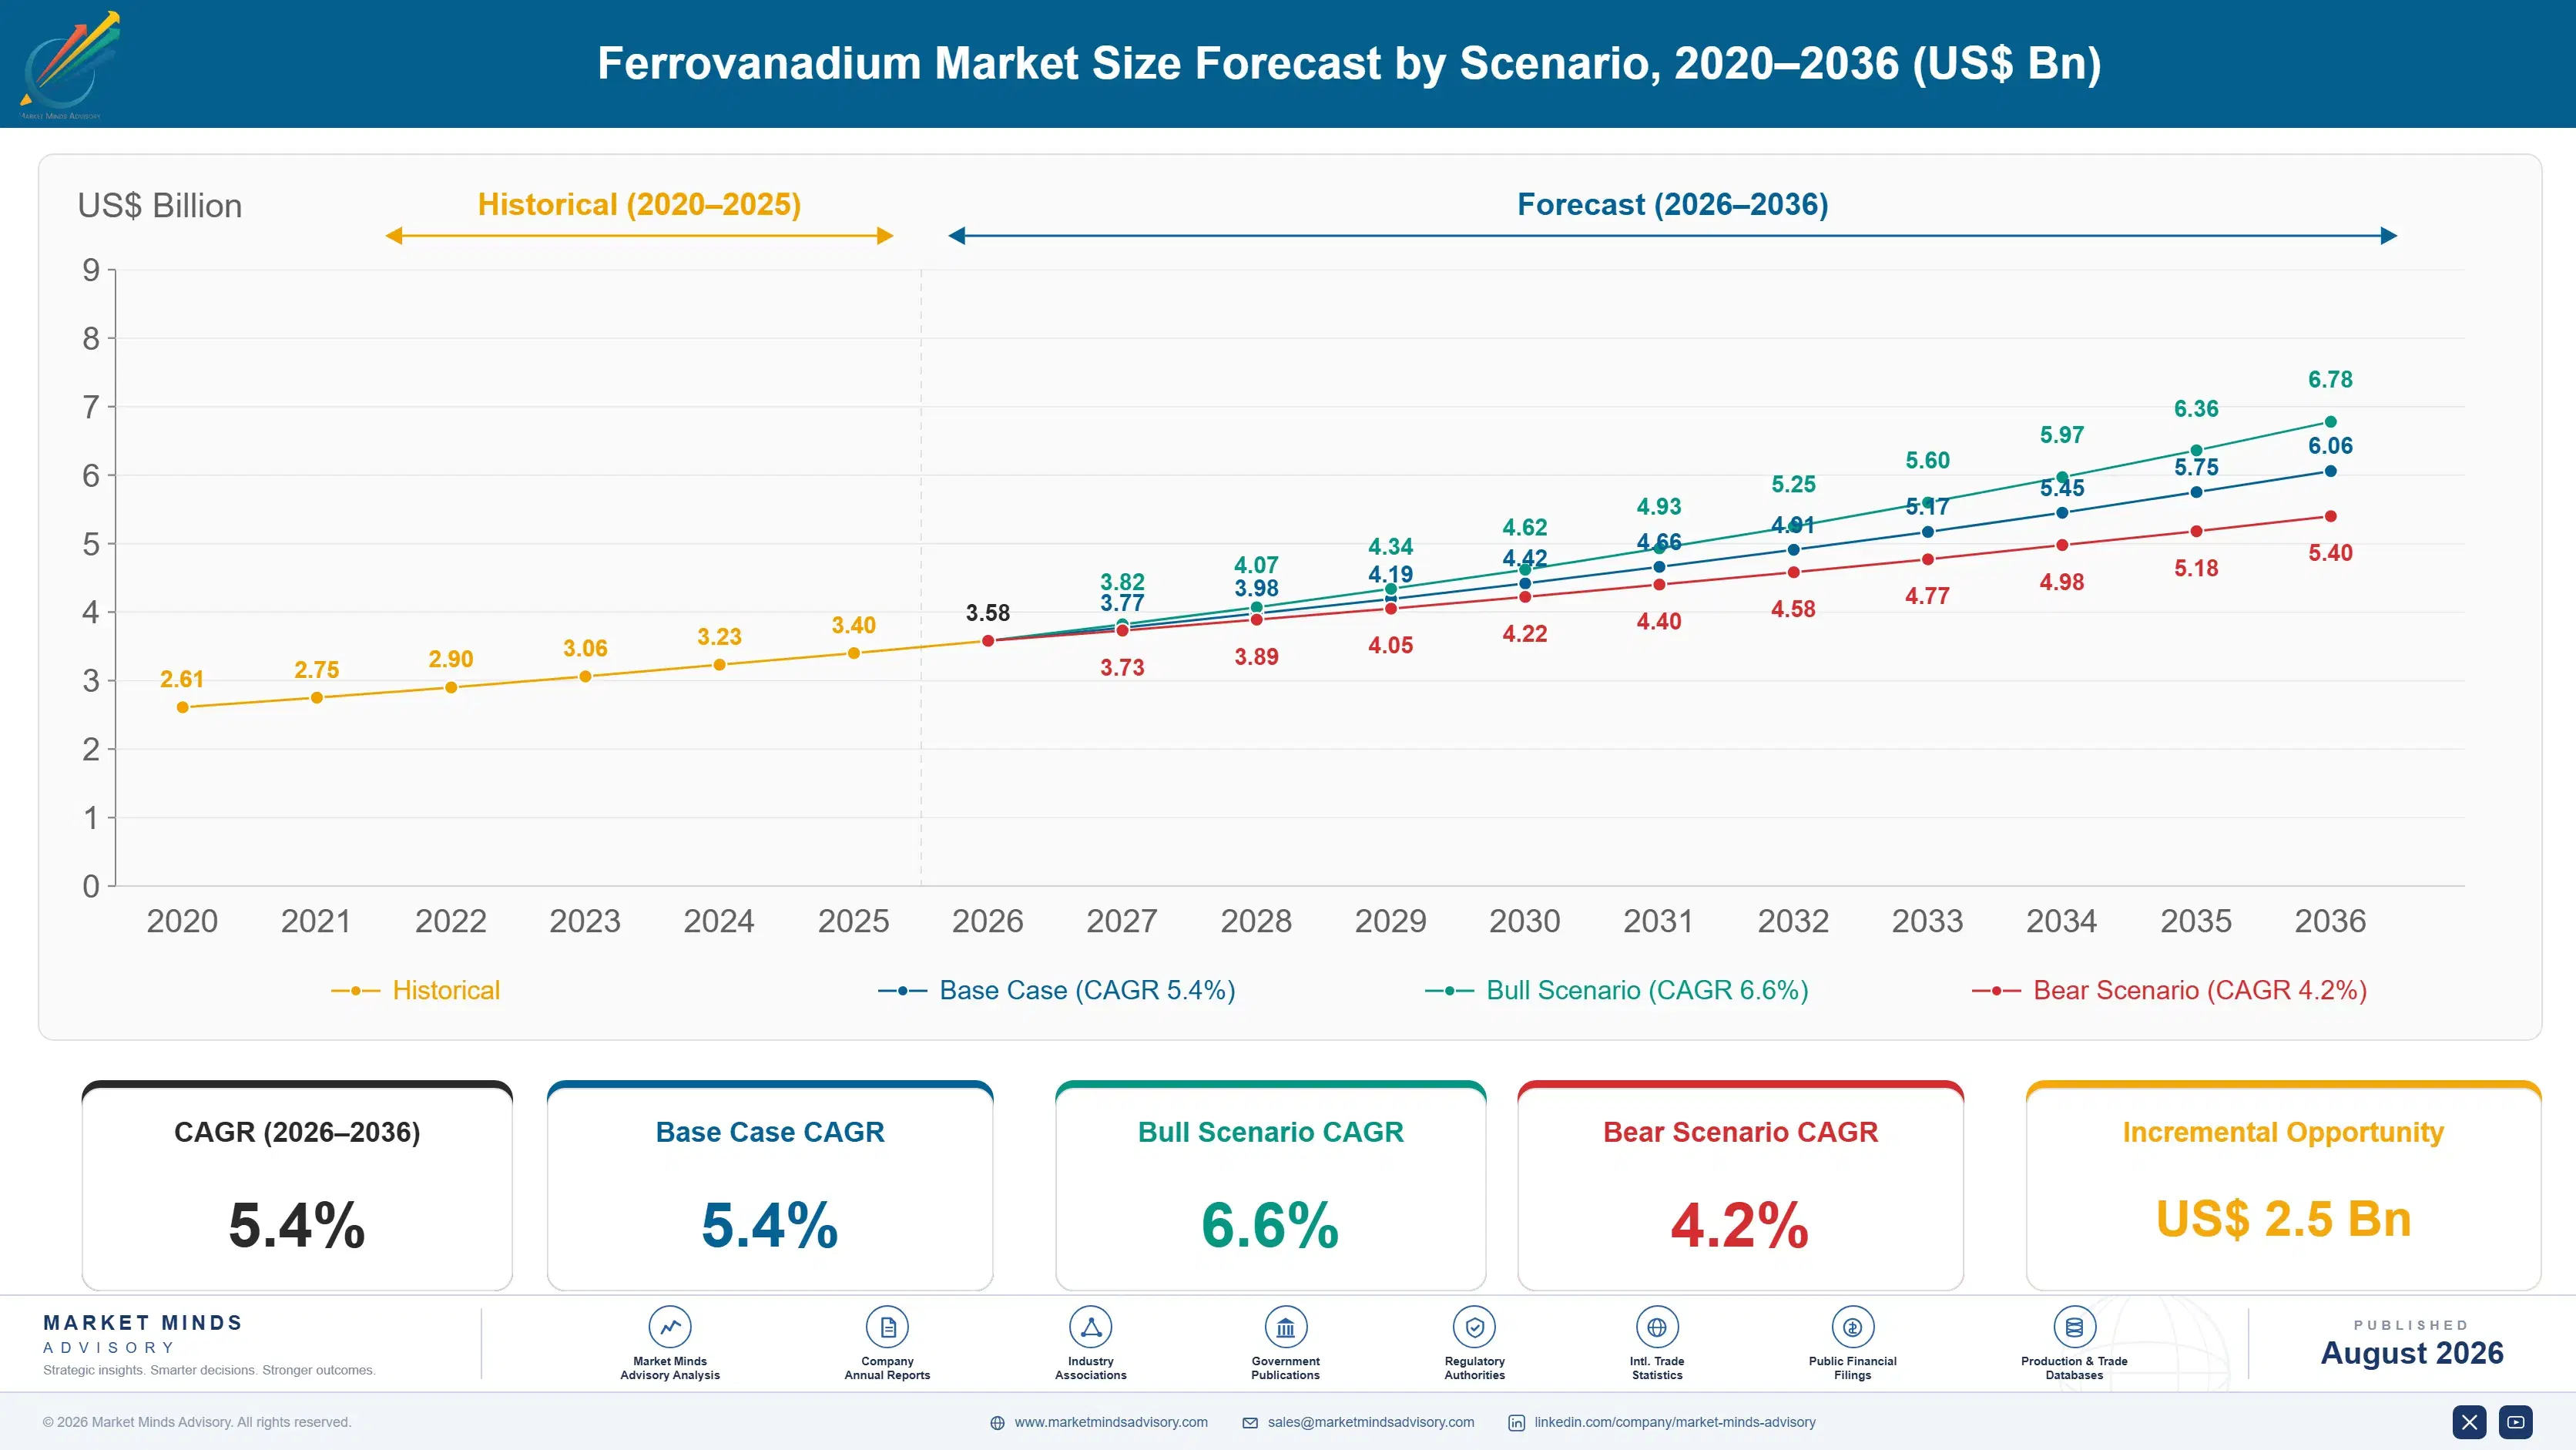
ferrovanadium-market-trends-size-forecast-scenario-1787551256595
The defining event of this period happened just before it. China deleted its weakest reinforcing bar grade from national standards, forcing microalloying across a vast construction market, and vanadium went from roughly five dollars a pound to thirty and back inside eighteen months. Everything since has been the market working out the new baseline. The 4.4% historical rate averages across volatility no annual figure represents honestly.
The 5.4% base case rests on three mechanisms. Reinforcing bar standards keep tightening beyond China, with India and Southeast Asian markets moving toward high-strength grades that require microalloy addition. High-strength low-alloy structural steel demand grows with infrastructure spending across most regions. And secondary recovery from spent refinery catalyst expands the supply base in a way primary co-product output simply cannot. None of those three requires vanadium prices to do anything in particular.
The 6.6% bull case assumes rebar standard adoption accelerates across South and Southeast Asia while flow battery demand tightens vanadium units available for alloying. The 4.2% bear case reflects Chinese construction weakness, aggressive niobium substitution by CBMM whenever vanadium prices rise, and steel output softening enough to cut co-product supply and demand together. Supply inelasticity amplifies whichever case turns out to hold.

A By-Product Priced Like a Commodity

Three facts govern everything here. Supply is a by-product, so 72% of primary output arrives because somebody made steel rather than because vanadium was worth making. Demand is one industry, since steel takes 88% and reinforcing bar takes most of that. And a direct substitute exists in niobium, which a steelmaker can switch to inside a heat schedule when the price argument justifies it.
TOP-FIVE CONCENTRATION54%Combined share of alloy output held by leading producers
STEEL DEMAND SHARE88%Portion of vanadium consumption entering steel alloying applications
VANADIUM INTENSITY PER TONNE48 gramsTypical vanadium addition made into high-strength reinforcing bar steel
CO-PRODUCT SUPPLY SHARE72%Portion of primary output arising alongside steel slag processing
PRICE VOLATILITY RANGE6.4 timesRatio between peak and trough pricing across recent cycles
SECONDARY SUPPLY SHARE14%Portion of output recovered from spent catalyst and residues
Put those together and the price behaviour follows inevitably. Demand moves with construction while supply moves with steel output, and the two are correlated but not synchronised, so shortages and gluts both arrive faster than anybody can build or idle capacity. The peak-to-trough ratio across recent cycles reached 6.4 times, which is extreme even by ferroalloy standards.
Secondary recovery is the only supply that answers to price. Spent refinery catalyst and petroleum residues carry recoverable vanadium, and processors can run harder when margins justify it in a way slag operations tied to a blast furnace never can. It sits at 14% of output and grows at 8.8%, and its commercial importance is considerably larger than either number suggests. Nobody else can turn the tap in either direction.
"Everyone models this as a metals market and it behaves like a waste stream with a price attached. The producers who make money through a cycle are the ones who can turn volume up when the number goes up, and almost nobody in primary supply can do that at all."
Practice Director, Ferroalloys and Steel Raw Materials · MMA Ferroalloys and Steel Additives Practice · August 2026

Market Trends

Rebar Standards Migrate Beyond China Into South Asia

China removed its weakest reinforcing bar grade from national standards and forced microalloying across the largest construction market on earth, which remains the single largest demand event this industry has recorded. Indian and Southeast Asian standards bodies are moving in the same direction, and each adoption converts a large tonnage of plain carbon rebar into microalloyed product at roughly 48 grams of vanadium per tonne. The timing is a policy question rather than a commercial one. India grows fastest of any country at 8.4% largely because of it. Enforcement rather than metallurgy sets the timing.
Market Impact: East Asia holds 34% of demand
Secondary Recovery Becomes the Only Elastic Supply

Spent hydroprocessing catalyst from refineries carries recoverable vanadium, nickel, and molybdenum, and processors can raise throughput when prices justify it. Primary slag operations cannot, because output is set by whatever the steelworks produced. That difference makes secondary supply the marginal tonne in every tight market and gives it pricing influence far beyond its 14% share. The segment grows at 8.8%, fastest here, and refinery residue volumes keep rising as heavier crude slates are processed across the Gulf and Asia. Multi-metal economics also mean a plant keeps running through vanadium troughs that would idle a single-metal operation.
Market Impact: Structural grades add 62 grams

Market Opportunities and Growth Drivers

Chinese Steel Output Anchors Both Supply and Demand

China produces more steel than the rest of the world combined and processes most of the titanium-bearing iron ore that yields vanadium as a slag co-product, which places both sides of this market in one country. Pangang and HBIS convert that slag into alloy at scale nobody else approaches. Domestic rebar standards then consume much of it. East Asia holds 34% of consumption for that reason, above the standard band. Any change in Chinese construction activity moves supply and demand at the same time. No other market has both sides sitting in one country.
Market Impact: Substitution caps prices above $12

Infrastructure Programmes Lift High-Strength Structural Demand

High-strength low-alloy plate and structural sections carry vanadium to reach yield strength without added thickness, and infrastructure spending across North America, India, and the Gulf keeps that tonnage growing. Bridge, transmission tower, and heavy equipment applications specify grades where microalloying is not optional. Weight reduction also matters commercially, since less steel per structure offsets a higher alloy cost. Demand here is steadier than rebar and considerably less exposed to residential construction cycles that swing hard in either direction. Grade specifications here sit in design codes rather than mill practice, which makes the demand harder to substitute away.
Market Impact: Storage claims 9% of units

Market Restraints and Challenges

Niobium Substitutes Inside a Single Heat Schedule

Ferroniobium performs the same grain refinement role in high-strength low-alloy steel, and a steelmaker can switch between the two within days rather than requalifying a process over months. The root cause is metallurgical rather than commercial: both elements do the same job well enough. CBMM controls most world niobium supply and prices to take share whenever vanadium runs hot. Vanadium producers mitigate through long-term supply agreements, through nitrided alloy forms that improve recovery, and by competing on delivered cost rather than on any performance claim. None of that removes the metallurgical equivalence underneath.
Market Impact: Adds 48 grams per steel tonne

Flow Battery Demand Competes for the Same Vanadium Units

Vanadium redox flow batteries consume pentoxide as electrolyte, and every tonne going into storage is a tonne unavailable for alloying from a supply base that cannot expand on demand. The root cause is that both applications draw on identical primary output. Alloy producers mitigate by expanding secondary recovery that adds genuinely new units, by contracting slag supply on long terms, and by pricing to reflect the competing claim rather than absorbing it. Storage deployment timing remains the largest uncertainty in any supply forecast. Nobody in the alloy business controls that deployment schedule.
Market Impact: Secondary supply grows at 8.8%
3 additional market trends, 4 additional growth drivers, and 2 additional restraints and challenges are covered in the full report. Contact sales@marketmindsadvisory.com to access the complete intelligence.

Segment CAGR and Growth Architecture

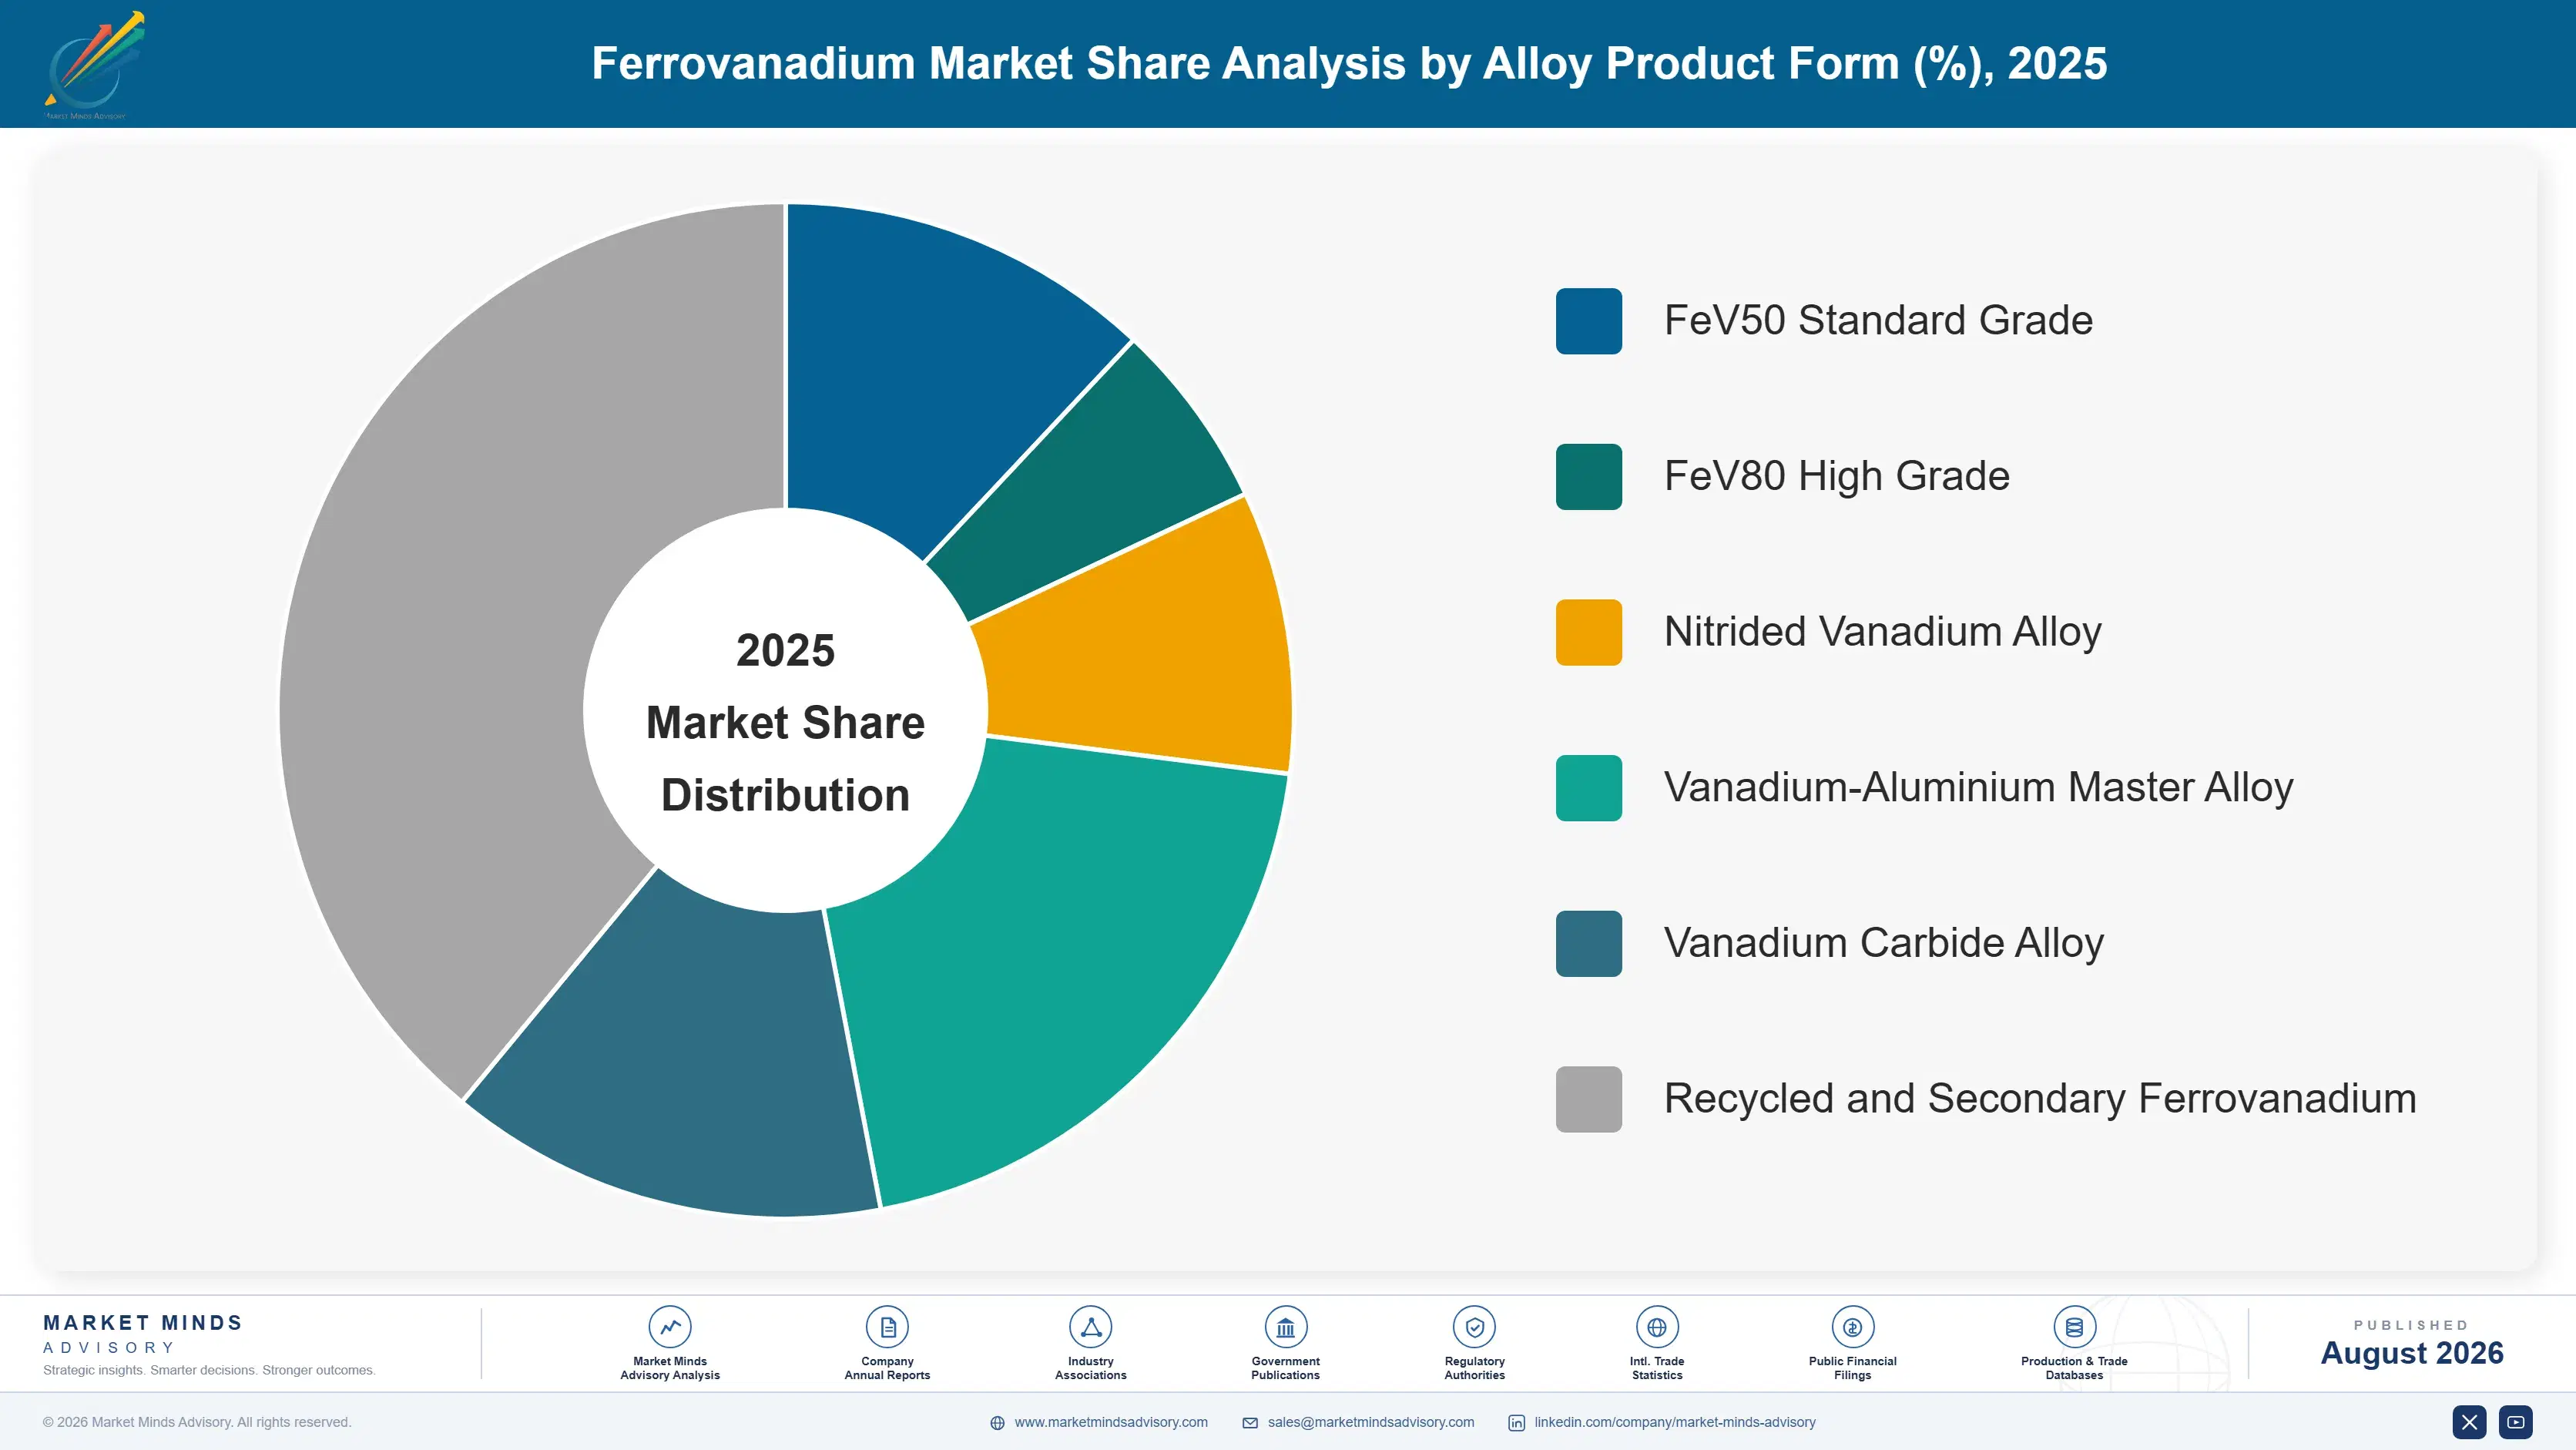
Segmentation follows alloy product form, because each form carries a distinct recovery rate in the steel bath, a distinct handling requirement, and a distinct set of customers. Six forms cover commercial supply, and the divide between primary conversion and secondary recovery matters more commercially than any difference in vanadium content between grades. Vanadium content is the least of it.
ferrovanadium-market-trends-market-share-analysis-1787551257182

Recycled and Secondary Ferrovanadium

The fastest form at 8.8%, roughly 1.63 times the market, and the only supply in this industry that responds to its own price. Spent hydroprocessing catalyst from refineries carries recoverable vanadium alongside nickel and molybdenum, and processors raise throughput when margins justify it rather than waiting on a steelworks. That elasticity makes secondary the marginal tonne in every tight market. Feedstock supply grows as refiners process heavier crude slates across the Gulf and Asia. Processing economics depend on multi-metal recovery rather than on vanadium value alone, which cushions the operation through price troughs. Feedstock collection logistics from refineries are the practical constraint on growth here, since spent catalyst is a hazardous material with its own handling requirements.
CAGR 8.8%

Vanadium-Aluminium Master Alloy

Second fastest at 7.4%, serving titanium alloy production for aerospace rather than steel, which makes it the only meaningful form outside this market's dominant end use. Ti-6Al-4V and related alloys require vanadium at controlled purity levels far above steel grade, and qualification runs through aerospace approval processes measured in years. Pricing reflects that scarcity and the qualification barrier rather than any vanadium unit cost. Volumes are small against ferrovanadium and margins are considerably better. Aerospace build rates and titanium mill capacity govern demand rather than construction activity anywhere. Purity control rather than vanadium sourcing is the barrier, and producers already running purification for other reasons sit closer to this business than they usually recognise.
CAGR 7.4%
Full segment breakdown across 6 segments available in the complete report.

Regional Architecture and Country Demand Map

Regional shares follow steel production and slag access rather than economic size, and the two sides of this market sit largely in the same places. East Asia sits above the standard band for reasons named below, and every other region falls inside its range. That overlap is unusual.

North America

Demand here is weighted toward high-strength low-alloy plate and structural steel rather than reinforcing bar, which makes it steadier through construction cycles than most regions and less exposed to residential swings. Infrastructure legislation funded bridge, transmission, and heavy civil work carrying grades where microalloying is specified rather than optional. Domestic primary production is negligible, so supply arrives imported or through secondary recovery from Gulf Coast refinery catalyst. Gulf Chemical and Metallurgical holds a significant secondary position. Growth of 5.2% follows infrastructure execution rather than any change in domestic supply capability. Substitution risk is comparatively low here, since design codes on public infrastructure specify grades rather than leaving the microalloy choice to the mill.
Share: 22% | CAGR: 5.2% (2026 to 2036)

Western Europe

European steel output has contracted for years and carbon border adjustment costs are reshaping which grades remain economic to produce here, which caps alloy demand regardless of specification trends. Structural and automotive high-strength grades carry most of the vanadium consumed, with reinforcing bar a smaller share than in Asia. Treibacher and AMG hold established alloy conversion positions serving regional mills. Aerospace titanium demand adds vanadium-aluminium volume disproportionate to the region's steel size. Growth of 3.8% is the slowest anywhere, tracking a steel industry under sustained cost and competitive pressure. Trade restrictions on Russian material reorganised supply routes substantially after 2022, and regional converters now source pentoxide from a narrower and more expensive set of origins.
Share: 18% | CAGR: 3.8% (2026 to 2036)
Regional intelligence for 5 additional markets available in the complete report: East Asia, South Asia and Pacific, Latin America, Middle East and Africa, Eastern Europe. Contact sales@marketmindsadvisory.com.
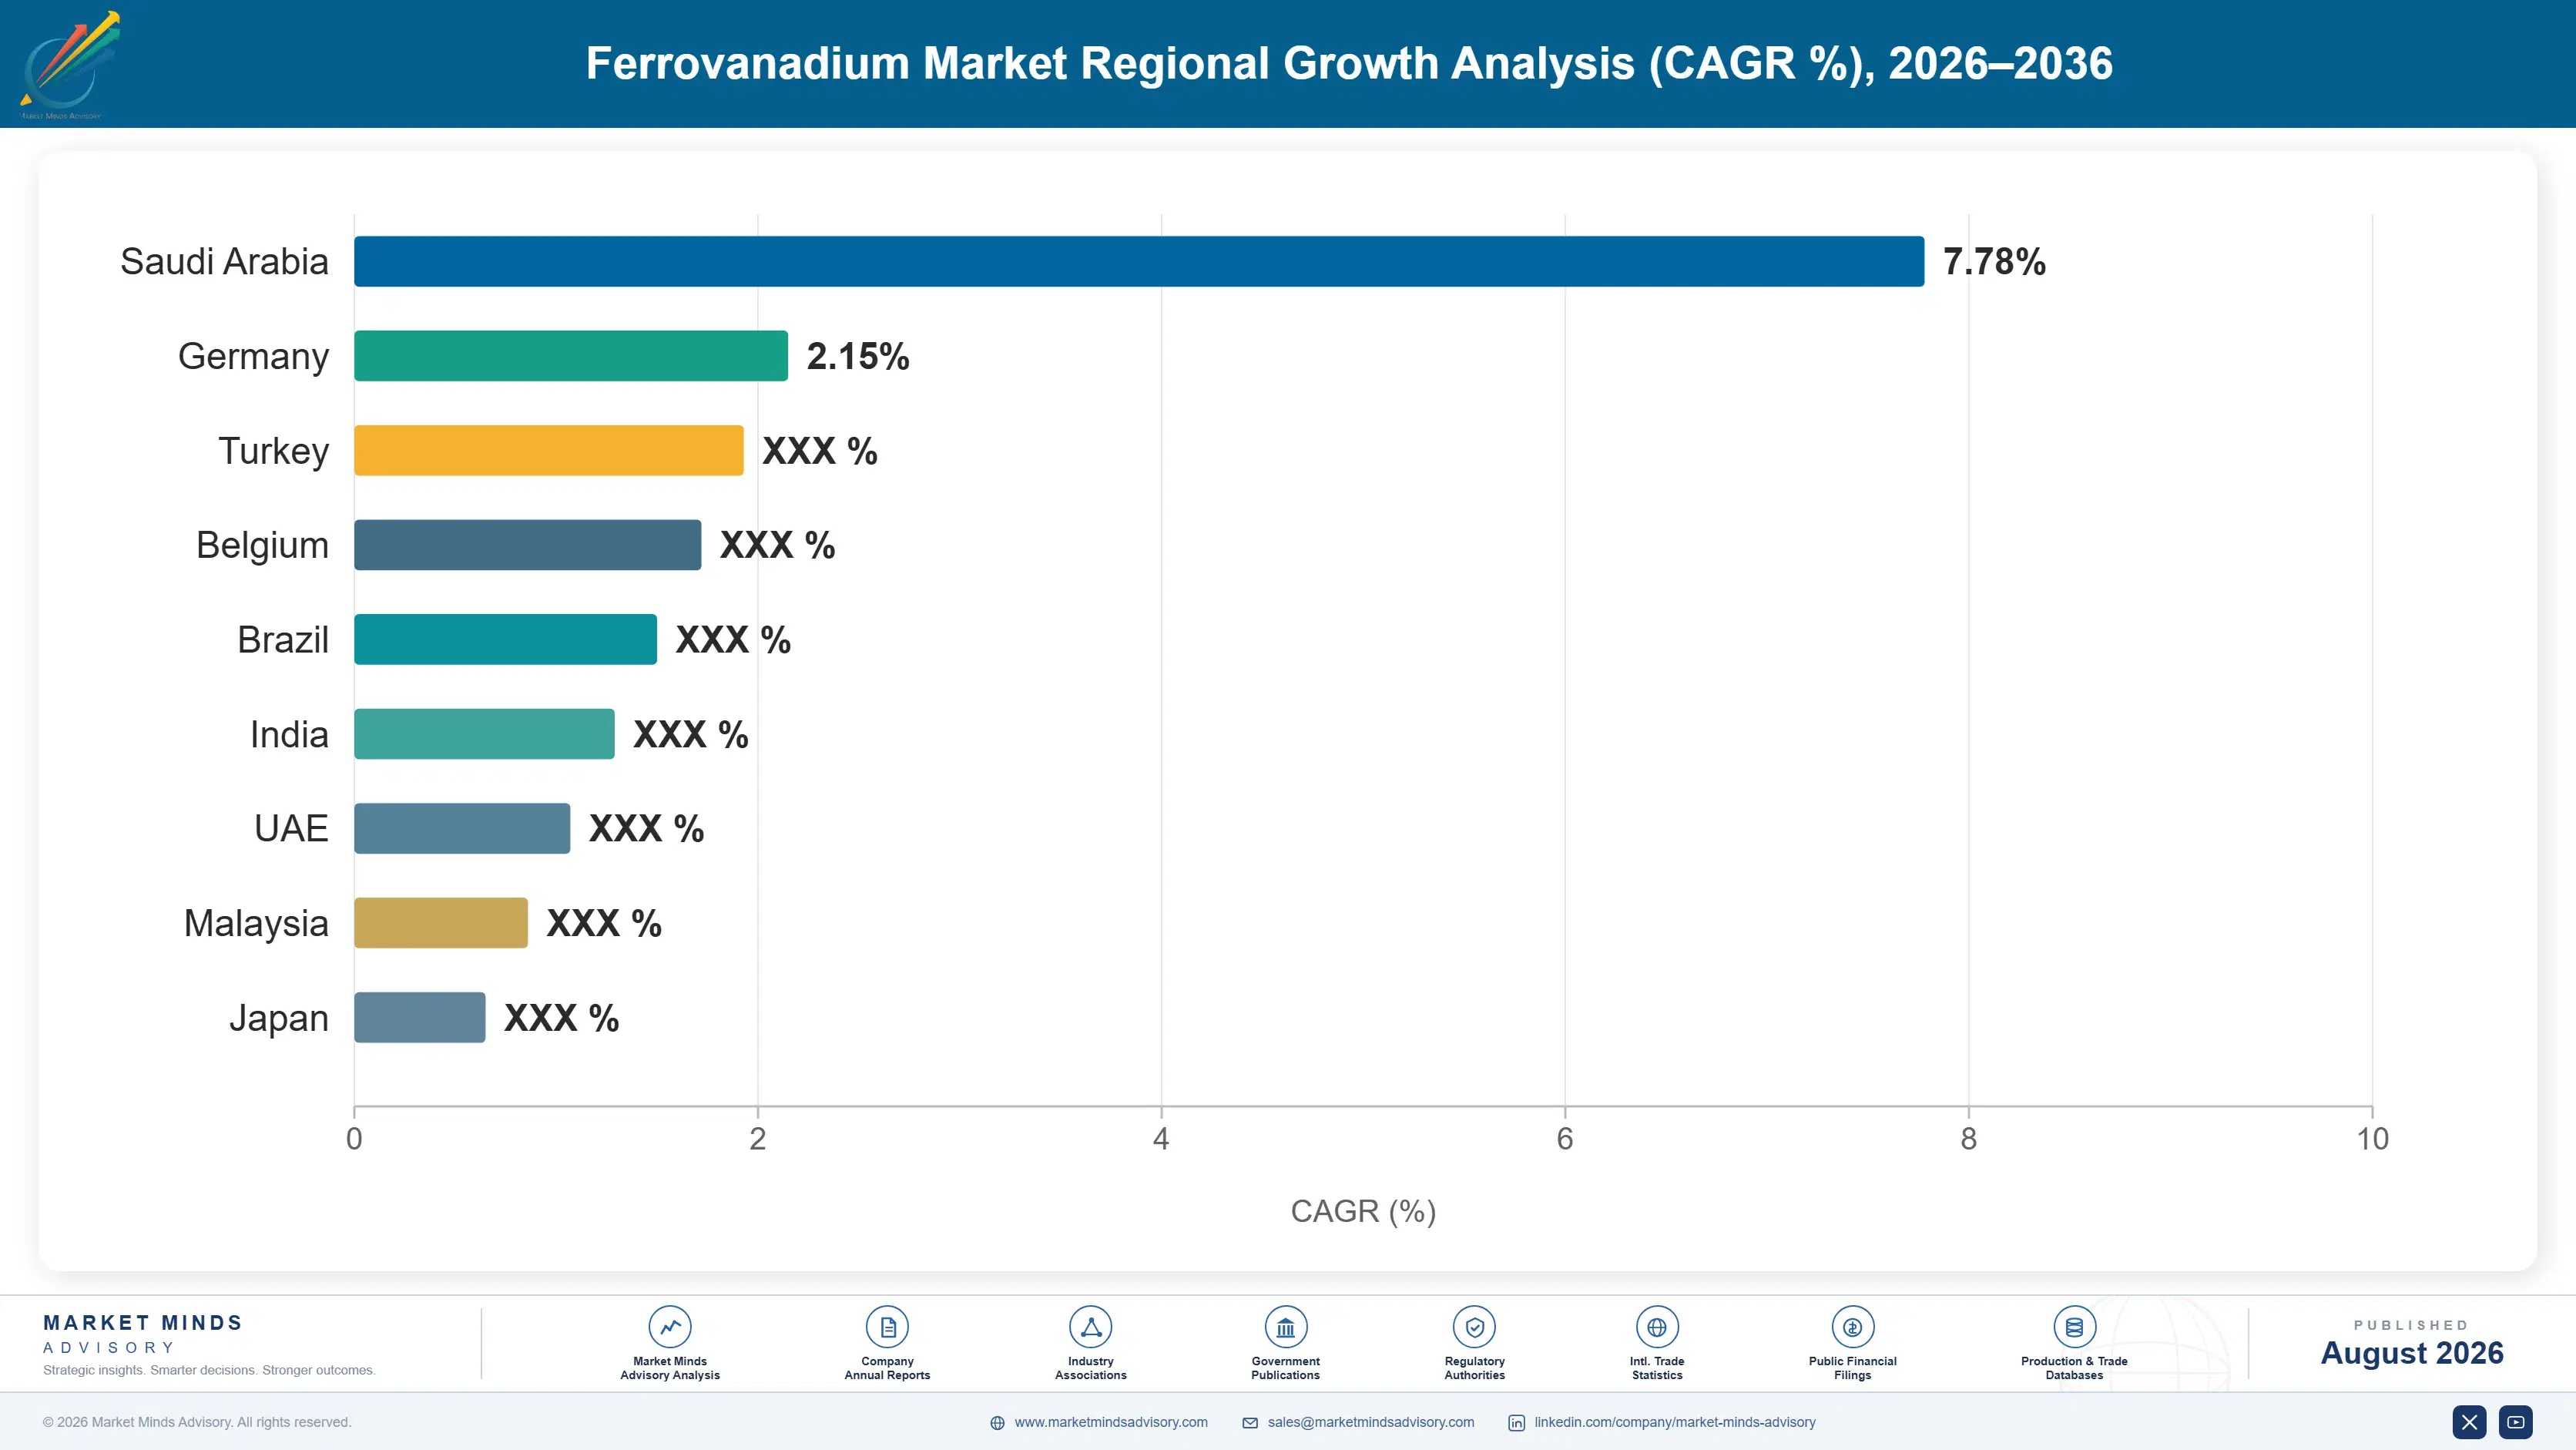
ferrovanadium-market-trends-country-cagr-analysis-1787551257751

Four Moves Through the Cycle

Advantage here comes from supply elasticity, substitution defence, and access to demand that construction cycles do not govern. Four moves justify capital across the forecast period, and the first addresses the reason most producers cannot profit from the price spikes their own market keeps generating. The other three follow from whether that first one is answered.

Build secondary recovery to gain price elasticity

Roughly 72% of primary output arrives as slag co-product, set by steelworks schedules rather than by vanadium prices, which means most producers cannot raise volume into a spike. Spent refinery catalyst processing can, and it grows at 8.8% against a market rate of 5.4%. Multi-metal recovery of nickel and molybdenum alongside vanadium cushions the operation through troughs where a single-metal plant would idle. The 14% share understates the commercial value of being the marginal tonne in every tight market. Feedstock logistics from refineries are the practical constraint rather than any processing difficulty.
Market Impact: Adds elasticity against a 72% inelastic supply base

Contract long term to blunt niobium switching

Ferroniobium replaces vanadium in high-strength low-alloy steel within days, and CBMM prices to take share whenever vanadium runs hot, which caps realised pricing above roughly 12 dollars a pound in most cycles. Multi-year supply agreements at negotiated formulas remove the spot switching decision from the mill's hands entirely. Producers holding spot exposure through a spike watch volume leave and struggle to get it back afterwards, because requalification cuts both ways once a mill has proven niobium works. Technical support on bath recovery and addition practice is what makes those agreements renewable rather than merely cheap at signing.
Market Impact: Limits spot exposure above $12 per pound pricing

Develop master alloy supply for aerospace titanium

Vanadium-aluminium master alloy grows at 7.4% serving titanium production where purity requirements sit far above steel grade and qualification runs through aerospace approval measured in years. That barrier protects pricing and margins considerably better than any steel application does. Volumes are small and demand follows aircraft build rates rather than construction, which diversifies exposure away from the reinforcing bar cycle driving everything else. Producers already holding purification capability are closer to this than they usually realise. Qualification runs for years and cannot be accelerated, so the decision to start is worth more than any efficiency gained afterwards.
Market Impact: Master alloy demand is growing at 7.4% annually

Position for rebar standard adoption in South Asia

Each national standard that deletes plain carbon reinforcing bar converts an enormous tonnage to microalloyed grades at roughly 48 grams of vanadium per steel tonne. China demonstrated the scale of that effect and India is moving the same way, which is why it grows fastest of any country at 8.4%. Standards adoption is a policy timetable rather than a market forecast, so positioning means supply agreements and technical support with mills before the rule lands rather than afterwards. Mills adopt supply relationships during the trial and qualification phase, which happens well before any standard is formally published.
Market Impact: Converts rebar tonnage at 48 grams per tonne

Who Controls the Margin Pool

Concentration is high at roughly 54% for the top five on alloy production revenue, and deposit geography rather than any operating advantage explains most of it. Pangang leads on scale through Chinese slag access nobody can replicate. EVRAZ converts Russian slag at comparable volume under redirected trade flows. Glencore and Bushveld hold South African primary production, and Largo operates a Brazilian resource unusual for not depending on a steelworks.
Competition runs on three dimensions. Feedstock access is the first and largely fixed, since slag rights and orebodies do not change hands often. Supply elasticity is the second, and secondary processors hold it while primary producers do not. Contract structure is the third, because it determines who keeps volume when niobium becomes the cheaper microalloy addition.

Pressure is building from two directions that both sit outside the alloy business. Flow battery deployment claims vanadium units from a supply base that cannot expand on demand. Niobium substitution caps pricing whenever the market runs tight. Rankings will shift toward producers holding secondary capacity and contracted offtake rather than toward whoever controls the largest orebody. Orebody scale has stopped being the useful measure of position.
ferrovanadium-market-trends-company-positioning-matrix-1787551258288

Competitive Moat and Risk Dimensions

PANGANG GROUP VANADIUM AND TITANIUM

Moat: Slag access at unmatched scale

Pangang processes titanium-bearing iron ore and converts the resulting slag into vanadium alloy at volumes no other producer approaches, inside the country consuming the most steel. That integration removes feedstock risk entirely and gives a delivered cost position domestic competitors cannot match. Nothing about it is replicable, since orebody and steelworks came together decades before anybody valued vanadium.
PANGANG GROUP VANADIUM AND TITANIUM

Risk: Output tied to steel schedules

Co-product supply means production volume answers to blast furnace operation rather than to vanadium prices, so Pangang cannot lift output into a spike or cut it into a trough without affecting its steel business. Chinese construction weakness reduces supply and demand at the same time. That structure removes any ability to profit from the volatility this market generates.
LARGO

Moat: Primary resource without steel dependency

Largo mines vanadium as a primary product from a Brazilian resource rather than recovering it from somebody else's slag, which means production decisions respond to vanadium economics rather than to a steelworks schedule. That independence is rare in this industry and genuinely valuable through price cycles. It also supports supply commitments that co-product producers cannot reliably make to customers.
LARGO

Risk: Single asset concentration risk

Depending on one mining operation for essentially all output concentrates operational, permitting, and geological risk in a way diversified co-product producers avoid entirely. Any interruption removes the company's supply position rather than reducing it. Cost position also sits above slag-based producers who treat vanadium recovery as incremental revenue on a process running for other reasons.

Players Tracked

Prominent Players

Pangang Group Vanadium and Titanium
EVRAZ
Glencore
Largo
Bushveld Minerals

Other Key Players

HBIS Group
Chengde Jianlong
Treibacher Industrie
AMG Advanced Metallurgical Group
Australian Vanadium
Vanadium Resources
Gulf Chemical and Metallurgical
Nippon Denko
JFE Material
POSCO
Tata Steel
Shaanxi Steel Group
Hunan Yinguang
Metalloinvest
Duferco

Recent Developments

JANUARY 2025

Refinery catalyst processor expands multi-metal recovery capacity

A secondary vanadium processor commissioned additional spent hydroprocessing catalyst capacity, citing heavier crude slates across Gulf refineries and the ability to raise throughput when alloy prices justify it. Nickel and molybdenum recovery underwrite the economics through vanadium price troughs. Vanadium alone would not justify the plant.
Signal: Elastic supply is being built deliberately by processors who can answer price where co-product producers cannot
MAY 2025

Steelmaker switches microalloy addition to ferroniobium

A European high-strength low-alloy producer moved part of its microalloy addition from vanadium to niobium during a price spike, completing the change within a single production week. Metallurgical performance was equivalent and the mill has since retained niobium on several grades permanently. Requalification never happened afterwards.
Signal: Substitution takes days rather than months, and volume rarely returns once a mill has proven the alternative
SEPTEMBER 2025

Indian standards consultation moves toward high-strength rebar grades

Indian standards bodies opened consultation on reinforcing bar specifications that would reduce reliance on plain carbon grades in favour of microalloyed high-strength product. Alloy suppliers had already begun technical engagement with major integrated mills ahead of any final decision being published. Publication timing remains entirely open.
Signal: Standards adoption rather than raw construction volume is what converts a country into serious vanadium demand overnight

What Drives Conversion Economics

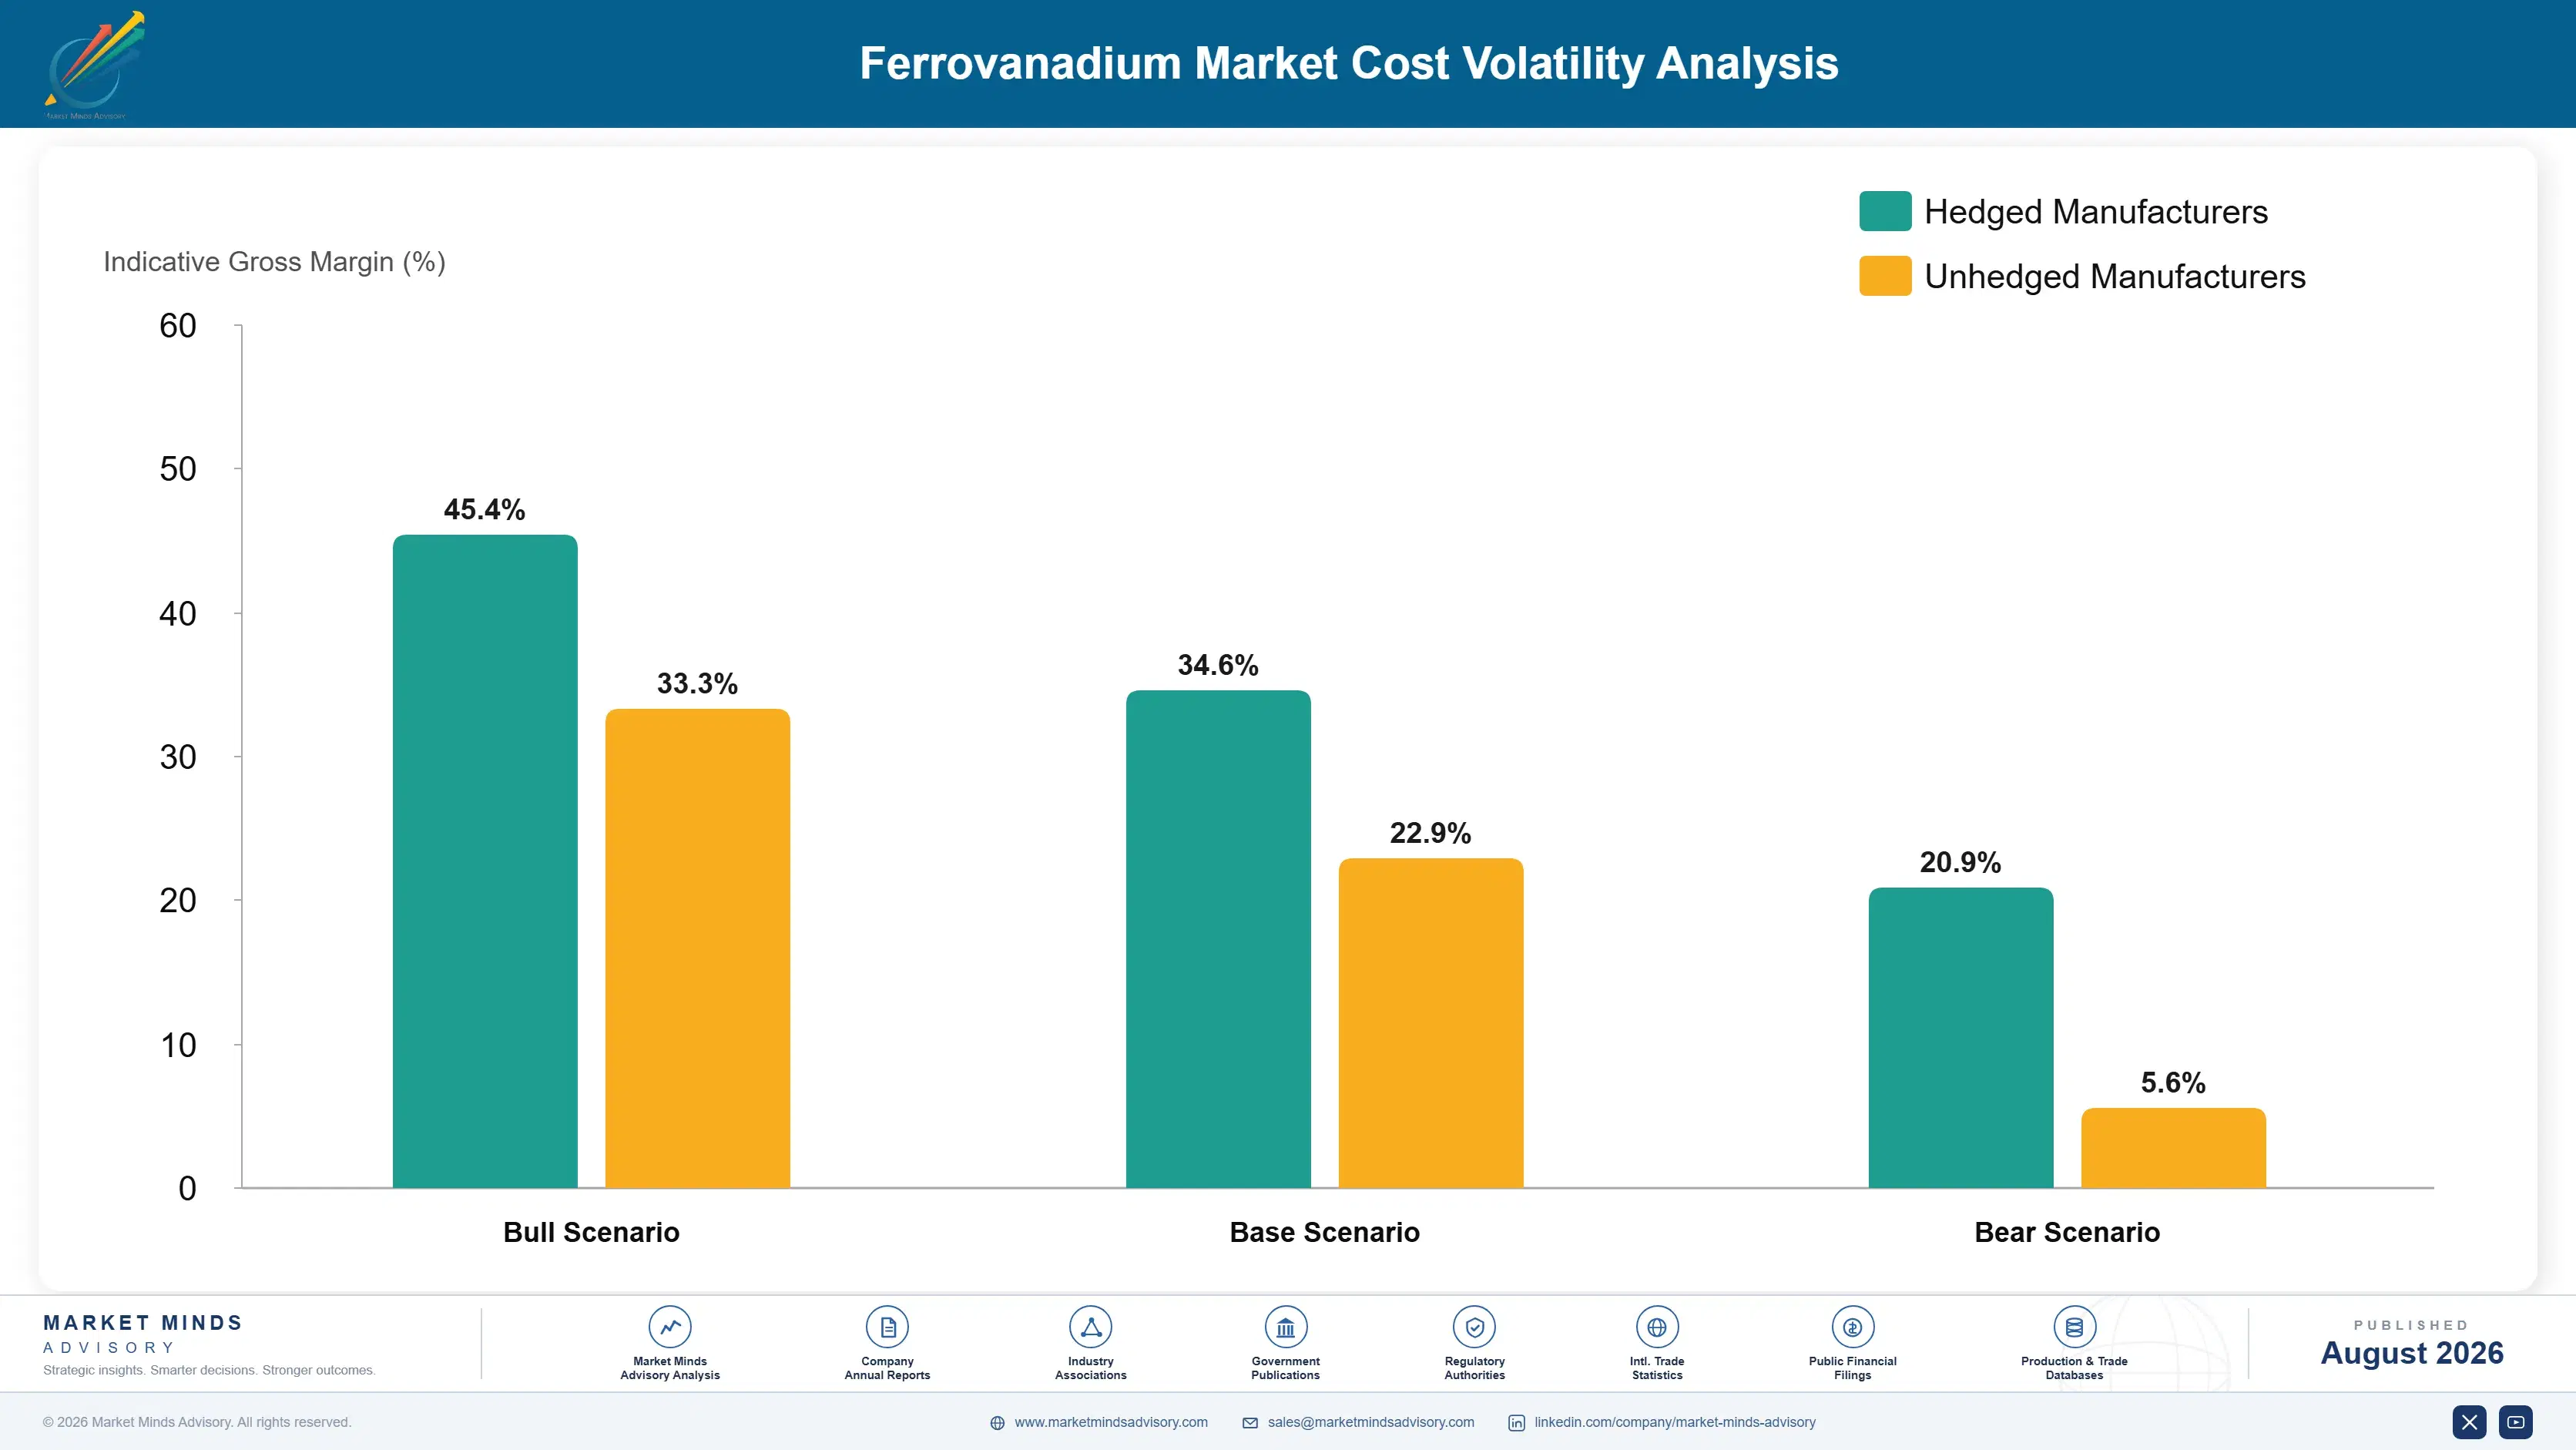
Vanadium-bearing feedstock dominates at roughly 58% of conversion cost, arriving as steel slag from titanomagnetite processing, primary concentrate, or spent refinery catalyst depending on the route. Aluminium or silicon reductant takes a further 14%, and electricity for the aluminothermic or electric furnace reduction absorbs 15%. Ferrous scrap, fluxes, and refractory consumption make up most of the remainder across the process.
Vanadium pentoxide feedstock pricing moved through a range of roughly 6.4 times between peak and trough across recent cycles, and converters buying feedstock at spot while selling alloy on contract carried that mismatch directly. Largo and Bushveld both discussed pricing volatility and its margin effects in their reporting. European electricity costs compounded the problem for regional converters in 2022 and 2023, since aluminothermic reduction is power intensive and tariffs were high.

Exposure divides on feedstock integration rather than on scale. Producers converting their own slag or ore carry no feedstock price risk at all and simply see the margin move. Independent converters buying pentoxide on spot to fill contract commitments carry the whole spread and can lose money in a rising market while volumes look healthy. Secondary processors sit between, hedged by multi-metal recovery that moves on different cycles entirely.
ferrovanadium-market-trends-cost-volatility-analysis-1787551258491

Match feedstock and sales pricing bases

Converters buying pentoxide at spot while selling alloy on annual contract carry a spread that peak-to-trough movement of 6.4 times can easily turn negative. Aligning both sides to the same published reference removes the mismatch without changing either relationship materially. Independent converters who have not done this are running a commodity trading position they never intended to hold.

Underwrite recovery economics on multiple metals

Spent hydroprocessing catalyst carries nickel and molybdenum alongside vanadium, and those metals move on cycles that rarely align with vanadium pricing. Building recovery economics on the full basket rather than on vanadium alone keeps a plant running through troughs that would idle a single-metal operation. It also improves the case for the capital in the first place.

Contract slag supply on multi-year terms

Slag availability follows a steelworks schedule the converter does not control, and spot arrangements leave feedstock exposed exactly when alloy prices make volume most valuable. Multi-year supply agreements with volume floors give converters something to plan against. Steel producers generally accept them, since the slag is a disposal problem they would otherwise be managing themselves.

Portfolio Architecture for Margin Defence

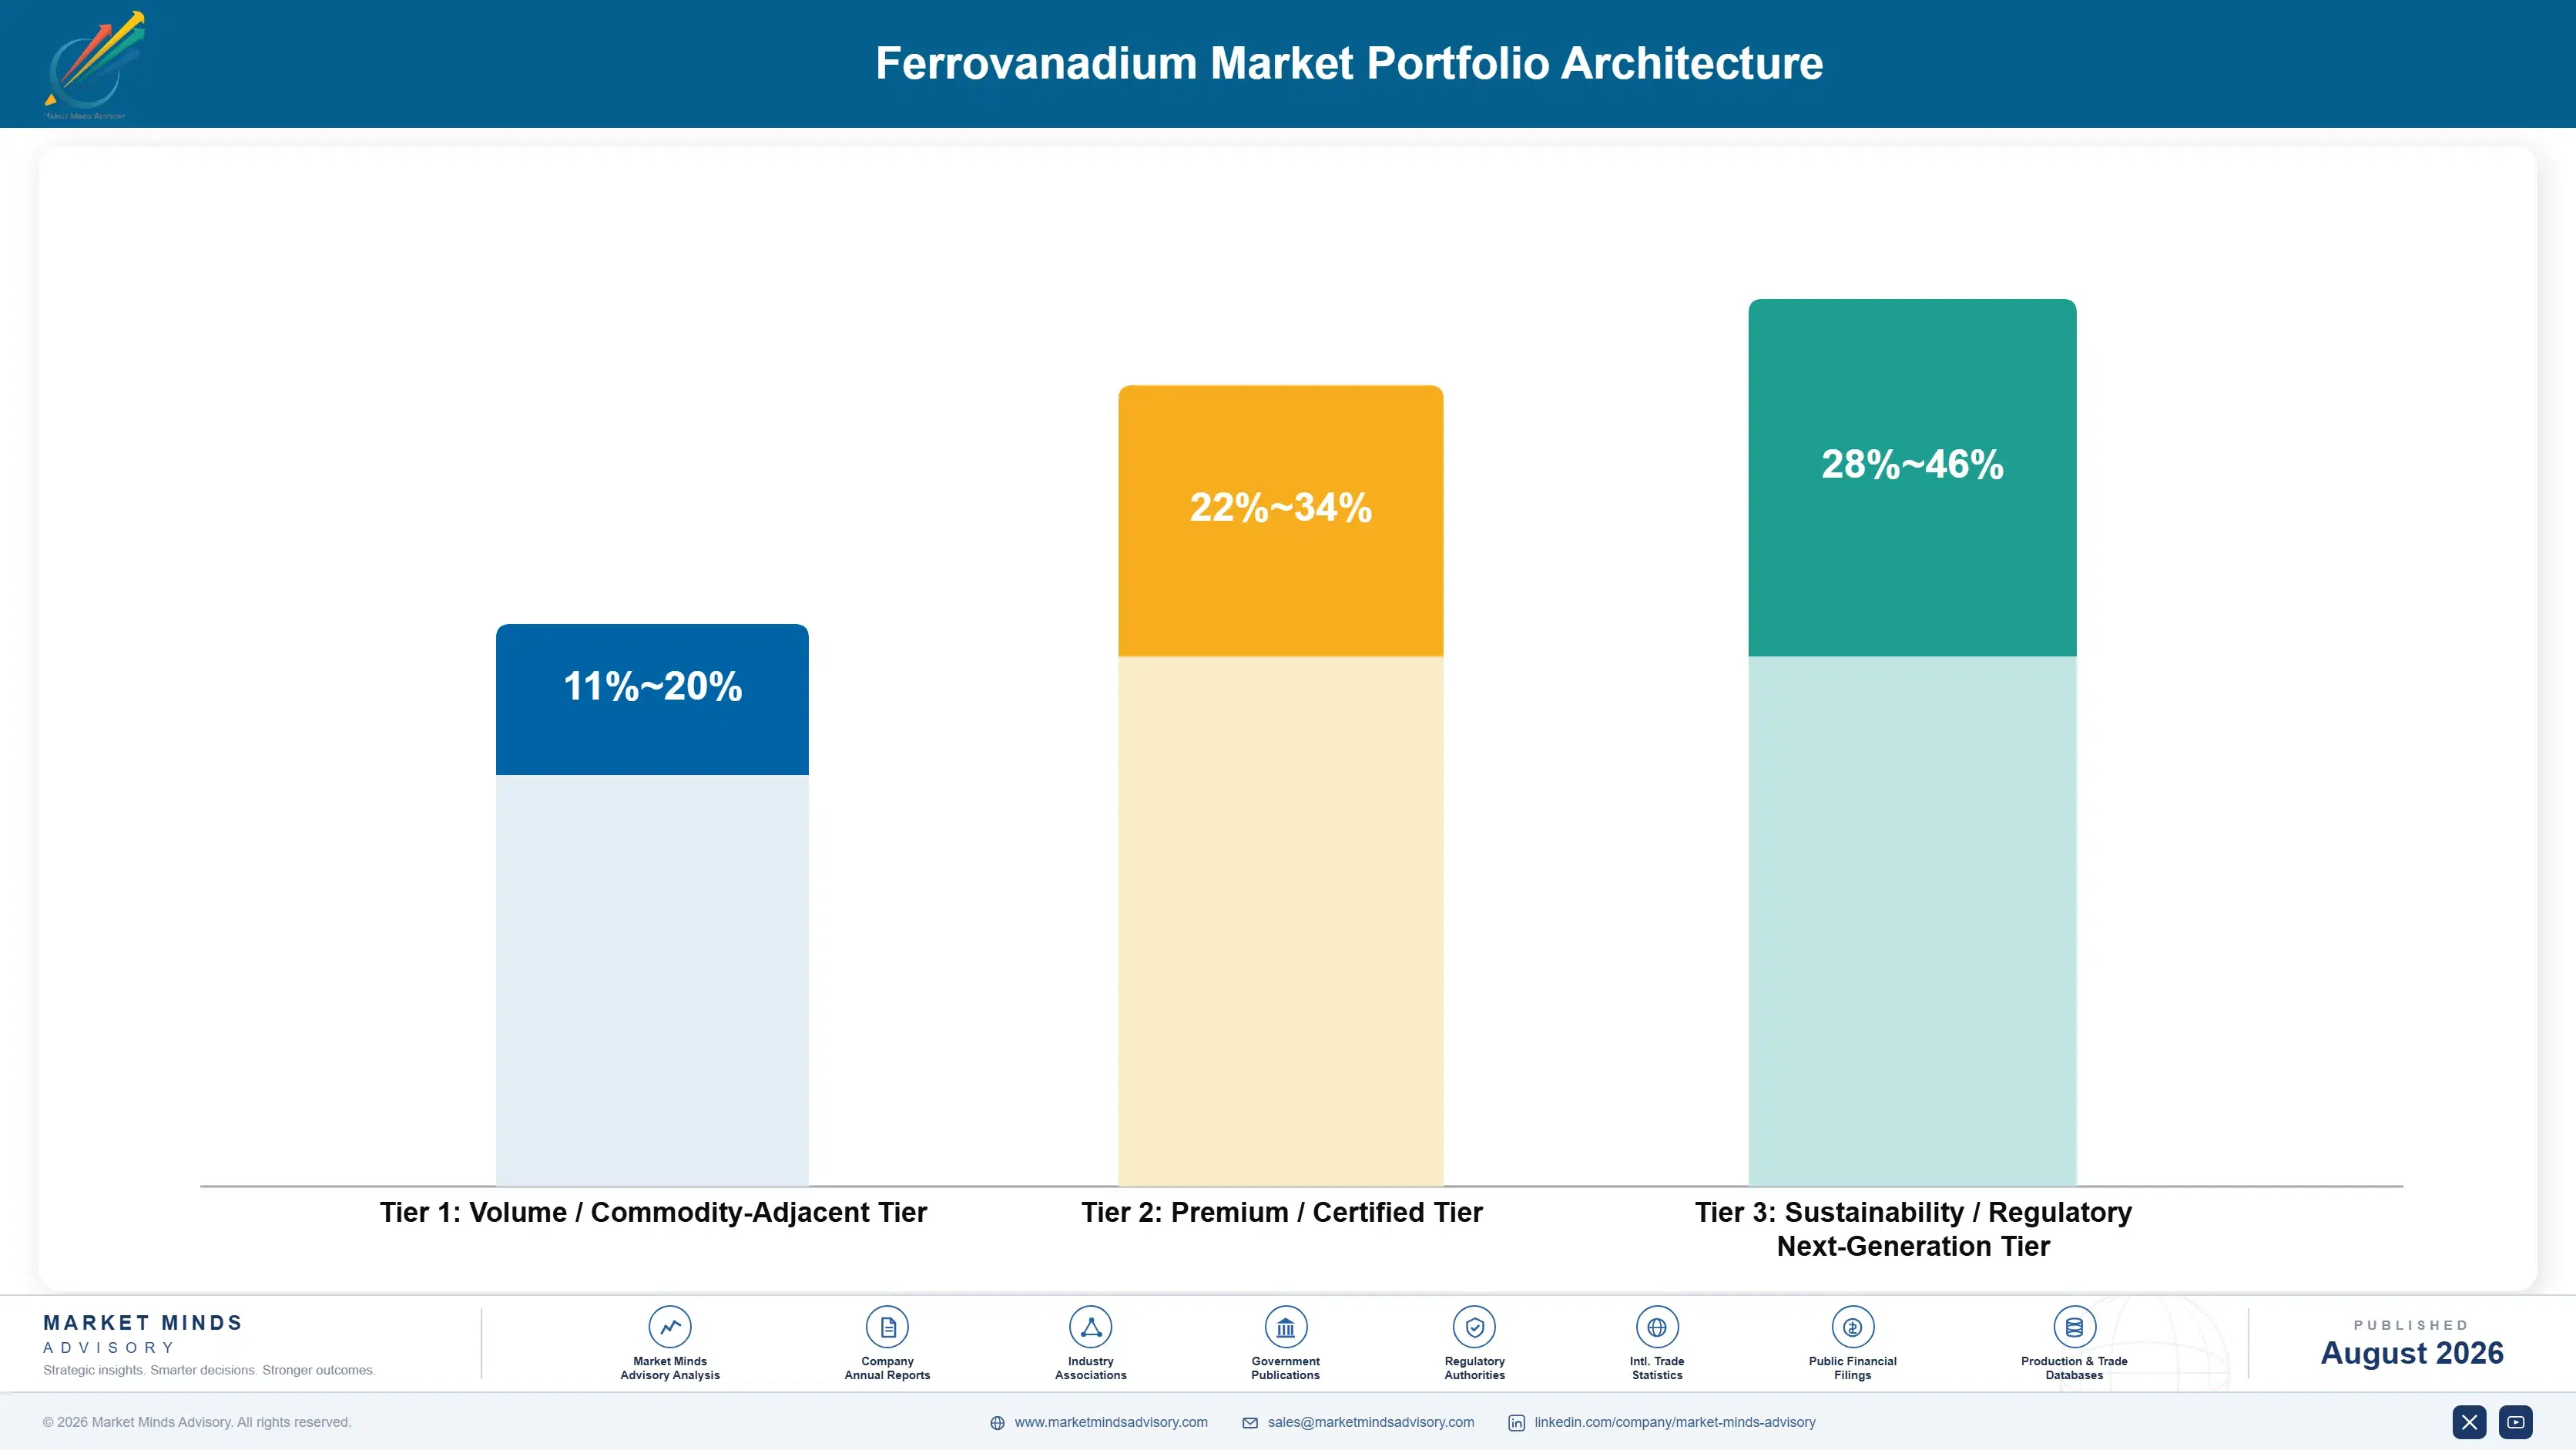
Margin architecture follows feedstock position and purity capability rather than volume, and the difference between the ends of it is larger than the tonnages suggest. Standard grade ferrovanadium into reinforcing bar competes on delivered cost against niobium as much as against other vanadium, which caps what any producer realises. Nitrided and carbide forms earn more on recovery performance. Aerospace master alloy earns most, and volumes there are tiny.
The volume and premium tension shows up as a question about who owns the feedstock. An integrated producer converting its own slag earns through the cycle because it never buys vanadium at all. An independent converter buying pentoxide to fill contracts can post record revenue and lose money in the same quarter. That distinction matters far more than any difference in furnace efficiency between them.

High-value pools concentrate in secondary recovery with multi-metal economics, aerospace master alloy behind qualification barriers, and long-term contracted supply that survives niobium switching. Each is defended by process capability, approval status, or contract structure rather than by orebody access, which is where most of the industry's capital still sits. Capital allocation in this industry has not caught up with that.

Volume / Commodity-Adjacent Tier

Standard grade ferrovanadium into reinforcing bar and general structural steel. Competes against ferroniobium as much as against other vanadium supply. Pricing is capped by substitution rather than set by production cost anywhere.
Gross Margin: 11%-20%

Premium / Certified Tier

Nitrided vanadium and carbide forms offering better bath recovery and handling, plus contracted high-strength low-alloy supply with technical support. Recovery performance justifies the difference. The range reflects wide variation in contract structure between producers.
Gross Margin: 22%-34%

Sustainability / Regulatory / Next-Generation Tier

Vanadium-aluminium master alloy for aerospace titanium and secondary recovery from refinery catalyst. Qualification barriers and multi-metal economics both support pricing. The range is wide because aerospace and secondary economics differ fundamentally from one another.
Gross Margin: 28%-46%
ferrovanadium-market-trends-portfolio-architecture-1787551259006

High-value Sub-segments and Strategic Watch-out

Secondary Catalyst Recovery

Growing at 8.8% and the only supply that answers to price rather than to a steelworks schedule, which makes it the marginal tonne in every tight market. Multi-metal recovery cushions the operation through vanadium troughs. Refinery feedstock logistics rather than processing capability limit how fast it scales.
Gross Margin: 26%-40%

Aerospace Master Alloy

Growing at 7.4% behind qualification barriers measured in years, serving titanium mills rather than steel. Demand follows aircraft build rates, which diversifies exposure away from the construction cycle governing everything else here. Purity control rather than vanadium sourcing is the barrier to entering it at all.
Gross Margin: 34%-46%

Contracted High-Strength Supply

Multi-year agreements with structural and plate mills remove the spot switching decision that hands volume to ferroniobium during price spikes. Technical support on bath recovery is what makes those contracts renewable rather than merely cheap. Design code specification also protects this volume from mill-level substitution decisions.
Gross Margin: 22%-34%

Spot Rebar Grade Supply

The strategic watch-out. Priced against niobium rather than against production cost, exposed to Chinese construction activity on both the supply and demand side, and offering nothing a competitor cannot supply identically. Volume looks healthy right up until a mill's metallurgy function signs off on ferroniobium instead.
Gross Margin: 11%-20%

How Alloy Tonnage Gets Committed

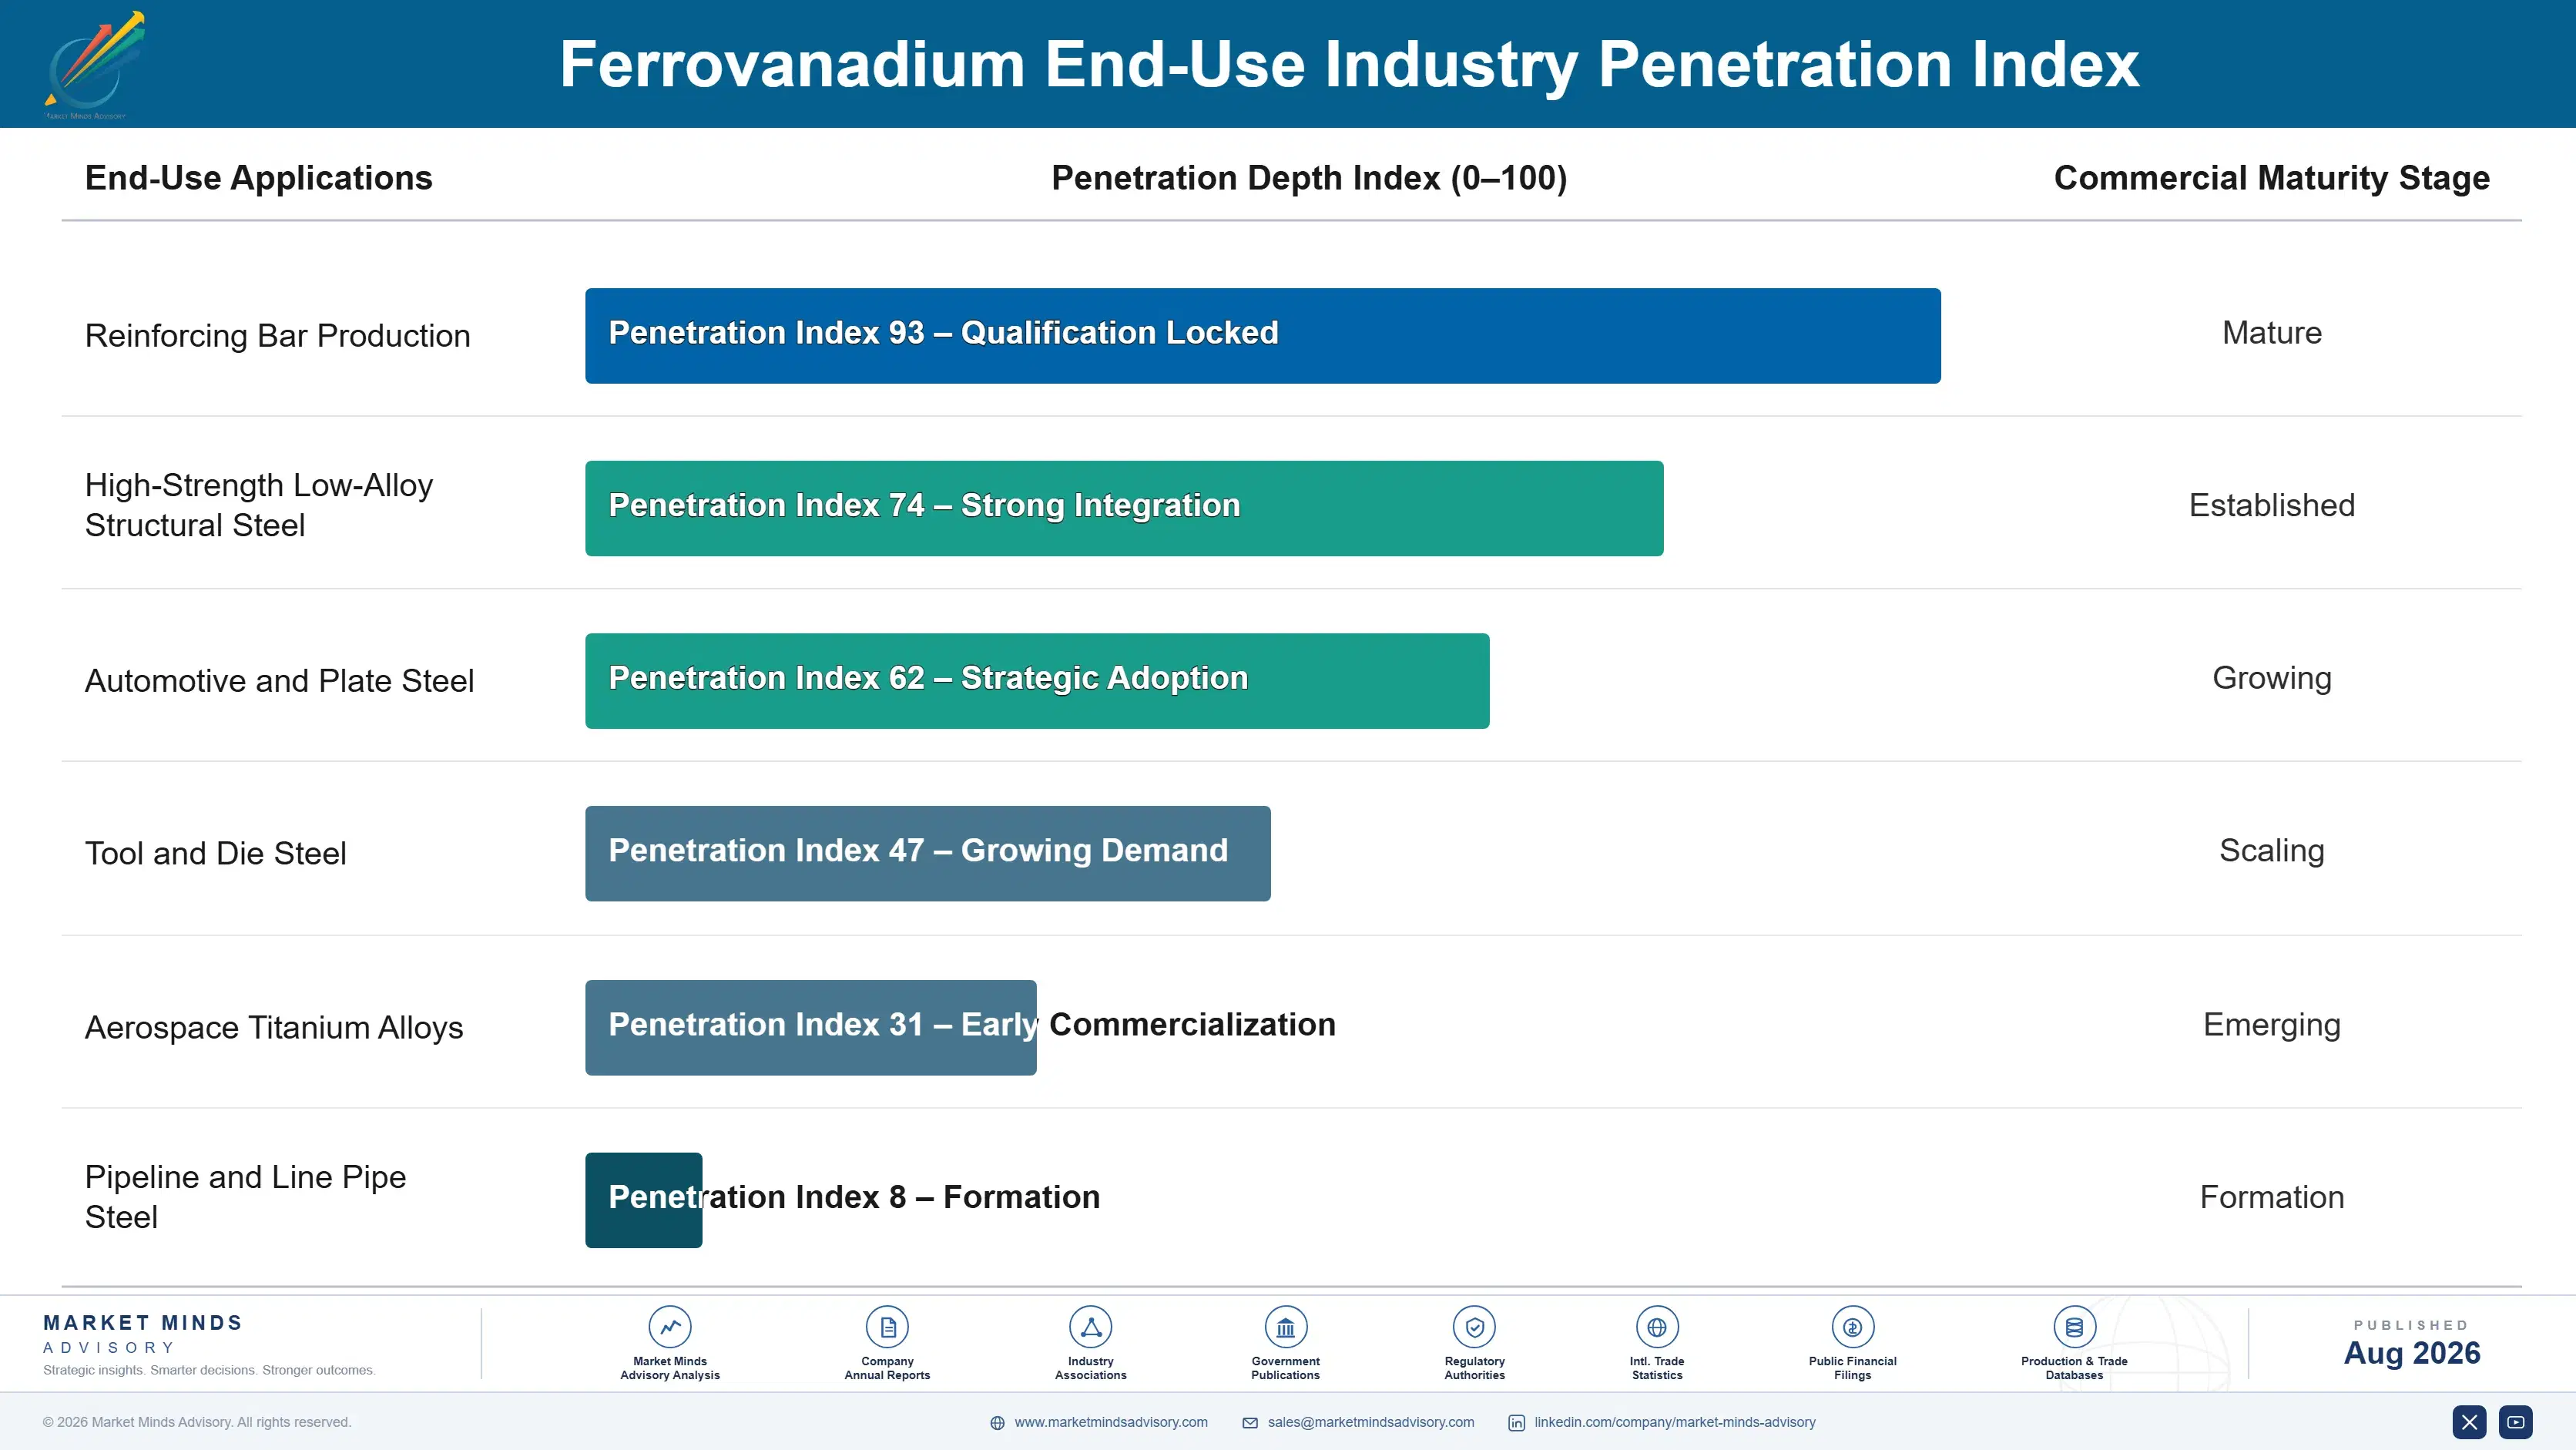
Demand arrives through two structures with entirely different risk profiles. Contracted supply to integrated mills runs on annual or multi-year formulas, involves technical engagement on bath recovery and addition practice, and survives price spikes because the switching decision was removed in advance. Spot supply into reinforcing bar production is bought heat by heat against whatever microalloy is cheapest that week, and it disappears the moment ferroniobium looks better. Most producers hold far more of the second than they intend.
Stickiness depends almost entirely on qualification depth. Aerospace master alloy is locked by approval processes measured in years. Automotive and plate grades hold through metallurgical qualification. Reinforcing bar holds through nothing at all beyond this week's price. Nothing about the alloy itself creates any of that stickiness.

The deciding buyer sits with raw material procurement at integrated mills, advised by metallurgy on whether a substitution is acceptable. Once metallurgy has signed off niobium on a grade, procurement makes that call permanently, which is why the first substitution matters far more than the price that triggered it. Producers who focus on winning the price argument have usually already lost the metallurgical one.
ferrovanadium-market-trends-end-use-penetration-index-1787551259498

Where Producers Actually Win

These are among the four positions where our research anticipates prominent divergence between winners and laggards over the coming forecast period. Each is grounded in the demand model, the regulatory perimeter, and the announced capacity pipeline.
01 / SUPPLY ELASTICITY BUILDING

Buy the ability to answer your own price

Roughly 72% of primary output arrives as slag co-product on a schedule set by steelworks operation rather than by what vanadium is worth, which leaves most producers unable to raise volume into the spikes their own market keeps generating. Spent refinery catalyst processing responds to price directly and grows at 8.8%, the fastest form here, with nickel and molybdenum recovery cushioning it through troughs. The 14% share badly understates what being the marginal tonne is worth in a genuinely tight market.
02 / SUBSTITUTION CONTRACT DEFENCE

Remove the switching decision before prices spike

Ferroniobium performs the same grain refinement role and a mill can change over within a single production week, which caps realised vanadium pricing above roughly 12 dollars a pound in most cycles this market runs. Multi-year supply agreements at negotiated formulas take that decision away from procurement before the spike arrives rather than after it has already arrived. Producers running spot exposure through a price run watch volume leave and rarely recover it, because metallurgical sign-off on niobium works permanently in one direction only.
03 / AEROSPACE QUALIFICATION ACCESS

Chase titanium master alloy for cycle diversification

Vanadium-aluminium master alloy grows at 7.4% serving titanium production at purity levels sitting far above steel grade, behind aerospace qualification processes measured in years that protect pricing better than any steel application ever manages to. Volumes are small and margins are considerably better than the reinforcing bar business generating the overwhelming majority of this industry's tonnage. Demand follows aircraft build rates rather than construction activity, which diversifies exposure away from the single cycle currently governing almost every producer's reported results today.
04 / STANDARDS ADOPTION POSITIONING

Engage mills before the rebar rule lands

Every national standard that deletes plain carbon reinforcing bar converts an enormous steel tonnage to microalloyed grades at roughly 48 grams of vanadium per tonne, which is what made China the demand event this industry still measures every other market against. India is moving the same way and grows fastest of any country at 8.4% largely because of it. Standards adoption follows a policy timetable, so positioning means technical engagement and supply agreements before publication rather than after it has been published.

Engagement Snapshot From the Field

A live engagement with an industry participant carrying material or product regulatory and market exposure ahead of a defining policy shift, showing how our research translates into a defensible multi-year portfolio strategy.
MARKET MINDS ADVISORY · CLIENT ENGAGEMENT SUMMARY
Ferrovanadium Producer Strategic Portfolio Review and Transition Roadmap 2026·Investment Scenario on Ferrovanadium Exposure Evaluation 2025-26
CLIENT PROFILE
An independent ferrovanadium converter with revenue near USD 190 million (client-reported, unverified by MMA), buying vanadium pentoxide on the open market and supplying alloy to European and Middle Eastern steel producers. No feedstock integration existed, secondary processing had never been attempted, and two of the last five years had produced trading losses despite rising revenue.
STRATEGIC CHALLENGE
Pentoxide was bought at spot while alloy sold on annual contract, which turned every rising market into a margin squeeze regardless of volume. Two structural steel customers had moved grades to ferroniobium during the last price run and had not returned. No aerospace or secondary business existed at all. Neither gap had ever been quantified.
MMA APPROACH
MMA reconstructed realised margin against feedstock and sales pricing bases across five years, assessed spent catalyst feedstock availability within economic reach, and modelled contract restructuring against historical substitution events. Forty-seven expert interviews with mill procurement, metallurgy functions, and refinery catalyst handlers established how switching and feedstock decisions are actually taken.
KEY FINDINGS
  1. The mismatch between spot feedstock purchasing and annual contract selling had cost more across five years than every operational improvement in the same period had generated together.
  2. Both customers lost to ferroniobium had switched during a price spike and stayed switched afterwards, confirming that metallurgical sign-off on the substitute works in one direction only.
  3. Spent hydroprocessing catalyst was available within economic freight distance from three regional refineries, and nickel and molybdenum recovery would carry the plant through vanadium troughs.
  4. Aerospace titanium mills within the region were importing vanadium-aluminium master alloy the client could produce with modest purification investment, and had never been approached about it.
CLIENT PROFILE
An independent ferrovanadium converter with revenue near USD 190 million (client-reported, unverified by MMA), buying vanadium pentoxide on the open market and supplying alloy to European and Middle Eastern steel producers. No feedstock integration existed, secondary processing had never been attempted, and two of the last five years had produced trading losses despite rising revenue.
STRATEGIC CHALLENGE
Pentoxide was bought at spot while alloy sold on annual contract, which turned every rising market into a margin squeeze regardless of volume. Two structural steel customers had moved grades to ferroniobium during the last price run and had not returned. No aerospace or secondary business existed at all. Neither gap had ever been quantified.
MMA APPROACH
MMA reconstructed realised margin against feedstock and sales pricing bases across five years, assessed spent catalyst feedstock availability within economic reach, and modelled contract restructuring against historical substitution events. Forty-seven expert interviews with mill procurement, metallurgy functions, and refinery catalyst handlers established how switching and feedstock decisions are actually taken.
KEY FINDINGS
  1. The mismatch between spot feedstock purchasing and annual contract selling had cost more across five years than every operational improvement in the same period had generated together.
  2. Both customers lost to ferroniobium had switched during a price spike and stayed switched afterwards, confirming that metallurgical sign-off on the substitute works in one direction only.
  3. Spent hydroprocessing catalyst was available within economic freight distance from three regional refineries, and nickel and molybdenum recovery would carry the plant through vanadium troughs.
  4. Aerospace titanium mills within the region were importing vanadium-aluminium master alloy the client could produce with modest purification investment, and had never been approached about it.
RECOMMENDED STRATEGY
Phase 1: Phase one: align feedstock purchasing and alloy sales to the same published pricing reference, removing the spread exposure that has driven every loss-making year. Phase 2: Phase two: restructure customer agreements onto multi-year formulas that take the substitution decision away from procurement before the next price run begins. Phase 3: Phase three: evaluate spent catalyst recovery capacity underwritten by nickel and molybdenum economics, and scope aerospace master alloy qualification separately.
OUTCOME
The client repriced feedstock and sales onto matched references within two quarters and converted four customer agreements to multi-year formulas. Realised margin stabilised through a subsequent price move, blended gross margin improved 5.9 percentage points, and secondary recovery capital entered detailed study (client-reported, unverified by MMA).

Frequently Asked Questions

Foundational context covering the market sizes, CAGR, scope, country, region and competition that inform every finding below. This section is provided to cover basics and most often pre-purchase conversations, answered from the MMA Primary Research Dataset.

What is the current size of the Ferrovanadium Market?

The market was valued at USD 3.4 billion in 2025, rising to an estimated USD 3.58 billion in 2026. East Asia holds the largest regional share at 34% of consumption.

How large will the Ferrovanadium Market be by 2036?

MMA forecasts USD 6.06 billion by 2036 under the base case, an expansion multiple of 1.69 times the 2026 value. That represents USD 2.48 billion of incremental value.

What is the CAGR for the Ferrovanadium Market 2026 to 2036?

The base case CAGR is 5.4%, with a bull case of 6.6% and a bear case of 4.2%. The spread reflects uncertainty over rebar standards adoption and niobium substitution.

Which segment is growing fastest?

Recycled and secondary ferrovanadium grows fastest at 8.8%, roughly 1.63 times the market rate. Vanadium-aluminium master alloy for aerospace titanium follows at 7.4% behind qualification barriers.

Who are the major companies in the Ferrovanadium Market?

Pangang Group Vanadium and Titanium, EVRAZ, Glencore, Largo, and Bushveld Minerals lead, holding roughly 54% between them. Deposit geography rather than operating advantage explains that concentration.

Which country is growing fastest?

India grows fastest at 8.4%, driven by reinforcing bar standards moving toward high-strength microalloyed grades alongside genuine steel capacity expansion. Domestic vanadium supply remains limited and mostly imported.

Report Segmentation Architecture

The full report scope spans multiple orthogonal segmentation dimensions, with cross-tabulated demand data provided for each dimension pair. Coverage extends further to regional breakdowns, trend trajectories, and the competitive detail needed to support segment-level decision-making.

By Alloy Product Form

  • FeV50 Standard Grade
  • FeV80 High Grade
  • Nitrided Vanadium Alloy
  • Vanadium-Aluminium Master Alloy
  • Vanadium Carbide Alloy
  • Recycled and Secondary Ferrovanadium

By End-Use Industry

  • Reinforcing Bar Production
  • High-Strength Low-Alloy Structural Steel
  • Automotive and Plate Steel
  • Tool and Die Steel
  • Aerospace Titanium Alloys
  • Pipeline and Line Pipe Steel

By Sales Model

  • Multi-Year Contracted Mill Supply
  • Annual Formula Agreements
  • Spot Market Sales
  • Trader and Distributor Channels
  • Tolling and Conversion Arrangements

By Region

  • North America
  • Western Europe
  • East Asia
  • South Asia and Pacific
  • Latin America
  • Middle East and Africa
  • Eastern Europe

Scope, Methodology, and Coverage

Every figure in this report is reproducible from documented input assumptions. The scope below maps the historical period, the forecast horizon, the segmentation dimensions, and the countries covered, alongside the underlying primary and qualitative methodology.
Historical Period
2020 to 2025
Forecast Period
2026 to 2036
Base Year
2025 (USD billions; MMA Primary Research Dataset, August 2026)
Market Definition
The market comprises ferrovanadium and vanadium alloy products supplied to steel and metals producers, covering FeV50 standard grade, FeV80 high grade, nitrided vanadium alloy, vanadium-aluminium master alloy, vanadium carbide alloy, and recycled or secondary ferrovanadium. Value is measured at producer level across contracted, formula, and spot sales. Vanadium pentoxide sold as chemical, catalyst, or battery electrolyte, vanadium metal, ferroniobium and competing microalloy additions, vanadium mining before conversion, and redox flow battery systems fall outside scope.
Quantitative Units
USD billions (current prices); thousand tonnes of contained vanadium annually; USD per kilogram of contained vanadium by alloy form
Segmentation Dimensions
By Alloy Product Form; By End-Use Industry; By Sales Model; By Region
Regions Covered
North America, Western Europe, East Asia, South Asia and Pacific, Latin America, Middle East and Africa, Eastern Europe
Countries Covered
China, Japan, South Korea, Taiwan, India, Australia, Indonesia, Vietnam, Thailand, Germany, Italy, France, Spain, United Kingdom, Austria, Belgium, Poland, Czechia, Russia, Ukraine, United States, Canada, Mexico, Brazil, Chile, Argentina, Saudi Arabia, United Arab Emirates, Egypt, South Africa
Key Companies Profiled
Pangang Group Vanadium and Titanium, EVRAZ, Glencore, Largo, Bushveld Minerals, HBIS Group, Chengde Jianlong, Treibacher Industrie, AMG Advanced Metallurgical Group, Australian Vanadium, Vanadium Resources, Gulf Chemical and Metallurgical, Nippon Denko, JFE Material, POSCO, Tata Steel, Shaanxi Steel Group, Hunan Yinguang, Metalloinvest, Duferco
Quantitative Methodology
Primary survey, n=3,800 respondents, Q4 2025, six countries; demand-side model with trade association cross-validation
Qualitative Methodology
47 expert interviews, Q4 2025; applied to validate demand model assumptions, identify emerging dynamics, and assess competitive positioning
Report Format
PDF and XLSX data workbook (Word format preview document)
Publisher
Market Minds Advisory
Report Code
MMA-2026-CHM-308
Published
August 2026
Contact
sales@marketmindsadvisory.com | www.marketmindsadvisory.com

Purchase the full Ferrovanadium Market Report (2026 to 2036).

The full report sizes ferrovanadium demand across six alloy forms, six end-use industries, and seven regions with 2026 to 2036 forecasts under base, bull, and bear cases. It separates co-product primary supply from secondary recovery, since only one of the two responds to price and that difference governs how the market behaves through every cycle. Competitive profiles cover twenty producers assessed consistently on alloy production revenue, feedstock integration, and contract structure. Cost analysis traces feedstock, reductant, and power exposure by conversion route. Commercial guidance addresses supply elasticity, substitution defence, aerospace qualification, and rebar standards positioning.
Six alloy forms sized separately by region
Co-product supply separated from elastic secondary recovery
Niobium substitution thresholds modelled against vanadium pricing
Rebar standard adoption timetables tracked across major markets
Flow battery unit demand assessed against alloy availability
Feedstock and sales pricing basis mismatch quantified by producer type

Built For The People Who Decide

From boardroom strategy to bench-side execution, this report is read cover-to-cover by leaders shaping the next decade of their industry, turning demand scenarios, market dynamics and valuation benchmarks into decisions.
CXOs/ Presidents/ VPs/ Managers
M&A and Corporate Development
Strategy Teams and R&D Heads
Procurement and Product Directors
Regulatory and Compliance Leaders
Investor Relations and Equity Analysts