Market Minds Advisory
Fast Food Containers Market

Fast Food Containers Market: Material Substitution as a Regulatory Compliance Race

Foam container bans keep spreading across major cities and entire countries, quick-service chains now specify compostable packaging as a brand requirement, and converters slow to shift fiber capacity are losing shelf space to faster-moving competitors.

Lead Analyst

Bilal Shaikh

Published

September 2026

Make Smarter Decisions with Customized Research Insights

Request a free sample report and evaluate market opportunities, growth trends, and competitive dynamics relevant to your business needs.

2025 MARKET VALUE$12.4BMarket Size 2025
2036 FORECAST VALUE$23.5BBase Case , 2026 to 2036
CAGR 2026 TO 20366.0 %Bull 7.3% / Bear 4.7%
INCREMENTAL OPPORTUNITY$10.4BNet 10- year value creation
EXPANSION MULTIPLE1.79x2036 value over 2026 base
Strategic Levers
M&A Pipeline
Regional Outlook
Country Rankings
Competitive Intelligence
Segmental Deep-dive
Call-Us : 91 93563 13602

Executive Snapshot and Market Trajectory

Quick-service chains increasingly treat packaging material choice as a brand and regulatory compliance decision rather than a pure cost line, since foam and single-use plastic bans now cover a meaningful share of their largest urban markets worldwide and keep expanding into new jurisdictions and states nearly every year now.
Compostable and bioplastic containers lead growth at 9.8%, roughly 1.63 times the overall rate, as chains race to meet consumer sustainability expectations and comply with tightening single-use plastic restrictions across major markets from California to the European Union and beyond. East Asia now holds the largest regional share at 27%, driven by China's foam ban enforcement and its enormous domestic quick-service and food delivery packaging volume across hundreds of major cities.
Competitive intensity stays moderate at 38% held by five suppliers, since converting fiber and molded pulp capacity requires meaningful capital investment that fragments share across dozens of regional converters rather than concentrating around a handful of global platforms the way more capital-intensive packaging categories often do. Chains increasingly select suppliers on transition speed and documented compostability certification rather than unit price alone in most negotiations.
Market Definition
Base Year Value
$12.4B in 2025 (MMA Primary Research Dataset, August 2026)
Forecast Period
2026 to 2036, eleven discrete annual values
CAGR
6.0% base case. Bull 7.3%. Bear 4.7%.
Fastest Growth Segment
Compostable and Bioplastic Containers: 9.8% CAGR
Fastest Growth Country
India: 9.2% CAGR
Fastest Growth Region
South Asia and Pacific: 8.2% CAGR
Largest Region
East Asia: 27% of 2025 global value
Market Leaders
Primary Survey
n=3,800 procurement and R&D decision-makers, Q4 2025, six countries
Methodology
Demand-side build-up, cross-validated against public data, 47 expert interviews

Fast Food Containers Market Forecast Scenarios

fast-food-containers-market-size-forecast-scenario-1787300466257
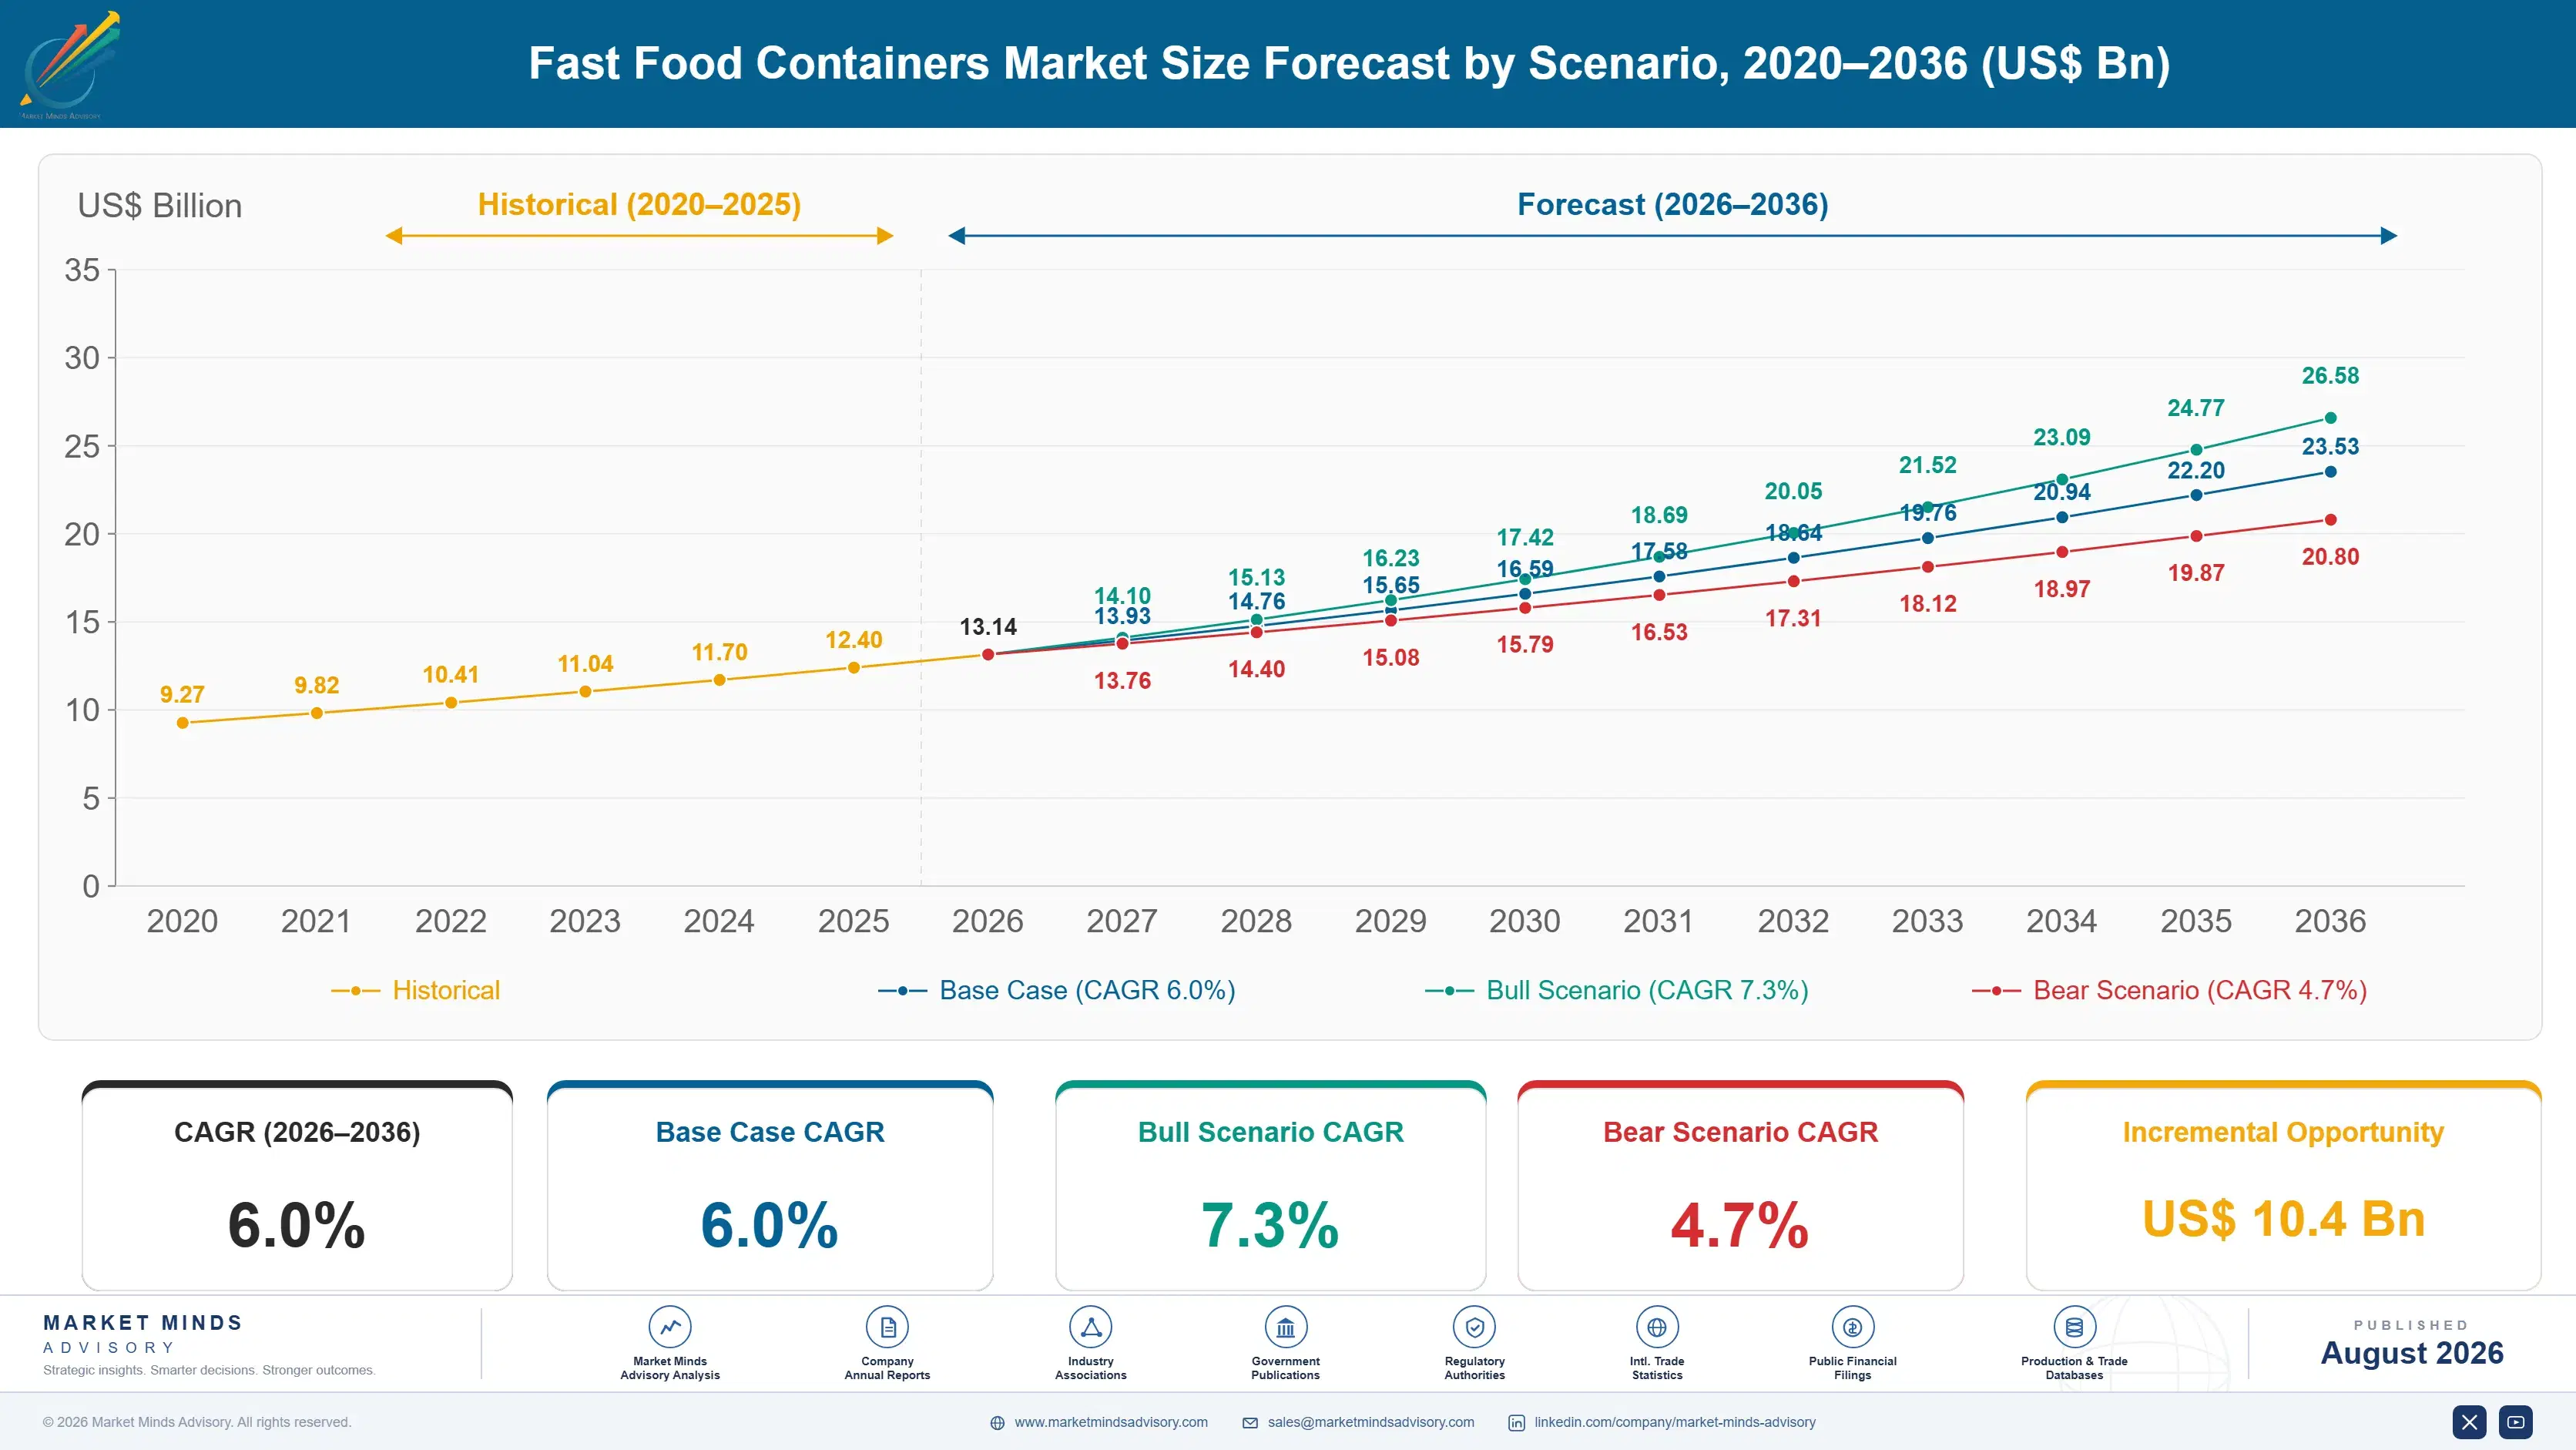
Between 2020 and 2025 the market grew at an estimated 5.2% annually, slowed initially by pandemic-driven restaurant closures before accelerating sharply as delivery and takeout volume surged and never fully receded to pre-pandemic dine-in patterns across most major developed markets. Foam bans accelerating in China and across several American states added further momentum after 2022.
Three mechanisms carry the base case to 6.0%. First, foam and single-use plastic bans keep expanding across new cities, states, and entire countries, forcing conversion regardless of underlying demand growth in food service volume. Second, quick-service chains are committing to corporate sustainability targets that specify compostable or recyclable packaging by defined deadlines. Third, delivery and takeout volume keeps climbing well above pre-pandemic levels, sustaining elevated container demand far above prior dine-in traffic levels.
The bull case at 7.3% assumes accelerating regulatory bans across additional major markets force faster conversion timelines than currently planned by most large quick-service chains. The bear case at 4.7% assumes consumer resistance to higher packaging costs pushes chains toward cheaper conventional plastic alternatives wherever regulation still permits their continued use across less-restricted jurisdictions still permitting broader material choice.

Material Transition as the Central Commercial Story

Fast food containers sit at the intersection of brand marketing and regulatory compliance for any quick-service chain operating across multiple jurisdictions, since packaging material now shows up on menu boards and delivery apps as a sustainability credential rather than staying invisible behind the counter as it once did. Material substitution economics, not raw manufacturing efficiency, increasingly separate competing suppliers across nearly every major chain contract negotiation.
MARKET CONCENTRATION (CR5)38%Five suppliers hold moderate share across fragmented converter field
AVERAGE SELLING PRICE PREMIUM25-40%Compostable containers command premium pricing over conventional foam equivalents
TOP PRODUCING COUNTRY SHARE24%China supplies largest share of installed container manufacturing capacity
CONTRACT RENEWAL CYCLE2 to 4 yearsChain packaging agreements typically span several years before renewal review
FIBER INPUT COST SHARE35-45% of COGSPulp and paperboard inputs weigh heavily on production costs today
TRADE INTENSITY29% cross-borderContainer components frequently cross borders before final packaging assembly
Commercially, the category behaves like a specialized converting business wrapped inside a broader chain procurement relationship. Suppliers bundle container hardware with menu-specific design and co-branding services under multi-year contracts, which locks chains into a single primary vendor across an entire national footprint rather than encouraging store-by-store shopping on price. Switching suppliers requires requalifying packaging against health and safety standards, a process most chains avoid without strong cause.
Over the next decade, expect compostable and molded fiber formats to become the default rather than the premium choice, as feedstock cost keeps falling and additional jurisdictions adopt foam and plastic restrictions across both developed and emerging markets. Chains will also increasingly demand end-of-life composting infrastructure commitments from suppliers rather than treating certification alone as sufficient proof of genuine sustainability performance.
"The clamshell is now a marketing surface. Chains care less about how much a container costs and more about what it says about them when a customer photographs it."
Director, Packaging and Foodservice Materials Practice · MMA Packaging / Foodser

Market Trends

Foam Container Bans Expand Across Major Markets

China's nationwide expanded polystyrene foodservice ban, enforced since 2020, eliminated one of the world's largest foam container markets almost overnight, forcing rapid conversion to paper and molded fiber alternatives across the country's enormous quick-service and delivery sector. New York City, Maine, and several other American jurisdictions have since adopted comparable restrictions, and the European Union's Single-Use Plastics Directive has pushed similar conversion across member states since 2021. Huhtamaki and Pactiv Evergreen have both expanded fiber-based manufacturing capacity specifically to serve chains navigating this patchwork of overlapping regulatory deadlines across different jurisdictions simultaneously.
Market Impact: Adds 15,000 restaurant conversions yearly
Delivery Volume Growth Sustains Elevated Container Demand

Food delivery volume through platforms like DoorDash, Uber Eats, and Meituan has settled at levels well above pre-pandemic dine-in patterns, and each delivery order requires more packaging per meal than traditional dine-in or simple takeout service ever did. Leak-resistant, stackable container designs engineered specifically for delivery transport are displacing older formats built purely for in-store consumption. Sabert and Anchor Packaging have both expanded delivery-specific product lines featuring improved seal integrity and vented designs that keep food quality intact across longer transit times than conventional containers were ever designed to handle reliably.
Market Impact: Adds 8 billion delivery orders yearly

Market Opportunities and Growth Drivers

Corporate Sustainability Commitments Force Packaging Conversion

Major quick-service chains including McDonald's and Starbucks have publicly committed to eliminating virgin fossil-fuel plastic packaging by defined future deadlines, and each commitment forces a systematic conversion across thousands of restaurant locations regardless of local regulatory requirements. These commitments create demand that runs ahead of regulation itself, since chains want to avoid negative publicity for missing self-imposed sustainability targets they announced publicly to shareholders and customers alike. Suppliers with proven compostable and recyclable product lines are capturing disproportionate share of these large multi-year conversion contracts, since qualification for a national chain rollout takes considerable time and documented certification work.
Market Impact: Adds 25% to 40% packaging cost

Delivery Platform Growth Expands Addressable Container Base

Global food delivery gross merchandise value keeps climbing well past pre-pandemic levels as consumer ordering habits shift permanently toward app-based delivery and takeout across most major urban markets worldwide. Each delivery order requires dedicated leak-resistant and stackable packaging that differs meaningfully from traditional dine-in serviceware, creating incremental container demand independent of underlying meal volume growth across the broader restaurant sector. Meituan and DoorDash both report continued order growth through 2025, and restaurants increasingly specify delivery-optimized packaging as a distinct procurement category from their standard dine-in and counter-service container lines rather than an afterthought.
Market Impact: Leaves 60% of containers landfilled

Market Restraints and Challenges

Compostable Materials Cost Considerably More Than Foam

Compostable and molded fiber containers typically cost meaningfully more than the conventional foam or plastic alternatives they replace, creating genuine margin pressure for quick-service chains operating on already thin per-transaction profit margins. The root cause is production economics: compostable feedstock and specialized manufacturing processes remain less mature and lower-scale than decades-old foam extrusion technology. That cost gap pushes budget-constrained regional chains to delay conversion until regulation forces the switch outright, rather than adopting proactively ahead of mandates. Suppliers are responding with scaled manufacturing investment intended to close the cost gap meaningfully over the coming several years.
Market Impact: Eliminates foam in 40% of cities

Composting Infrastructure Gaps Undermine End-of-Life Claims

Compostable containers frequently end up in conventional landfill waste streams anyway, since municipal composting infrastructure capable of actually processing them remains unavailable across most cities where chains operate restaurants. The root cause is infrastructure lag: certification standards advanced faster than the industrial composting facility network needed to fulfill the promise those certifications represent to consumers. That gap creates real greenwashing exposure for chains marketing compostability without disclosing that most containers still end up landfilled regardless. Suppliers and chains are increasingly partnering directly with municipalities to expand composting collection infrastructure alongside packaging conversion efforts.
Market Impact: Adds 22% more packaging per order
3 additional market trends, 4 additional growth drivers, and 2 additional restraints and challenges are covered in the full report. Contact sales@marketmindsadvisory.com to access the complete intelligence.

Segment CAGR and Growth Architecture

Segmentation follows container material type, a single substrate logic spanning paperboard and fiber, molded fiber, expanded polystyrene foam, rigid plastic, aluminum foil, and compostable bioplastic containers. Each material carries distinct cost structure, regulatory exposure, and end-of-life pathway, so commercial position tracks the substrate rather than the specific menu item or restaurant category it happens to package.
fast-food-containers-market-market-share-analysis-1787300466790

Compostable and Bioplastic Containers

Compostable and bioplastic containers grow fastest at 9.8%, about 1.63 times the overall market rate, as quick-service chains race to meet corporate sustainability commitments and comply with tightening single-use plastic restrictions across an expanding list of jurisdictions. PLA-lined paperboard and PHA-based formulations are displacing conventional plastic-coated containers across cold beverage and salad applications specifically, where compostability claims matter most to environmentally conscious consumers. Eco-Products and BioPak have both expanded manufacturing capacity to meet chain demand, and certification bodies like BPI are processing a growing backlog of new product approvals as suppliers race to qualify formulations ahead of upcoming regulatory deadlines across multiple major markets simultaneously, from North America to East Asia and the European Union.
CAGR 9.8%

Molded Fiber Containers

Molded fiber containers grow second-fastest at 8.0%, driven directly by foam ban enforcement across China, several American states, and the European Union, since molded fiber represents the most direct and cost-competitive replacement for expanded polystyrene clamshells and trays across most quick-service applications. Manufacturing capacity has struggled to keep pace with sudden regulatory-driven demand spikes, creating temporary supply shortages in newly regulated markets during transition periods. Huhtamaki and International Paper have both announced major molded fiber capacity expansions since 2023, and converters increasingly compete on manufacturing speed and reliable supply continuity rather than unit price alone during these regulatory transition windows across newly restricted jurisdictions and cities nationwide during peak seasonal demand periods.
CAGR 8.0%
Full segment breakdown across 6 segments available in the complete report.

Regional Architecture and Country Demand Map

East Asia leads at 27% of global value on China's foam ban enforcement and enormous quick-service delivery volume, followed by North America at 25% and Western Europe at 19% on Single-Use Plastics Directive compliance. Remaining regions together account for the balance of overall global demand today.

North America

United States quick-service chains anchor North American demand, where state-level foam bans across California, New York, and Maine have accelerated conversion well ahead of any federal mandate, creating a patchwork compliance landscape that suppliers must navigate state by state. Corporate sustainability commitments from McDonald's, Starbucks, and other national chains add a demand layer independent of regulation itself, since brand risk alone now justifies conversion in jurisdictions without any legal requirement. Canada's federal single-use plastics restrictions, phased in since 2022, add further momentum across the broader region. Growth of 6.3% outpaces the global rate as both regulatory pressure and voluntary corporate commitments compound across an already large and rapidly converting restaurant base.
Share: 25% | CAGR: 6.3% (2026 to 2036)

Western Europe

The European Union's Single-Use Plastics Directive, in force since 2021, drives most Western European demand by banning several plastic foodservice item categories outright and requiring extended producer responsibility fees on remaining plastic packaging across every member state. Germany and France, hosting the region's largest quick-service restaurant networks, have seen the fastest conversion to fiber and compostable alternatives among major national markets. The United Kingdom maintains its own comparable restrictions following its departure from the European Union's regulatory framework. Growth of 4.6% trails the global average because conversion already occurred earlier and faster here than in most other regions, leaving less remaining headroom for further material substitution across most product categories.
Share: 19% | CAGR: 4.6% (2026 to 2036)
Regional intelligence for 5 additional markets available in the complete report: East Asia, South Asia and Pacific, Latin America, Middle East and Africa, Eastern Europe. Contact sales@marketmindsadvisory.com.
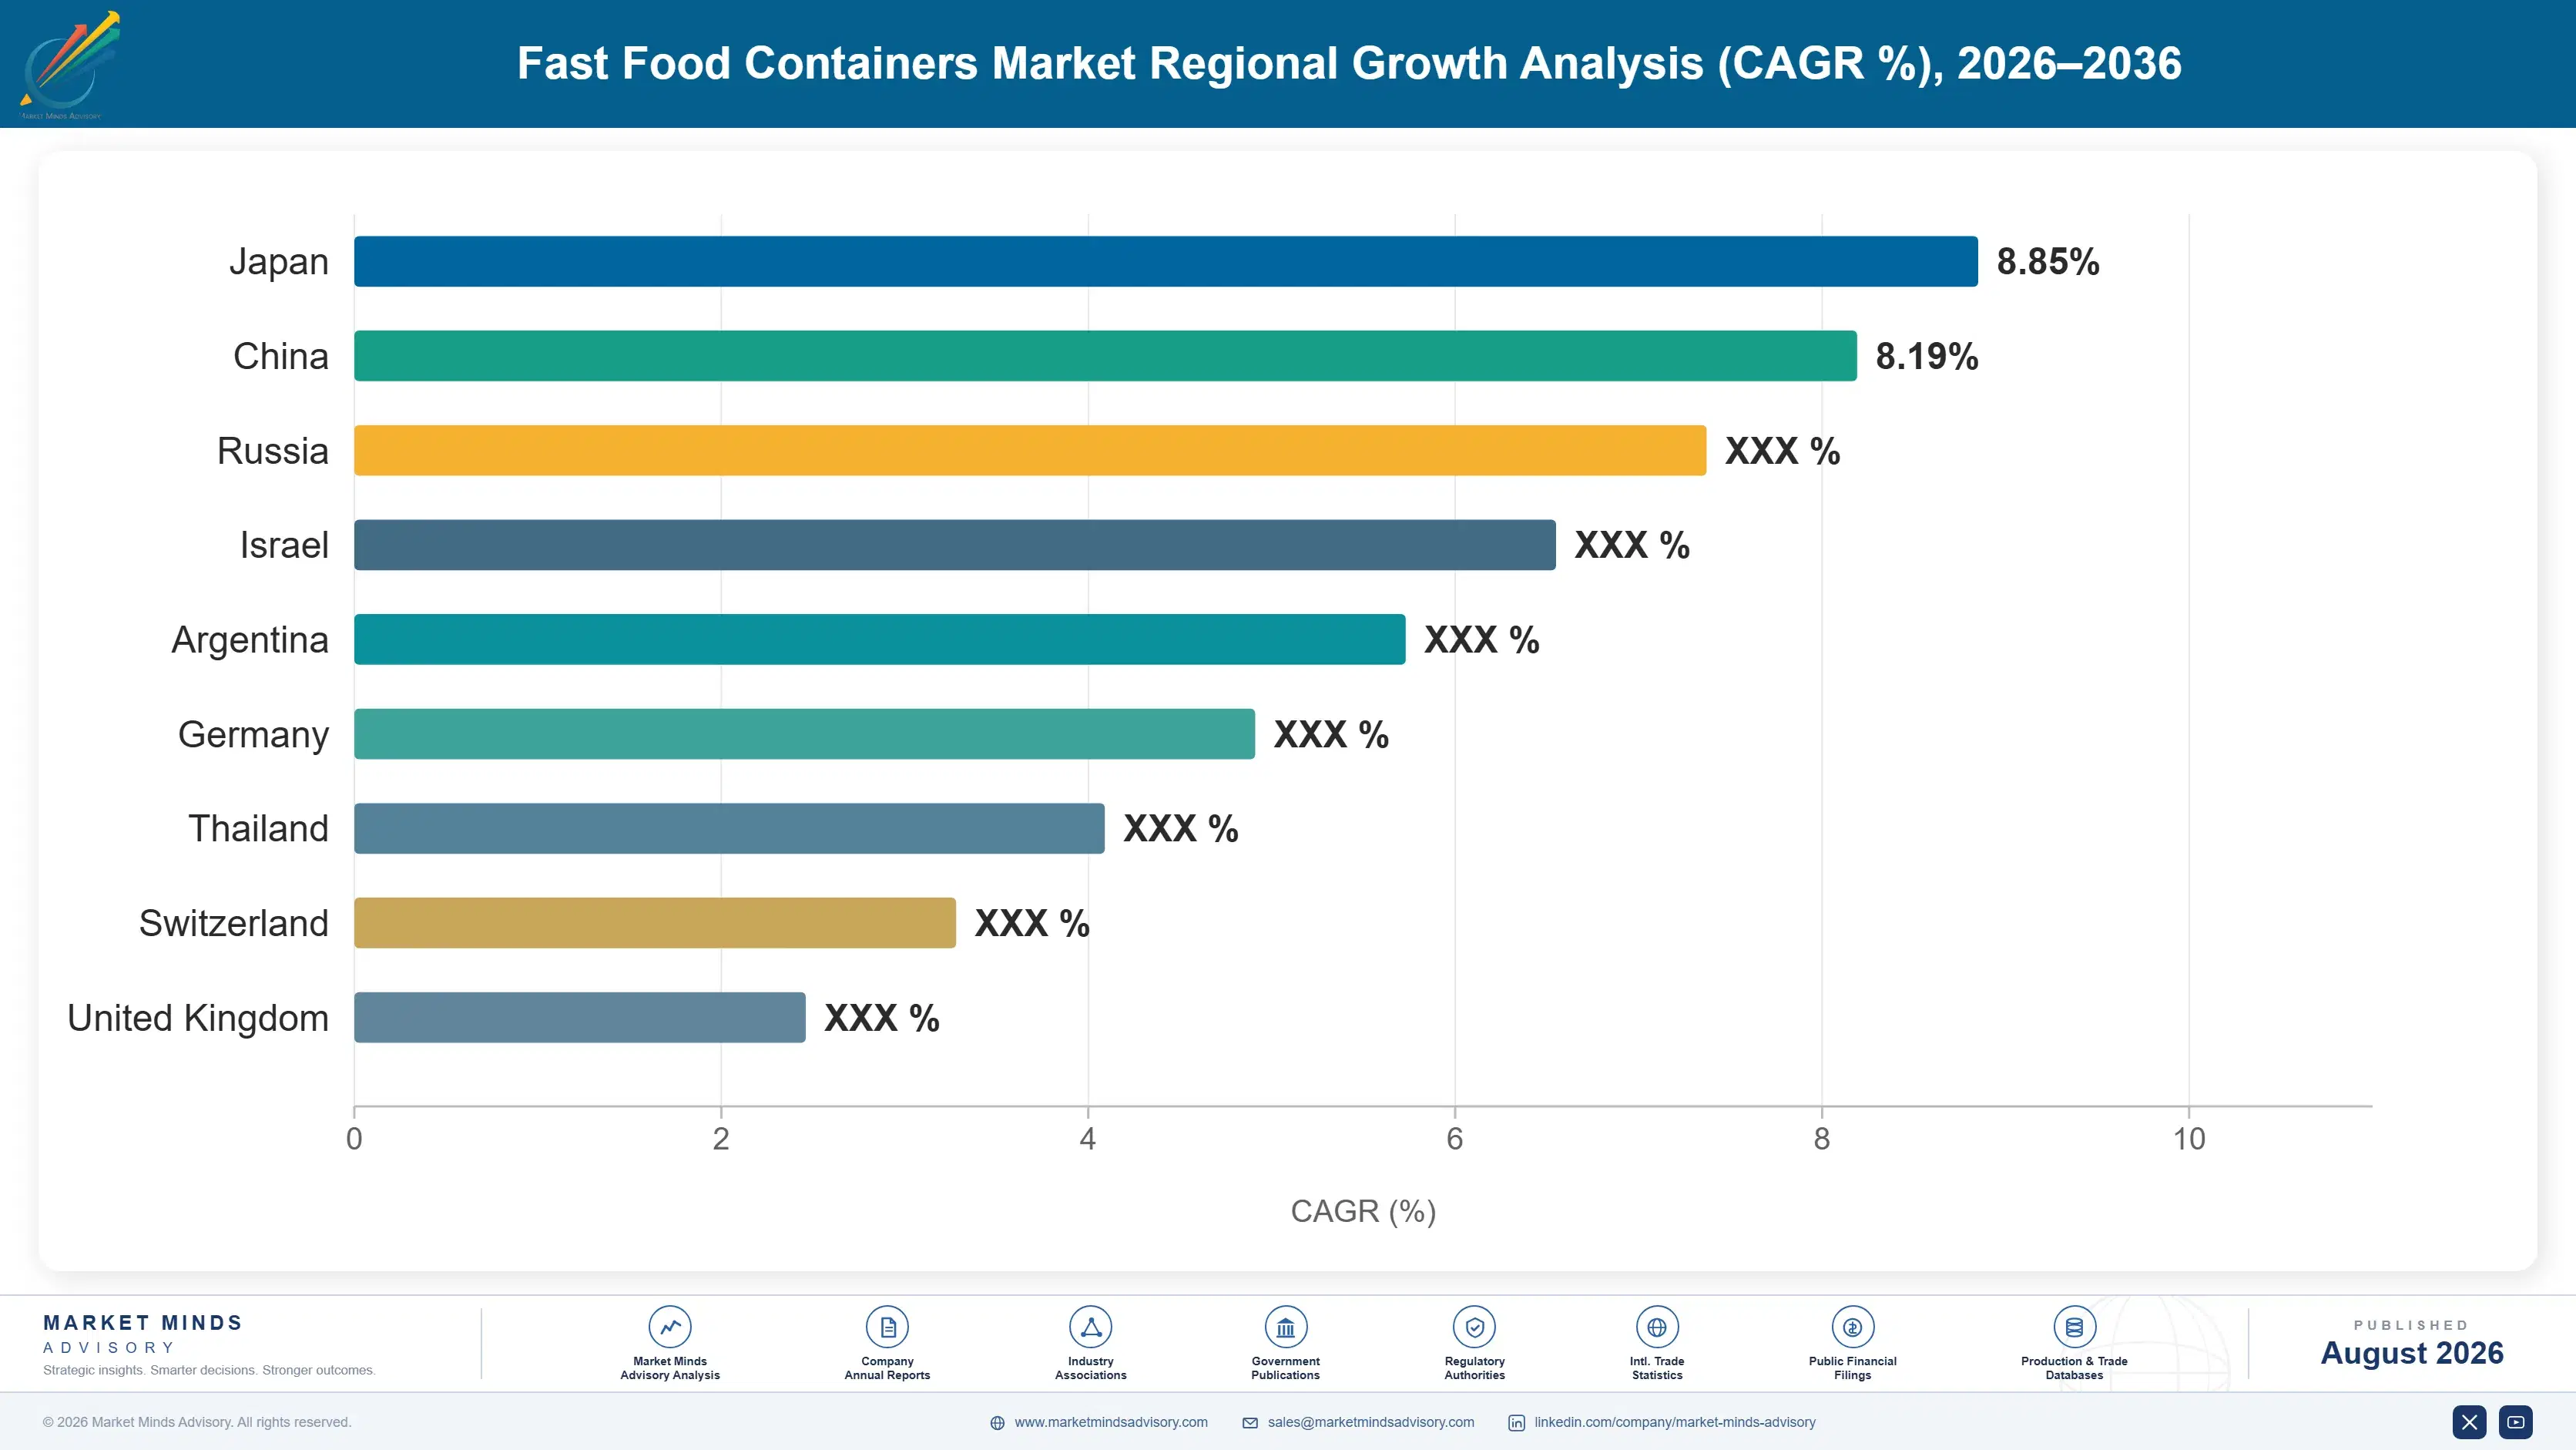
fast-food-containers-market-country-cagr-analysis-1787300467301

Where Converters Can Defend Container Margin

Suppliers can defend margin against commoditized container pricing in several distinct ways beyond simply selling more units into a growing installed restaurant base. The four levers below identify genuine commercial advantage: compostability certification, delivery-specific engineering, national chain contract lock-in, and manufacturing capacity positioned ahead of regulatory deadlines across major markets and regulatory jurisdictions worldwide.

Secure Compostability Certification Ahead of Deadlines

Chains facing regulatory deadlines need certified compostable packaging quickly, and BPI or European equivalent certification takes many months to complete, creating a genuine first-mover advantage for suppliers who begin the process early rather than waiting for mandates to take effect. Certified suppliers can charge premiums of 20% to 35% over uncertified alternatives during the scramble period immediately before enforcement begins, since chains have no alternative but to pay for compliance regardless of cost. Eco-Products has built a durable reputation around fast-tracking certification specifically for chains facing imminent regulatory deadlines across multiple jurisdictions.
Market Impact: Commands a durable 20% to 35% price premium

Engineer Delivery-Optimized Container Design and Format

Standard dine-in container designs perform poorly across long delivery transit times, creating a genuine engineering differentiation opportunity for suppliers willing to invest in leak-resistant, vented, and stackable formats. Suppliers with proven delivery-optimized designs can charge meaningfully more, often 15% to 25% above standard containers, because restaurants value avoiding customer complaints about soggy or spilled food more than the incremental packaging cost involved. Sabert has built a specific reputation around this capability, winning share among delivery-heavy chains that generalist suppliers struggle to match on documented transit performance and consumer satisfaction data.
Market Impact: Commands a durable 15% to 25% price premium

Lock In National Chain Contracts Early

Winning a national chain's primary packaging contract creates a multi-year revenue relationship that smaller regional competitors cannot easily displace, since switching suppliers requires costly requalification against health and safety standards across thousands of locations simultaneously. Suppliers that secure these contracts early, often locking in three to five year exclusivity commitments, gain guaranteed volume independent of individual restaurant-level negotiations across the entire chain footprint. Huhtamaki and Pactiv Evergreen both hold long-standing national chain relationships worth well over 100 million dollars annually that insulate volume from smaller competitors regardless of their pricing aggressiveness.
Market Impact: Secures 5-year exclusivity contracts worth many millions annually

Build Manufacturing Capacity Ahead of Regulatory Deadlines

Manufacturing capacity for fiber and compostable containers has repeatedly struggled to keep pace with sudden regulatory-driven demand spikes when new bans take effect, creating temporary shortages that reward suppliers who invested ahead of the mandate rather than reactively. Suppliers with pre-positioned capacity in newly regulated markets can capture premium pricing of 10% to 20% during the transition scramble, since chains facing hard compliance deadlines cannot wait for new capacity to come online elsewhere. International Paper has repeatedly timed capacity expansions to anticipate announced regulatory deadlines across multiple jurisdictions well before enforcement dates arrive.
Market Impact: Captures a durable 10% to 20% scramble premium

Who Controls the Margin Pool

Concentration stays moderate at 38% held by the top five suppliers, evaluated on revenue from foodservice container product lines specifically. Huhtamaki and Pactiv Evergreen lead on scale and national chain relationship depth, while Genpak, D&W Fine Pack, and Dart Container compete across different material specialties and regional footprints. The gap between leader and challenger is meaningful but not decisive, since national chains often qualify multiple vendors.
Competitive activity currently runs along three dimensions. Material transition speed matters most, as suppliers race to qualify compostable and molded fiber formulations ahead of regulatory deadlines. Delivery-specific engineering runs a close second, as leak-resistant and stackable designs become a distinct product category. National contract lock-in is the third, converting individual restaurant sales into multi-year chain-wide agreements that guarantee volume.

Pressure is building from two directions. Chinese domestic converters are scaling rapidly and narrowing the technology gap on molded fiber and compostable formulations, threatening incumbents' share in price-sensitive emerging markets. Meanwhile specialty biomaterial startups are commercializing novel formulations that could challenge established suppliers on genuine sustainability credentials. Rankings will shift toward suppliers combining certified compostability with proven national-scale manufacturing reliability.
fast-food-containers-market-company-positioning-matrix-1787300467821

Competitive Moat and Risk Dimensions

HUHTAMAKI OYJ

Moat: Global Fiber Manufacturing Scale

Huhtamaki operates fiber and molded pulp manufacturing capacity across multiple continents, giving it breadth to serve global chains rolling out packaging changes simultaneously across many countries. That scale lets Huhtamaki absorb regulatory-driven demand spikes that smaller regional converters cannot match on speed, volume, or geographic reach.
HUHTAMAKI OYJ

Risk: Exposure to Pulp Price Volatility

Huhtamaki's fiber-heavy portfolio makes it more exposed than diversified plastic and foam converters to swings in pulp and paperboard commodity pricing, which can compress margin sharply during supply tightness. That input exposure creates earnings volatility competitors with more diversified material portfolios largely avoid across their broader material portfolios.
PACTIV EVERGREEN INC.

Moat: Broad Material Portfolio Diversity

Pactiv Evergreen offers foam, plastic, fiber, and compostable options simultaneously, letting it serve chains at any stage of their material transition journey without losing the account to a single-material specialist. That flexibility captures share regardless of which material a given chain or jurisdiction ultimately favors.
PACTIV EVERGREEN INC.

Risk: Legacy Foam Assets Face Obsolescence

Pactiv Evergreen's substantial existing foam manufacturing capacity faces accelerating obsolescence as bans expand across more jurisdictions, forcing costly asset write-downs and conversion capital spending that fiber-focused competitors avoid. That legacy exposure could pressure margin during the transition period ahead as more jurisdictions adopt outright foam restrictions.

Key Players

Huhtamaki Oyj
Pactiv Evergreen Inc.
Genpak, LLC
D&W Fine Pack LLC
Dart Container Corporation

Others

International Paper Company
WestRock Company
Sabert Corporation
Berry Global Group, Inc.
Novolex Holdings, LLC
Anchor Packaging, LLC
Eco-Products, Inc.
BioPak Pty Ltd
Vegware Ltd
Detmold Group
Fabri-Kal Corporation
Georgia-Pacific LLC
Seda International Packaging Group S.p.A.
Solia SAS
Amcor plc

Recent Developments

APRIL 2025

Huhtamaki expands molded fiber manufacturing capacity in China

Huhtamaki opened an expanded molded fiber manufacturing facility in eastern China dedicated to serving quick-service chains converting away from foam under the country's enforcement regime. This was an organic capacity expansion, not a corporate transaction, reflecting direct investment in response to sustained regulatory-driven demand growth.
Signal: Shows leading suppliers investing directly in dedicated capacity ahead of continued Asian regulatory enforcement expansion nationwide.
JANUARY 2025

Pactiv Evergreen acquires compostable packaging technology developer

Pactiv Evergreen acquired a privately held compostable packaging technology developer specializing in PHA-based container formulations for an undisclosed sum. The acquisition was a full corporate purchase, not a licensing arrangement or joint venture, giving Pactiv Evergreen direct ownership of the underlying material technology and its associated patents.
Signal: Indicates suppliers increasingly prefer owning differentiating compostable material technology rather than licensing it externally from specialists.
SEPTEMBER 2024

Sabert and a major delivery platform sign packaging supply agreement

Sabert signed a multi-year supply agreement to provide delivery-optimized containers directly through a major food delivery platform's restaurant partner marketplace. The arrangement was a supply agreement, not an acquisition or joint venture, extending Sabert's distribution reach into thousands of smaller independent restaurants across several major metropolitan markets.
Signal: Signals delivery platforms increasingly mediate packaging procurement decisions for smaller independent restaurant partners directly and efficiently.

Pulp and Bioplastic Feedstock Exposure

Virgin and recycled pulp, along with bioplastic feedstocks like PLA resin, together account for roughly 35% to 45% of container COGS, sourced primarily from pulp mills in North America and Scandinavia and from PLA resin producers concentrated in the United States and Thailand. Petroleum-based plastic resin used in remaining conventional lines adds a further 10% to 15%, sourced from major petrochemical producers.
Pulp prices climbed sharply through 2024 as global paper packaging demand competed directly with foodservice container converters for the same fiber supply chain, with benchmark kraft pulp prices reaching multi-year highs according to trade data. Huhtamaki's 2024 annual report disclosed higher input costs attributable to pulp inflation, noting that fiber cost rose meaningfully faster than the company could pass through to chain customers without margin compression across its molded fiber segment.

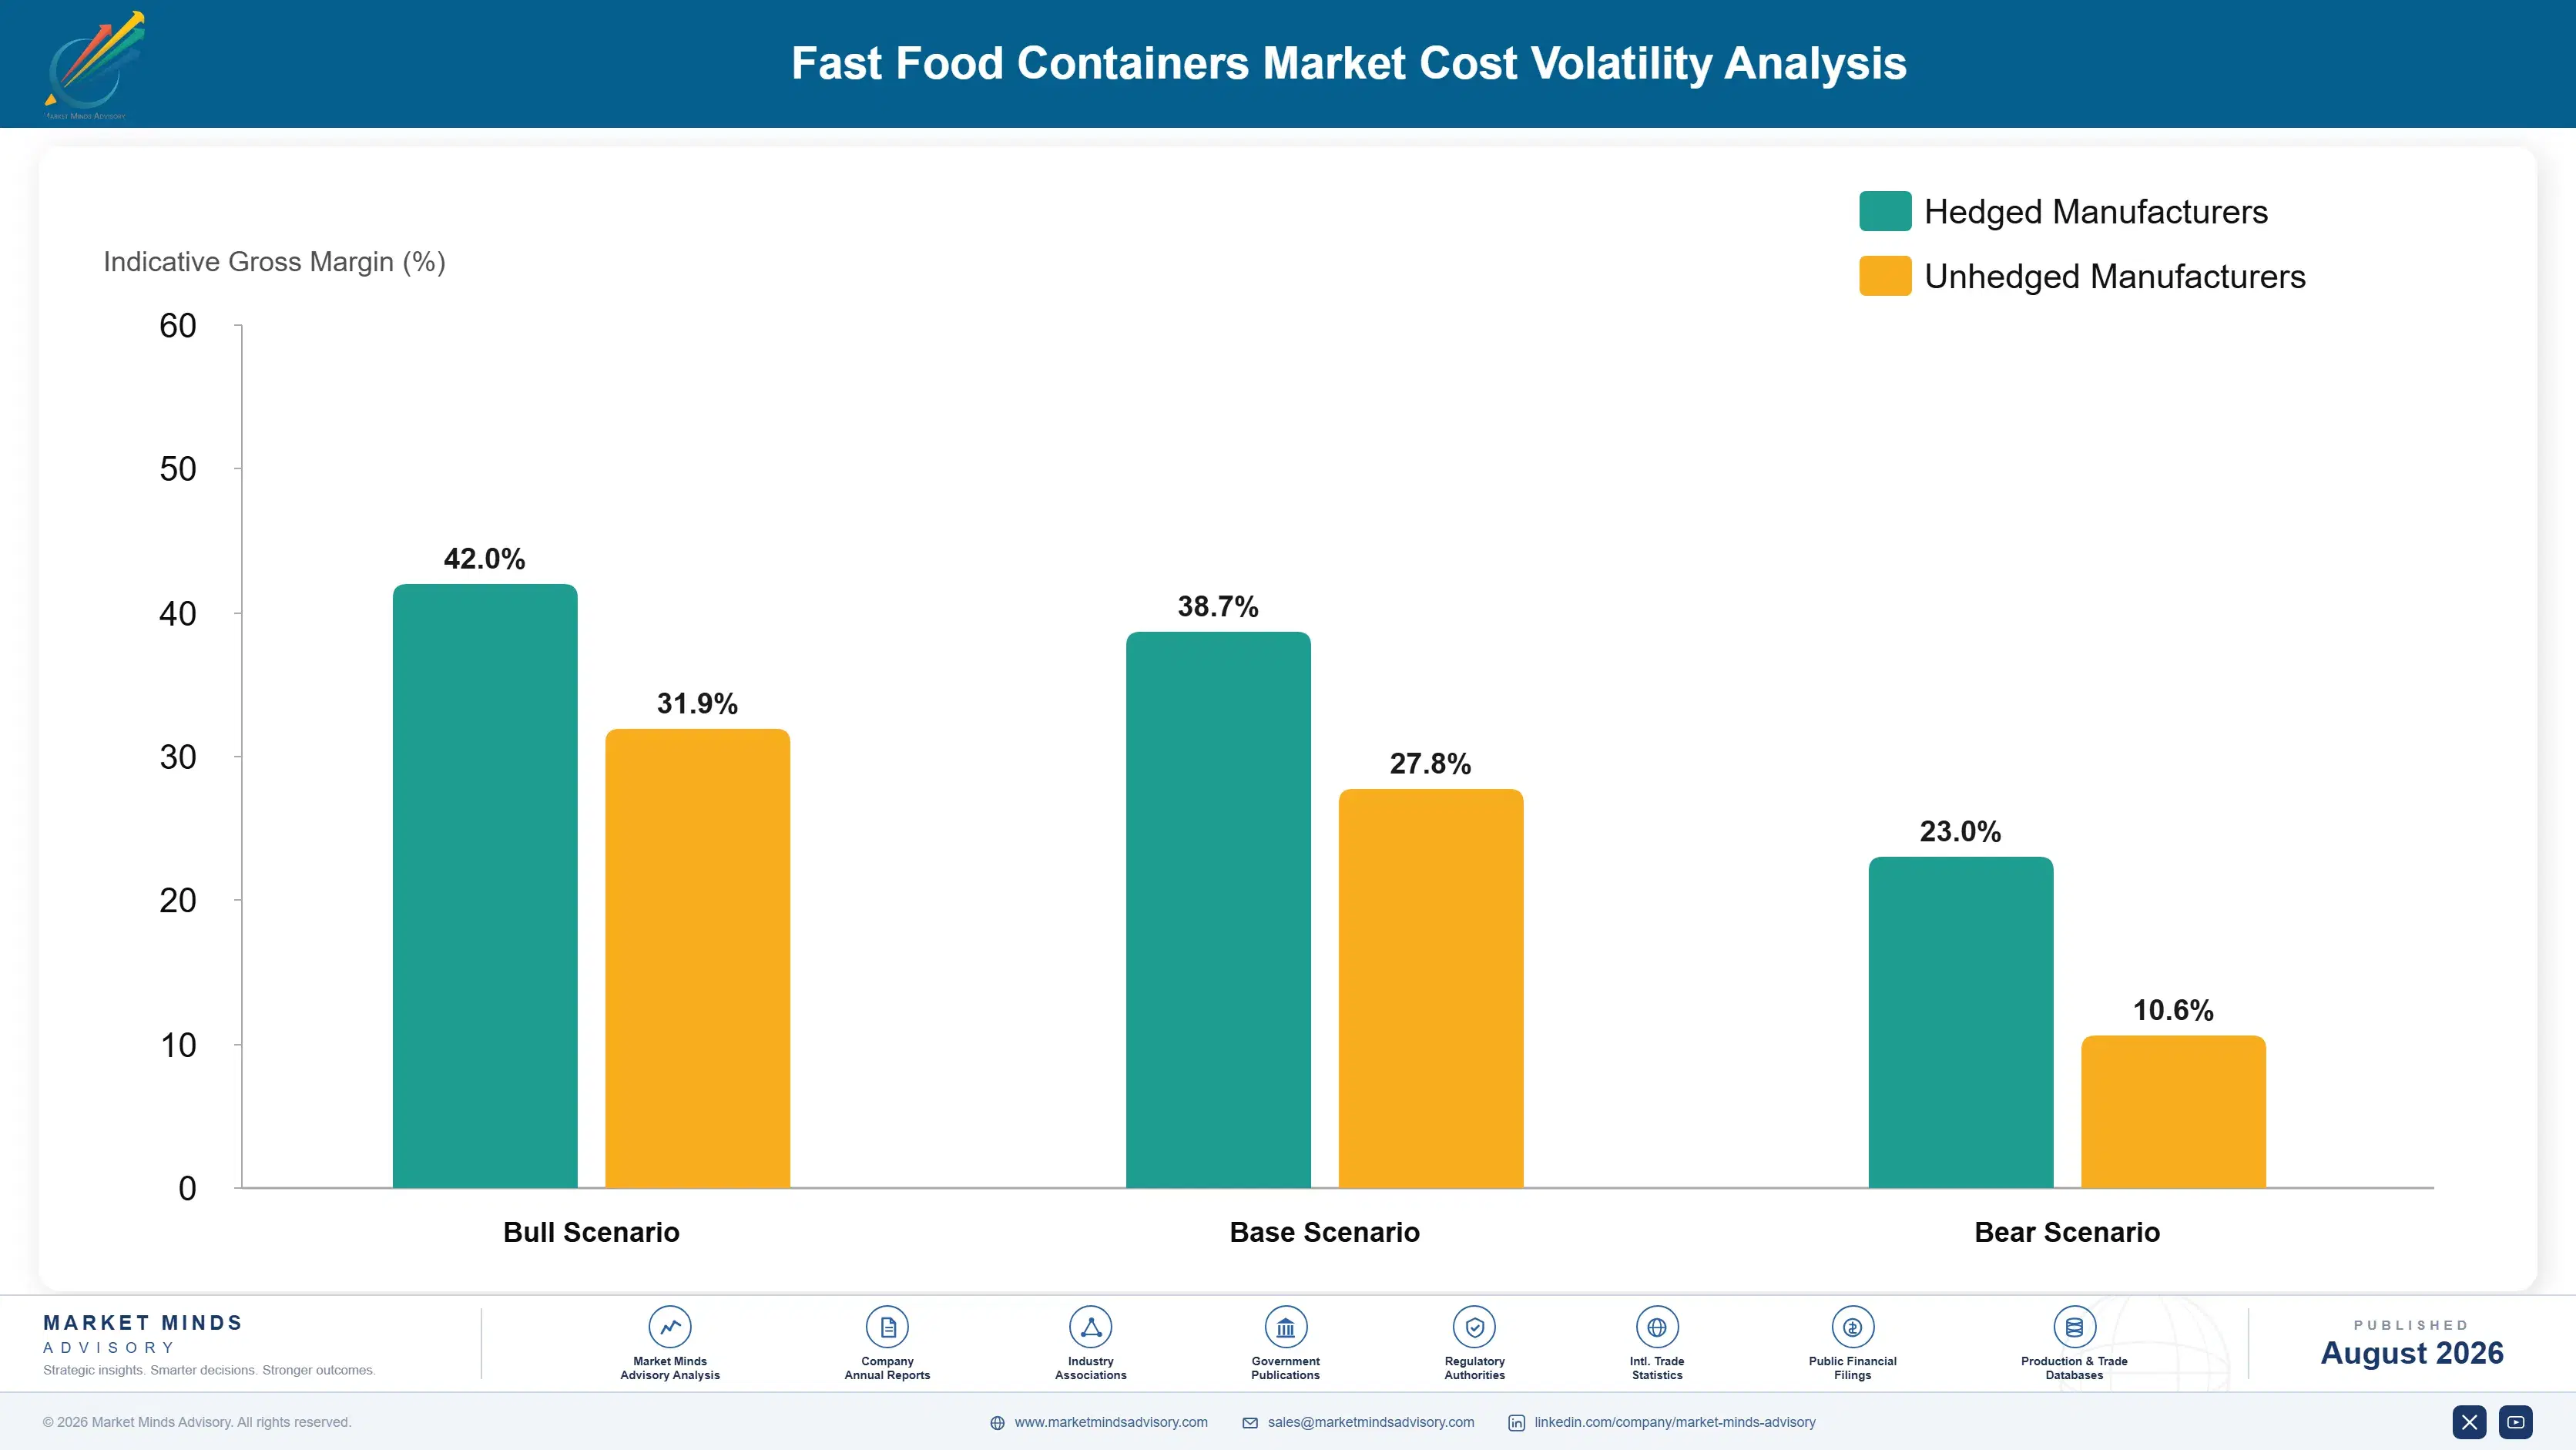
Smaller regional converters carry more exposure than the largest diversified suppliers, since they lack the purchasing scale to negotiate favorable long-term pulp contracts with primary mills. Suppliers sourcing PLA resin from a concentrated set of producers face additional exposure to capacity constraints, while those with diversified feedstock sourcing absorb volatility more predictably across their broader supply chain.
fast-food-containers-market-cost-volatility-analysis-1787300468015

Lock Pulp Pricing Through Annual Supply Contracts

Pulp is the largest single volatile input across fiber-based container lines and increasingly competed for by broader paper packaging demand. Annual supply agreements with fixed or collared pricing, common practice among larger diversified converters, smooth quarter-to-quarter volatility and let commercial teams quote multi-year chain contracts with genuine confidence rather than repricing constantly against spot markets.

Diversify PLA Resin Sourcing Across Producers

Reliance on a concentrated set of PLA resin producers concentrates both price and availability risk unnecessarily across an entire compostable product line. Qualifying secondary resin suppliers across multiple regions, even at modestly higher unit cost, protects continuity when any single producer faces capacity outage or a sudden demand spike from competing bioplastic application sectors worldwide.

Increase Recycled Fiber Content Where Possible

Suppliers that increase recycled fiber content in non-food-contact container layers reduce virgin pulp exposure meaningfully while also supporting sustainability marketing claims chains increasingly value. That substitution also insulates margin somewhat from virgin pulp price spikes, since recycled fiber pricing tends to move on a different cycle than virgin material markets typically follow across most producing regions.

Portfolio Architecture for Margin Defence

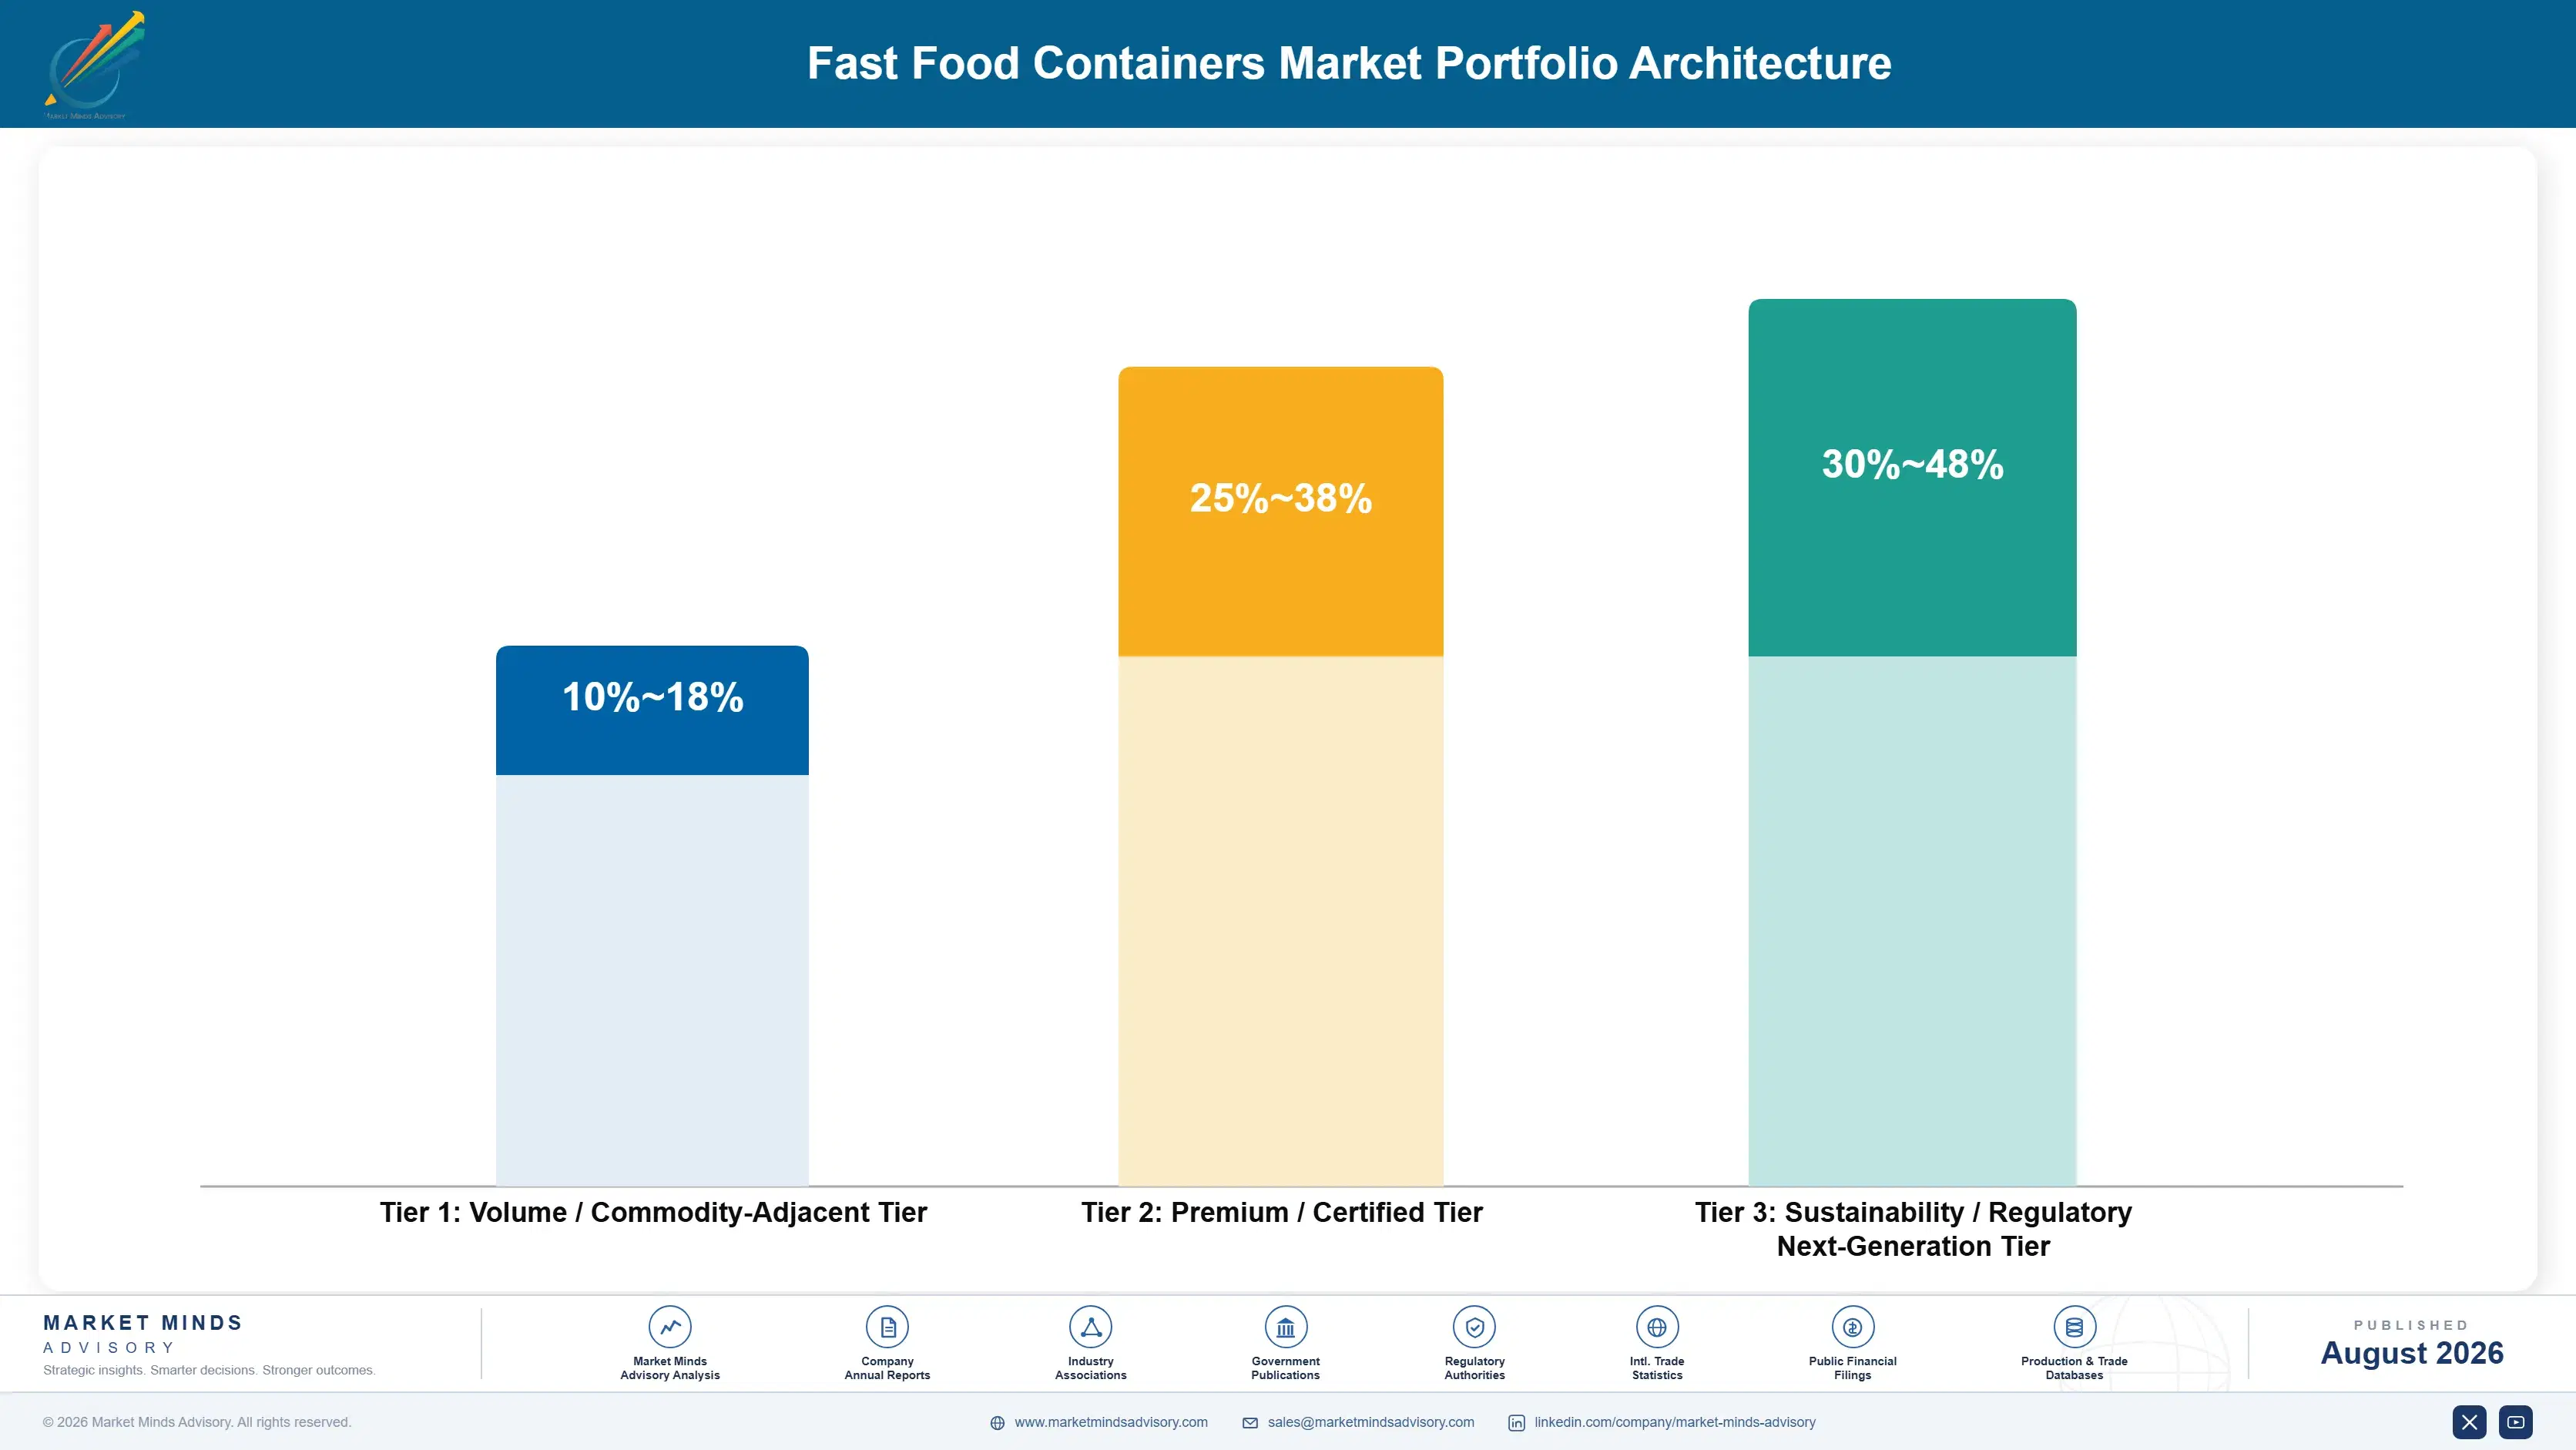
The portfolio splits into three tiers with meaningful margin separation tied to material sustainability and certification depth. Volume tier products carry conventional plastic and remaining foam configurations where regulation still permits their use, competing largely on price. Premium certified products carry molded fiber and recycled content designs backed by documented sustainability claims. Sustainability and next-generation products attract the sector's most active research investment.
The tension between volume and premium runs through nearly every supplier's product roadmap. Volume products fund the manufacturing scale and distribution network premium products eventually depend on, yet volume margins keep compressing as regulation steadily eliminates the cheapest conventional options. Suppliers that under-invest in compostable and premium certified capacity risk being locked out of chain contracts entirely, while those chasing premium exclusively struggle to fund the manufacturing base for remaining demand.

High-value margin pools concentrate specifically in compostable and delivery-optimized categories where regulatory compliance and consumer-facing sustainability claims carry the largest commercial stakes, and where certification commands genuine pricing power. Conventional plastic and fiber transfer generates steadier volume but thinner margin, since that segment competes against a wider set of lower-cost regional suppliers with adequate but unremarkable sustainability credentials.

Volume / Commodity-Adjacent Tier

Conventional plastic and remaining foam configurations where regulation still permits their continued use, competing largely on price against a crowded field of regional converters offering broadly comparable specifications and materials at similar cost.
Gross Margin: 10-18%

Premium / Certified Tier

Molded fiber and recycled content designs backed by documented sustainability claims and formal chain qualification, commanding meaningful pricing premiums over conventional equivalents across most major developed and emerging quick-service restaurant markets globally.
Gross Margin: 25-38%

Sustainability / Regulatory / Next-Generation Tier

Certified compostable formulations still scaling rapidly across the installed restaurant base, targeting regulatory compliance and sustainability outcomes that conventional materials simply cannot match consistently across every application and jurisdiction worldwide.
Gross Margin: 30-48%
fast-food-containers-market-portfolio-architecture-1787300468508

High-value Sub-segments and Strategic Watch-out

Certified Compostable Delivery Packaging

High value and high growth, driven by corporate sustainability commitments and delivery volume expansion simultaneously, with certification barriers protecting incumbent suppliers from new entrant price competition on the largest national chain accounts nationwide and internationally, from major metropolitan flagship stores to smaller franchise locations operating under the same national brand.
Gross Margin: 30-48%

Molded Fiber Foam Replacement Lines

High value with moderate growth, anchored by ongoing foam ban enforcement across major markets, where documented conversion speed and reliable supply increasingly decide vendor qualification during regulatory transition windows across multiple overlapping jurisdictions simultaneously, each with its own enforcement timeline, compliance grace period, and penalty structure.
Gross Margin: 25-38%

Conventional Plastic Transfer Containers

The category's largest volume base by unit count, competing on price against a crowded field of regional suppliers, generating steady but thin margin as regulation steadily narrows the addressable conventional plastic market segment worldwide, year after year, region by region, as more jurisdictions adopt restrictions.
Gross Margin: 10-18%

Legacy Expanded Polystyrene Foam Lines

Strategic watch-out where accelerating regulatory bans threaten to eliminate remaining foam demand entirely, creating genuine asset stranding risk for converters slow to redirect capacity toward fiber and compostable alternatives quickly enough before remaining foam manufacturing assets lose essentially all commercial and resale value entirely across nearly every market.
Gross Margin: 8-15%

Regulatory Timing Drives Contract Economics

Container demand behaves like an annuity tied to restaurant location count rather than to any single conversion event, since every operating restaurant continuously consumes packaging regardless of whether regulation forces a material switch that year. That structure gives suppliers with strong national chain relationships a predictable revenue floor even during periods without new regulatory activity, since existing locations keep ordering on a continuous replenishment cycle independent of any
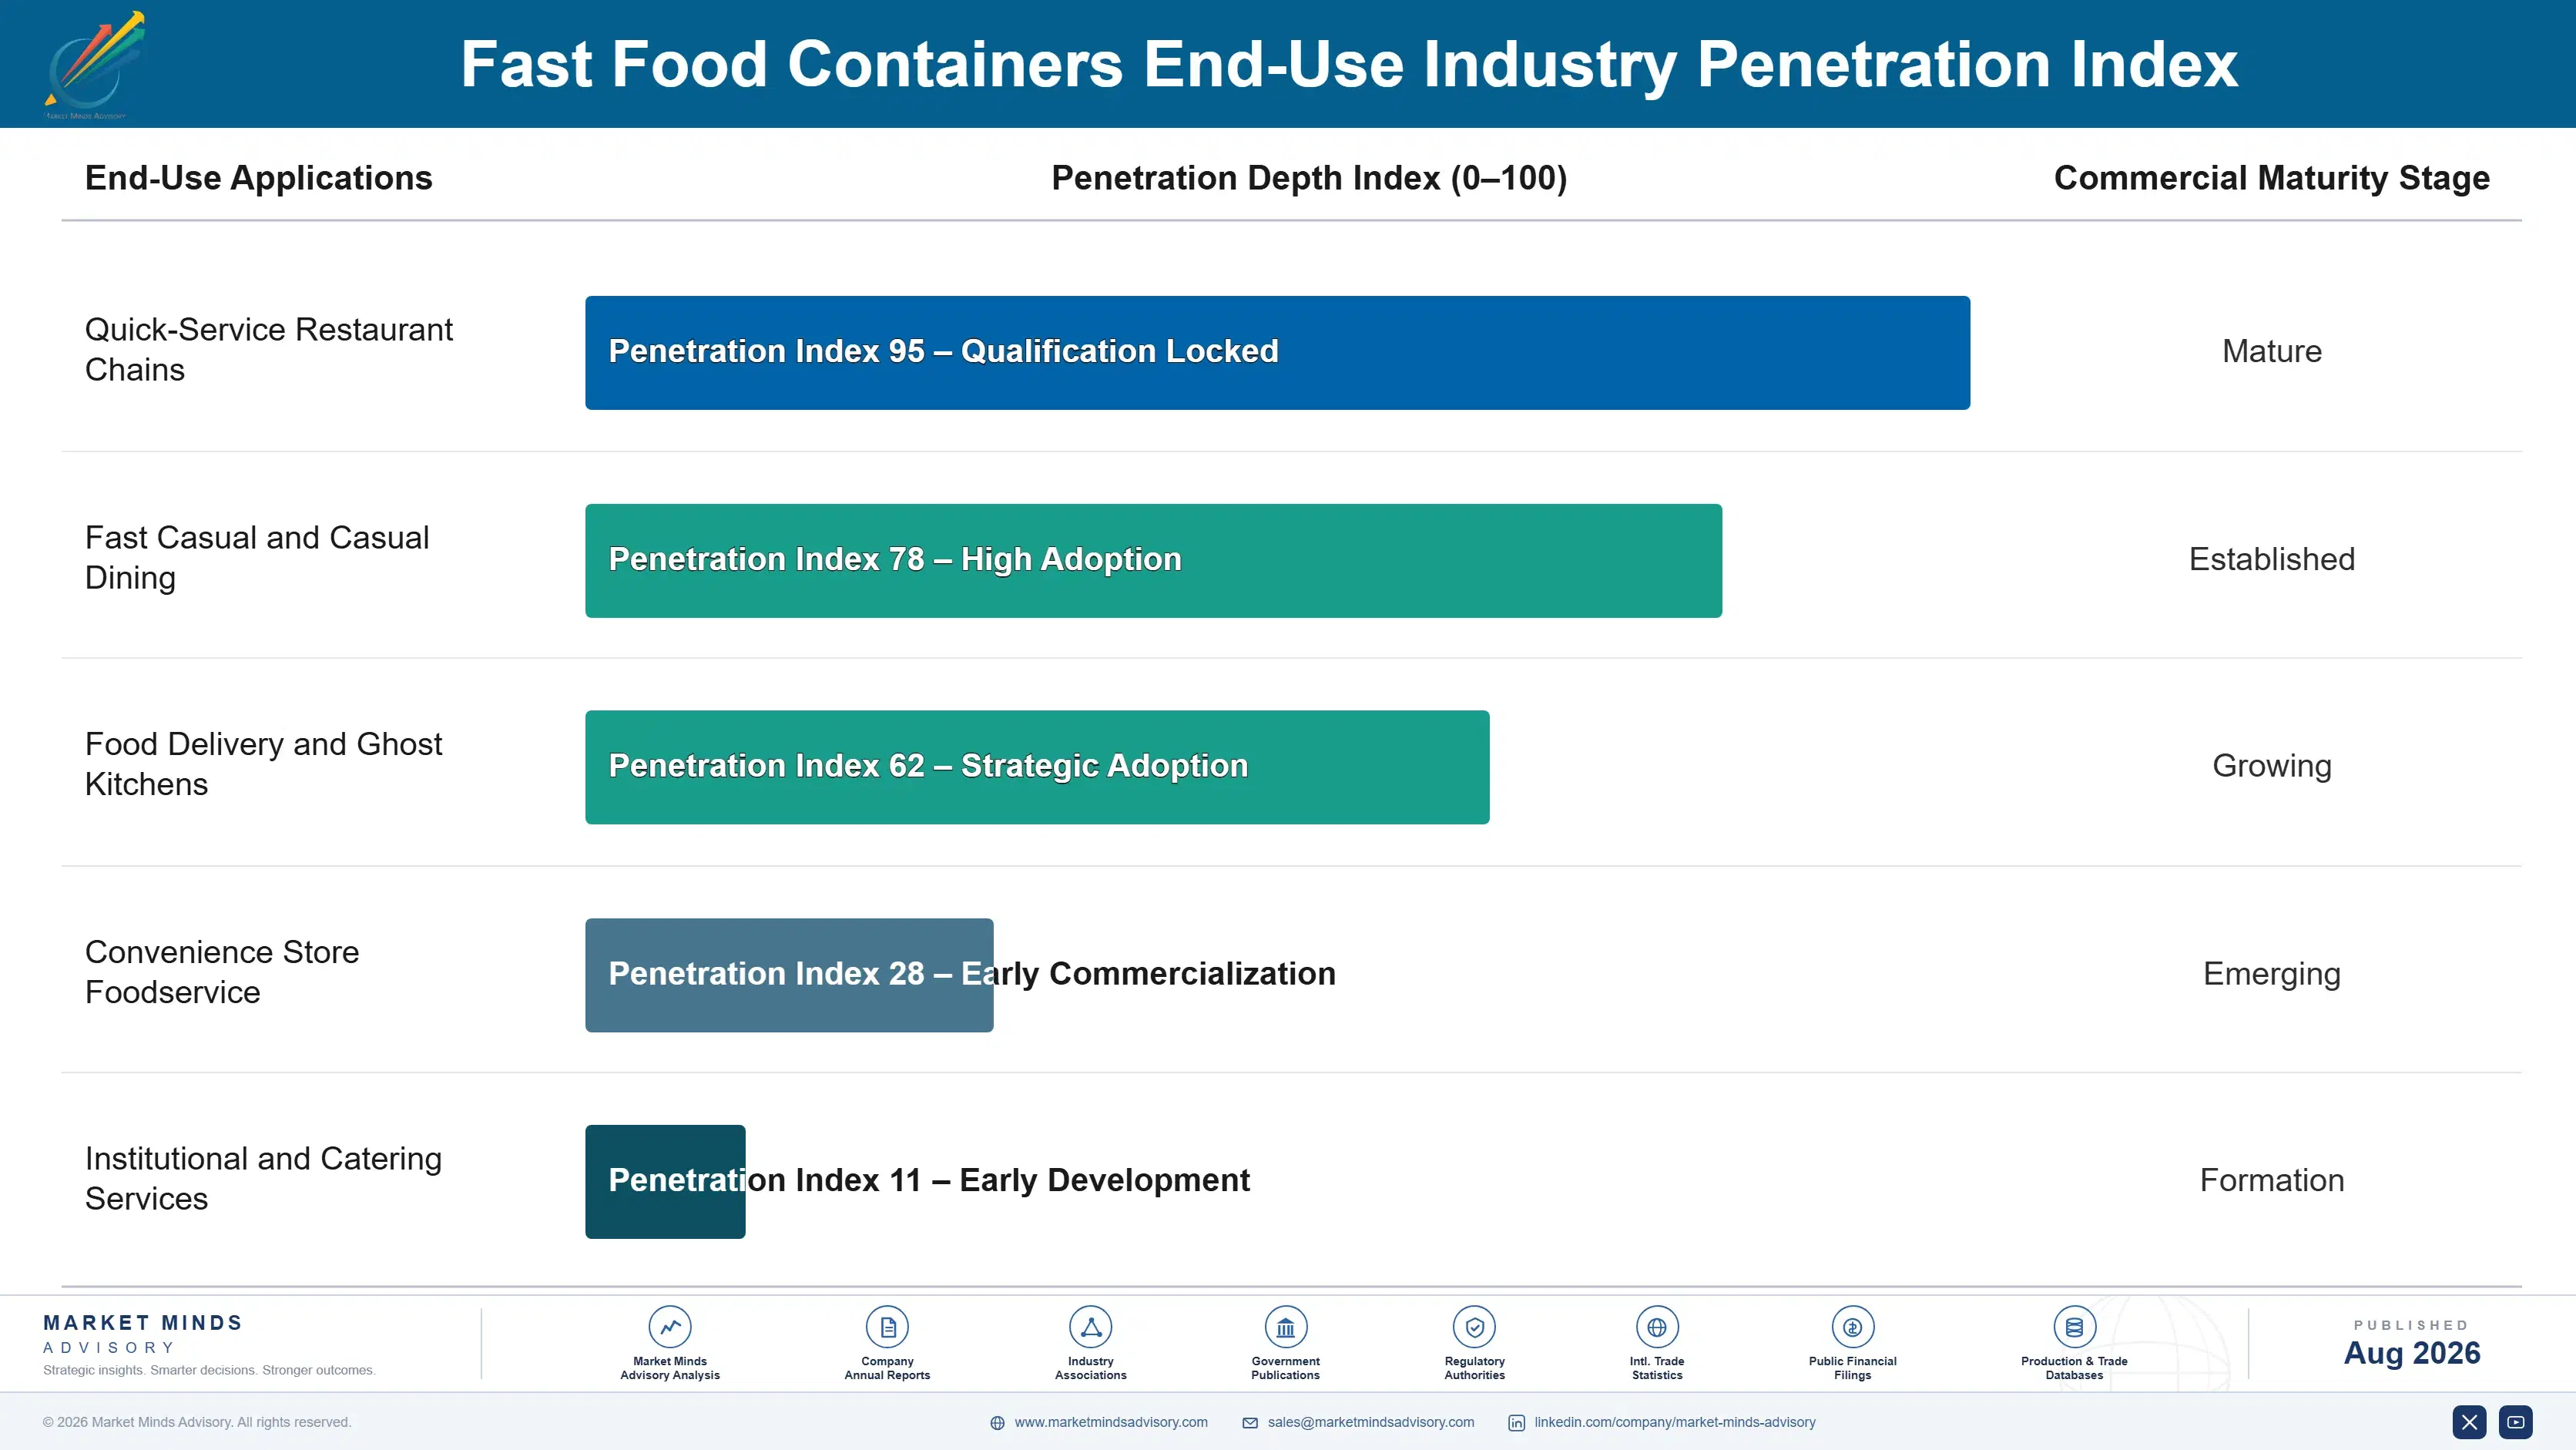
Adoption depth varies sharply by end-use vertical. Large national quick-service chains have adopted compostable and molded fiber specification almost universally on their highest-visibility formats, since brand risk from packaging controversy carries severe reputational consequences. Independent restaurants and smaller regional chains lag well behind, treating premium material conversion as optional rather than mandatory, partly because budget scrutiny is tighter and partly because brand risk is genuinely lower at smaller scale.

Buyer profiles have shifted generationally. Procurement decisions that once sat primarily with individual franchise operators now route through centralized corporate sustainability and procurement functions at larger chains, rewarding suppliers able to present integrated compliance data rather than relationship selling alone. Younger consumers increasingly treat visible packaging sustainability as a baseline brand expectation rather than a differentiator worth paying extra for.
fast-food-containers-market-end-use-penetration-index-1787300468995

MMA's Read on Foodservice Packaging

These are among the four positions where our research anticipates prominent divergence between winners and laggards over the coming forecast period. Each is grounded in the demand model, the regulatory perimeter, and the announced capacity pipeline.
01 / REGULATORY TIMING STRATEGY

Compostable certification speed will separate winners from scrambling followers

Regulatory deadlines create predictable demand spikes that reward suppliers who complete certification and build manufacturing capacity ahead of enforcement, rather than scrambling after mandates take effect across newly restricted jurisdictions. Chains facing hard compliance deadlines cannot wait for new capacity to come online, which means late-moving suppliers miss the premium pricing window entirely regardless of eventual product quality. Suppliers that invest in certification and capacity now, ahead of announced deadlines in major markets, will capture disproportionate share during each successive regulatory transition wave.
02 / DELIVERY FORMAT SPECIALIZATION

Delivery-optimized container engineering will define share gains through 2036

Delivery volume keeps settling at levels well above pre-pandemic dine-in patterns, and each order requires packaging engineered specifically for transit rather than simple dine-in serviceware repurposed for delivery use across most restaurant categories. Suppliers without proven leak-resistant and stackable designs increasingly lose bids among delivery-heavy chains, regardless of brand reputation built in conventional dine-in packaging over decades. Those investing in delivery-specific engineering now, ahead of competitors still focused on legacy formats, will capture disproportionate share as delivery volume keeps expanding.
03 / NATIONAL CONTRACT CONSOLIDATION

Chain-wide lock-in contracts will reward suppliers with proven scale

National quick-service chains increasingly consolidate packaging procurement into single or dual-vendor relationships rather than allowing franchise-level supplier selection, rewarding suppliers with proven national manufacturing scale and consistent quality across every single location nationwide. Suppliers without that scale cannot simply buy their way into these contracts quickly, since chains will not risk service disruption across thousands of locations on unproven regional suppliers. Incumbent suppliers with existing national relationships are positioned to capture a disproportionate share of ongoing material transition spending across the industry.
04 / COMPOSTING INFRASTRUCTURE RISK

Municipal infrastructure gaps will eventually force certification standard reform

Compostable containers frequently end up landfilled anyway because municipal composting infrastructure lags far behind certification standards, creating growing greenwashing exposure that regulators and consumer advocates are increasingly scrutinizing publicly across major markets. That gap is unsustainable politically, and certification bodies will likely tighten standards or require infrastructure partnerships as scrutiny intensifies over the coming years. Suppliers and chains investing now in genuine composting infrastructure partnerships will be far better positioned than those relying on certification labels alone to satisfy skeptical consumers.

Engagement Snapshot From the Field

A live engagement with an industry participant carrying material or product regulatory and market exposure ahead of a defining policy shift, showing how our research translates into a defensible multi-year portfolio strategy.
MARKET MINDS ADVISORY · CLIENT ENGAGEMENT SUMMARY
Fast Food Containers Producer Strategic Portfolio Review and Transition Roadmap 2026·Investment Scenario on Fast Food Containers Exposure Evaluation 2025-26
CLIENT PROFILE
A 220-location regional quick-service chain operating across the American Southeast, reporting approximately 310 million dollars in annual revenue, approached MMA after several municipal foam bans within its operating footprint forced an accelerated packaging conversion timeline the company had not originally budgeted for in its current fiscal year budget and capital allocation plan (client-reported, unverified by MMA).
STRATEGIC CHALLENGE
Leadership faced pressure to convert quickly without absorbing margin-destroying cost increases across a chain already operating on thin per-transaction profitability. Operations wanted the cheapest compliant option available immediately, while marketing wanted packaging that supported the company's broader sustainability positioning against larger national competitors already further along in their own conversion process.
MMA APPROACH
MMA benchmarked total delivered cost across five candidate suppliers, modeled margin impact under different material scenarios including molded fiber and compostable options, and assessed which suppliers offered manufacturing capacity positioned to meet the chain's compressed compliance timeline without introducing meaningful supply disruption risk across the chain's entire operating footprint and store network.
KEY FINDINGS
  1. The cheapest compliant option carried meaningfully longer lead times, creating supply risk given the chain's compressed compliance deadline across multiple municipalities within the chain's operating footprint.
  2. A mid-priced molded fiber supplier offered the best combination of cost, documented supply reliability, and sustainability positioning for marketing purposes across the chain's broader footprint.
  3. Locking a two-year contract rather than a one-year agreement secured meaningfully better pricing while still preserving flexibility to reassess (client-reported, unverified by MMA).
  4. Marketing testing showed customers responded more strongly to visible sustainability cues on packaging than to any price change communicated separately through in-store signage and social media.
CLIENT PROFILE
A 220-location regional quick-service chain operating across the American Southeast, reporting approximately 310 million dollars in annual revenue, approached MMA after several municipal foam bans within its operating footprint forced an accelerated packaging conversion timeline the company had not originally budgeted for in its current fiscal year budget and capital allocation plan (client-reported, unverified by MMA).
STRATEGIC CHALLENGE
Leadership faced pressure to convert quickly without absorbing margin-destroying cost increases across a chain already operating on thin per-transaction profitability. Operations wanted the cheapest compliant option available immediately, while marketing wanted packaging that supported the company's broader sustainability positioning against larger national competitors already further along in their own conversion process.
MMA APPROACH
MMA benchmarked total delivered cost across five candidate suppliers, modeled margin impact under different material scenarios including molded fiber and compostable options, and assessed which suppliers offered manufacturing capacity positioned to meet the chain's compressed compliance timeline without introducing meaningful supply disruption risk across the chain's entire operating footprint and store network.
KEY FINDINGS
  1. The cheapest compliant option carried meaningfully longer lead times, creating supply risk given the chain's compressed compliance deadline across multiple municipalities within the chain's operating footprint.
  2. A mid-priced molded fiber supplier offered the best combination of cost, documented supply reliability, and sustainability positioning for marketing purposes across the chain's broader footprint.
  3. Locking a two-year contract rather than a one-year agreement secured meaningfully better pricing while still preserving flexibility to reassess (client-reported, unverified by MMA).
  4. Marketing testing showed customers responded more strongly to visible sustainability cues on packaging than to any price change communicated separately through in-store signage and social media.
RECOMMENDED STRATEGY
Phase 1: Phase 1 (0 to 6 months): Convert locations facing the nearest regulatory deadlines first, prioritizing the municipalities with the shortest compliance windows remaining. Phase 2: Phase 2 (6 to 18 months): Complete chain-wide conversion to the selected molded fiber supplier, integrating sustainability messaging into store marketing materials. Phase 3: Phase 3 (18 to 36 months): Evaluate compostable upgrade options as certification costs decline and additional municipalities adopt comparable restrictions.
OUTCOME
The chain completed its regulatory conversion ahead of the compressed deadline without the margin erosion initially feared, and the two-year contract structure delivered meaningful savings versus the original single-year proposal. Customer sentiment tracking showed a measurable lift in sustainability perception following the conversion (client-reported, unverified by MMA).

Frequently Asked Questions

Foundational context covering the market sizes, CAGR, scope, country, region and competition that inform every finding below. This section is provided to cover basics and most often pre-purchase conversations, answered from the MMA Primary Research Dataset.

What is the current size of the Fast Food Containers Market?

The market reached an estimated 12.4 billion dollars in 2025. That figure reflects global revenue across paperboard, molded fiber, foam, plastic, foil, and compostable container materials.

How large will the Fast Food Containers Market be by 2036?

MMA projects the market will reach approximately 23.5 billion dollars by 2036 under the base case scenario. That represents roughly 1.79 times the 2026 market value.

What is the CAGR for the Fast Food Containers Market 2026 to 2036?

The base case CAGR is 6.0% annually across the full ten-year forecast period. Bull and bear scenarios run 7.3% and 4.7% respectively, reflecting regulatory timing uncertainty.

Which segment is growing fastest?

Compostable and bioplastic containers grow fastest at 9.8% CAGR, about 1.63 times the overall market rate. Corporate sustainability commitments and plastic bans are the primary driver.

Who are the major companies in the Fast Food Containers Market?

Huhtamaki, Pactiv Evergreen, Genpak, D&W Fine Pack, and Dart Container lead the category. Together they hold roughly 38% of container revenue on a consistent basis.

Which country is growing fastest?

India leads national growth at an estimated 9.2% CAGR, driven by its 2022 nationwide single-use plastic ban and expanding quick-service restaurant footprint. Conversion pressure keeps intensifying.

Report Segmentation Architecture

The full report scope spans multiple orthogonal segmentation dimensions, with cross-tabulated demand data provided for each dimension pair. Coverage extends further to regional breakdowns, trend trajectories, and the competitive detail needed to support segment-level decision-making.

By Container Material Type

  • Paperboard and Fiber-Based Containers
  • Molded Fiber Containers
  • Expanded Polystyrene Foam Containers
  • Rigid Plastic Containers
  • Aluminum Foil Containers
  • Compostable and Bioplastic Containers

By End-Use Industry

  • Quick-Service Restaurant Chains
  • Fast Casual and Casual Dining
  • Food Delivery and Ghost Kitchens
  • Convenience Store Foodservice
  • Institutional and Catering Services

By Commercial Dimension

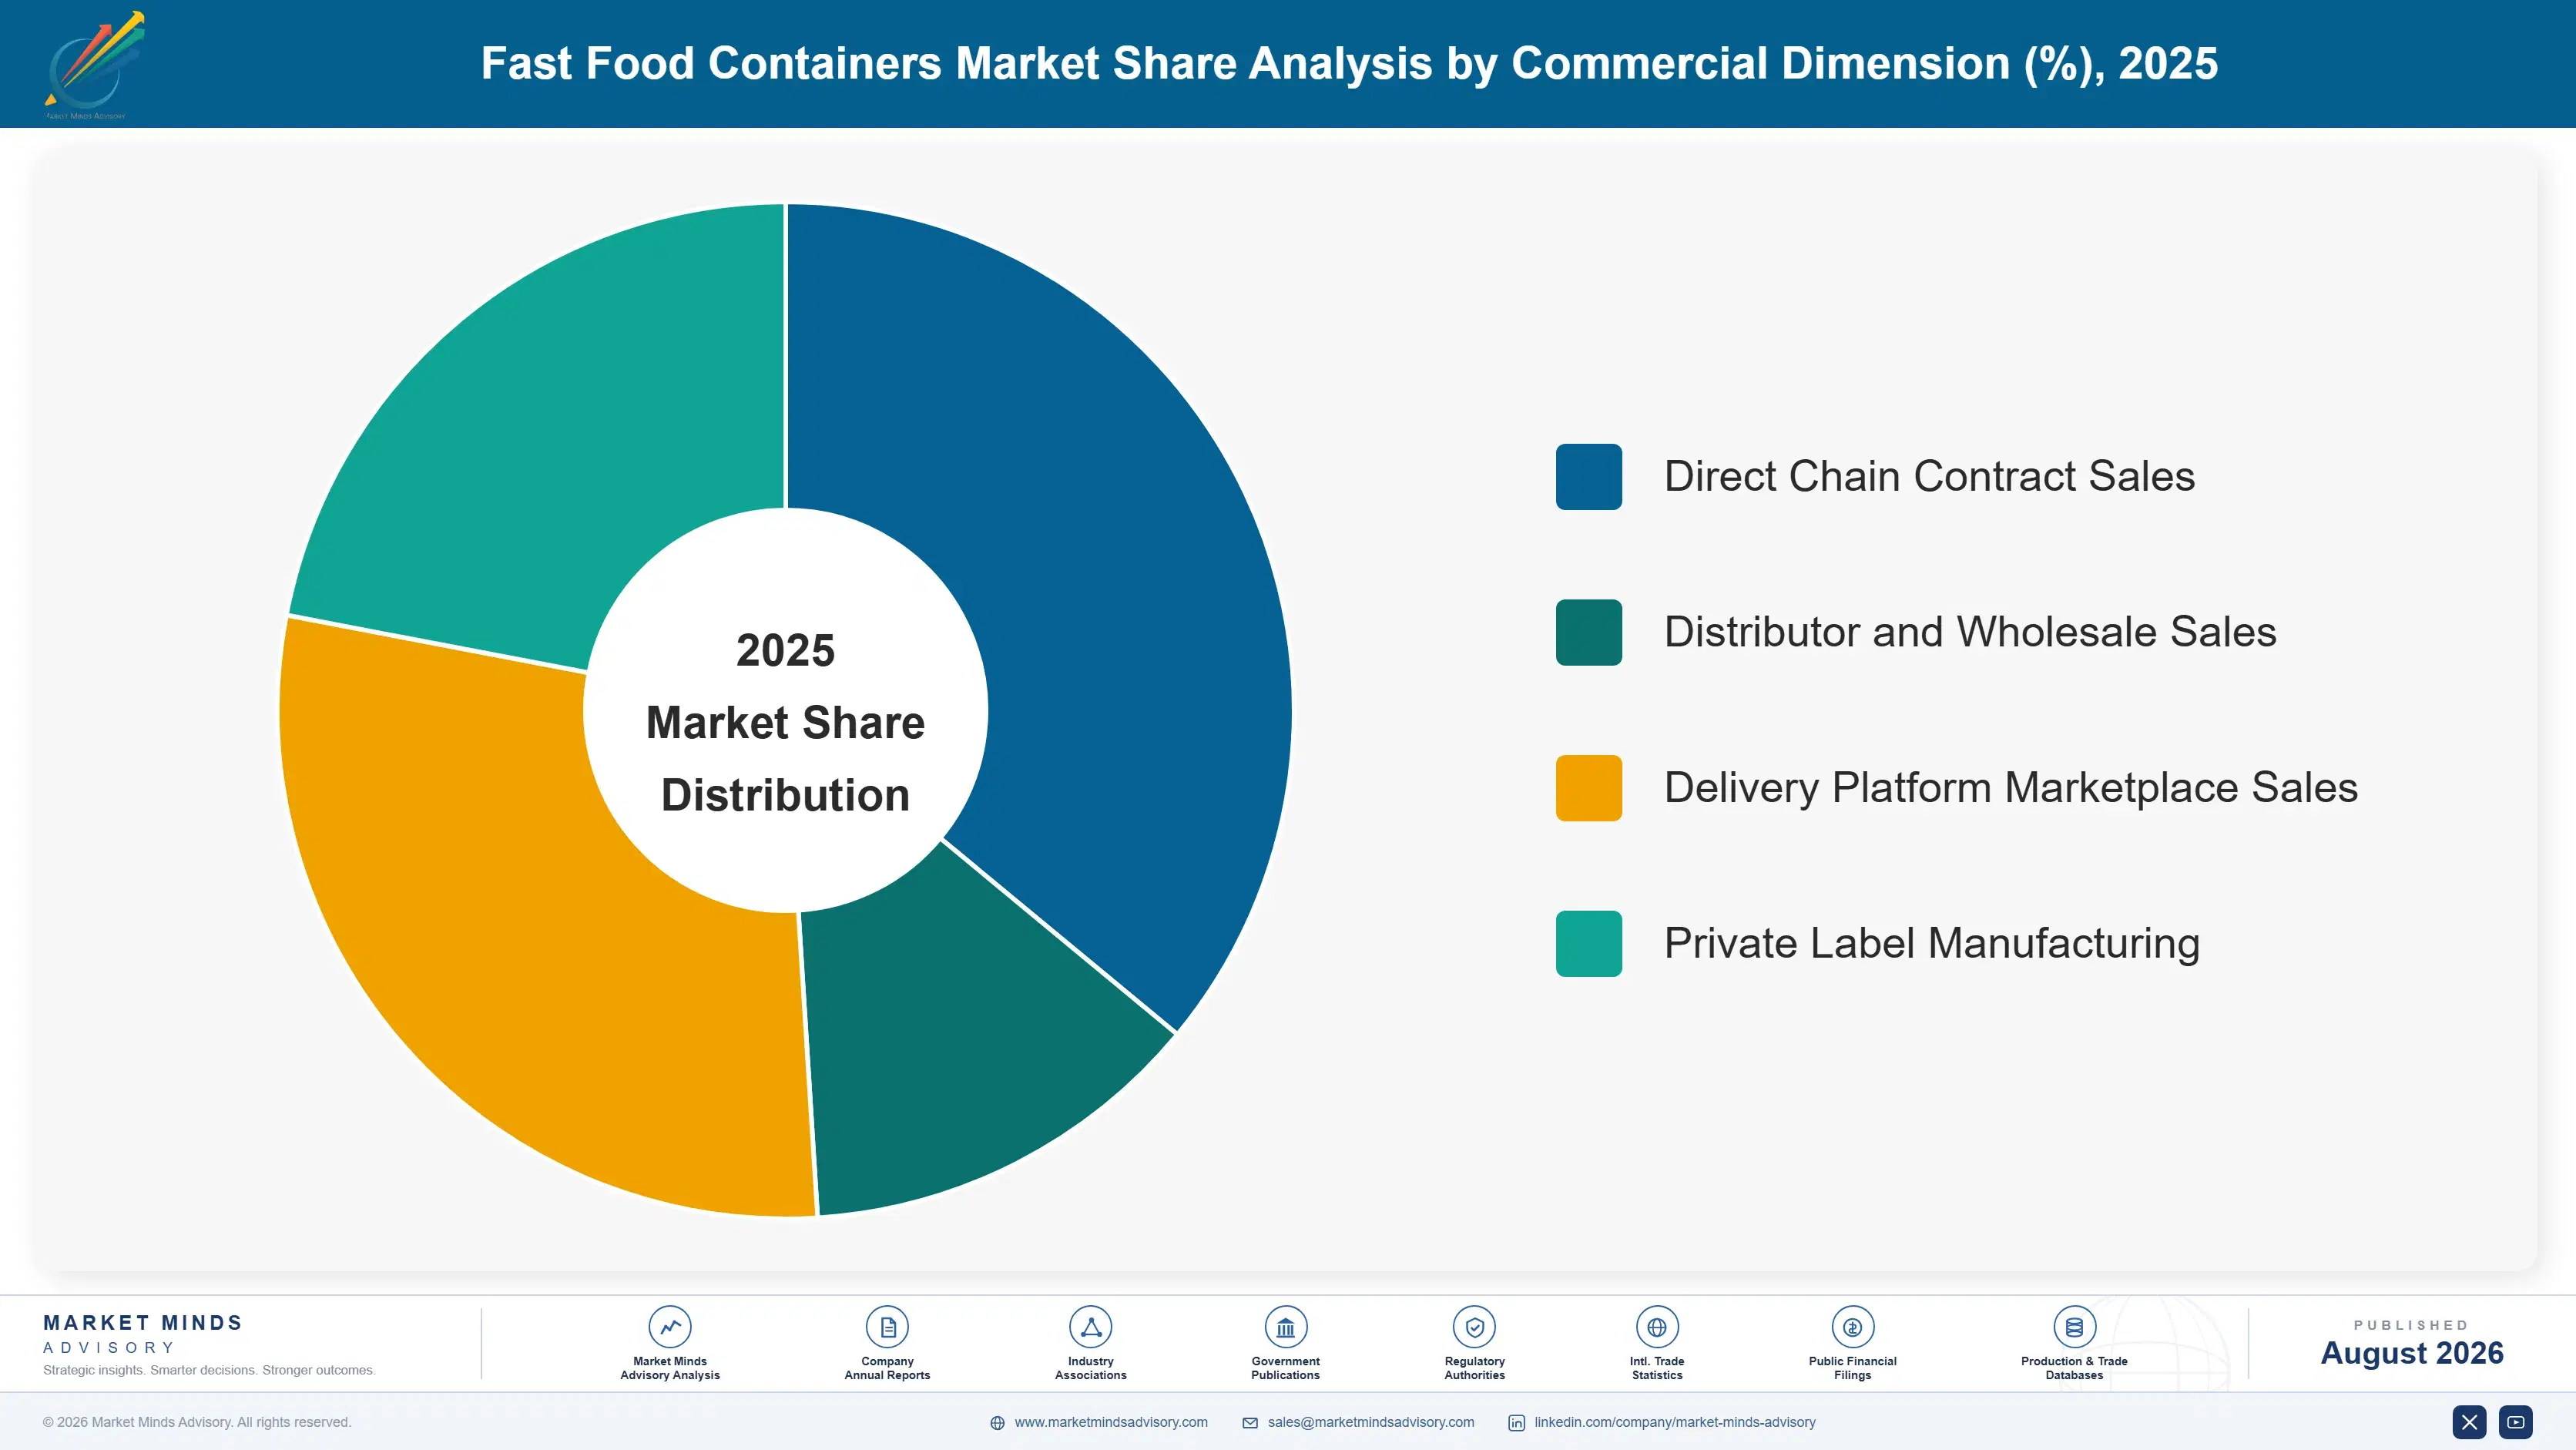
  • Direct Chain Contract Sales
  • Distributor and Wholesale Sales
  • Delivery Platform Marketplace Sales
  • Private Label Manufacturing

By Region

  • North America
  • Western Europe
  • East Asia
  • South Asia and Pacific
  • Latin America
  • Middle East and Africa
  • Eastern Europe

Scope, Methodology, and Coverage

Every figure in this report is reproducible from documented input assumptions. The scope below maps the historical period, the forecast horizon, the segmentation dimensions, and the countries covered, alongside the underlying primary and qualitative methodology.
Historical Period
2020 to 2025
Forecast Period
2026 to 2036
Base Year
2025 (USD billions; MMA Primary Research Dataset, August 2026)
Market Definition
The fast food containers market covers paperboard, molded fiber, expanded polystyrene foam, rigid plastic, aluminum foil, and compostable bioplastic containers used for packaging prepared food at quick-service and fast casual restaurants. It includes clamshells, cups, trays, wraps, and bags sold to chains and independent operators. Retail food packaging, industrial food processing packaging, and beverage-only containers are excluded.
Quantitative Units
USD billions (current prices); unit shipment volume where applicable
Segmentation Dimensions
By Container Material Type; By End-Use Industry; By Commercial Dimension; By Region
Regions Covered
North America, Western Europe, East Asia, South Asia and Pacific, Latin America, Middle East and Africa, Eastern Europe
Countries Covered
USA, China, Germany, France, UK, Japan, South Korea, India, Australia, Canada, Brazil, Mexico, Indonesia, Vietnam, Thailand, Malaysia, UAE, Saudi Arabia, South Africa, Nigeria, Turkey, Poland, Netherlands, Italy, Spain, Sweden, Switzerland, Argentina, Colombia, Singapore, and additional markets relevant to this sector
Key Companies Profiled
Huhtamaki Oyj; Pactiv Evergreen Inc.; Genpak, LLC; D&W Fine Pack LLC; Dart Container Corporation; International Paper Company; WestRock Company; Sabert Corporation; Berry Global Group, Inc.; Novolex Holdings, LLC; Anchor Packaging, LLC; Eco-Products, Inc.; BioPak Pty Ltd; Vegware Ltd; Detmold Group; Fabri-Kal Corporation; Georgia-Pacific LLC; Seda International Packaging Group S.p.A.; Solia SAS; Amcor plc
Quantitative Methodology
Primary survey, n=3,800 respondents, Q4 2025, six countries; demand-side model with trade association cross-validation
Qualitative Methodology
47 expert interviews, Q4 2025; applied to validate demand model assumptions, identify emerging dynamics, and assess competitive positioning
Report Format
PDF and XLSX data workbook (Word format preview document)
Publisher
Market Minds Advisory
Report Code
MMA-2026-PAC-104
Published
August 2026
Contact
sales@marketmindsadvisory.com | www.marketmindsadvisory.com

Purchase the full Fast Food Containers Market Report (2026 to 2036).

The full MMA Fast Food Containers report sizes the market across six material categories, five end-use industries, four commercial contracting models, and seven regions through 2036. It profiles twenty participants on a consistent basis of container revenue, scoring the top five on material transition speed, certification breadth, and national chain relationship depth. Scenario models quantify how regulatory ban expansion, delivery volume growth, and pulp price volatility move both demand and achievable pricing. The report also includes delivered cost modeling by material category, a regulatory deadline tracker across major markets, and a supplier displacement risk assessment built for chains, converters, and investors.
Six-segment material demand model through 2036
Regulatory ban and deadline tracker across markets
Compostable certification and competitive positioning assessment tool
Delivery-specific packaging design benchmarking dataset and analysis
Pulp and bioplastic feedstock cost sensitivity model
Supplier displacement risk scoring by material

Built For The People Who Decide

From boardroom strategy to bench-side execution, this report is read cover-to-cover by leaders shaping the next decade of their industry, turning demand scenarios, market dynamics and valuation benchmarks into decisions.
CXOs/ Presidents/ VPs/ Managers
M&A and Corporate Development
Strategy Teams and R&D Heads
Procurement and Product Directors
Regulatory and Compliance Leaders
Investor Relations and Equity Analysts