Market Minds Advisory
Factoring Market

Factoring Market: Buying Invoices, Not Lending Against Them

A factor buys the invoice rather than lending against it, which puts the credit assessment on the buyer instead of the seller and reaches companies no bank would ever approve for a loan.

Lead Analyst

Published

September 2026

Make Smarter Decisions with Customized Research Insights

Request a free sample report and evaluate market opportunities, growth trends, and competitive dynamics relevant to your business needs.

2025 MARKET VALUE$48.0BMarket Size 2025
2036 FORECAST VALUE$103.1BBase Case , 2026 to 2036
CAGR 2026 TO 20367.2 %Bull 8.4% / Bear 6.0%
INCREMENTAL OPPORTUNITY$51.7BNet 10- year value creation
EXPANSION MULTIPLE2.00x2036 value over 2026 base
Strategic Levers
M&A Pipeline
Regional Outlook
Country Rankings
Competitive Intelligence
Segmental Deep-dive
Call-Us : 91 93563 13602

Executive Snapshot and Market Trajectory

The legal structure carries everything. A factor purchases the receivable outright rather than lending against it, so the credit question becomes whether the buyer will pay rather than whether the seller deserves credit at all. A bank asks the opposite question about them entirely.
Western Europe holds 30% of value, above the usual regional band, because factoring penetration relative to output there exceeds anywhere else by a wide margin. Reverse factoring and supply chain finance grows at 10.8%, half again the market rate of 7.2%, as large buyers extend payment terms and then fund their own suppliers back to earlier settlement. Everybody in that arrangement gets something they actually wanted, which explains a good deal of the pace.
Concentration sits at just 21%, unusually low, since bank-owned factoring arms and independents compete in every market without any of them holding decisive scale. Trade credit insurance capacity is the hidden constraint: roughly 74% of non-recourse volume sits behind cover, so insurer appetite sets factor appetite whether factors like that arrangement or not. Nobody much enjoys discovering that their own capacity belonged to somebody else entirely all along here.
Market Definition
The market covers revenue earned by providers of receivables purchase and receivables finance facilities, spanning recourse factoring, non-recourse factoring, invoice discounting and confidential facilities, reverse factoring and supply chain finance, export and cross-border factoring, and selective and spot invoice finance. Revenue comprises service fees on assigned turnover and discount charges on funds advanced. Trade credit insurance premiums, asset-based lending against inventory or equipment, commercial lending, and merchant cash advances are excluded.
Base Year Value
$48.0B in 2025 (MMA Primary Research Dataset, August 2026)
Forecast Period
2026 to 2036, eleven discrete annual values
CAGR
7.2% base case. Bull 8.4%. Bear 6.0%.
Fastest Growth Segment
Reverse Factoring and Supply Chain Finance: 10.8% CAGR
Fastest Growth Country
India: 9.2% CAGR
Fastest Growth Region
South Asia and Pacific: 9.4% CAGR
Largest Region
Western Europe: 30% of 2025 global value
Market Leaders
BNP Paribas Factor, Credit Agricole Leasing and Factoring, Deutsche Factoring Bank, Intesa Sanpaolo, Banco Santander. Source: MMA Analysis based on disclosed factoring and receivables finance turnover, company annual reports 2025.
Primary Survey
n=3,800 procurement and R&D decision-makers, Q4 2025, six countries
Methodology
Demand-side build-up, cross-validated against public data, 47 expert interviews

Factoring Market Forecast Scenarios

factoring-market-size-forecast-scenario-1787913389928
Growth from 2020 to 2025 ran at 6.0% and rate movement explains a great deal of it. Discount charges reprice against base rates almost immediately while funding costs lag, so the rises through 2022 and 2023 widened factor margins considerably before anything about volume changed. Reverse factoring expanded fast across large buyer programmes. The 2020 credit insurance withdrawal briefly removed non-recourse capacity across whole sectors.
The 7.2% base case rests on three mechanisms. Reverse factoring keeps spreading as large buyers extend supplier terms and fund the gap themselves. Export factoring grows on cross-border trade where the seller cannot assess a foreign buyer alone. And digitised onboarding keeps reaching smaller companies that were previously uneconomic to serve at the ticket sizes involved. None of the three requires rates to move in any particular direction at all.
The bull case at 8.4% assumes late payment regulation across European markets pushes more suppliers toward funded settlement while embedded finance channels reach small businesses through accounting platforms. The bear case at 6.0% is a credit cycle turning: insurer limits withdraw, non-recourse capacity contracts sharply, and factor losses on recourse books rise at exactly the same moment.

The Buyer's Credit, Not The Seller's

A factor buys the receivable. That sounds like a technicality and it is the entire product. Because ownership transfers, the factor assesses whether the debtor will pay rather than whether the client is creditworthy, which is how a young company with no balance sheet funds itself against invoices owed by a large dependable buyer. A bank looking at the same company sees no security and declines.
FIVE-FIRM CONCENTRATION21%Share of category revenue held by the largest factoring providers
SERVICE FEE RATE1.2%Charge applied against client turnover regardless of any drawdown
ADVANCE RATE85%Proportion of invoice value funded at the point of purchase
DEBTOR PAYMENT DAYS58Time buyers take before settling a purchased invoice
CREDIT INSURED SHARE74%Non-recourse volume sitting behind trade credit insurance cover
EUROPEAN VOLUME SHARE61%Global factoring turnover originated across the European markets
Pricing runs on two lines that behave quite differently. A discount charge accrues on funds advanced and reprices against base rates almost immediately. A service fee of around 1.2% applies to assigned turnover and is paid whether the client draws funds or not. That second line is the sticky revenue, and it is why factoring economics held up through the rate rises better than most lending businesses managed.
Recourse and non-recourse divide the risk and the pricing. Under recourse the client absorbs a debtor default; under non-recourse the factor does, and roughly 74% of that volume sits behind trade credit insurance rather than on the factor's own book. That makes insurer appetite the binding constraint on capacity. When cover was pulled across sectors in 2020, non-recourse facilities disappeared regardless of what factors wanted.
"Every factor will tell you they underwrite the debtor. Most of them are actually underwriting an insurer's willingness to keep a limit open, and those two things feel identical right up until the morning they stop being identical."
Director, Working Capital Finance Practice · MMA Receivables Finance and Working Capital Practice · August 2026

Market Trends

Large Buyers Fund Their Own Extended Payment Terms

Reverse factoring lets a buyer stretch supplier payment terms to 90 or 120 days while offering those suppliers early settlement funded against the buyer's own credit rating. The buyer improves working capital, the supplier gets paid sooner and the funder earns on the spread between the two credit qualities. That segment grows at 10.8%. Accounting treatment has drawn regulatory attention, since the arrangements can look uncomfortably close to borrowing without appearing as debt. Nobody much wants to be the funder holding a programme when the accounting rules do finally change.
Market Impact: Addresses 58 day payment cycles

Accounting Platforms Become Origination Channels For Invoices

Invoice data already sits inside the accounting software small companies use daily, which makes verification and eligibility checking far cheaper than any manual onboarding process ever managed. Facilities that were uneconomic below a certain turnover now work. Factors partnering with platform providers reach clients they could never have acquired directly, though the platform owns the relationship and prices its access to it accordingly, which changes the economics considerably. The funder supplies capital and the platform supplies the customer, and only one of those two things is genuinely scarce out here.
Market Impact: Grows export factoring at 8.4%

Market Opportunities and Growth Drivers

Late Payment Pressure Pushes Suppliers Toward Funded Settlement

Average debtor payment runs around 58 days across European markets and considerably longer in some sectors, and late payment regulation has tightened without changing behaviour as much as legislators expected. Suppliers who cannot wait turn to funded settlement instead. That mechanism drives volume independently of economic growth, because it responds to payment behaviour rather than to trading activity, which is why factoring often grows when general lending contracts. A supplier who cannot wait 58 days has a problem that no interest rate cut anywhere ever solves for them at all.
Market Impact: Constrains 74% of non-recourse volume

Cross-Border Trade Needs Someone To Assess Foreign Buyers

Export factoring grows at 8.4% because an exporter generally cannot assess a buyer in another jurisdiction, cannot easily pursue that buyer through unfamiliar courts, and will not extend open account terms without protection. Correspondent factor arrangements place a local factor alongside the debtor to handle collection and credit assessment. That two-factor structure is the actual product, and it has no substitute anybody has yet built. Digital platforms have improved the mechanics of arranging it considerably, without replacing the local factor who actually has to knock on the debtor's own door.
Market Impact: Produces losses above 50 million

Market Restraints and Challenges

Insurer Appetite Sets Non-Recourse Capacity, Not Factors

Around 74% of non-recourse volume sits behind trade credit insurance, so factor capacity depends on insurer limits rather than on factor balance sheets. Root cause is that few factors will hold concentrated debtor risk unhedged. Commercial impact showed itself in 2020 when limits were withdrawn across sectors and facilities vanished within weeks. Mitigation involves retained risk tranches and captive structures, both of which require capital that most factors would rather deploy elsewhere. A factor discovering the limit has gone learns it from a portal notification rather than from a conversation.
Market Impact: Grows reverse factoring at 10.8%

Fraud Risk Concentrates In A Few Spectacular Failures

Factoring exposure to invoice fraud is real and occasionally enormous, since a fabricated receivable looks identical to a genuine one until the debtor is asked to confirm it. Root cause is verification cost, which factors compress to keep facilities economic. Commercial impact is that losses arrive rarely and severely rather than steadily. Mitigation runs through debtor confirmation, payment behaviour analytics and platform-sourced invoice data that is considerably harder to fabricate. One bad book can cost a provider rather more than several profitable years ever managed to earn back for it.
Market Impact: Reaches clients below 2 million turnover
3 additional market trends, 2 additional growth drivers, and 4 additional restraints and challenges are covered in the full report. Contact sales@marketmindsadvisory.com to access the complete intelligence.

Segment CAGR and Growth Architecture

Segmentation follows facility type, since risk allocation, pricing structure and client profile all differ by facility rather than by client industry. Six categories cover the market without overlap. Client sector, facility size and origination channel are treated as separate commercial dimensions throughout this report rather than as segmentation logic in their own right entirely.
factoring-market-market-share-analysis-1787913390463

Reverse Factoring and Supply Chain Finance

Buyer-led programmes grow at 10.8%, half again the market rate of 7.2%, by allowing a large buyer to extend supplier terms to 90 or 120 days while offering those suppliers early settlement priced against the buyer's own credit standing rather than their own. Everybody involved gains something, which is why adoption has moved quickly. Accounting treatment remains the open question, since arrangements that function as borrowing without appearing as debt have attracted exactly the regulatory attention anybody would have predicted. Funders holding these programmes are exposed to a treatment question they cannot influence, since the buyer decides the structure and the funder simply supplies the capital behind whatever gets decided.
CAGR 10.8%

Selective and Spot Invoice Finance

Single invoice and selective facilities grow at 8.4% because clients increasingly want funding against specific receivables rather than committing a whole sales ledger under a long facility agreement. Digitised verification made the smaller ticket sizes economic for the first time. Pricing per transaction is higher than whole-turnover factoring and the revenue is considerably less predictable, since a client using the facility twice in a year generates nothing at all in the months between those transactions. Providers who build cost structures around expected recurring volume find that selective clients behave nothing like whole-turnover ones, and the operational overhead of an idle facility does not reduce itself in the quiet months either.
CAGR 8.4%
Full segment breakdown across 6 segments available in the complete report.

Regional Architecture and Country Demand Map

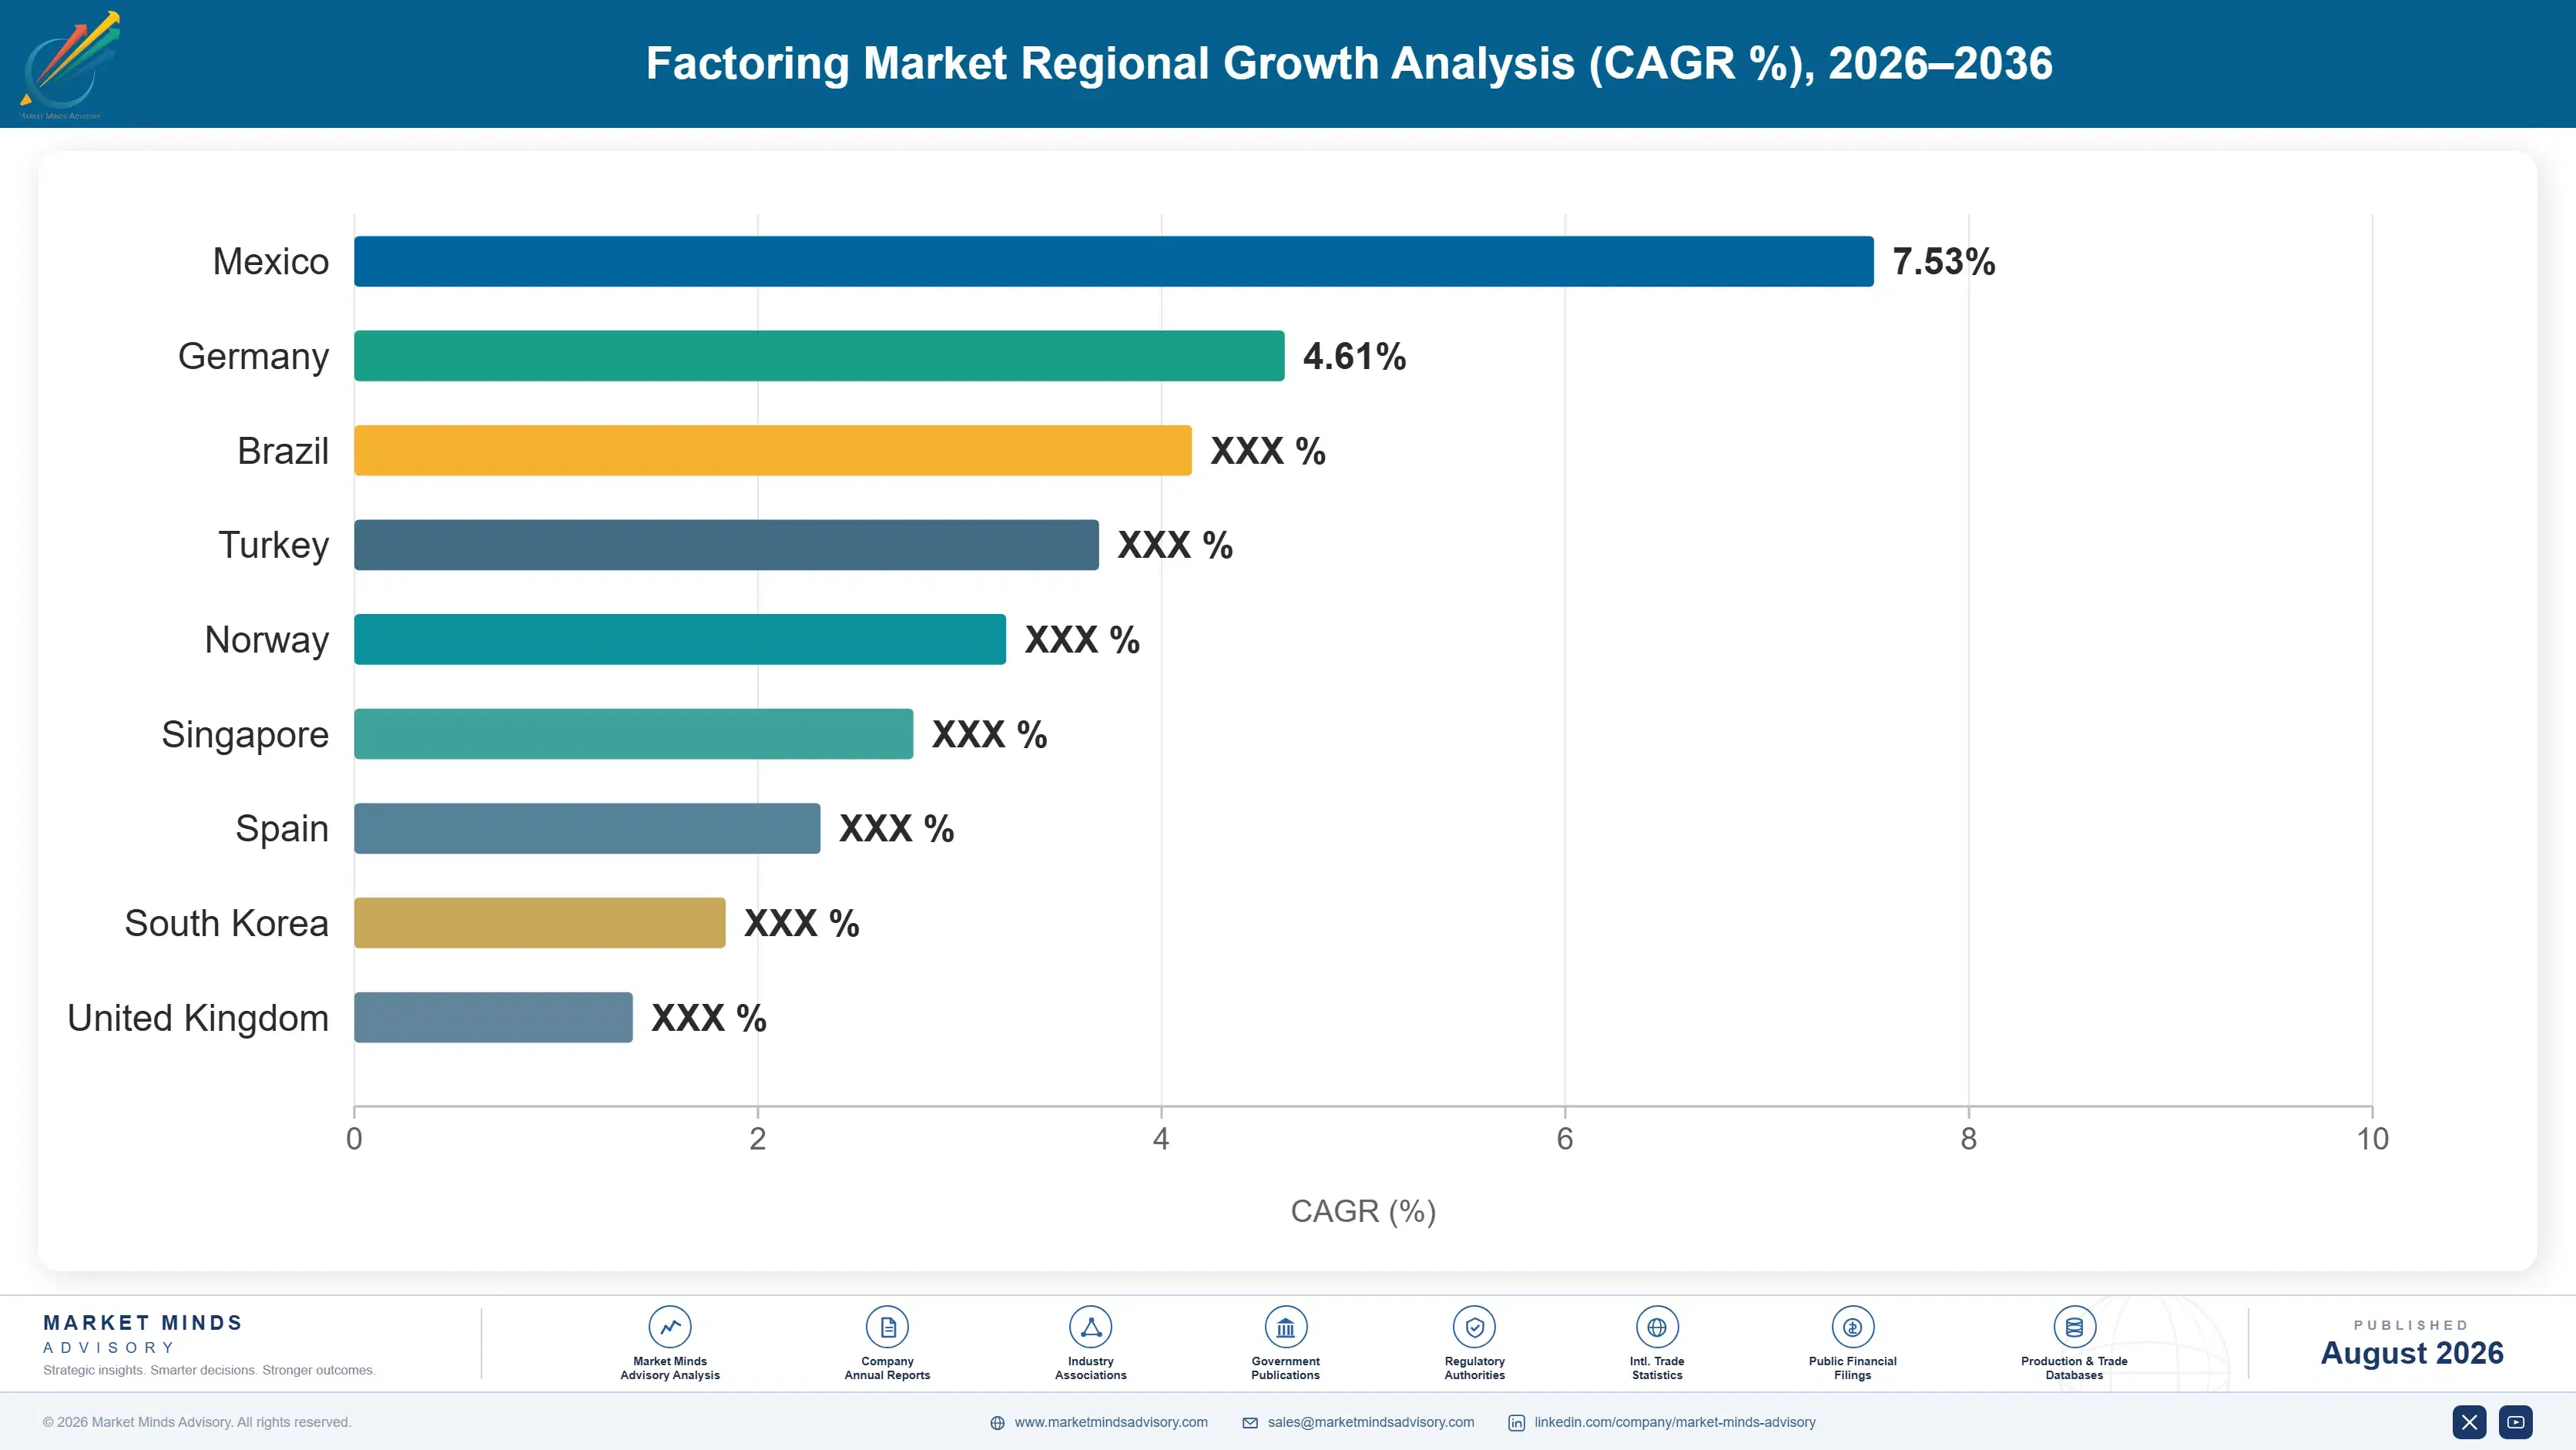
Geography follows factoring penetration relative to economic output rather than economy size, and those two measures diverge more sharply here than in almost any other financial services category anywhere. A country's factoring volume tells you remarkably little about the revenue that is actually earned on it.

North America

Share sits at 20%, below the standard regional band, because American mid-market companies use asset-based lending against a borrowing base rather than selling receivables outright, and that substitution is genuine rather than a modelling artefact. Factoring here concentrates in trucking, staffing, textiles and government contracting, where invoice quality is strong and borrower balance sheets are thin. Independent factors hold more of the market than bank-owned providers do, which is unusual internationally and reflects how banks approached the product. Reverse factoring programmes run by large retailers and manufacturers are substantial and growing, and they represent the part of the American market that most resembles European practice in structure if not in the language used to describe it.
Share: 20% | CAGR: 6.4% (2026 to 2036)

Western Europe

Share sits at 30%, above the standard regional band, because factoring penetration relative to output across France, Italy, Germany, Spain and the United Kingdom exceeds anywhere else by a considerable margin. That justification reflects genuine market structure rather than any assumption. Bank-owned factoring arms dominate, distributing through branch networks that reach mid-market companies directly. Late payment culture in southern Europe sustains demand independently of the credit cycle, and regulatory attention to payment terms has moved slowly. Reverse factoring programmes run by large retailers and industrial buyers have expanded quickly across the region, and accounting treatment of those arrangements has drawn more supervisory attention here than anywhere else, which has slowed some buyers considerably.
Share: 30% | CAGR: 5.6% (2026 to 2036)
Regional intelligence for 5 additional markets available in the complete report: East Asia, South Asia and Pacific, Latin America, Middle East and Africa, Eastern Europe. Contact sales@marketmindsadvisory.com.
factoring-market-country-cagr-analysis-1787913390977

Fee Income Beats Spread Income

Service fees run 1.2% of turnover regardless of drawdown, advance rates sit at 85%, reverse factoring grows at 10.8% and 74% of non-recourse volume depends on insurers. Four levers work on fee structure, buyer-led origination, insurance dependency and verification cost rather than on the advance rates that everybody in this business always argues about.

Protect The Service Fee Line Above Everything

The service fee of around 1.2% on assigned turnover is paid whether a client draws funds or not, which makes it the only genuinely predictable revenue in the business and the first thing competitors attack when they want to win an account. Discount income moves with base rates and nobody controls that. Providers who discount the service fee to win volume are trading away the revenue that survives a rate cycle. Rate cycles turn over and the fee line does not, which is really the entire point of it here.
Market Impact: Defends the 1.2% service fee on assigned turnover

Originate Through Buyers Rather Than Sellers

A single reverse factoring programme with one large buyer delivers access to hundreds of suppliers at one acquisition cost, against the alternative of pursuing those suppliers individually and underwriting each one separately. That segment grows at 10.8%. The buyer relationship is harder to win and considerably harder to lose once established. Providers still acquiring clients one supplier at a time are paying many times the acquisition cost for equivalent volume. The buyer negotiates just once and several hundred separate suppliers then arrive attached to that one single conversation soon afterwards.
Market Impact: Enrols 300 suppliers under a single buyer programme

Reduce Dependence On Insurer Limits Deliberately

Roughly 74% of non-recourse volume sits behind trade credit cover, which means capacity contracts whenever insurers reduce appetite, as happened across whole sectors in 2020 with no warning worth the name. Retained first-loss tranches and captive arrangements cost capital and remove the dependency. Providers who can keep writing when the market withdraws cover pick up clients at precisely the moment those clients have nowhere else at all to go. Capacity that somebody else can simply revoke by email on a Tuesday morning is not really any kind of capacity at all anyway.
Market Impact: Reduces dependence on 74% of insured volume today

Take Invoice Data From The Source System

Verification cost is what makes small facilities uneconomic, and invoices drawn directly from a client's accounting platform or from an electronic invoicing mandate are cheaper to verify and considerably harder to fabricate than documents a client submits. That lowers the minimum viable facility size to around 2 million in client turnover. It also reduces exposure to the fraud losses that arrive rarely and then run into tens of millions. An invoice pulled from a ledger the client did not control is a different object entirely from one they typed and emailed over.
Market Impact: Lowers viable facilities to 2 million in turnover

Who Controls the Margin Pool

Measured on disclosed factoring and receivables finance turnover, the five largest providers hold a CR5 of just 21%, which is remarkably low and reflects a market where bank-owned arms compete market by market without any of them building international scale. BNP Paribas Factor and Credit Agricole Leasing and Factoring carry the deepest European positions, Deutsche Factoring Bank holds strong German mid-market depth, and Intesa Sanpaolo and Banco Santander hold substantial domestic franchises. Nobody here has assembled the international scale that other financial services categories take entirely for granted.
Two contests run in parallel. Whole-turnover factoring competes on service fee pricing and facility terms, where bank distribution reach matters most. Reverse factoring competes for large buyer programmes, where balance sheet capacity and platform capability decide outcomes. Very few providers compete convincingly in both, because the capabilities involved have almost nothing in common.

Pressure builds from platform-based originators reaching small clients through accounting software at acquisition costs traditional providers cannot approach. Rankings shift toward whoever holds the large buyer programmes rather than the largest client counts. Client count has stopped being a useful measure of anything much in this business.
factoring-market-company-positioning-matrix-1787913391549

Competitive Moat and Risk Dimensions

BNP PARIBAS FACTOR

Moat: Cross-Border Correspondent Network Depth

Operating factoring capability across multiple European markets under one group allows the provider to handle both sides of a cross-border facility internally rather than through correspondent arrangements with unfamiliar counterparties. Exporters value that considerably, because collection and debtor assessment in the buyer's own jurisdiction is the part they cannot do themselves. Assembling equivalent multi-market presence takes years.
BNP PARIBAS FACTOR

Risk: European Concentration Through Credit Cycles

Deep European positions mean the book concentrates in economies that move together through a downturn, and factoring losses arrive precisely when insurers are reducing limits and client failure rates are climbing. Geographic diversification across correlated markets provides considerably less protection than the map suggests it should.
CREDIT AGRICOLE LEASING AND FACTORING

Moat: Branch Distribution Into Mid-Market

Distributing factoring through an established retail and commercial branch network reaches mid-market companies at an acquisition cost that independent providers cannot match, since the relationship already exists and the credit conversation happens with somebody the client already banks with. That channel advantage is genuine and durable. Independents spend heavily on acquisition to reach the same companies with a colder proposition.
CREDIT AGRICOLE LEASING AND FACTORING

Risk: Platform Origination Bypasses Branches

Accounting platform integrations reach small clients inside the software they already use, which is a shorter path than any branch conversation and reaches companies below the size a branch would bother pursuing. That channel is growing quickly and the platform owner, not the funder, controls the client relationship and prices access to it.

Players Tracked

Prominent Players

BNP Paribas Factor
Credit Agricole Leasing and Factoring
Deutsche Factoring Bank
Intesa Sanpaolo
Banco Santander

Other Key Players

HSBC
Barclays
Lloyds Bank Commercial Finance
NatWest
Societe Generale Factoring
UniCredit Factoring
Mizuho Factors
Bank of China
Ping An Bank
Nordea Finance
KBC Commercial Finance
Bibby Financial Services
eCapital
Triumph Financial
Close Brothers Invoice Finance

Recent Developments

FEBRUARY 2025

Accounting platform launches embedded invoice finance across small business base

An accounting software provider launched embedded invoice finance within its small business product, with funding supplied by a partner institution. This was a commercial partnership rather than any acquisition, and the platform retained ownership of the client relationship and the pricing of access to it.
Signal: Origination is moving to whoever owns the software rather than to whoever actually holds the funding capital.
JUNE 2025

Trade credit insurer reduces sector limits across construction supply chains

A trade credit insurer reduced or withdrew cover limits across construction sector debtors in several European markets. This was an underwriting decision rather than any market exit, and non-recourse facilities dependent on those limits were reduced or converted to recourse terms within a matter of weeks.
Signal: Insurer appetite decides factor capacity far more directly than any factor's own balance sheet ever does.
OCTOBER 2025

Manufacturer extends supply chain finance programme to tier two suppliers

A large manufacturer extended its supply chain finance programme beyond direct suppliers to tier two participants, funded against its own credit rating. This was an organic programme expansion rather than any transaction, and it added several hundred participating suppliers under one single existing arrangement instead.
Signal: One buyer relationship delivers supplier access that would otherwise cost years of direct acquisition effort and spend.

Funding, Cover, Verification

Three costs sit against factoring revenue. Cost of funds on advanced balances, trade credit insurance premium on non-recourse volume, and operational cost covering verification, collections and credit assessment together account for 61 to 74% of gross revenue at a typical provider. Funding comes from parent bank treasury for bank-owned arms and from securitisation or wholesale facilities for independents, and that difference decides a great deal about relative pricing power.
The rate cycle worked in the industry's favour and then stopped. Policy rates across advanced economies rose sharply through 2022 and 2023, which IMF data documents, and discount charges repriced against base rates immediately while funding costs lagged behind. Margins widened considerably. BNP Paribas Annual Report 2024 disclosures describe the resulting specialised finance performance. As rates settled, that advantage reversed and competitive pricing pressure returned quickly.

Exposure divides by funding source rather than by scale. Bank-owned providers draw on parent treasury at internal transfer pricing and carry a cost advantage independents cannot close through any amount of operational efficiency. Independents funding through securitisation face spread widening exactly when credit conditions deteriorate and client failure rates rise. That combination is why independent factors fail in downturns while bank-owned arms merely shrink.
factoring-market-cost-volatility-analysis-1787913391746

Diversify funding beyond a single securitisation programme

Independent providers funding through one securitisation face spread widening at precisely the moment client failures rise, which is the combination that ends businesses rather than merely straining them. Multiple committed facilities across different investor types cost more in undrawn fees continuously. They remove the single dependency that has closed independent factors in every previous downturn.

Retain first-loss risk instead of insuring everything

Trade credit cover on around 74% of non-recourse volume means capacity disappears when insurers withdraw, as happened without warning across whole sectors in 2020. Holding a retained first-loss tranche costs capital and requires genuine underwriting capability internally. It allows a provider to keep writing business when competitors cannot, which wins clients at their most desperate moment.

Push verification cost onto source system data

Manual invoice verification is what makes small facilities uneconomic and what leaves the largest fraud exposure open. Drawing invoice data directly from accounting platforms or electronic invoicing mandates cuts that cost substantially and makes fabrication considerably harder. Integration work is real and platform partners charge for access. The economics improve at every facility size, not only the smallest ones.

Portfolio Architecture for Margin Defence

Contribution margin after funding and credit cost follows risk retention and origination cost rather than facility size. Recourse factoring earns modestly, with the client absorbing debtor default. Invoice discounting earns thinly against competitive pricing on larger clients. Non-recourse factoring earns reasonably once insurance premium is deducted. Export factoring earns well on two-factor complexity. Selective invoice finance earns better on transaction pricing. Reverse factoring earns best, on buyer-led volume acquired at very low cost.
The tension is between predictable fee income and volatile spread income, and providers keep resolving it in the wrong direction. Service fees on assigned turnover survive rate cycles and credit cycles alike. Discount income swells when rates rise and compresses when they fall, and it flattered results so thoroughly through 2022 and 2023 that several providers discounted service fees to win volume they will regret holding.

High-value pools sit in three places. Large buyer programmes, where one relationship delivers hundreds of suppliers at a single acquisition cost. Export facilities, where the two-factor structure has no substitute anybody has built. And retained-risk non-recourse capacity, which is worth most precisely when insurers have withdrawn and competitors cannot write anything at all.

Volume / Commodity-Adjacent

Invoice discounting and recourse factoring supplied to larger clients on competitively bid terms. The 10-point range separates bank-owned providers funding at internal transfer pricing from independents funding through wholesale markets at wider spreads.
Gross Margin: 18-28%

Premium / Certified

Non-recourse and export factoring carrying credit assessment, insurance arrangement and cross-border collection responsibility. The 14-point spread reflects how differently insured domestic facilities and two-factor export arrangements price against the work involved.
Gross Margin: 32-46%

Sustainability / Regulatory / Next-Generation

Reverse factoring programmes and selective invoice finance originated through buyers or platforms at very low acquisition cost. The 20-point range is wide because buyer-led programme economics and per-transaction selective pricing behave quite differently across a cycle.
Gross Margin: 44-64%
factoring-market-portfolio-architecture-1787913392247

High-value Sub-segments and Strategic Watch-out

Buyer-Led Programme Origination

Highest margin and fastest growth at 10.8%, protected by acquisition economics no supplier-by-supplier approach can match and by relationships that take years to establish. The risk is accounting treatment scrutiny, which could change how buyers structure these arrangements. The buyers decide that structure, not the funders.
Gross Margin: 50-64%

Export And Cross-Border Facilities

Strong economics from a two-factor structure that has no substitute, since an exporter genuinely cannot assess or pursue a foreign buyer alone. The risk is correspondent counterparty quality, which sits outside the originating factor's control entirely. And that counterparty is really somebody else's employee entirely.
Gross Margin: 38-50%

Whole-Turnover Recourse Factoring

The volume core, generating the service fee income that survives rate and credit cycles alike and funding the operational base. Providers hold it because the fee line is dependable, not because the margin on it is attractive. Nothing about the margin here makes it interesting.
Gross Margin: 20-30%

Insurance-Dependent Non-Recourse

The strategic watch-out. Around 74% of this volume depends on limits an insurer can withdraw without notice, as happened across sectors in 2020. The risk is capacity vanishing at exactly the moment clients need it most urgently. Nobody gets much warning at all before that happens.
Gross Margin: 16-26%

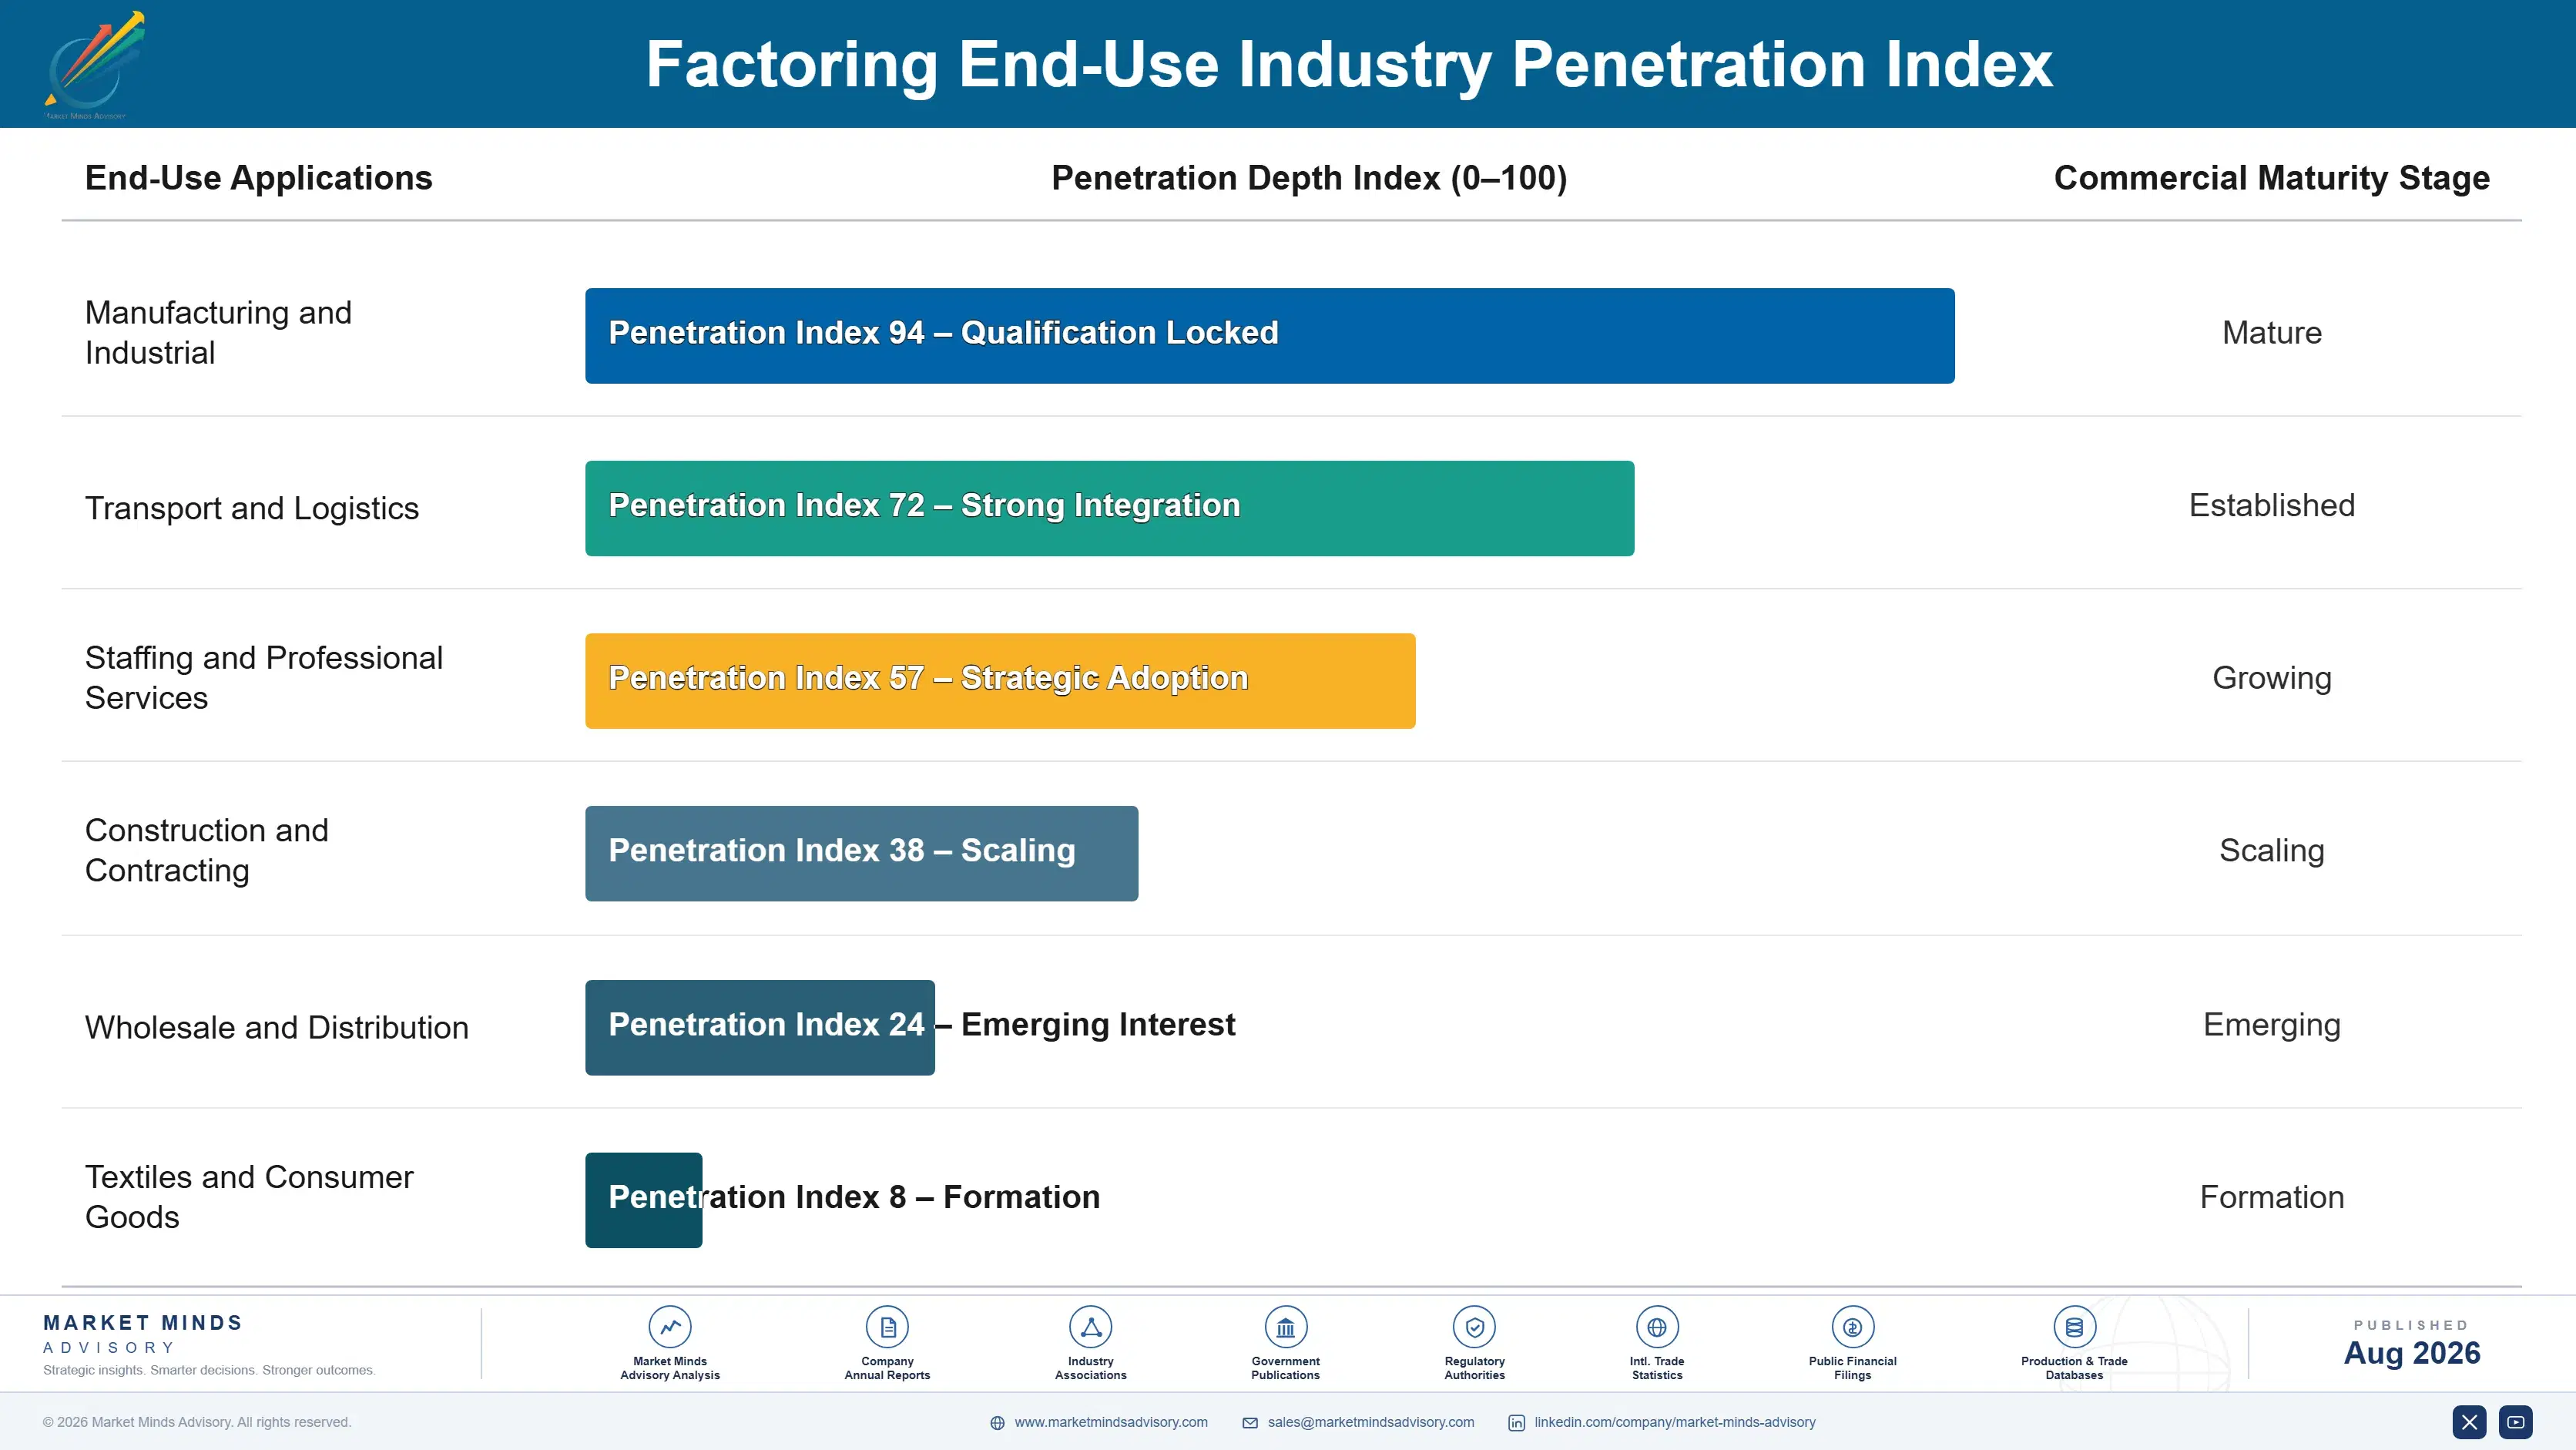
Recurring Until It Suddenly Is Not

Annuity characteristics here are genuine but conditional. A whole-turnover facility generates service fee income on every invoice a client raises, month after month, with no repurchase decision required and no renewal conversation until the anniversary. That is dependable revenue. It is also revenue that ends abruptly when a client outgrows factoring and moves to a bank facility, or fails, and factoring clients fail considerably more often than bank borrowers do.
Stickiness varies sharply by facility type and most providers misjudge it. Whole-turnover facilities are sticky through operational integration, since the client's collections process runs through the factor and moving means rebuilding it. Reverse factoring programmes are stickier still, because unwinding one affects hundreds of suppliers at once. Selective invoice finance has almost no stickiness at all, since each transaction is a fresh decision made on price.

The buyer has changed as the product has. Owner-managers and finance directors historically decided, weighing cost against the alternative of waiting. Reverse factoring moved the decision to procurement and group treasury at large buyers, who are choosing a programme rather than a facility. Platform origination moved it again, to a small business owner clicking an option inside accounting software without ever speaking to anybody.
factoring-market-end-use-penetration-index-1787913392731

Fees Endure, Spreads Do Not

These are among the four positions where our research anticipates prominent divergence between winners and laggards over the coming forecast period. Each is grounded in the demand model, the regulatory perimeter, and the announced capacity pipeline.
01 / SERVICE FEE DISCIPLINE

The fee line is what survives every cycle

Service fees of around 1.2% on assigned turnover are paid whether the client draws funds or not, which makes them the only revenue line in this whole business that survives both rate cycles and credit cycles without very much alteration at all. Discount income swelled through the rate rises and flattered reported results very considerably indeed. Providers who discounted their service fees to win volume during that period traded away the durable revenue line in order to protect the temporary one.
02 / BUYER-LED ORIGINATION DISCIPLINE

One buyer relationship beats hundreds of supplier calls

A single reverse factoring programme delivers direct access to several hundred separate suppliers at one single acquisition cost, against the alternative of pursuing and then underwriting each one of those suppliers quite separately over several years. That segment grows at 10.8% a year, and the buyer relationship itself is considerably harder to lose once it has properly been established. Providers who are still acquiring clients one supplier at a time end up paying many times over for exactly the equivalent volume.
03 / INSURANCE DEPENDENCY REDUCTION

Capacity you do not control is not capacity

Roughly 74% of all non-recourse volume depends on trade credit limits that an insurer is able to reduce or withdraw without any meaningful notice, as happened across whole sectors during 2020, when facilities simply disappeared within a matter of weeks. Retained first-loss tranches cost capital and they require real underwriting capability to be held internally. A provider still writing business when the market has withdrawn its cover wins clients at exactly the moment they have nowhere else at all to go.
04 / VERIFICATION COST REDUCTION

Source data is cheaper and much harder to fake

Manual verification is the thing that makes facilities below roughly 2 million in client turnover uneconomic, and it is also where the largest fraud exposure sits, since a fabricated invoice looks entirely identical to a real one. Invoice data drawn directly from accounting platforms or from electronic invoicing mandates costs a great deal less to check and resists fabrication considerably better. Both of those effects improve the economics at every facility size rather than only at the very smallest ones.

Engagement Snapshot From the Field

A live engagement with an industry participant carrying material or product regulatory and market exposure ahead of a defining policy shift, showing how our research translates into a defensible multi-year portfolio strategy.
MARKET MINDS ADVISORY · CLIENT ENGAGEMENT SUMMARY
Factoring Producer Strategic Portfolio Review and Transition Roadmap 2026·Investment Scenario on Factoring Exposure Evaluation 2025-26
CLIENT PROFILE
An independent factoring provider serving mid-market clients across two European markets, with reported factoring revenue of 62 million dollars (client-reported, unverified by MMA). Roughly 77% came from whole-turnover recourse and non-recourse facilities. Funding ran through a single securitisation programme and non-recourse volume was fully covered by one single trade credit insurer throughout the whole period.
STRATEGIC CHALLENGE
Discount income had fallen as policy rates settled, exposing service fee pricing that had been quietly discounted through the rate boom to win volume. Management was planning to increase advance rates and reduce fees further to defend market share. That accelerated the compression of the only revenue line that survives a credit cycle intact.
MMA APPROACH
MMA analysed revenue by fee and discount components across the client book, then modelled facility economics under a credit cycle scenario with insurer limits reduced. Thirty-one expert interviews with corporate finance directors, procurement leads, credit insurers and accounting platform providers established where origination and capacity constraints actually bind. The analysis treated fee discipline, buyer-led origination and funding diversification as routes.
KEY FINDINGS
  1. Service fees had fallen from an average of 1.4% to 0.9% of turnover across four years while discount income masked the effect entirely in reported results.
  2. A single insurer covered all non-recourse volume, and the modelled withdrawal scenario removed roughly a third of the book's capacity within one quarter.
  3. The client held no buyer-led programmes at all, and three of its largest client debtors already ran supply chain finance arrangements with other providers.
  4. Single securitisation funding widened by more than the client's entire net margin in the modelled downturn, which no operational efficiency measure could offset.
CLIENT PROFILE
An independent factoring provider serving mid-market clients across two European markets, with reported factoring revenue of 62 million dollars (client-reported, unverified by MMA). Roughly 77% came from whole-turnover recourse and non-recourse facilities. Funding ran through a single securitisation programme and non-recourse volume was fully covered by one single trade credit insurer throughout the whole period.
STRATEGIC CHALLENGE
Discount income had fallen as policy rates settled, exposing service fee pricing that had been quietly discounted through the rate boom to win volume. Management was planning to increase advance rates and reduce fees further to defend market share. That accelerated the compression of the only revenue line that survives a credit cycle intact.
MMA APPROACH
MMA analysed revenue by fee and discount components across the client book, then modelled facility economics under a credit cycle scenario with insurer limits reduced. Thirty-one expert interviews with corporate finance directors, procurement leads, credit insurers and accounting platform providers established where origination and capacity constraints actually bind. The analysis treated fee discipline, buyer-led origination and funding diversification as routes.
KEY FINDINGS
  1. Service fees had fallen from an average of 1.4% to 0.9% of turnover across four years while discount income masked the effect entirely in reported results.
  2. A single insurer covered all non-recourse volume, and the modelled withdrawal scenario removed roughly a third of the book's capacity within one quarter.
  3. The client held no buyer-led programmes at all, and three of its largest client debtors already ran supply chain finance arrangements with other providers.
  4. Single securitisation funding widened by more than the client's entire net margin in the modelled downturn, which no operational efficiency measure could offset.
RECOMMENDED STRATEGY
Phase 1: Phase one: halt further service fee discounting immediately and reprice the weakest twenty accounts, accepting the volume loss that follows. Phase 2: Phase two: approach the three large debtors already running buyer-led programmes elsewhere, since supplier access there has already been demonstrated. Phase 3: Phase three: add a second committed funding facility from a different investor type before the next credit cycle rather than during it.
OUTCOME
Service fee repricing across twenty accounts recovered margin on retained volume and lost four clients (client-reported, unverified by MMA). One buyer-led programme discussion reached term sheet stage. A second funding facility was arranged at higher undrawn cost. The advance rate increase was abandoned, having proposed to spend capital defending revenue that was already being given away.

Frequently Asked Questions

Foundational context covering the market sizes, CAGR, scope, country, region and competition that inform every finding below. This section is provided to cover basics and most often pre-purchase conversations, answered from the MMA Primary Research Dataset.

What is the current size of the Factoring Market?

The market was worth 48.0 billion dollars in provider revenue in 2025, comprising service fees on assigned turnover and discount charges on advances. It reaches 51.46 billion dollars in 2026.

How large will the Factoring Market be by 2036?

MMA forecasts 103.14 billion dollars by 2036, an increase of 51.68 billion dollars over the 2026 base. That represents an expansion multiple of 2.00 times across the forecast period.

What is the CAGR for the Factoring Market 2026 to 2036?

The base case compounds at 7.2% annually. The bull case reaches 8.4% on late payment pressure and embedded origination, while the bear case sits at 6.0% if a credit cycle withdraws insurer capacity.

Which segment is growing fastest?

Reverse factoring and supply chain finance, at 10.8%, half again the market rate of 7.2%. Large buyers extend supplier terms and then fund early settlement themselves.

Who are the major companies in the Factoring Market?

BNP Paribas Factor, Credit Agricole Leasing and Factoring, Deutsche Factoring Bank, Intesa Sanpaolo and Banco Santander lead on disclosed factoring turnover. Concentration is only 21%, so regional providers hold substantial positions.

Which country is growing fastest?

India at 9.2%, supported by TReDS electronic platforms that put supplier invoices to large buyers out to competitive bidding among financiers. That mechanism is unusual internationally.

Report Segmentation Architecture

The full report scope spans multiple orthogonal segmentation dimensions, with cross-tabulated demand data provided for each dimension pair. Coverage extends further to regional breakdowns, trend trajectories, and the competitive detail needed to support segment-level decision-making.

By Facility Type

  • Recourse Factoring
  • Non-Recourse Factoring
  • Invoice Discounting and Confidential Facilities
  • Reverse Factoring and Supply Chain Finance
  • Export and Cross-Border Factoring
  • Selective and Spot Invoice Finance

By End-Use Industry

  • Manufacturing and Industrial
  • Transport and Logistics
  • Staffing and Professional Services
  • Construction and Contracting
  • Wholesale and Distribution
  • Textiles and Consumer Goods

By Commercial Dimension

  • Bank Branch Distribution
  • Direct Sales and Broker Introduction
  • Accounting Platform Embedded Origination
  • Buyer-Led Programme Enrolment
  • Correspondent Factor Arrangements
  • Electronic Receivables Exchange Bidding

By Region

  • North America
  • Western Europe
  • East Asia
  • South Asia and Pacific
  • Latin America
  • Middle East and Africa
  • Eastern Europe

Scope, Methodology, and Coverage

Every figure in this report is reproducible from documented input assumptions. The scope below maps the historical period, the forecast horizon, the segmentation dimensions, and the countries covered, alongside the underlying primary and qualitative methodology.
Historical Period
2020 to 2025
Forecast Period
2026 to 2036
Base Year
2025 (USD billions; MMA Primary Research Dataset, August 2026)
Market Definition
Scope covers revenue earned by providers of receivables purchase and receivables finance facilities to commercial clients, spanning recourse factoring, non-recourse factoring, invoice discounting and confidential facilities, reverse factoring and supply chain finance programmes, export and cross-border factoring including two-factor correspondent arrangements, and selective or spot invoice finance. Revenue is measured as service fees charged on assigned turnover together with discount and interest charges earned on funds advanced. Trade credit insurance premiums earned by insurers, asset-based lending secured against inventory plant or equipment, unsecured commercial lending, trade finance instruments including letters of credit, merchant cash advances, and consumer receivables purchase are excluded from the market size and all derived figures.
Quantitative Units
USD billions of provider revenue (current prices); assigned turnover in USD trillions; service fee rate as percentage of turnover; advance rate as percentage of invoice value; debtor payment days
Segmentation Dimensions
By Facility Type; By End-Use Industry; By Commercial Dimension; By Region
Regions Covered
North America, Western Europe, East Asia, South Asia and Pacific, Latin America, Middle East and Africa, Eastern Europe
Countries Covered
France, China, Germany, UK, Italy, Spain, USA, Japan, India, Brazil, Netherlands, Belgium, Poland, Australia, Mexico
Key Companies Profiled
BNP Paribas Factor, Credit Agricole Leasing and Factoring, Deutsche Factoring Bank, Intesa Sanpaolo, Banco Santander, HSBC, Barclays, Lloyds Bank Commercial Finance, NatWest, Societe Generale Factoring, UniCredit Factoring, Mizuho Factors, Bank of China, Ping An Bank, Nordea Finance, KBC Commercial Finance, Bibby Financial Services, eCapital, Triumph Financial, Close Brothers Invoice Finance
Quantitative Methodology
Primary survey, n=3,800 respondents, Q4 2025, six countries; demand-side model with trade association cross-validation
Qualitative Methodology
47 expert interviews, Q4 2025; applied to validate demand model assumptions, identify emerging dynamics, and assess competitive positioning
Report Format
PDF and XLSX data workbook (Word format preview document)
Publisher
Market Minds Advisory
Report Code
MMA-2026-TEC-141
Published
August 2026
Contact
sales@marketmindsadvisory.com | www.marketmindsadvisory.com

Purchase the full Factoring Market Report (2026 to 2036).

The full report runs to 185 pages and covers all six facility type segments, seven regions and 20 profiled providers in detail. It includes the complete segment CAGR set, regional comparison of factoring penetration against economic output, and separate modelling of fee income and discount income across rate and credit cycle scenarios. Company profiles carry evaluation on disclosed factoring and receivables finance turnover, with moat and risk assessment for the top five providers. The competitive section extends to 14 tracked programme, underwriting and origination developments across 2024 and 2025. Primary research inputs include a quantitative survey of 3,800 respondents and 47 expert interviews conducted in Q4 2025.
Six facility type segments with individual CAGR forecasts
Seven regional markets with penetration against output comparison
Twenty provider profiles on consistent turnover evaluation basis
Fourteen tracked programme and underwriting developments with commercial interpretation
Fee income and discount income modelled across cycle scenarios
Trade credit insurance dependency assessed as a capacity constraint

Built For The People Who Decide

From boardroom strategy to bench-side execution, this report is read cover-to-cover by leaders shaping the next decade of their industry, turning demand scenarios, market dynamics and valuation benchmarks into decisions.
CXOs/ Presidents/ VPs/ Managers
M&A and Corporate Development
Strategy Teams and R&D Heads
Procurement and Product Directors
Regulatory and Compliance Leaders
Investor Relations and Equity Analysts