Market Minds Advisory
Extended Reality (XR) Market

Extended Reality (XR) Market: Extended Reality Market. Enterprise Adoption Growth Through 2036

An industrial training operator converting flagship simulation programs toward smart AI-enhanced XR platforms discovers the shift reshapes hardware-refresh economics, content-development timelines, and long-term vendor contracts across its entire regional facility network.

Lead Analyst

Published

September 2026

Make Smarter Decisions with Customized Research Insights

Request a free sample report and evaluate market opportunities, growth trends, and competitive dynamics relevant to your business needs.

2025 MARKET VALUE$32.0BMarket Size 2025
2036 FORECAST VALUE$170.1BBase Case , 2026 to 2036
CAGR 2026 TO 203616.4 %Bull 17.8% / Bear 15.0%
INCREMENTAL OPPORTUNITY$132.8BNet 10- year value creation
EXPANSION MULTIPLE4.57x2036 value over 2026 base
Strategic Levers
M&A Pipeline
Regional Outlook
Country Rankings
Competitive Intelligence
Segmental Deep-dive
Call-Us : 91 93563 13602

Executive Snapshot and Market Trajectory.

The extended reality market is shifting decisively from conventional standalone headset formats toward smart AI-enhanced platforms, as enterprise training operators increasingly treat automated content-adaptation as a core deployment requirement rather than a discretionary upgrade, reshaping vendor purchasing across most industrial and enterprise programs. Timing varies by operator segment considerably.
Smart and AI-enhanced XR platforms now lead segment growth at 28.7% annually, well ahead of the wider market's 16.4% pace, as automated-adaptation demand outpaces conventional standalone expansion across most enterprise markets. North America holds the largest regional share given its concentration of major XR platform companies and the largest enterprise adoption base, while China's expanding consumer and hardware manufacturing base pulls country-level growth meaningfully higher, and the gap widens considerably. Manufacturer investment keeps accelerating.
Competitive intensity remains moderately concentrated, with Meta and Apple holding a substantial lead over challenger manufacturers on documented hardware-engineering depth and platform-network reach. Smart-enhanced and enterprise-format programs increasingly separate manufacturers capturing premium operator demand from those confined to conventional standalone contracts. Hardware-engineering depth is emerging as a further separator, since it insulates manufacturer margins from commodity-substitution risk that smaller challenger firms cannot readily absorb. That gap persists.
Market Definition
The extended reality market covers manufacturing and platform revenue across virtual reality headsets and hardware, augmented reality headsets and hardware, mixed reality hardware, enterprise and industrial XR applications, smart and AI-enhanced XR platforms, and XR content development and support services. It excludes general-purpose smartphone camera-based AR filters and standalone 2D display hardware outside documented XR-device scope.
Base Year Value
$32.0B in 2025 (MMA Primary Research Dataset, September 2026)
Forecast Period
2026 to 2036, eleven discrete annual values
CAGR
16.4% base case. Bull 17.8%. Bear 15.0%.
Fastest Growth Segment
Smart and AI-Enhanced XR Platforms: 28.7% CAGR
Fastest Growth Country
China: 22.8% CAGR
Fastest Growth Region
South Asia and Pacific: 18.4% CAGR
Largest Region
North America: 30% of 2025 global value
Market Leaders
Meta Platforms Inc, Apple Inc, Microsoft Corporation, Sony Group Corporation, HTC Corporation. Source: MMA Analysis based on company annual reports.
Primary Survey
n=3,800 procurement and R&D decision-makers, Q4 2025, six countries
Methodology
Demand-side build-up, cross-validated against public data, 47 expert interviews

Extended Reality (XR) Market Forecast Scenarios

extended-reality-market-size-forecast-scenario-1788416237248
The extended reality market grew steadily from 2020 to 2025, with conventional standalone adoption giving way to accelerating smart-enhanced investment from 2023 onward. The market grew at a 14.9% historical CAGR, trailing the forecast pace as AI-enhanced infrastructure only scaled meaningfully in the final two years across major operators globally. Deployment-adoption behavior shifted meaningfully during this period.
The base case carries the market to a 16.4% CAGR through 2036 on three mechanisms. First, manufacturers keep expanding smart-enhanced and enterprise-format production capacity under tightening content-adaptation requirements. Second, operator project-cycle timing keeps scaling headset-order frequency across expanding industrial-training and consumer segments. Third, enterprises keep expanding compliance allocation for AI-enhanced formats over conventional standalone alternatives. Together these mechanisms reinforce manufacturer pricing power and extend average vendor-contract duration across most procurement channels globally.
The bull case, 17.8%, assumes smart-enhanced adoption accelerates faster than currently projected as more operators commit to AI-enhanced enterprise programs. The bear case, 15.0%, assumes component-cost pressure and standalone-format substitution slow conversion timing, keeping growth concentrated in conventional compliance channels alone, with enterprise-program timing shaping the pace regionally. Regulatory timing across major markets continues shaping realized outcomes broadly.

Content Adaptation Redraws the Platform Line

Extended reality demand now splits along an automated-adaptation-capability and enterprise-training line rather than a purely price-driven one. Conventional VR and AR headset formats, the historical backbone of the category, meet baseline consumer needs at pricing tied closely to display and processor input costs. Smart-enhanced and enterprise formats instead serve operators demanding documented content-adaptation accountability and simulation-fidelity reliability, commanding meaningfully differentiated equipment value for that specialization across most industrial and enterprise programs.
MARKET CONCENTRATIONCR5: 44%Top five manufacturers hold well over two fifths revenue
SMART ENHANCEMENT PREMIUMUSD 340 per unit over conventional equivalentPremium varies sharply between standalone and AI-enhanced tiers
TOP PRODUCING COUNTRYChina: 27% of global XR hardware manufacturing revenueConcentrated hardware-engineering infrastructure anchors global production firmly nationwide
HEADSET REPLACEMENT CYCLE3 to 5 years per installed unitReplacement cadence drives recurring content and upgrade revenue
DISPLAY COMPONENT COST SHARE44% of total production costInput cost share shapes near-term manufacturer margin strategy
ENTERPRISE CONTRACT RENEWAL RATE62% across major licensing agreementsRenewal rate reflects switching costs built into certified smart formats
Buyers split sharply by operator segment and deployment mandate. Industrial training operators and enterprise developers specify dedicated smart-enhanced and enterprise-format contracts engineered for documented content-adaptation accountability and simulation-fidelity reliability to protect training outcomes, requiring engineering depth that generic manufacturers struggle to match consistently. Budget-conscious consumer buyers instead specify conventional standalone systems, competing largely on unit price rather than deep adaptation differentiation. Regional vendor partnerships continue reinforcing that split.
Over the next decade, smart-enhanced and enterprise formats should keep pulling value toward higher-margin equipment tiers, while conventional VR headsets keep driving the largest underlying unit volume among budget-conscious consumer buyers. Documented content-adaptation accountability and hardware-engineering depth, not unit price alone, increasingly looks like the most durable driver of manufacturer strategy across the forecast period ahead globally.
"Operators used to buy XR hardware purely on field-of-view rating and price point. Now content-adaptation documentation and simulation-fidelity testing decide which manufacturer actually keeps the vendor contract."
Director, Immersive Technology Systems Practice · MMA Technology Practice · September 2026

Market Trends

Operators Convert Deployments Toward Smart AI-Enhanced Platforms

Industrial training operators and enterprise developers have increasingly prioritized converting standard standalone headset orders toward documented smart and AI-enhanced platforms rather than relying on conventional-only production across critical training programs, treating content-adaptation depth as a defining qualification consideration rather than a secondary specification handled after core headset coverage. Several major operators now require multi-year content-adaptation and simulation-fidelity documentation before finalizing new manufacturer partnerships, rather than accepting standalone-format qualification common across earlier procurement cycles. Meta has invested heavily in dedicated AI-enhancement infrastructure, recognizing that large operator mandates hinge on adaptation depth over unit price terms alone.
Market Impact: Industrial training mandate adds 12% demand
Manufacturers Expand Documented Enterprise Format Adoption

Enterprise and industrial XR format adoption, once concentrated almost entirely in premium flagship training programs, has expanded meaningfully into mainstream mid-market territory, since documented simulation-fidelity outcomes and falling per-unit production costs have made adoption commercially viable across a considerably broader range of operator budgets than earlier generations supported. Several major manufacturers have launched dedicated mainstream-configuration enterprise lines priced within reach of mid-tier operators, reflecting genuine operational change rather than incremental feature addition. Manufacturers with established enterprise infrastructure are capturing these accounts well ahead of competitors still building comparable capability across regional vendor networks currently under active expansion.
Market Impact: Enterprise simulation growth adds 9% demand

Market Opportunities and Growth Drivers

Industrial Training Mandate Trend Broadly Expands XR Demand

Tightening industrial-training mandate requirements continue expanding documented content-adaptation-accountability requirements across established and emerging operator categories, driving dedicated smart-enhanced demand well beyond levels seen in earlier forecast periods historically as deployment specifications tighten across the industry globally. Several major manufacturers have announced expanded production-capacity commitments through the current forecast period specifically, giving manufacturers a durable, quantified demand timeline that shapes multi-year contract investment rather than one-off operator response. That durability distinguishes smart-format demand from more cyclical standalone-format capital spending elsewhere in the category. Manufacturers lacking comparable adaptation depth are responding by accelerating certification plans.
Market Impact: Display component volatility compresses margins 8%

Enterprise Simulation Investment Growth Sustains Format Demand

Growing enterprise-simulation investment continues expanding enterprise-format distribution across established and emerging operator segments, lifting demand for both conventional and premium equipment formats well beyond levels seen in earlier forecast periods historically as fidelity specifications tighten across regulated enterprise markets. Several major manufacturers have expanded dedicated enterprise-servicing capacity through the current forecast period specifically, a pace of capacity expansion that barely existed at current scope before 2023 and now shapes operator decisions among vendor partners specifically. That reinforces manufacturer research investment steadily across every major enterprise market, extending contract visibility considerably.
Market Impact: Standalone format substitution limits growth 6%

Market Restraints and Challenges

Display Component Cost Volatility Compresses Manufacturer Margins

Certified micro-OLED displays and precision optical-lens components carry substantial engineering and testing costs for XR hardware manufacturers, and display-component pricing faces significant volatility tied to a limited number of dominant panel-fabrication intermediaries that manufacturers cannot easily hedge through supply contracts alone. The underlying cause is that headset production is tied closely to display-panel commodity cycles, giving manufacturers limited independent control over input cost when component prices shift sharply. Manufacturers are responding by diversifying panel-supplier relationships to smooth exposure. That shift takes years to complete, leaving margins exposed to component-cost swings across most product lines globally.
Market Impact: Smart enhancement adoption reaches 17%

Standalone Format Substitution Limits Conversion Pace

Conventional standalone VR and AR headsets retain meaningful budget-driven persistence among smaller budget-conscious consumer buyers across most standard deployment channels, across several recent procurement cycles, creating persistent conversion resistance that limits how quickly mainstream operators convert toward smart-enhanced systems even where adaptation advantages are documented. The underlying cause is that smaller buyers increasingly favor lower-cost standalone-format headsets at reduced upfront investment, undercutting premium-format pricing across most major consumer markets. Manufacturers are responding by emphasizing documented lifecycle-value transparency over generic price-schedule parity. That pivot takes considerable operator-education investment across most competitive regional markets currently underway globally.
Market Impact: Mainstream enterprise adoption reaches 15%
3 additional market trends, 4 additional growth drivers, and 3 additional restraints and challenges are covered in the full report. Contact sales@marketmindsadvisory.com to access the complete intelligence.

Segment CAGR and Growth Architecture

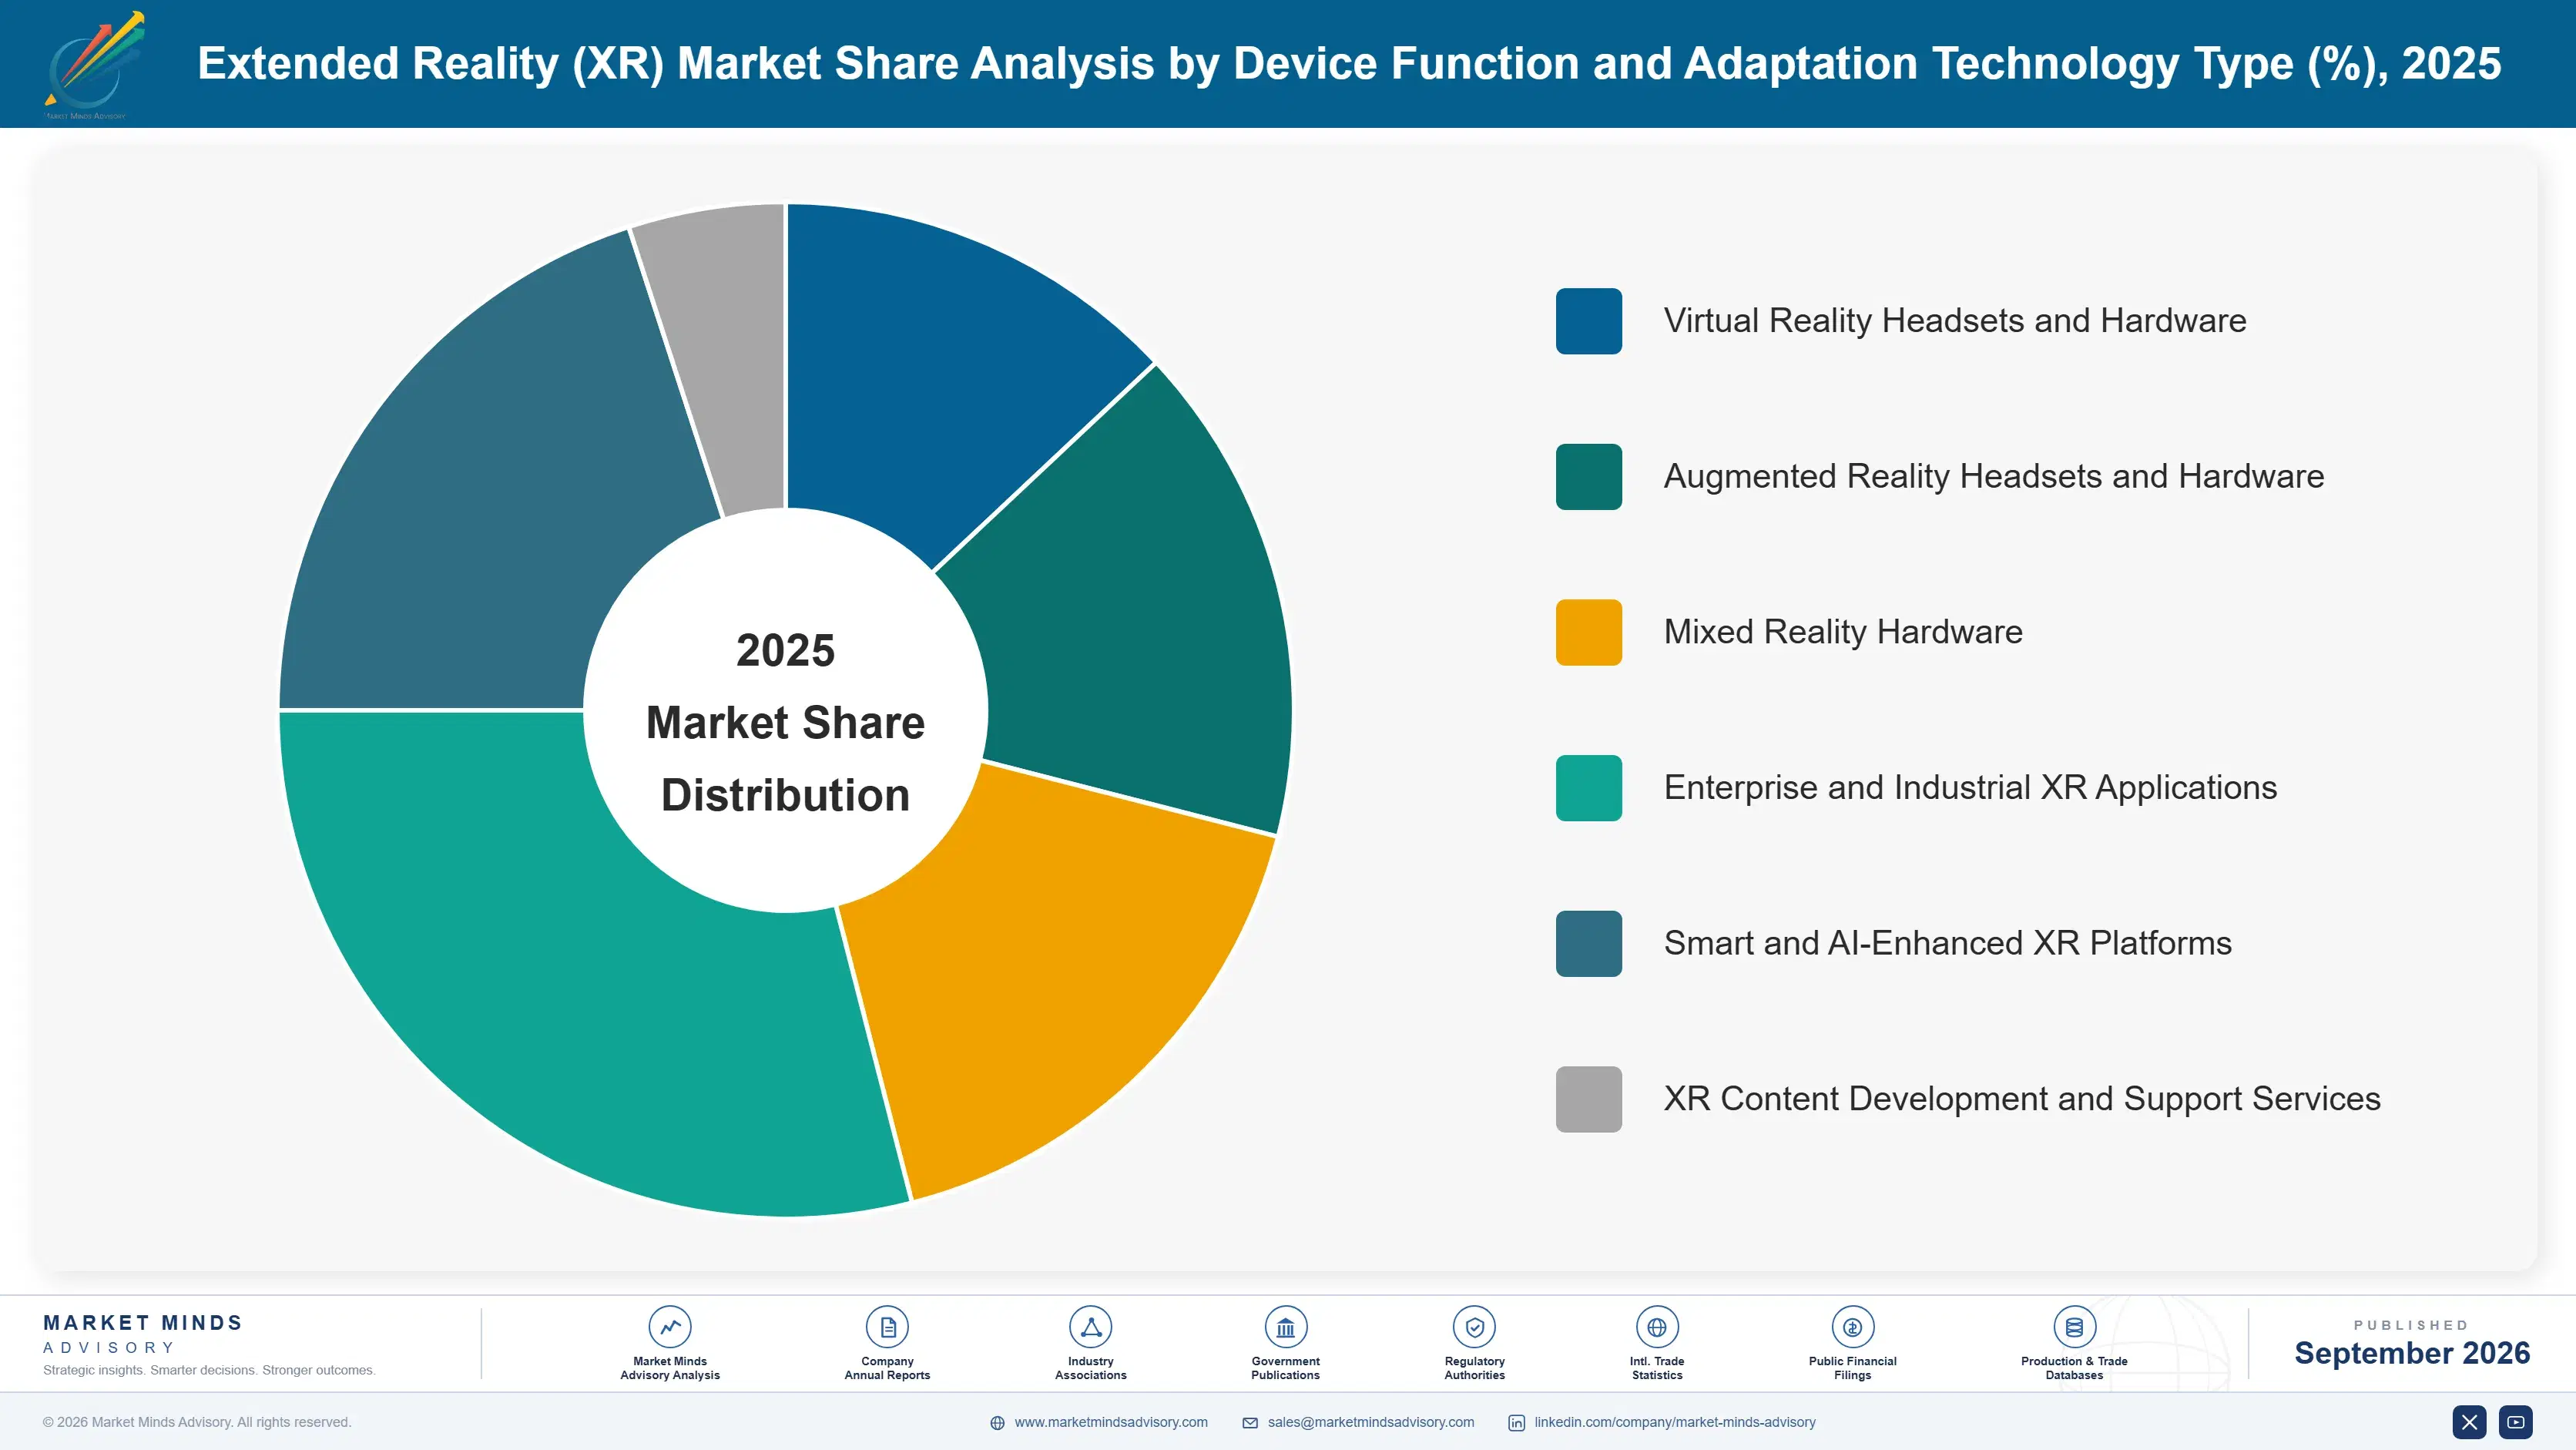
Segmentation follows device function and adaptation-technology type, a single classification logic separating the market by what an operator specifies rather than by buyer type or geography. VR, AR, MR, enterprise, smart-enhanced, and service formats each carry distinct manufacturing and margin profiles, keeping conventional and premium-smart revenue from blurring together across cycles. Revenue reporting stays consistent throughout.
extended-reality-market-market-share-analysis-1788416237798

Smart and AI-Enhanced XR Platforms

Smart and AI-enhanced XR platforms are growing at 28.7% annually, well ahead of the wider market's 16.4% pace, as content-adaptation demand outpaces conventional standalone expansion across most enterprise markets. This segment requires specialized machine-learning and scene-recognition infrastructure distinct from conventional standalone-only production, since matching institutional-grade adaptation precision to established operator benchmarks demands considerable technical investment across software-integration infrastructure. Pricing for smart-enhanced platforms runs well above conventional-format economics, reflecting operator willingness to pay for documented adaptation credentials. Meta and Apple have prioritized capital investment in dedicated AI-enhancement infrastructure, positioning the segment for continuing growth across every major enterprise territory globally. That barrier should keep manufacturer share concentrated among established leaders through the decade.
CAGR 28.7%

Enterprise and Industrial XR Applications

Enterprise and industrial XR applications grow at 24.1% annually, driven by expanding demand for simulation-fidelity formats that increasingly displace standard consumer products across operators where documented training-effectiveness performance matters most. This segment commands technology-intensive economics distinct from bulk consumer production, since matching consistent industrial-grade reliability to established regulatory benchmarks demands considerable operational investment from manufacturers. Several major operators have expanded dedicated long-term enterprise programs, extending a relationship once managed through single-purchase allocation into planned multi-year manufacturer-partnership agreements. That advantage should compound through the forecast period ahead broadly, as fewer manufacturers hold the industrial-grade expertise operators increasingly require before signing supply-contract agreements. Regional operators increasingly treat that depth as a renewal prerequisite, not an optional add-on.
CAGR 24.1%
Full segment breakdown across 6 segments available in the complete report.

Regional Architecture and Country Demand Map

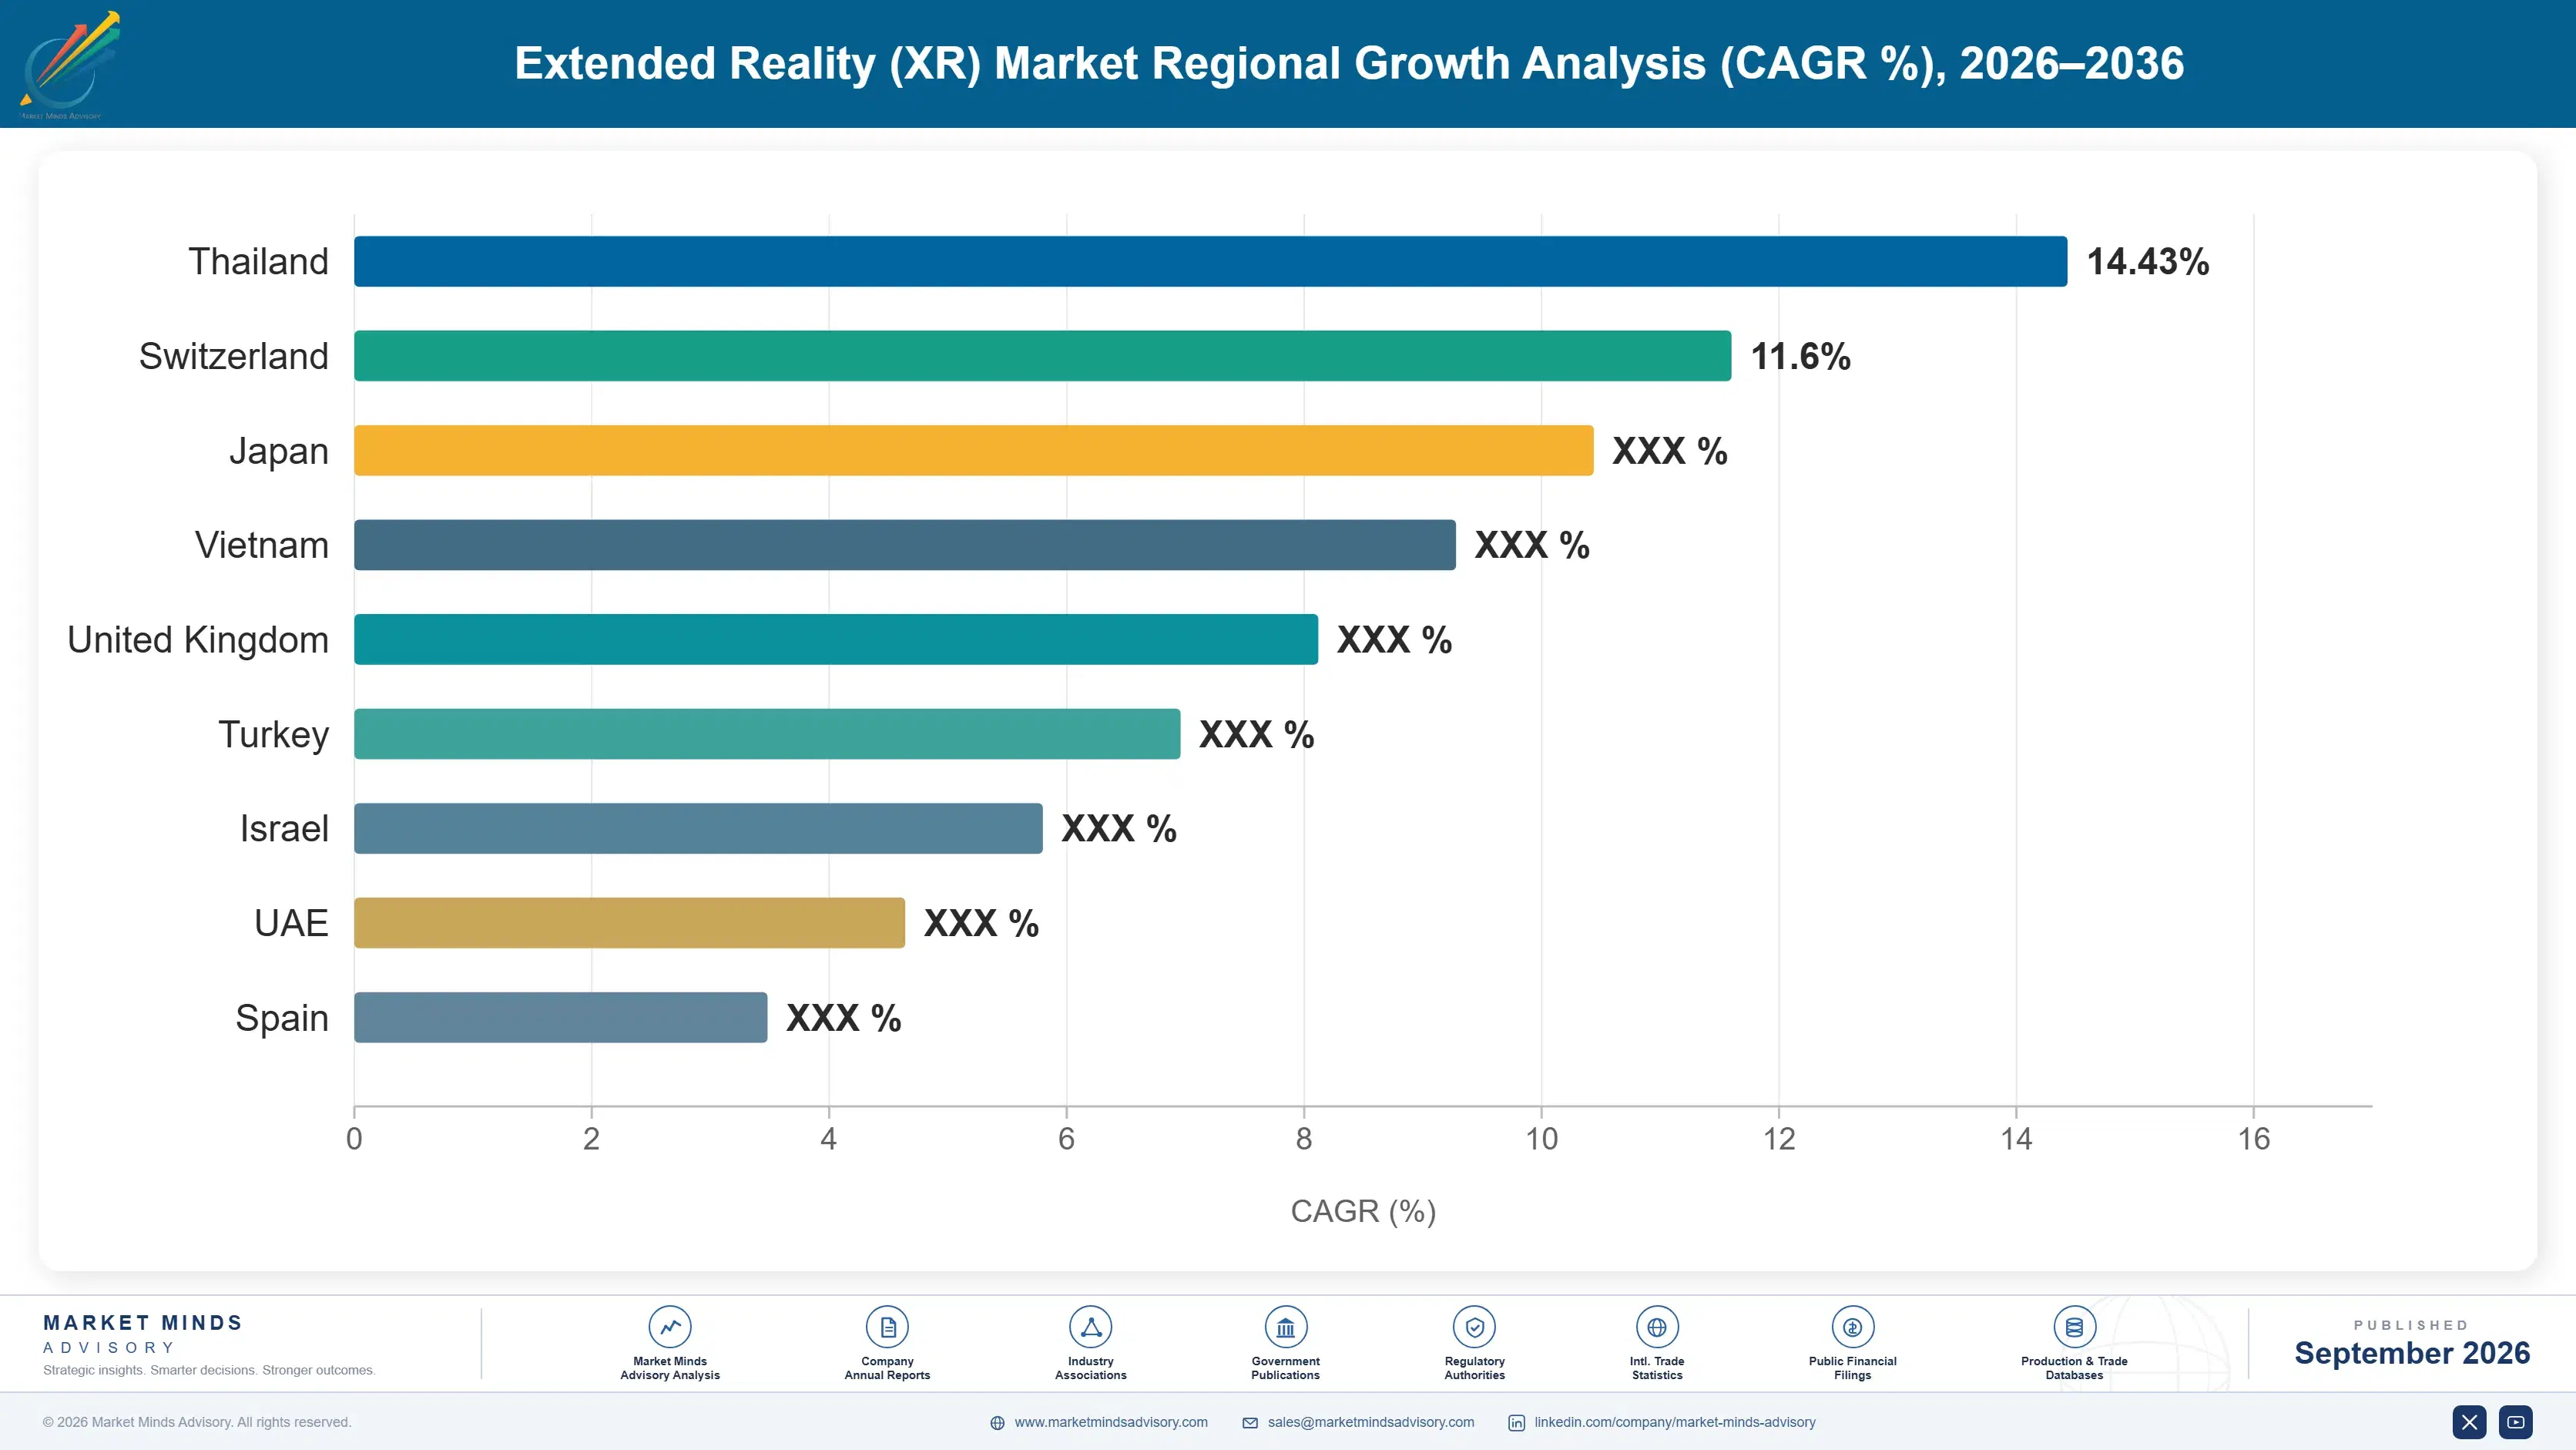
North America holds the largest regional share given its concentration of major XR platform companies and the largest enterprise adoption base. China carries the fastest country-level growth as its manufacturing base expands. East Asia follows on scale. Growth stays broad-based across most established enterprise territories.

North America

The United States anchors North American extended reality demand through Meta's and Apple's concentrated hardware-engineering and platform presence, supplying a considerable share of premium smart-enhanced and enterprise revenue across industrial channels nationwide. Canada contributes meaningful additional demand tied to regional enterprise and training-facility budgets. Meta's domestic engineering infrastructure anchors sustained demand across the forecast period, reflecting a decade of established brand-leadership consolidation nationally. Enterprise operators continue prioritizing certification renewal broadly across most major licensing programs nationwide. Growth stays firm regionally across most established enterprise markets. Enterprise procurement cycles continue lengthening across major metropolitan territories nationwide. California's dense enterprise-technology cluster continues reinforcing demand for both conventional and premium contract formats across major operator budgets,.
Share: 30% | CAGR: 15.4% (2026 to 2036)

Western Europe

Germany's expanding domestic industrial-training infrastructure anchors a meaningful share of Western European exposure to the extended reality market, as operators increasingly specify certified smart-enhanced infrastructure to meet rising simulation-fidelity standards. The United Kingdom and France contribute additional demand tied to established enterprise and consumer-development programs across both national markets. The Netherlands adds smaller but growing demand tied to expanding regional distribution financing. Regional growth trails East Asia meaningfully, reflecting a mature, already well-supplied equipment base with less remaining headroom for further capacity investment currently underway. Regional operators increasingly favor certified suppliers offering documented adaptation support to ease compliance qualification across expanding procurement programs. Distribution financing terms keep improving across the region's established enterprise base.
Share: 18% | CAGR: 14.9% (2026 to 2036)
Regional intelligence for 5 additional markets available in the complete report: East Asia, South Asia and Pacific, Latin America, Middle East and Africa, Eastern Europe. Contact sales@marketmindsadvisory.com.
extended-reality-market-country-cagr-analysis-1788416238323

Where Manufacturers Can Capture Margin

Margin defense in the extended reality market increasingly depends on moving beyond commodity standalone pricing toward positioning that lets a manufacturer charge for documented content adaptation, enterprise innovation, or scalable smart-enhanced capacity, targeting a distinct operator purchase behavior. The four moves below target the fastest-growing operator segments willing to pay premiums above standalone pricing.

Build Out Smart Enhancement Certification Capacity Now

Certified smart-enhanced XR platforms backed by documented content-adaptation testing command contract rates running well above conventional standalone material, and demand from major operators has grown faster than the industry's dedicated software-integration certification capacity currently available across established manufacturers. Manufacturers that invest in smart infrastructure now capture premium mandates before competitors establish comparable operator scale, since operators increasingly push manufacturers toward documented adaptation certainty as a baseline qualification requirement. The infrastructure investment requires meaningful capital, but the roughly 26% margin uplift over conventional formats justifies the cost for established manufacturers pursuing sustained growth across multiple procurement channels.
Market Impact: Smart enhancement typically commands a notable 26% margin premium

Secure Long-Term Vendor Supply Contracts Now

Manufacturers with multi-year vendor supply contracts command meaningful revenue-visibility advantages over competitors relying entirely on spot headset sales, and demand from vendors seeking supply predictability has grown faster than the industry's dedicated contracting capacity currently available across established manufacturers. Manufacturers that invest in long-term contracting now lock in vendor relationships before competitors face comparable renewal exposure, since vendors increasingly favor manufacturers offering stable multi-year pricing. The contracting investment requires meaningful sales capacity, but the roughly 14% higher retention rate this approach delivers justifies the cost for manufacturers pursuing margin-linked growth.
Market Impact: Long-term contracts typically lift vendor retention by 14%

Expand Enterprise Format Engineering Support Now

Manufacturers offering documented enterprise-format engineering support command substantially stronger operator retention than transactional headset-only sales, since operator partners increasingly value engineering collaboration over pure price competition given rising simulation-complexity across new compliance programs. Manufacturers that build engineering capability now capture deeper operator relationships before competitors establish comparable engineering capacity, since operators rarely switch manufacturers once an engineering relationship has been validated. The support investment requires meaningful capital deployment, but the roughly 12% higher contract value this approach generates justifies the cost for manufacturers targeting large operator accounts over multi-year horizons ahead.
Market Impact: Enterprise engineering support increases contract value by 12%

Develop Long-Term Industrial Servicing Agreements Now

Institutional vendor networks increasingly prefer subscription-based catalogue servicing over spot purchasing across major industrial programs, since supply disruption during active deployment seasons carries operational continuity risk that manufacturers cannot easily absorb given tightly coordinated field scheduling. Manufacturers that secure these agreements now lock in recurring revenue and pricing before competitors capture the same vendor accounts, since institutional networks rarely switch manufacturers once a servicing relationship has been validated. The investment required is modest relative to the roughly 10% more contracted volume this approach typically locks in over spot sourcing arrangements currently common.
Market Impact: Industrial servicing agreements typically lock in 10% more volume

Who Controls the Margin Pool

Competitive concentration sits at a moderate CR5 of 44%, reflecting a market split between Meta's and Apple's substantial lead over challenger manufacturers on documented hardware-engineering depth and platform-network reach. The gap between category leaders and mid-tier challengers remains built on years of manufacturing-infrastructure investment and operator-relationship access across most established markets. Challenger manufacturers continue investing in comparable infrastructure to close that persistent gap steadily.
Competitive activity currently runs along three lines. Meta and Apple compete on catalogue-network scale and cross-category application expertise, applying scale advantages smaller specialized competitors cannot easily replicate. Challenger manufacturers compete on documented smart-enhanced and enterprise format depth. Regional independent manufacturers compete on integrated vendor-relationship and local-distribution reach, since access to competitive distribution relationships increasingly determines contract outcomes broadly across regional markets.

Pressure is building from two directions. Challenger manufacturers are moving upmarket into certified smart-enhanced and enterprise territory once defensible mainly through decades of catalogue scale held by category-leading majors. Hardware-engineering support is becoming a differentiator, rewarding manufacturers willing to fund technical teams over those competing on generic standalone pricing. Rankings will favor whoever combines catalogue scale with credible smart-enhanced and enterprise capability.
extended-reality-market-company-positioning-matrix-1788416238845

Competitive Moat and Risk Dimensions

META PLATFORMS INC

Moat: Deep hardware engineering scale

Meta holds substantial vertically integrated hardware-engineering infrastructure across standalone, smart-enhanced, and enterprise segments that newer entrants, domestic or international, cannot replicate on any reasonable timeline, giving it component-cost and vendor-relationship advantages that smaller specialized competitors genuinely struggle to match. Long-standing vendor relationships reinforce this position further globally.
META PLATFORMS INC

Risk: Exposed to display cost risk

Meta's substantial certified-product revenue base remains exposed to continuing display-component cost volatility tied to a narrow panel-fabrication supplier base, and the company must increasingly invest in diversified sourcing infrastructure to offset that persistent margin headwind facing its largest growth category. That exposure will persist until display supply diversifies further globally.
APPLE INC

Moat: Deep platform network scale

Apple maintains substantial XR-industry platform infrastructure built through years of dedicated developer-relationship presence, giving it commercial relationship advantages and operator access that competitors lacking comparable specialization cannot easily replicate across similarly demanding qualification programs across major regional markets. That depth compounds with each new enterprise mandate secured.
APPLE INC

Risk: Limited enterprise brand depth

Apple's more limited direct enterprise-format brand relationship depth relative to established industrial-focused platforms limits how quickly it can capture broader operator-segment contracts, potentially constraining its ability to capture the full growth opportunity without additional brand-facing investment. Closing that gap will require sustained capital commitment well beyond current spending levels globally.

Players Tracked

Prominent Players

Meta Platforms Inc
Apple Inc
Microsoft Corporation
Sony Group Corporation
HTC Corporation

Other Key Players

Valve Corporation
Magic Leap Inc
Varjo Technologies Oy
Pico Interactive
Samsung Electronics Co Ltd
Qualcomm Incorporated
Lenovo Group Limited
Vuzix Corporation
RealWear Inc
Xreal Inc
Rokid Corporation
Unity Software Inc
PTC Inc
Niantic Inc
Epic Games Inc

Recent Developments

MARCH 2024

Meta expands smart enhancement certification testing capacity

Meta expanded dedicated software-integration certification testing capacity at its domestic facilities, responding directly to growing operator demand for documented content-adaptation certainty ahead of tightening deployment requirements. The expansion was an organic capacity investment, not a joint venture or acquisition of any competing manufacturer across the region.
Signal: Signals established manufacturers investing directly in certified capacity ahead of confirmed operator sourcing mandates across the region.
SEPTEMBER 2024

Apple signs long-term supply partnership with industrial training operator network

Apple signed a multi-year supply partnership with a major industrial training operator network to provide certified smart-enhanced access across multiple enterprise programs. The transaction was a supply agreement, not a joint venture, acquisition, or merger of any kind between the two organizations. The agreement reflects growing demand certainty.
Signal: Signals established manufacturers securing long-term operator demand commitments ahead of continued adaptation-driven growth broadly across the industry.
JANUARY 2025

Microsoft acquires regional enterprise technology specialist

Microsoft acquired a regional enterprise-technology specialist to expand its simulation-fidelity engineering capability ahead of anticipated operator demand growth across major markets. The transaction was a full acquisition of the target company, not a joint venture or minority equity stake arrangement. The deal signals rising enterprise-technology investment.
Signal: Signals established manufacturers expanding directly into certified enterprise specialization well ahead of broader industry adoption globally.

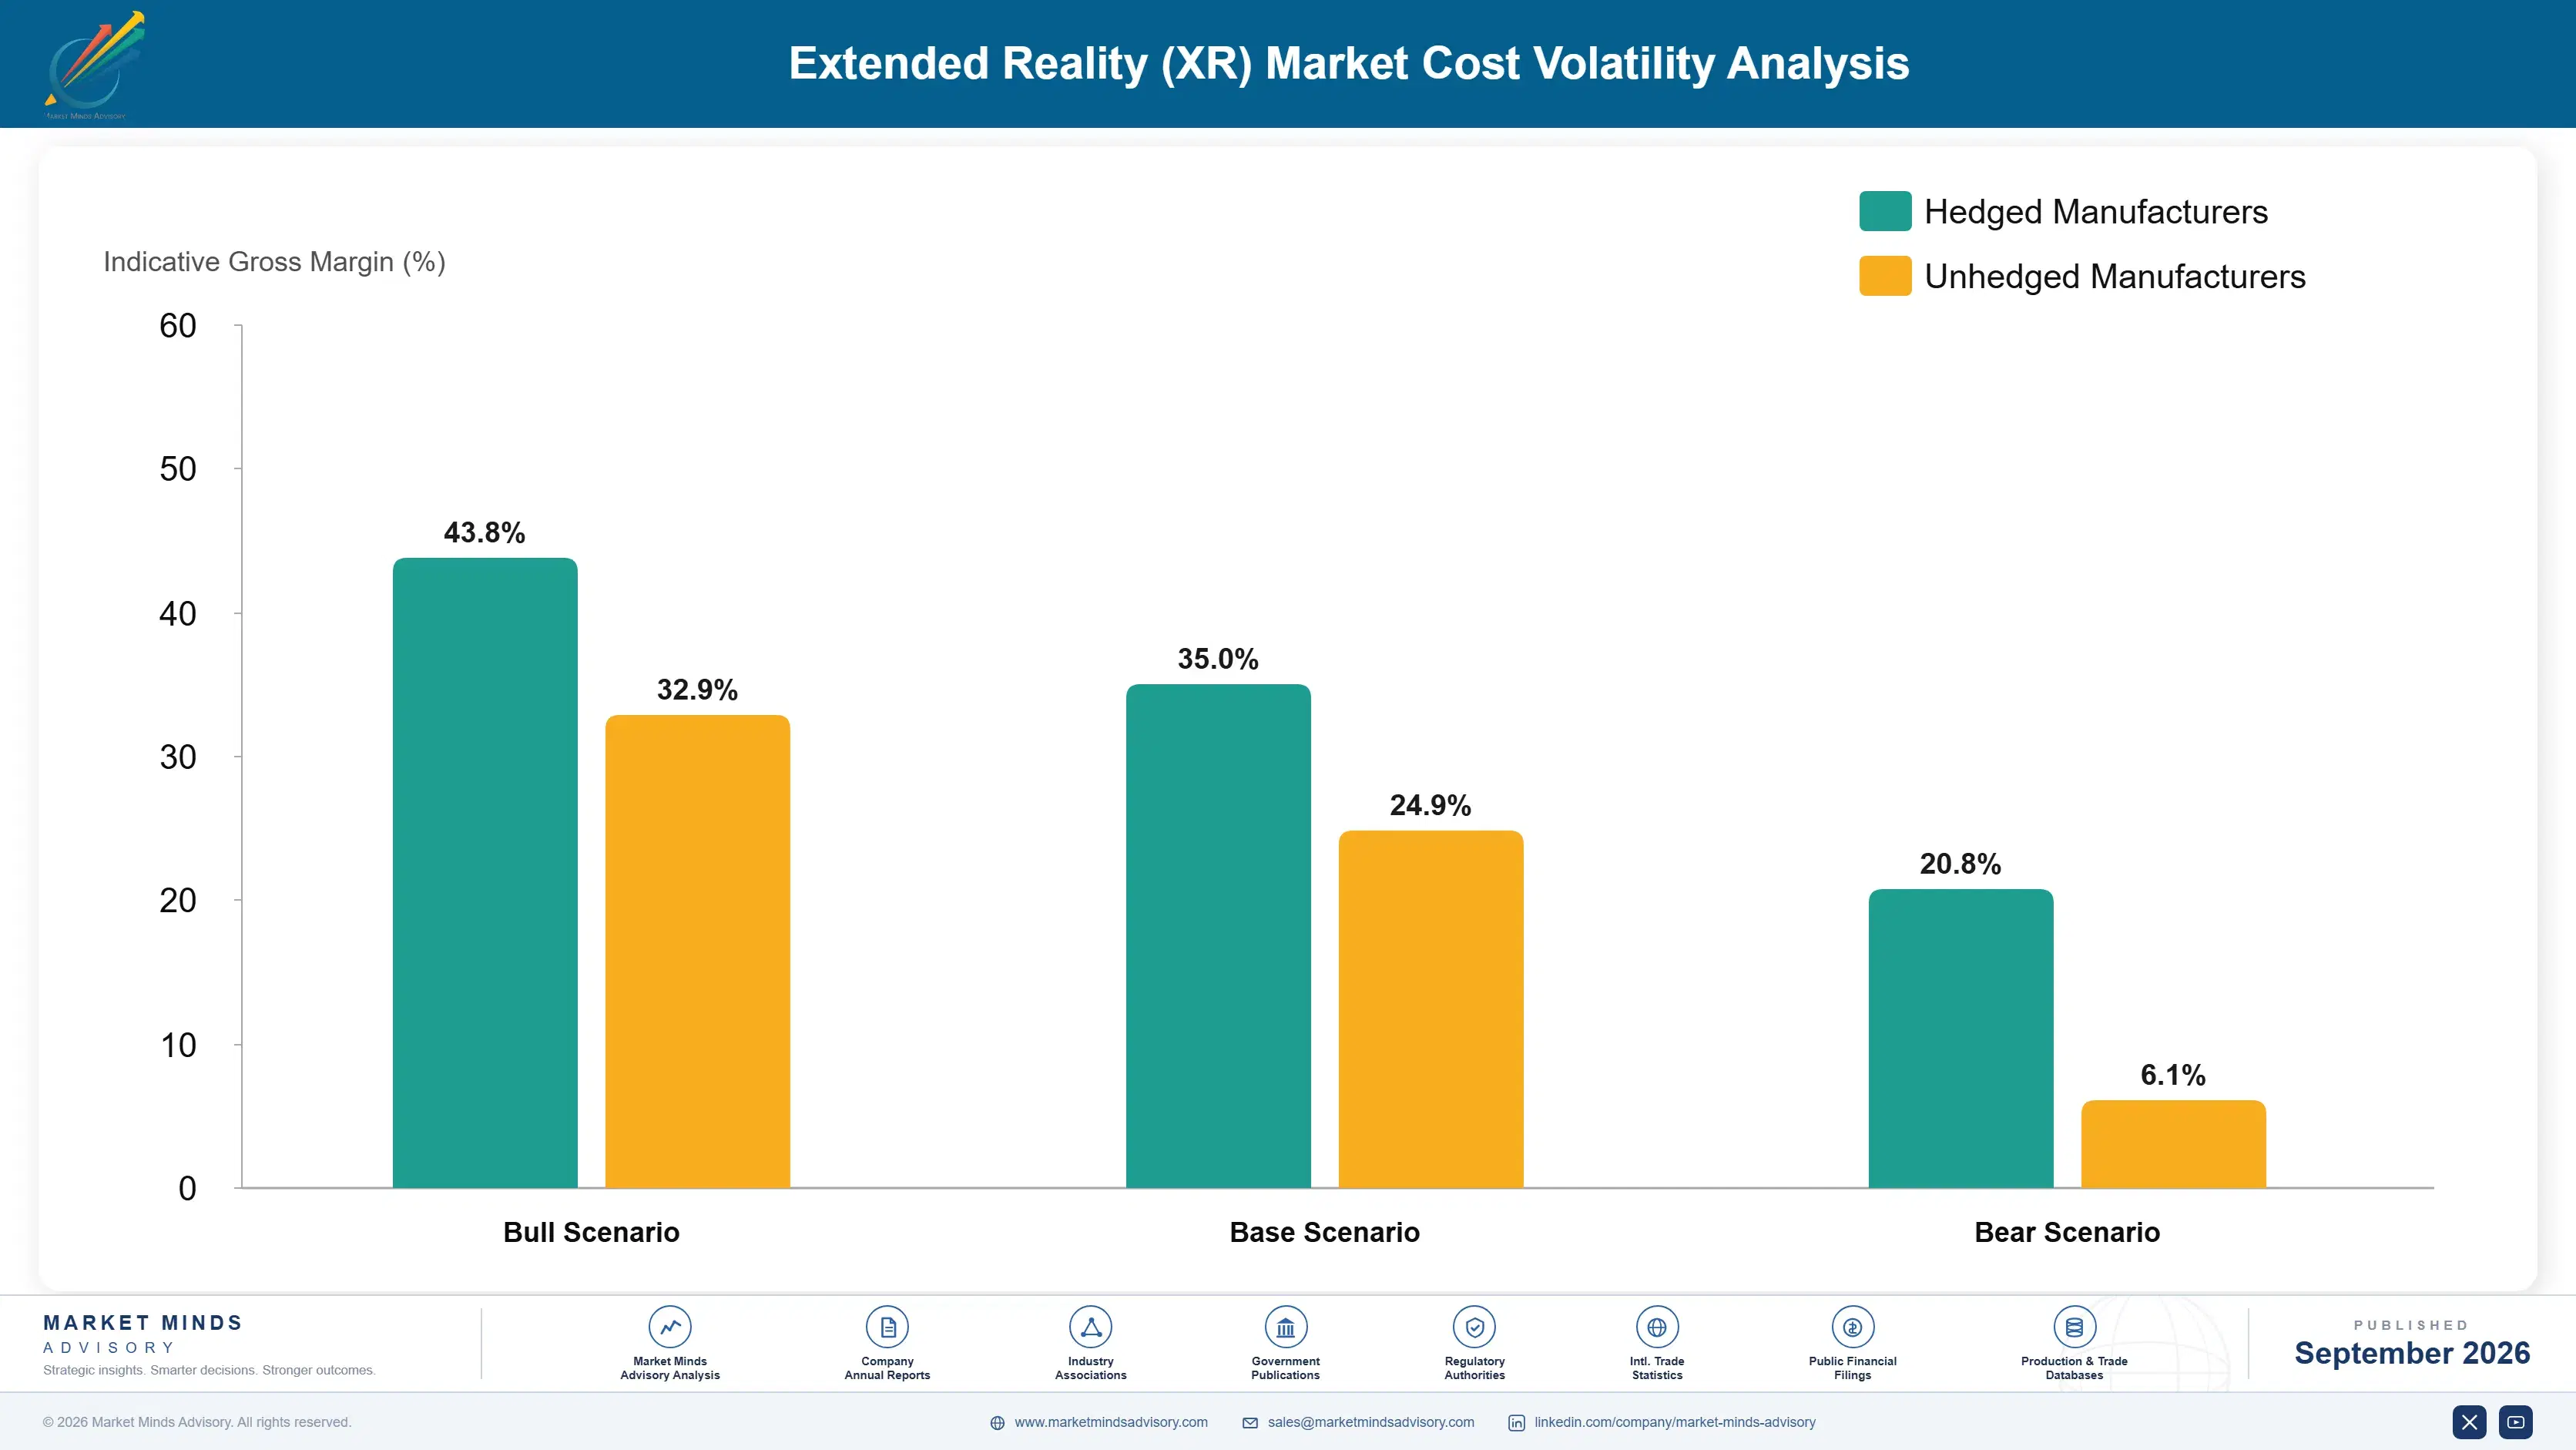
Display Components Set the Cost Floor

Certified micro-OLED displays and precision optical-lens components account for 40% to 48% of production cost for XR hardware manufacturers, sourced from specialized panel-fabrication intermediaries whose pricing tracks commodity-cycle trends rather than manufacturer-specific supply and demand. Smart-enhanced platforms carry an additional cost component tied to specialized machine-learning and scene-recognition infrastructure. That added cost varies by manufacturer depending on in-house versus outsourced sourcing arrangements.
The 2022 display-panel commodity tightening cycle illustrated component cost exposure directly. Industry data recorded micro-OLED pricing tightening as demand outpaced fabrication capacity across major producing regions, reducing alternatives for manufacturers. Manufacturers without diversified sourcing contracts absorbed significant cost increases, passing some cost through to vendors who had few alternative sourcing options at the time. Contract renegotiation followed across several distribution channels in subsequent quarters, per company-disclosed commodity-market tracking data.

Exposure falls hardest on smaller challenger manufacturers without long-term sourcing contracts or diversified supplier relationships, who must buy display components closer to spot pricing and absorb whatever margin compression results from commodity-market volatility. Larger diversified manufacturers with integrated in-house material qualification and geographic sourcing diversification smooth that volatility considerably better than smaller, less capitalized regional competitors currently exposed to full commodity-market swings globally.
extended-reality-market-cost-volatility-analysis-1788416239040

Lock Long-Term Display Component Supply Agreements

Manufacturers negotiating multi-year display-component supply agreements convert volatile commodity pricing into a planned production cost, protecting downstream vendor pricing that resists frequent adjustments across long manufacturer-partnership cycles. This favors larger manufacturers with existing relationships, but smaller manufacturers access similar terms through regional sourcing consortia annually. That access narrows the gap considerably. Margins stay protected accordingly.

Diversify Display Sourcing Across Suppliers

Manufacturers reduce single-supplier commodity exposure by sourcing micro-OLED and optical-lens capacity across multiple regional and specialized panel-fabrication networks rather than depending entirely on any single source for the majority of material capacity. That diversification smooths input availability across different regional commodity cycles, though it adds qualification complexity across each new supplier relationship established currently across every major sourcing region.

Invest in Integrated Display Production Capacity

Manufacturers reduce supplier dependence by acquiring direct integrated micro-OLED production capacity, capturing cost stability that pure spot-market material sourcing cannot achieve at comparable scale. This integration strategy suits larger manufacturers with meaningful capital access best, but delivers durable cost stability across multiple product segments and geographies over time, insulating margins from spot-market swings. Margins stay protected accordingly.

Portfolio Architecture for Margin Defence

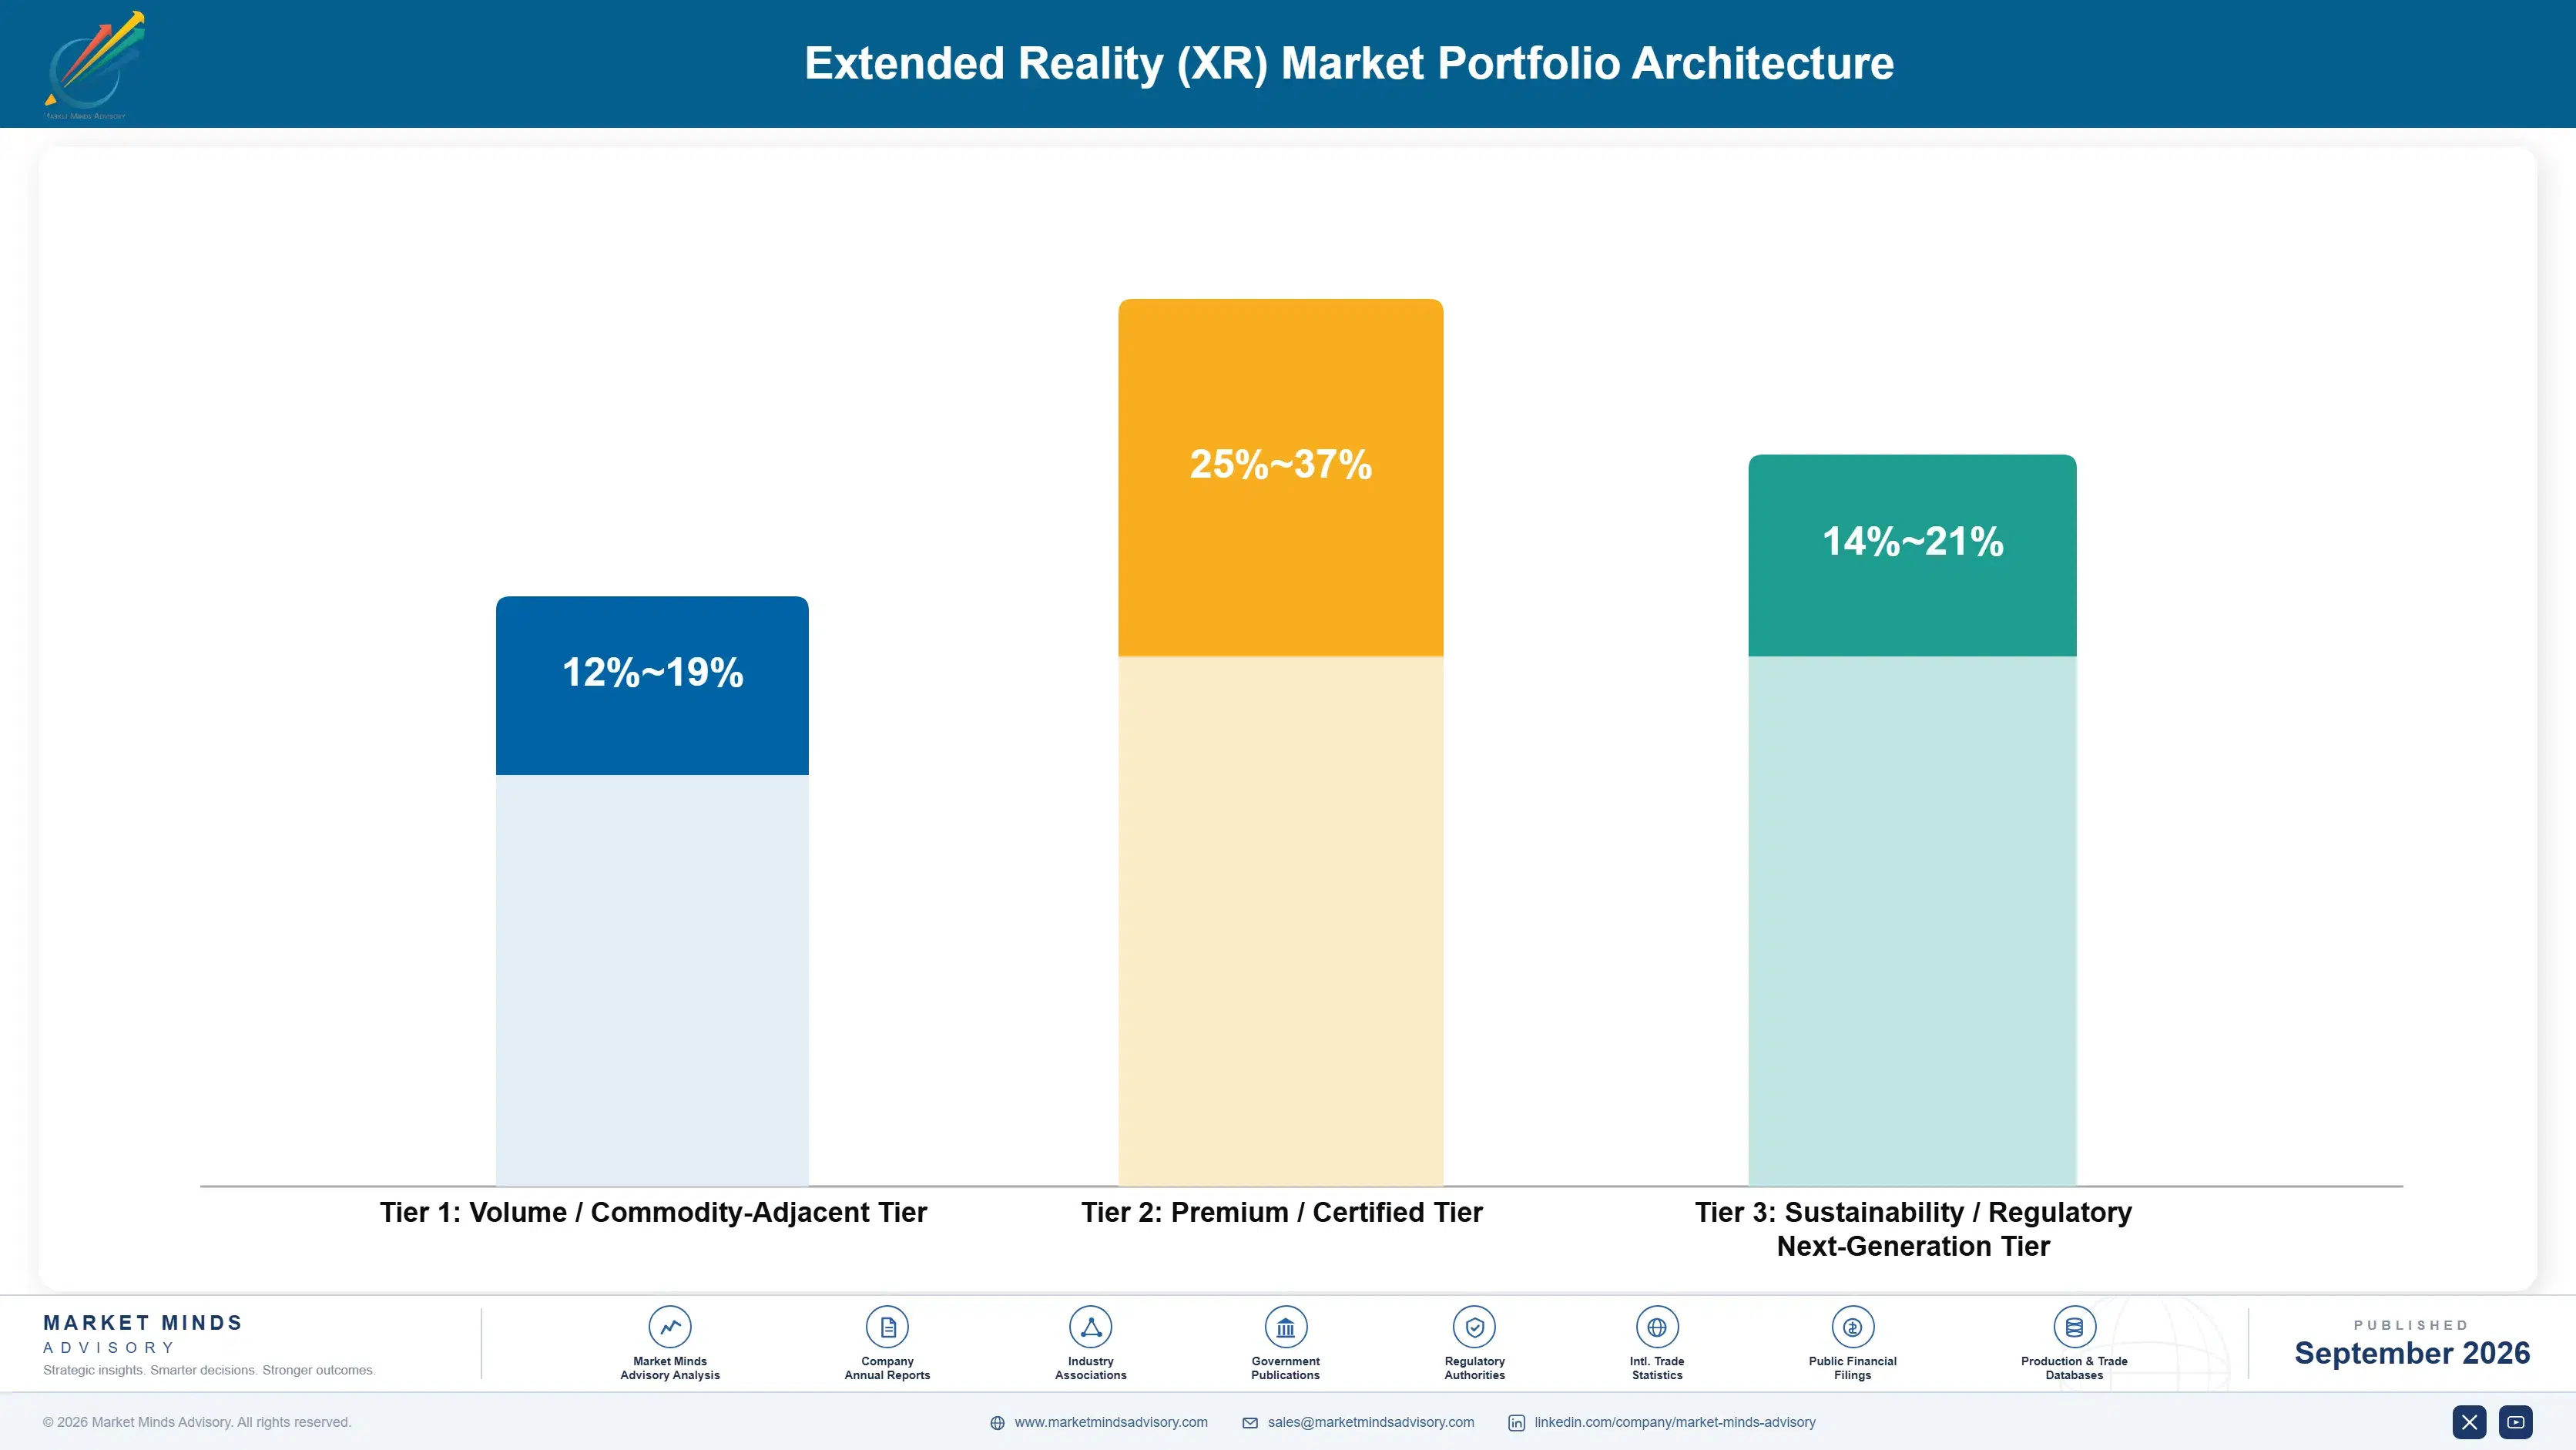
The extended reality portfolio splits into three tiers with meaningfully different margin economics. Volume VR and AR headset units, sold through established distribution channels on unit-price terms and delivered production volume, compete on cost and earn steady but thin margins. Smart-enhanced and enterprise formats earn substantially more, since documented content-adaptation precision and simulation-fidelity differentiation create switching costs standard formats cannot replicate quickly.
The tension for manufacturers is capital allocation between two economics. Volume standard units generate dependable cash flow that funds operations and hardware-engineering research, while smart-enhanced and enterprise capacity requires meaningful capital and technical investment before generating comparable returns at much higher margin. Manufacturers leaning entirely on standard formats risk losing share to faster-growing differentiated competitors, while premium investment risks underutilized capacity if certified-grade demand proves slower than currently projected globally.

High-value margin pools concentrate in smart-enhanced and enterprise services carrying genuine content-adaptation or engineering differentiation that standard formats cannot match. Frontier opportunity sits in combining verified production reliability with credible adaptation-software innovation, letting manufacturers capture premium fees from both mainstream and premium channels while retaining steady standard revenue simultaneously across every major enterprise segment globally.

Volume / Commodity-Adjacent Tier

VR and AR headset units sold through established distribution channels on unit-price terms and delivered production volume, priced close to underlying display and manufacturing costs with minimal differentiation between competing regional manufacturers.
Gross Margin: 12-19%

Premium / Certified Tier

Smart-enhanced and enterprise formats carrying documented content-adaptation testing and simulation-fidelity validation that commands sustained premiums over standard formats across major industrial and enterprise partners globally. Pricing reflects genuine differentiation rather than marketing positioning alone.
Gross Margin: 25-37%

Sustainability / Regulatory / Next-Generation Tier

Emerging next-generation neural-interface and low-power XR formats designed to serve increasingly demanding environmental and regulatory-compliance requirements ahead of continued industry evolution, though large-scale operating economics remain largely unproven at full commercial production volume today.
Gross Margin: 14-21%
extended-reality-market-portfolio-architecture-1788416239530

High-value Sub-segments and Strategic Watch-out

Smart and AI-Enhanced XR Platforms

Smart demand grows fastest at 28.7% annually and already commands pricing well above conventional formulations. Manufacturers investing in documented machine-learning infrastructure keep expanding, and rising deployment pressure should keep flow strong through the forecast period ahead broadly. Momentum should continue building steadily across every major enterprise segment nationwide.

Enterprise and Industrial XR Applications

Enterprise demand grows at a healthy 24.1% annually, driven by expanding simulation-fidelity formats, though industrial-grade infrastructure requirements limit how quickly new entrants can credibly compete in this technology-intensive segment currently commanding solid margins across most markets. Growth remains dependable here broadly across most established industrial markets currently underway.

Virtual Reality Headsets and Hardware

VR demand remains the largest format by unit volume, anchored by decades of established operator-preference specification across mainstream consumer deployments regionally. Margins stay steady but moderate, competing on unit-price terms and delivered production volume, anchoring meaningful category revenue overall. Demand stays resilient broadly across established consumer distribution channels nationally.

Augmented Reality Headsets and Hardware

AR demand faces gradual competitive pressure as alternative VR-format capacity increasingly matches comparable reliability outcomes at moderately lower switching cost, narrowing the addressable market for legacy AR-format products. Manufacturers concentrated purely here risk steady volume erosion absent meaningful diversification efforts. Diversification remains essential here for manufacturers avoiding further volume erosion.

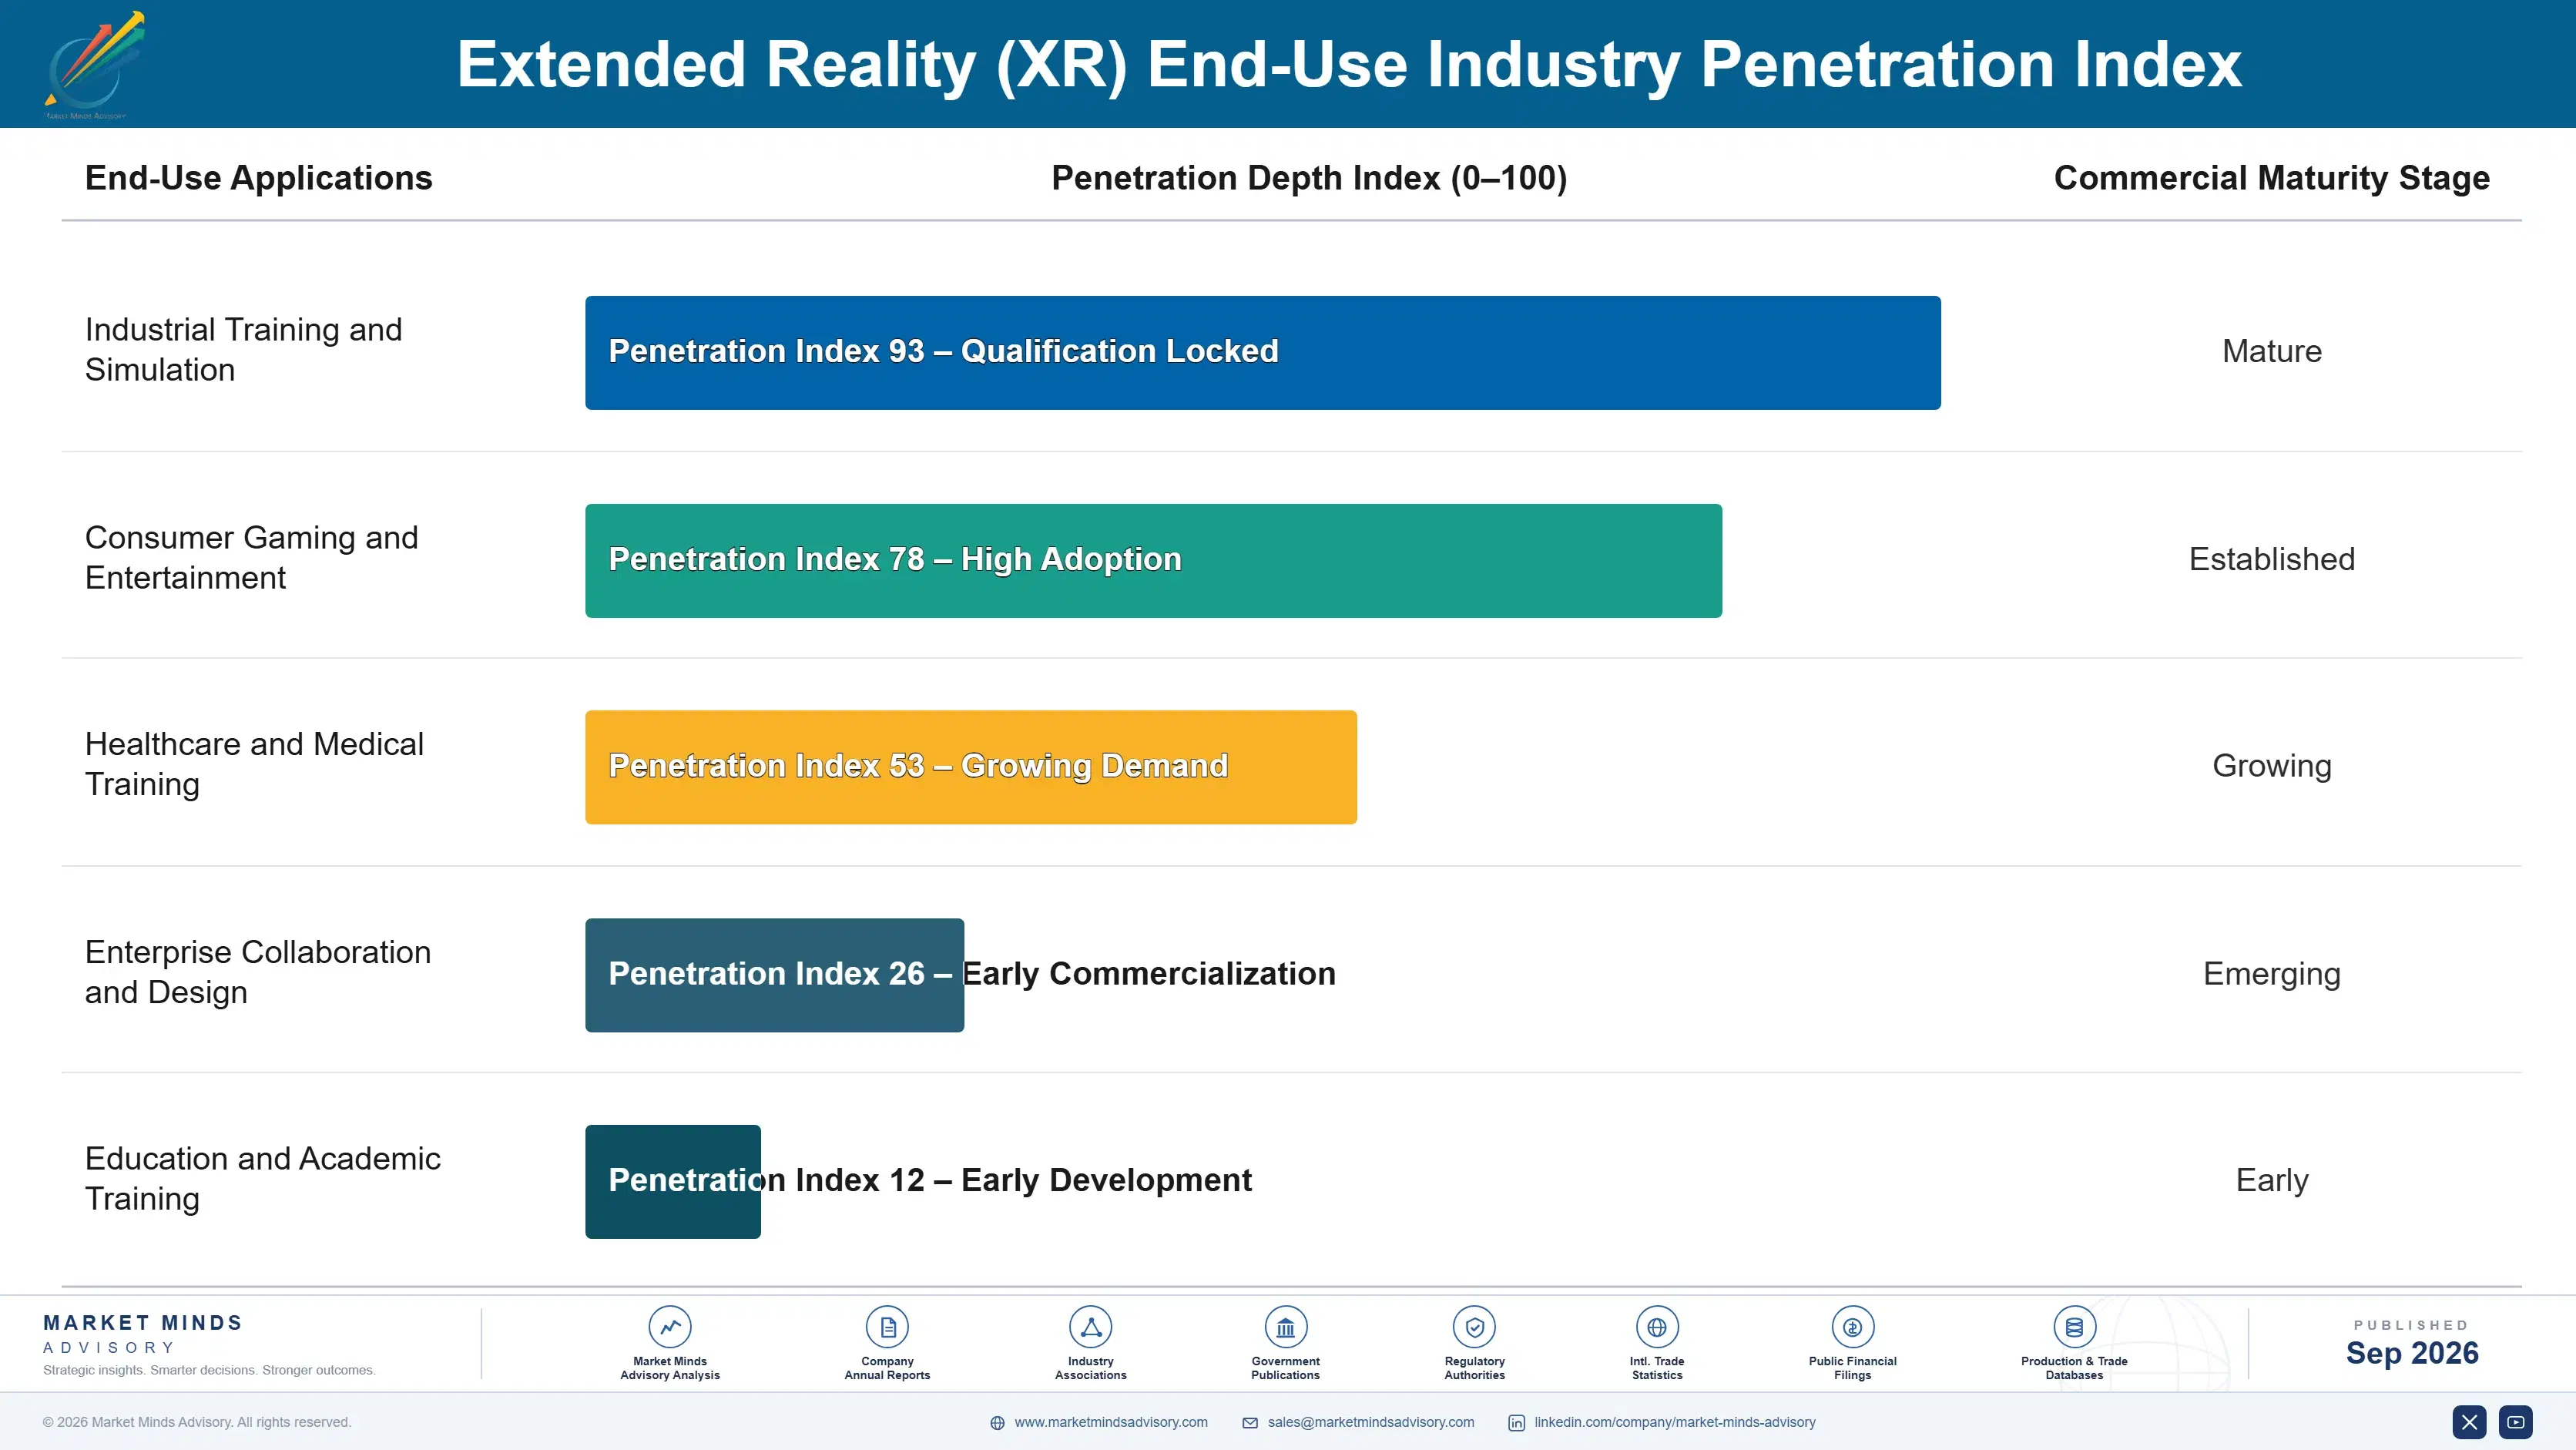
Why Vendor Contracts Run Long

Extended reality demand behaves like an annuity within vendor supply relationships, since vendors validate a specific manufacturer through extended field-testing and fidelity review and then source against that relationship for continuous enterprise operations rather than re-tendering routinely, given the disruption risk of switching mid-relationship. Budget-conscious consumer buyers behave differently, since purchase decisions follow individual budget cycles rather than pure continuous-catalogue supply commitment.
Stickiness varies sharply by operator type and mission criticality. Industrial training operators and enterprise developers rarely switch manufacturers once qualified for continuous fidelity-compliance operations, given the disruption risk involved in switching mid-relationship across a multi-year vendor-manufacturer cycle. Enterprise-format partners show different loyalty patterns, favoring manufacturers with documented simulation-fidelity depth over pure price-term depth. Budget-conscious consumer buyers sit in between, valuing reliable delivery without full continuous-catalogue manufacturer lock-in.

Buyer profiles are shifting generationally within both certified and standard channels specifically. Operator buyers increasingly treat documented content-adaptation-accuracy depth as a non-negotiable sourcing criterion rather than a routine procurement decision, a shift that favors manufacturers offering validated certified-grade supply over those competing purely on generic unit-price terms alone. That shift is visible in how large industrial operators structure new supply contracts globally.
extended-reality-market-end-use-penetration-index-1788416240019

Where Manufacturers Should Bet

These are among the four positions where our research anticipates prominent divergence between winners and laggards over the coming forecast period. Each is grounded in the demand model, the regulatory perimeter, and the announced capacity pipeline.
01 / SMART ENHANCEMENT PRIORITY

Build machine-learning infrastructure before operator demand outpaces supply

Smart-enhancement demand is growing well ahead of the wider market's pace, and premium products already command meaningful pricing above standard formats, yet most manufacturers still lack dedicated software-integration infrastructure at meaningful commercial scale globally. Manufacturers that invest now in smart capacity position ahead of continuing operator-driven demand growth across every major national enterprise market. Waiting risks ceding the category's fastest-growing and highest-margin segment permanently to competitors currently building that capability well ahead of broader industry adoption across the entire global market.
02 / ENTERPRISE FORMAT STRATEGY

Secure simulation-fidelity advantage before margins compress further

Manufacturers with dedicated enterprise capability command meaningful cost and margin advantages, and demand for that documented simulation-fidelity depth has grown considerably faster than the industry's dedicated technology capacity currently available across established manufacturers. Manufacturers that invest now in enterprise infrastructure lock in mandate certainty before competitors face comparable qualification exposure, since operator partners increasingly favor manufacturers offering validated simulation-fidelity performance. Every manufacturer relying purely on standard formulations risks missing this durable advantage entirely, ceding ground permanently to better-positioned rivals across the entire global market.
03 / DISPLAY SOURCING INVESTMENT

Build sourcing capability before standard-format pressure resurfaces further

Manufacturers offering documented display-sourcing engineering support command substantially stronger vendor retention than transactional manufacturers, and demand for that support has grown considerably faster than the industry's dedicated engineering capacity currently available across most established manufacturers today. Manufacturers that build engineering capability now capture deeper vendor relationships before competitors establish comparable sourcing infrastructure across major mainstream and premium channels. Every manufacturer relying purely on transactional selling risks missing this durable relationship advantage entirely, ceding ground permanently to better-prepared rivals across the entire global market.
04 / LONG-TERM VENDOR AGREEMENTS

Lock large vendor relationships before rankings shift further

Institutional industrial training networks increasingly prefer multi-year manufacturer platform commitments over spot procurement purchasing across continuous deployment and control programs, since supply disruption during active production seasons carries genuine operational continuity risk that manufacturers cannot comfortably absorb given tightly coordinated field scheduling. Manufacturers that secure these agreements now lock in demand and pricing before competitors capture the same vendor accounts, since vendors rarely switch manufacturers once a relationship has been validated. Every manufacturer relying purely on spot sales risks missing this durable revenue opportunity entirely across major markets.

Engagement Snapshot From the Field

A live engagement with an industry participant carrying material or product regulatory and market exposure ahead of a defining policy shift, showing how our research translates into a defensible multi-year portfolio strategy.
MARKET MINDS ADVISORY · CLIENT ENGAGEMENT SUMMARY
Extended Reality (XR) Producer Strategic Portfolio Review and Transition Roadmap 2026·Investment Scenario on Extended Reality (XR) Exposure Evaluation 2025-26
CLIENT PROFILE
A regional industrial training operator managing deployment across roughly twelve active simulation programs approached MMA while evaluating whether to convert its flagship XR specification from standard standalone headsets toward documented certified smart-enhanced infrastructure. The client reported annual procurement-budget revenue near USD 8 million, with standalone headsets representing roughly 65% of current spend (client-reported, unverified by MMA). Manufacturer data suggested strong latent demand for smart conversion.
STRATEGIC CHALLENGE
Management faced a strategic decision between a full conversion toward certified smart-enhanced platforms across its flagship simulation programs or a phased approach limited to new-program launches only. The finance team worried full conversion would raise upfront costs given software-certification pricing, while the operations team worried a phased approach would leave the flagship program portfolio exposed to fidelity risk from tightening regional training requirements.
MMA APPROACH
MMA benchmarked conversion revenue outcomes and typical cost impacts across comparable operators that had completed similar smart transitions, assessed the client's existing operational flexibility relative to alternative software-integration requirements, and evaluated which manufacturer partnerships offered the most commercially attractive combination of revenue and margin positioning given the client's program scale.
KEY FINDINGS
  1. Comparable operators that converted flagship simulation programs toward certified smart-enhanced platforms captured content-adaptation gains that operators relying on standalone headsets missed at a meaningfully higher rate during recent procurement cycles.
  2. Conversion costs, while measurable, were considerably smaller than the content-adaptation gains documented across comparable operators that completed similar smart transitions across comparable procurement programs.
  3. The client's existing operational flexibility aligned closely with alternative software-integration requirements, reducing the incremental conversion investment required compared with operators needing extensive requalification.
  4. A phased conversion approach targeting the client's highest-priority flagship simulation program first allowed validation of the enhancement-margin tradeoff before committing to broader portfolio-wide conversion.
CLIENT PROFILE
A regional industrial training operator managing deployment across roughly twelve active simulation programs approached MMA while evaluating whether to convert its flagship XR specification from standard standalone headsets toward documented certified smart-enhanced infrastructure. The client reported annual procurement-budget revenue near USD 8 million, with standalone headsets representing roughly 65% of current spend (client-reported, unverified by MMA). Manufacturer data suggested strong latent demand for smart conversion.
STRATEGIC CHALLENGE
Management faced a strategic decision between a full conversion toward certified smart-enhanced platforms across its flagship simulation programs or a phased approach limited to new-program launches only. The finance team worried full conversion would raise upfront costs given software-certification pricing, while the operations team worried a phased approach would leave the flagship program portfolio exposed to fidelity risk from tightening regional training requirements.
MMA APPROACH
MMA benchmarked conversion revenue outcomes and typical cost impacts across comparable operators that had completed similar smart transitions, assessed the client's existing operational flexibility relative to alternative software-integration requirements, and evaluated which manufacturer partnerships offered the most commercially attractive combination of revenue and margin positioning given the client's program scale.
KEY FINDINGS
  1. Comparable operators that converted flagship simulation programs toward certified smart-enhanced platforms captured content-adaptation gains that operators relying on standalone headsets missed at a meaningfully higher rate during recent procurement cycles.
  2. Conversion costs, while measurable, were considerably smaller than the content-adaptation gains documented across comparable operators that completed similar smart transitions across comparable procurement programs.
  3. The client's existing operational flexibility aligned closely with alternative software-integration requirements, reducing the incremental conversion investment required compared with operators needing extensive requalification.
  4. A phased conversion approach targeting the client's highest-priority flagship simulation program first allowed validation of the enhancement-margin tradeoff before committing to broader portfolio-wide conversion.
RECOMMENDED STRATEGY
Phase 1: Phase 1 (0 to 6 months): Convert the flagship simulation program to validate enhancement and margin assumptions under prevailing real market conditions. Phase 2: Phase 2 (6 to 18 months): Expand conversion across the remaining program portfolio based on validated performance from the initial transition. Phase 3: Phase 3 (18 to 36 months): Formalize long-term certified smart-enhanced vendor agreements to support continued portfolio scale and enhancement positioning.
OUTCOME
The client completed its flagship simulation program conversion and captured a significant content-adaptation improvement within the first six months of the engagement, exceeding initial projections by a wide margin. The client is now extending conversion across its remaining program portfolio based on the initial transition's documented enhancement performance (client-reported, unverified by MMA).

Frequently Asked Questions

Foundational context covering the market sizes, CAGR, scope, country, region and competition that inform every finding below. This section is provided to cover basics and most often pre-purchase conversations, answered from the MMA Primary Research Dataset.

What is the current size of the Extended Reality (XR) Market?

The extended reality market reached USD 37.25 billion in manufacturing and platform revenue in 2026, based on MMA Primary Research Dataset findings. Growth increasingly reflects smart-enhanced demand rather than conventional standalone sales alone.

How large will the Extended Reality (XR) Market be by 2036?

MMA's base case projects the market reaching USD 170.08 billion by 2036, an incremental opportunity of roughly USD 132.83 billion over the 2026 to 2036 forecast period.

What is the CAGR for the Extended Reality (XR) Market 2026 to 2036?

The base case CAGR is 16.4%, with a bull case of 17.8% and a bear case of 15.0% depending on smart-enhanced conversion pace and display-component-cost conditions.

Which segment is growing fastest?

Smart and AI-enhanced XR platforms lead at a 28.7% CAGR, well ahead of the overall market rate, as manufacturers scale documented machine-learning infrastructure. This segment continues outpacing every other category.

Who are the major companies in the Extended Reality (XR) Market?

Leading participants include Meta, Apple, Microsoft, Sony, and HTC, with competition remaining active across every segment, Meta and Apple holding a commanding combined lead. Sony and HTC round out the current top-five vendor cohort.

Which country is growing fastest?

China leads country-level growth at 22.8% annually, driven by its rapidly expanding hardware manufacturing base. Domestic manufacturers are scaling capacity to meet this rapidly growing demand.

Report Segmentation Architecture

The full report scope spans multiple orthogonal segmentation dimensions, with cross-tabulated demand data provided for each dimension pair. Coverage extends further to regional breakdowns, trend trajectories, and the competitive detail needed to support segment-level decision-making.

By Device Function and Adaptation Technology Type

  • Virtual Reality Headsets and Hardware
  • Augmented Reality Headsets and Hardware
  • Mixed Reality Hardware
  • Enterprise and Industrial XR Applications
  • Smart and AI-Enhanced XR Platforms
  • XR Content Development and Support Services

By End-Use Industry

  • Industrial Training and Simulation
  • Consumer Gaming and Entertainment
  • Healthcare and Medical Training
  • Enterprise Collaboration and Design
  • Education and Academic Training

By Commercial Dimension

  • Direct Consumer and Enterprise Sales
  • Distributor and Systems-Integrator Channels
  • Long-Term Enterprise Service Contracts
  • Government and Institutional Tender Agreements

By Region

  • North America
  • Western Europe
  • East Asia
  • South Asia and Pacific
  • Latin America
  • Middle East and Africa
  • Eastern Europe

Scope, Methodology, and Coverage

Every figure in this report is reproducible from documented input assumptions. The scope below maps the historical period, the forecast horizon, the segmentation dimensions, and the countries covered, alongside the underlying primary and qualitative methodology.
Historical Period
2020 to 2025
Forecast Period
2026 to 2036
Base Year
2025 (USD billions; MMA Primary Research Dataset, September 2026)
Market Definition
The extended reality market covers manufacturing and platform revenue across virtual reality headsets and hardware, augmented reality headsets and hardware, mixed reality hardware, enterprise and industrial XR applications, smart and AI-enhanced XR platforms, and XR content development and support services. It excludes general-purpose smartphone camera-based AR filters and standalone 2D display hardware outside documented XR-device scope.
Quantitative Units
USD billions (current prices); manufacturing and platform revenue generated where applicable
Segmentation Dimensions
By Device Function and Adaptation Technology Type; By End-Use Industry; By Commercial Dimension; By Region
Regions Covered
North America, Western Europe, East Asia, South Asia and Pacific, Latin America, Middle East and Africa, Eastern Europe
Countries Covered
United States, Canada, Germany, United Kingdom, France, Netherlands, China, Japan, South Korea, India, Australia, Singapore, Brazil, Mexico, Colombia, Chile, Saudi Arabia, South Africa, Poland, and additional markets relevant to this sector
Key Companies Profiled
Meta Platforms Inc, Apple Inc, Microsoft Corporation, Sony Group Corporation, HTC Corporation, Valve Corporation, Magic Leap Inc, Varjo Technologies Oy, Pico Interactive, Samsung Electronics Co Ltd, Qualcomm Incorporated, Lenovo Group Limited, Vuzix Corporation, RealWear Inc, Xreal Inc, Rokid Corporation, Unity Software Inc, PTC Inc, Niantic Inc, Epic Games Inc
Quantitative Methodology
Primary survey, n=3,800 respondents, Q4 2025, six countries; demand-side model with trade association cross-validation
Qualitative Methodology
47 expert interviews, Q4 2025; applied to validate demand model assumptions, identify emerging dynamics, and assess competitive positioning
Report Format
PDF and XLSX data workbook (Word format preview document)
Publisher
Market Minds Advisory
Report Code
MMA-2026-TEC-105
Published
September 2026
Contact
sales@marketmindsadvisory.com | www.marketmindsadvisory.com

Purchase the full Extended Reality (XR) Market Report (2026 to 2036).

The full MMA Extended Reality report sizes the market across six device-function segments, five end-use industries, four commercial distribution models, and all seven global regions through 2036. It profiles twenty participants on a consistent basis of manufacturing revenue across standard, smart-enhanced, and enterprise formats, scoring each on documented hardware-engineering depth, catalogue scale, and platform-network reach. Scenario models quantify how industrial-training mandates, enterprise-simulation growth, and display-component-cost conditions move both category revenue and margin. The report includes display-component cost modelling, a smart-enhancement benchmark, and enterprise pathway assessment built for immersive technology systems strategy teams.
Six-segment demand model with certification-adjusted pricing
Display component cost volatility and supplier hedging modelling
Smart-enhancement benchmarking and operator readiness model
Twenty-company competitive profiling on consistent program basis
Country-level demand map across all seven global regions
Enterprise training and data-privacy regulatory compliance assessment

Built For The People Who Decide

From boardroom strategy to bench-side execution, this report is read cover-to-cover by leaders shaping the next decade of their industry, turning demand scenarios, market dynamics and valuation benchmarks into decisions.
CXOs/ Presidents/ VPs/ Managers
M&A and Corporate Development
Strategy Teams and R&D Heads
Procurement and Product Directors
Regulatory and Compliance Leaders
Investor Relations and Equity Analysts