Market Minds Advisory
EUV Mask Inspection and Pellicle Monitoring Systems Market

EUV Mask Inspection and Pellicle Monitoring Systems Market: EUV Mask Inspection and Pellicle Monitoring: Monopoly Positions, Actinic Source Barriers and the Cost of a Printed Defect

A single mask defect printing across production lots destroys many times what the inspection tool cost, which is why this market has near monopoly suppliers and buyers who barely negotiate.

Lead Analyst

Published

September 2026

Make Smarter Decisions with Customized Research Insights

Request a free sample report and evaluate market opportunities, growth trends, and competitive dynamics relevant to your business needs.

2025 MARKET VALUE$1.3BMarket Size 2025
2036 FORECAST VALUE$5.8BBase Case , 2026 to 2036
CAGR 2026 TO 203614.6 %Bull 15.8% / Bear 13.4%
INCREMENTAL OPPORTUNITY$4.3BNet 10- year value creation
EXPANSION MULTIPLE3.91x2036 value over 2026 base
Strategic Levers
M&A Pipeline
Regional Outlook
Country Rankings
Competitive Intelligence
Segmental Deep-dive
Call-Us : 91 93563 13602

Executive Snapshot and Market Trajectory.

A defect that prints from a mask across production lots destroys around USD 12 million in value, against a mask set costing roughly USD 340,000 and inspection tools costing a fraction of the loss they prevent. Price is not what these buyers evaluate.
Pellicle monitoring grows fastest at 21.9%, half again the market rate of 14.6%, because a membrane degrading during exposure is invisible without measurement and its failure exposes the mask directly. Aerial image qualification follows at 18.4% as high numerical aperture optics change mask geometry. East Asia takes 59% of value, and Taiwan is the fastest-growing country market at 18.6%. Mask infrastructure follows scanner deployment rather than leading it. Nothing here scales with wafer volume.
Concentration is extreme at roughly 91% across the top five on measured system revenue, and only 2 suppliers can deliver actinic patterned mask inspection at all. Building one requires an extreme ultraviolet source, which is the same barrier that limited lithography suppliers to a single company. Nothing about that is going to change quickly. Manufacturers negotiate delivery slots rather than prices. Two suppliers set what the world can buy.
Market Definition
This market covers inspection, monitoring and qualification systems for extreme ultraviolet photomasks and pellicles, spanning actinic patterned mask inspection, actinic blank inspection, pellicle integrity and transmission monitoring, aerial image measurement and qualification, mask repair systems, and in-fab mask handling and contamination control. Revenue is measured as system shipment and attributable service value at supplier level. Lithography scanners, mask writing equipment, wafer inspection and metrology, photomask blanks and pellicle membranes themselves, and deep ultraviolet mask tooling are excluded.
Base Year Value
$1.3B in 2025 (MMA Primary Research Dataset, September 2026)
Forecast Period
2026 to 2036, eleven discrete annual values
CAGR
14.6% base case. Bull 15.8%. Bear 13.4%.
Fastest Growth Segment
Pellicle Integrity and Transmission Monitoring: 21.9% CAGR
Fastest Growth Country
Taiwan: 18.6% CAGR
Fastest Growth Region
South Asia and Pacific: 16.6% CAGR
Largest Region
East Asia: 59% of 2025 global value
Market Leaders
Lasertec, Carl Zeiss SMT, KLA, Applied Materials and Hitachi High-Tech lead on measured extreme ultraviolet mask inspection and pellicle monitoring system revenue. Source: MMA Primary Research Dataset, July 2026.
Primary Survey
n=3,800 procurement and R&D decision-makers, Q4 2025, six countries
Methodology
Demand-side build-up, cross-validated against public data, 47 expert interviews

EUV Mask Inspection and Pellicle Monitoring Systems Market Forecast Scenarios

euv-mask-inspection-and-pellicle-monitoring-system-size-forecast-scenario-1788423731226
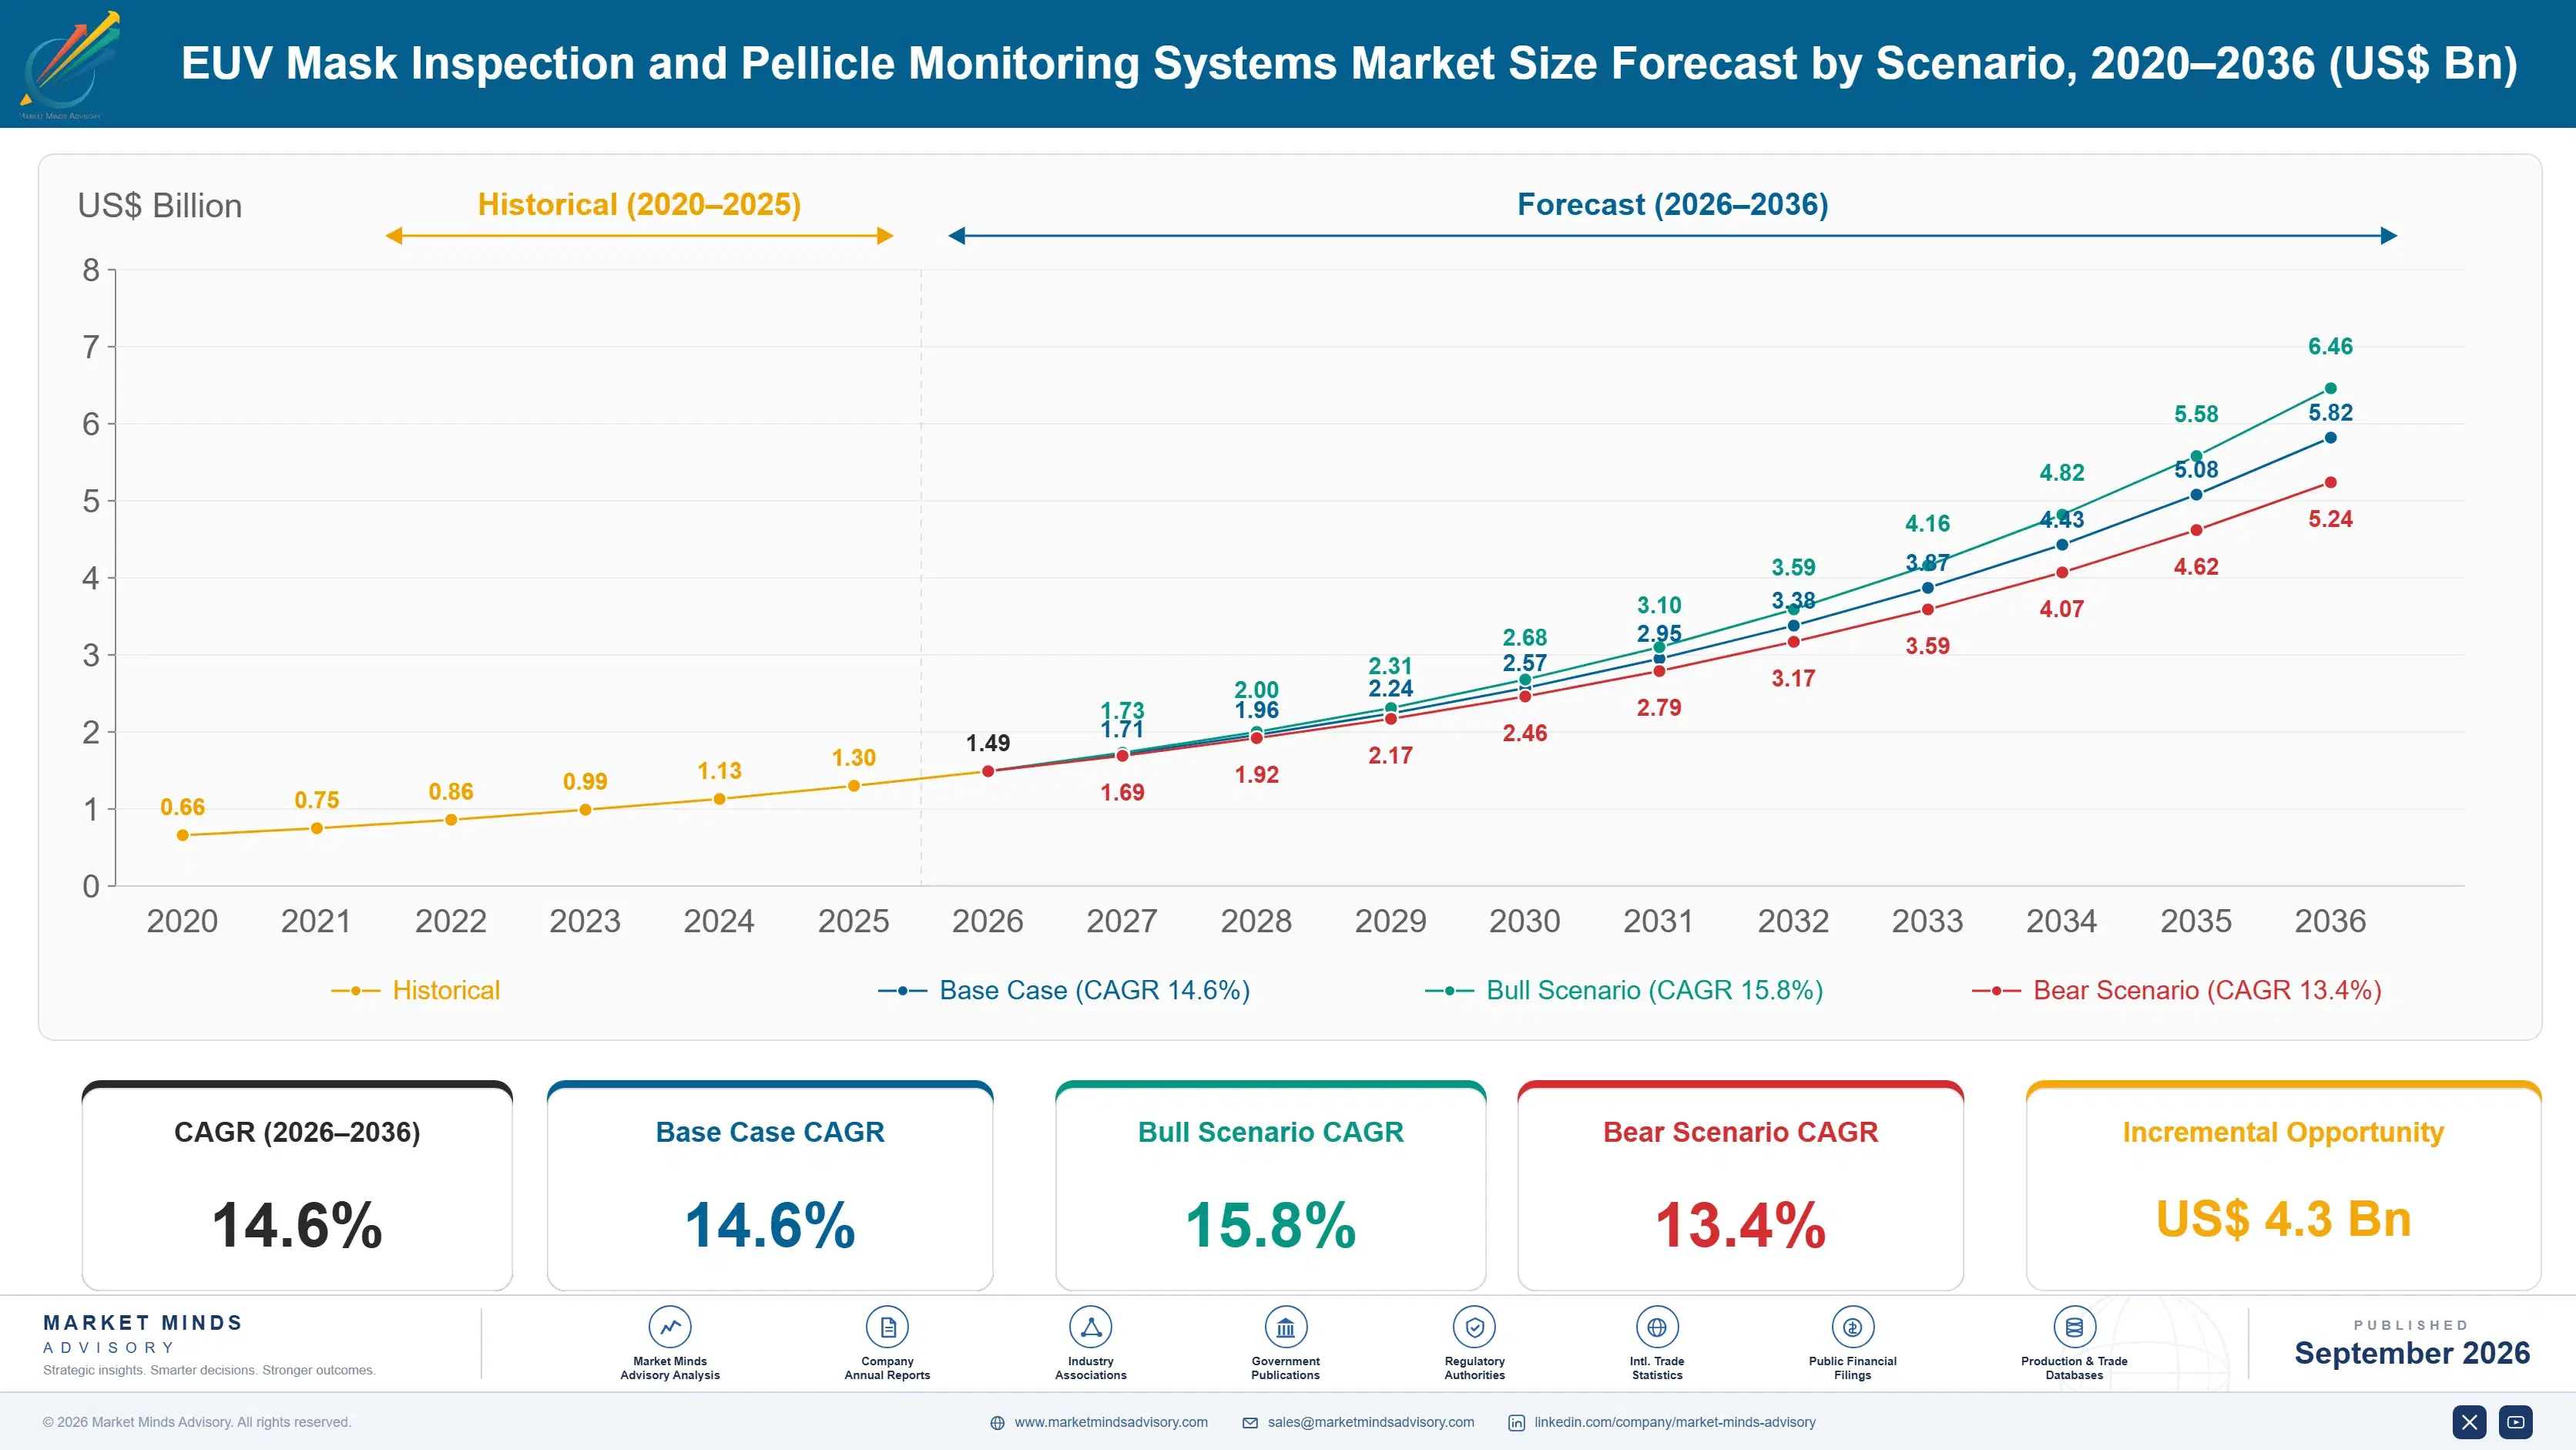
Growth ran at 13.4% from 2020 to 2025 and it tracked extreme ultraviolet lithography deployment closely, because mask infrastructure is bought against scanner installations rather than independently. Early adoption ran without pellicles, which manufacturers accepted while membranes could not survive source power. Pellicle qualification during the period created a monitoring requirement that had not previously existed and that nobody had budgeted for.
The base case at 14.6% rests on three mechanisms. Pellicle deployment is now standard on production masks, and a membrane degrading in place is undetectable without measurement while its failure exposes a mask worth USD 340,000 to particle contamination. High numerical aperture systems change mask geometry through anamorphic optics and half-field exposure, which invalidates existing qualification assumptions. Third, mask sets multiply as device complexity rises, and every additional mask carries its own inspection and requalification burden.
The bull case at 15.8% assumes high numerical aperture adoption proceeds on announced timetables across multiple manufacturers, since each transition requires new qualification capability rather than reusing existing tools. The bear case at 13.4% is that lithography deployment slows and mask infrastructure follows it down, which is the only real exposure this market carries given how few customers exist.

The Tool Costs Less Than One Escaped Defect

The economics here are unusually simple and unusually severe. A photomask carries the pattern printed onto every wafer through a scanner, so a mask defect reproduces on every device until noticed. That escape costs around USD 12 million in scrapped and downgraded material by the time it is caught, against a mask set worth USD 340,000 and inspection equipment that costs a fraction of a single incident.
TOP FIVE CONCENTRATION91%Extremely concentrated with near monopoly positions in key tools
MASK REPLACEMENT COSTUSD 340,000Value of a single extreme ultraviolet photomask set
PELLICLE TRANSMISSION LOSS9%Light lost passing through a membrane in each direction
QUALIFIED TOOL SUPPLIERS2 suppliersFirms able to deliver actinic patterned mask inspection
MASK REQUALIFICATION INTERVAL740 wafersExposures before a mask is inspected again in production
DEFECT ESCAPE COSTUSD 12mValue destroyed when a mask defect prints across lots
Actinic inspection is the technical heart of the problem and the reason this market is so concentrated. Inspecting a mask properly means illuminating it at the wavelength the scanner uses, so the tool needs its own extreme ultraviolet source. That is the barrier that reduced lithography scanner suppliers to one company, and it has limited actinic patterned inspection to 2 suppliers with no credible third entering.
Pellicles changed the picture again. A membrane over the mask keeps particles off the pattern, costs about 9% of light each way, and must survive source power that destroys most materials. Now they are standard, a new problem appeared: degradation during exposure is invisible without measurement, and failure exposes the mask. Monitoring that is the fastest growing requirement in this market.
"Nobody in this market argues about price, because the tool is cheaper than the incident it prevents by an order of magnitude. What they argue about is delivery slots, and there are two suppliers who can build the thing at all."
Director, Lithography and Mask Infrastructure Practice · MMA Technology Practice · September 2026

Market Trends

Pellicle Deployment Creates a Monitoring Requirement

Extreme ultraviolet pellicles took more than a decade to reach production readiness because a membrane thin enough to pass light also has to survive source power that destroys most materials. Now that they are standard on production masks, a new problem has surfaced: degradation happens during exposure and is undetectable without measurement, while failure exposes a mask worth USD 340,000 to the particles the membrane was preventing. Monitoring transmission, uniformity and mechanical integrity has become a distinct requirement growing at 21.9%, and it did not exist as a category three years ago.
Market Impact: Escapes cost USD 12 million each
High Numerical Aperture Optics Invalidate Existing Qualification

Anamorphic optics and half-field exposure change the relationship between mask geometry and printed image in ways that existing aerial image measurement was not designed to evaluate. Qualification tools calibrated for conventional extreme ultraviolet do not simply scale, which forces new capability rather than software updates on installed equipment. Aerial image measurement accordingly grows at 18.4%, the second fastest here. Each manufacturer adopting the new generation requires its own qualification infrastructure, which produces demand that arrives with the transition rather than continuously. Demand arrives in steps rather than continuously, and it arrives years apart.
Market Impact: Requalified every 740 exposures

Market Opportunities and Growth Drivers

Defect Escape Cost Removes Price From the Evaluation

A mask defect printing across production lots destroys roughly USD 12 million before it is identified, and requalification intervals near 740 wafer exposures exist precisely to bound that exposure. Inspection equipment costs a fraction of a single incident, which makes the capital argument trivial and moves the evaluation entirely onto capability, delivery timing and support. Manufacturers negotiate delivery slots rather than prices. Suppliers who understand that the constraint is availability rather than affordability structure their commercial conversations completely differently from equipment vendors elsewhere. Availability rather than affordability sets the conversation.
Market Impact: Constrained to 2 tool suppliers

Mask Set Counts Rise With Device Complexity

Advanced logic devices require more mask layers as design complexity grows, and each additional extreme ultraviolet layer carries its own mask, its own pellicle, its own inspection burden and its own requalification schedule. Mask infrastructure demand therefore rises faster than wafer volumes do, since the work scales with layer count rather than with output. Every mask also needs periodic requalification during production, which turns a capital purchase into recurring tool utilisation. That distinction matters commercially because it supports service revenue that scanner-linked equipment purchases alone would not. Service revenue follows the installed base rather than construction.
Market Impact: Fewer than 8 major customers

Market Restraints and Challenges

Supplier Capacity Rather Than Demand Sets Market Size

With only 2 suppliers able to build actinic patterned inspection tools, annual shipments reflect what those suppliers can deliver rather than what manufacturers would buy. The root cause is the extreme ultraviolet source requirement, which limits the pool of organisations capable of building the equipment at all. Commercially this caps growth regardless of how urgent demand becomes, and manufacturers schedule fab readiness around delivery slots. Suppliers mitigate through capacity expansion and by extending the capability of installed tools, though neither addresses the underlying constraint quickly. Neither addresses the source constraint quickly.
Market Impact: Fastest segment at 21.9% growth

Customer Count Is Small Enough to Concentrate All Risk

A handful of leading logic and memory manufacturers plus a small number of mask shops constitute the entire addressable base, which means one customer deferring a fab programme moves the whole market. The root cause is that extreme ultraviolet lithography is affordable only at the very largest scale, and that will not change. Commercially this produces revenue that is lumpy and difficult to forecast beyond announced construction. Suppliers mitigate through service and requalification revenue against the installed base, which continues when tool purchases pause. Requalification revenue is the only genuine buffer available.
Market Impact: Second fastest at 18.4% growth
3 additional market trends, 4 additional growth drivers, and 2 additional restraints and challenges are covered in the full report. Contact sales@marketmindsadvisory.com to access the complete intelligence.

Segment CAGR and Growth Architecture

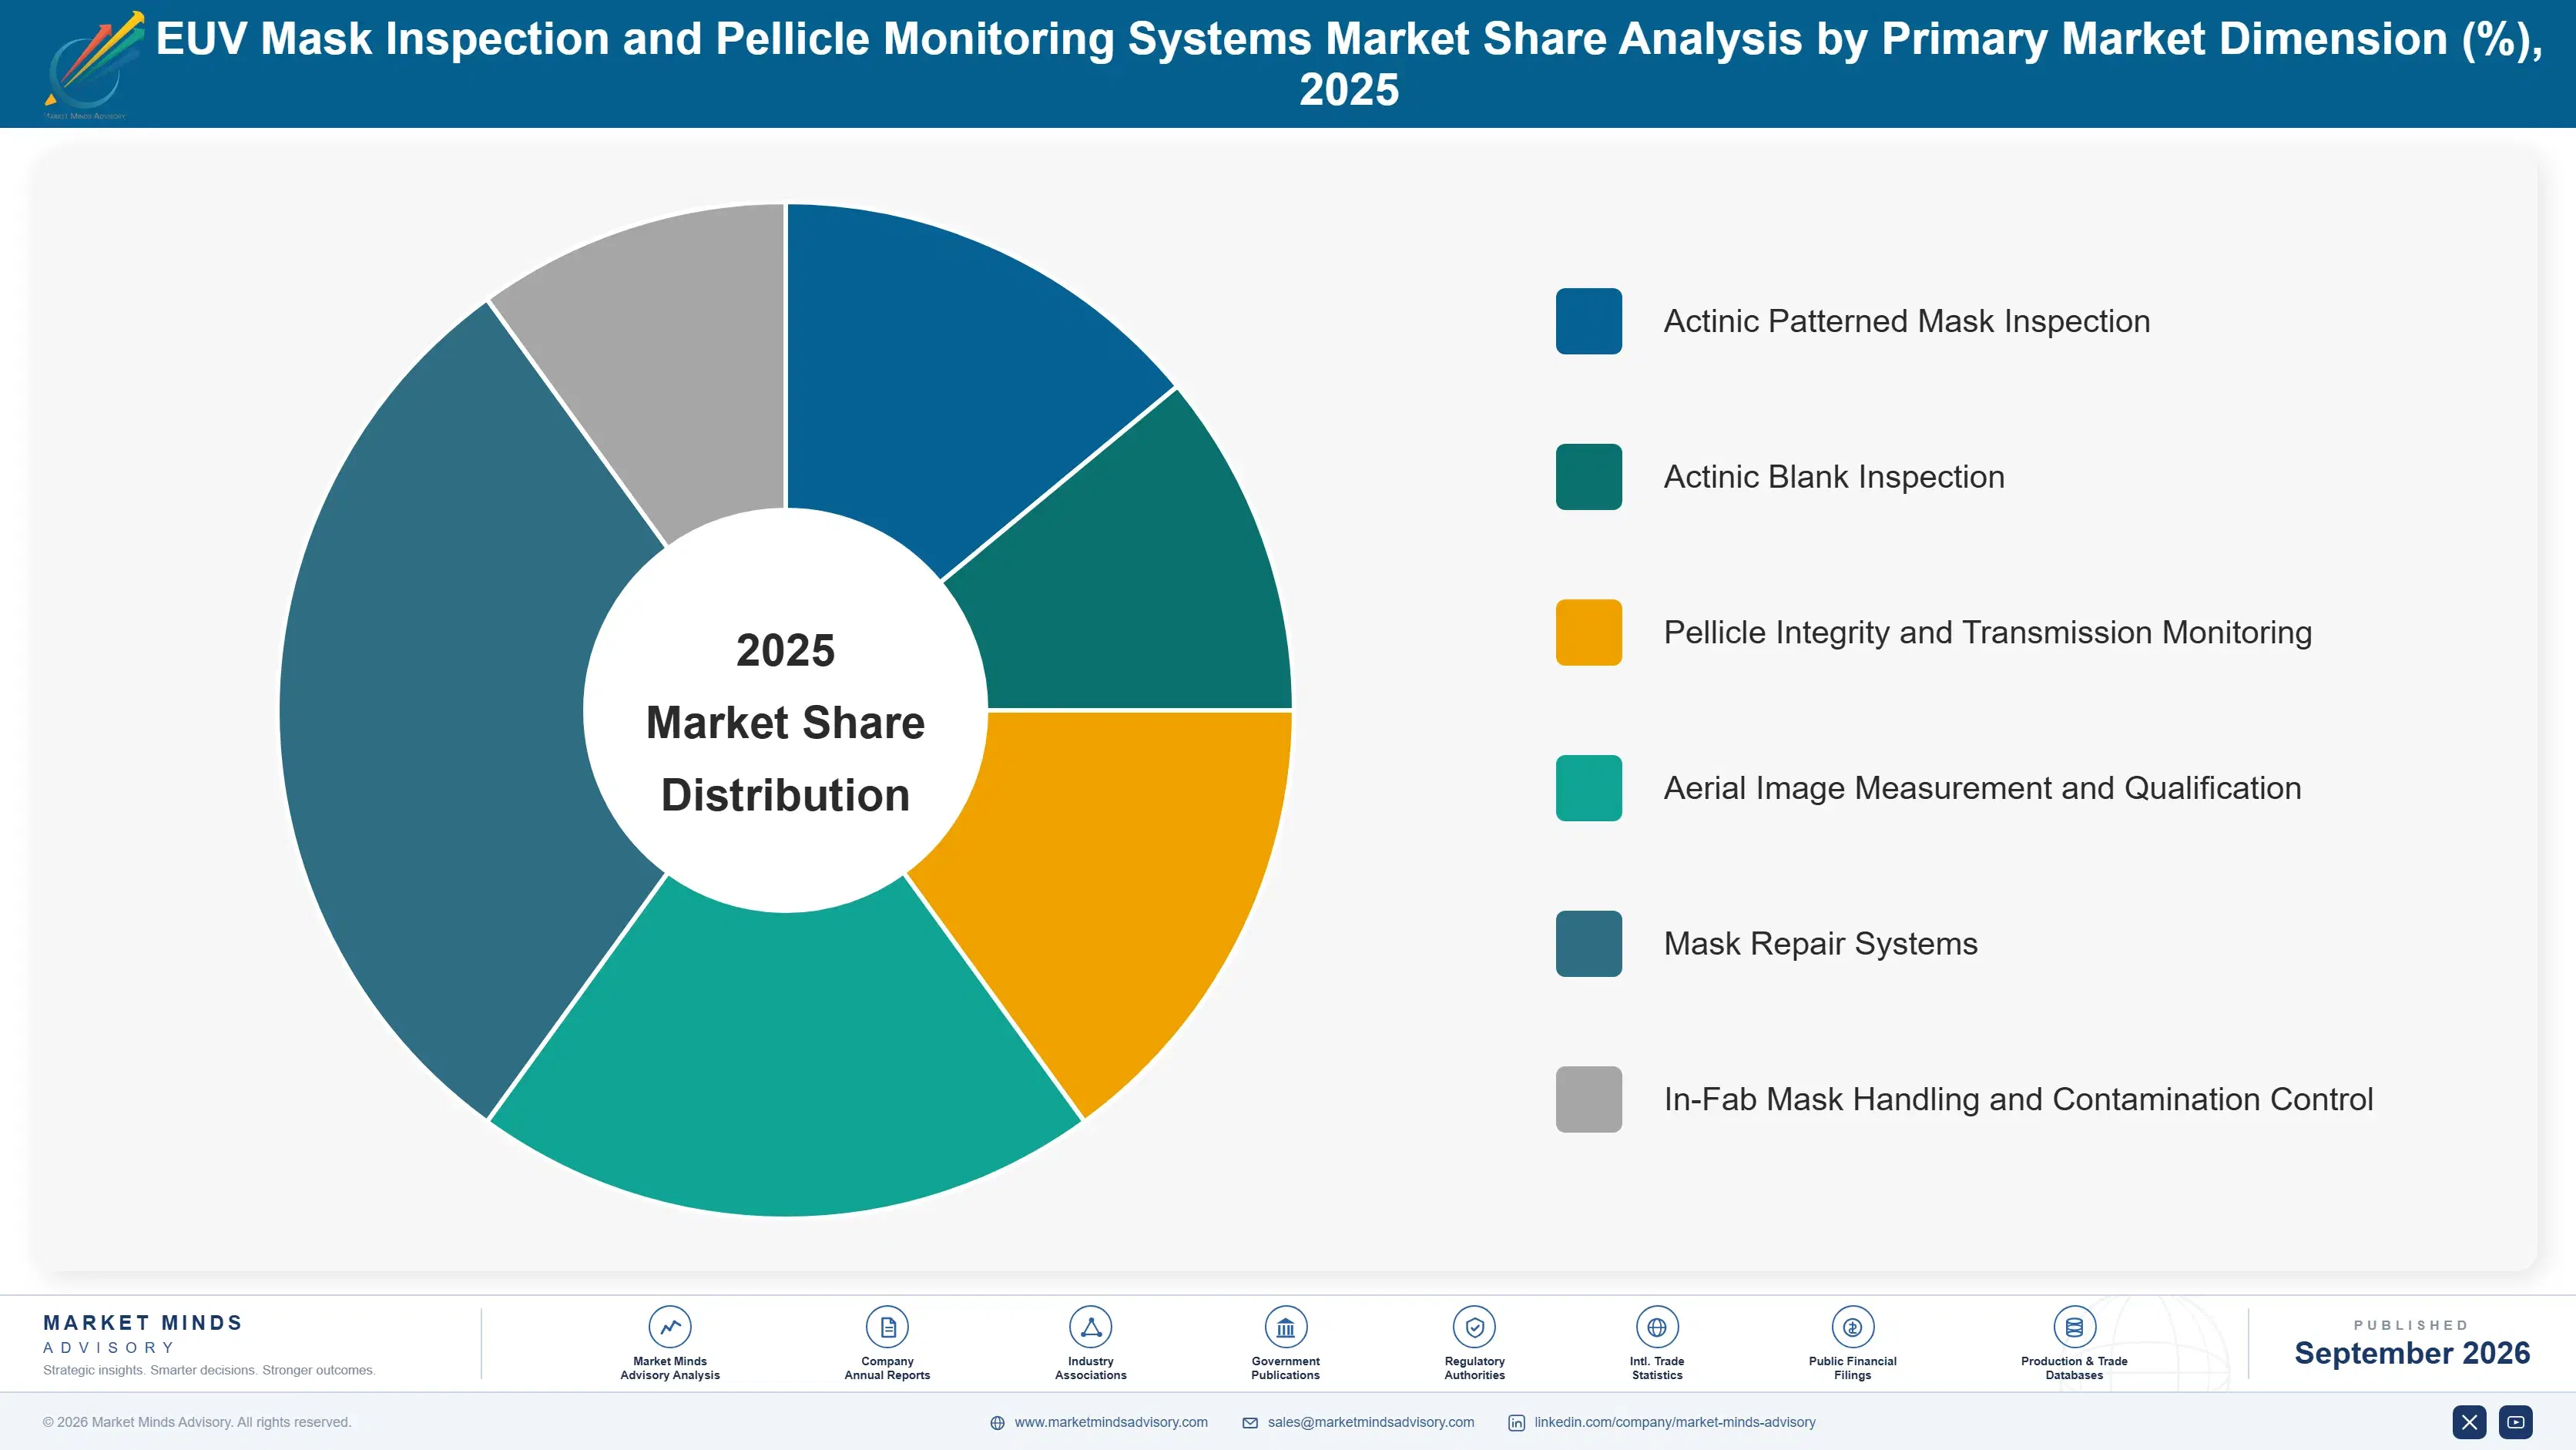
Segmentation follows the inspection or qualification problem, because each requires quite different physics and therefore quite different suppliers. Actinic capability demands an extreme ultraviolet source that almost nobody can build, while pellicle and handling monitoring rest on measurement problems that are difficult without being nearly impossible. Supplier counts differ accordingly across the six categories.
euv-mask-inspection-and-pellicle-monitoring-system-market-share-analysis-1788423731793

Pellicle Integrity and Transmission Monitoring

Pellicle monitoring is the fastest part of this market at 21.9%, half again the market rate of 14.6%, and it is a requirement that barely existed three years ago. Membranes now standard on production masks lose roughly 9% of light in each direction, degrade under source power in ways that are invisible during exposure, and expose a mask worth USD 340,000 when they fail. Monitoring transmission uniformity, mechanical integrity and particle adhesion has therefore become a distinct capability with its own specification. Supply is less concentrated than actinic inspection because the measurement, while demanding, does not require generating extreme ultraviolet light. That makes it the one genuinely contestable category here.
CAGR 21.9%

Aerial Image Measurement and Qualification

Aerial image measurement evaluates how a mask will actually print rather than what defects it carries, which is a different question and increasingly the more important one. High numerical aperture systems using anamorphic optics and half-field exposure change that relationship in ways existing tools were not designed to evaluate, and calibration does not simply scale across the transition. Growth at 18.4% therefore arrives with each manufacturer's adoption rather than continuously. The capability is genuinely scarce, resting on optical expertise concentrated in very few organisations, and qualification data from these tools underpins whether a mask enters production at all. Manufacturers requalify infrastructure only at generation transitions, which are many years apart and decide positions for the whole platform life.
CAGR 18.4%
Full segment breakdown across 6 segments available in the complete report.

Regional Architecture and Country Demand Map

Demand sits where extreme ultraviolet lithography is installed, which is the most geographically concentrated industrial activity anywhere. A handful of fabs across three countries account for the overwhelming majority of tools shipped in any year. Nothing about this distribution resembles a normal industrial market, and it will not change.

East Asia

East Asia holds 59%, far above the regional band, and the reason is that almost every extreme ultraviolet scanner in production sits in Taiwan, South Korea or Japan. Taiwanese advanced logic manufacturing operates the largest installed base anywhere and is the fastest-growing country market at 18.6%, driven by high numerical aperture preparation alongside existing capacity. Korean memory and logic manufacturers run substantial mask infrastructure of their own. Japanese suppliers build much of the inspection equipment and Japanese mask shops serve regional manufacturers, which places both supply and demand within the same region unusually completely. Regional growth at 15.6% reflects both existing capacity and high numerical aperture preparation running together. Supply and demand sit together.
Share: 59% | CAGR: 15.6% (2026 to 2036)

Western Europe

European demand rests on a combination that exists nowhere else: the region builds a substantial share of the world's mask inspection and qualification technology while installing comparatively little of it. Dutch lithography and German optical expertise underpin the equipment itself, and aerial image qualification capability is concentrated in German optics organisations with no genuine competitor. Belgian research infrastructure provides development and qualification capability used by manufacturers worldwide. Installed tools in the region serve research and pilot production rather than volume manufacturing, which keeps the demand share below the technology contribution considerably. Regional growth at 13.0% is the slowest anywhere, since the region supplies far more of this technology than it installs.
Share: 18% | CAGR: 13.0% (2026 to 2036)
Regional intelligence for 5 additional markets available in the complete report: North America, South Asia and Pacific, Latin America, Middle East and Africa, Eastern Europe. Contact sales@marketmindsadvisory.com.
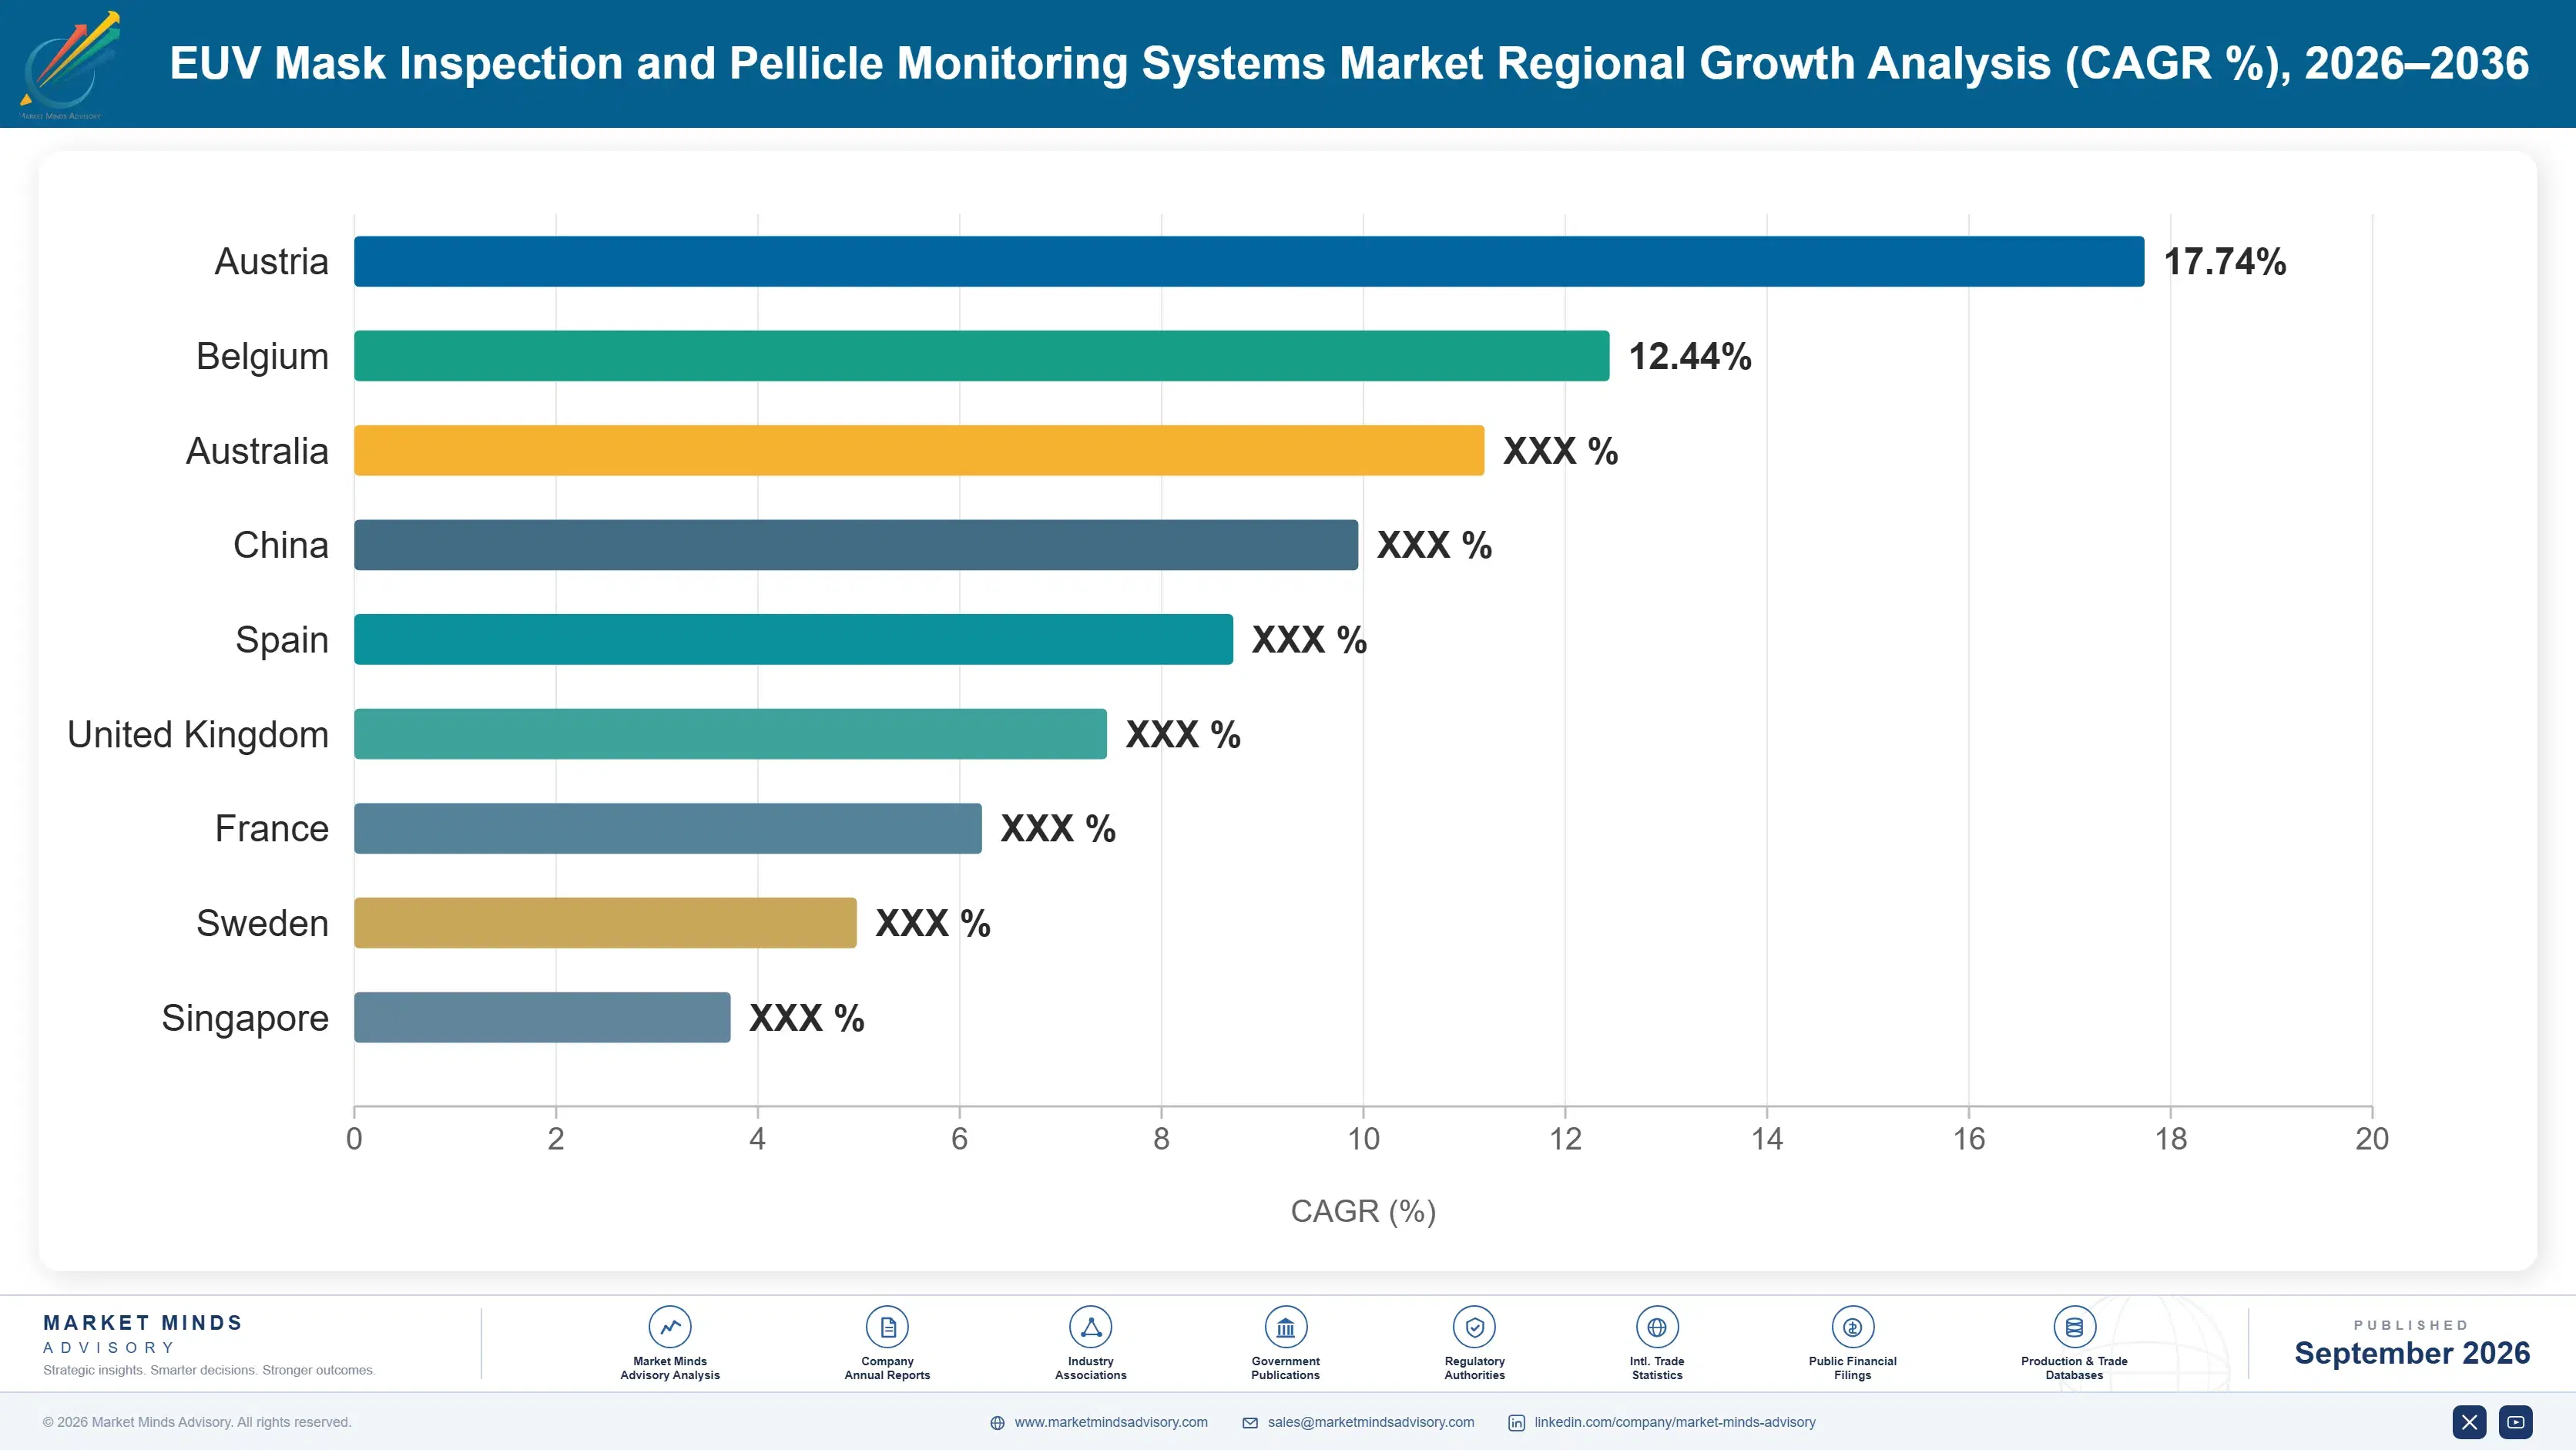
euv-mask-inspection-and-pellicle-monitoring-system-country-cagr-analysis-1788423732320

Where This Equipment Position Holds

Nobody negotiates on price when a tool costs a fraction of the incident it prevents, so commercial position rests on delivery capacity, on the requalification work that continues after installation, and on being ready when a manufacturer transitions to optics that make existing qualification invalid. Nothing in this market behaves like conventional capital equipment.

Expand Delivery Capacity Ahead of Demand

With only 2 suppliers able to build actinic patterned inspection, the market absorbs what those suppliers can deliver rather than what manufacturers would buy, and fab readiness is planned around delivery slots. Capacity expansion converts directly into revenue in a way that is rare in capital equipment, since the demand is already waiting. Suppliers adding capacity capture roughly 100% of the incremental output at prevailing prices. The constraint is extreme ultraviolet source availability and the engineering staff who understand it, neither of which expands quickly. Demand is not the limiting factor anywhere.
Market Impact: Absorbs 100% of any incremental build output added

Build Requalification Service Into the Installed Base

Masks are requalified roughly every 740 wafer exposures throughout their production life, which turns installed tools into recurring utilisation rather than one-time capital sales. Suppliers contracting requalification support, calibration and defect review services capture around 30% of original system value annually across the installation life. That revenue continues when capital spending pauses, which matters in a market where fewer than 8 major customers can defer programmes simultaneously. It also keeps engineers inside the fab, which is where the next tool decision gets shaped. Engineers inside the fab shape the next decision.
Market Impact: Adds around 30% of the system value annually

Be Ready Before the Optics Transition Arrives

High numerical aperture systems change the relationship between mask geometry and printed image sufficiently that existing qualification tools cannot simply be recalibrated. Each manufacturer adopting the new generation requires new capability, and the supplier positioned when that decision is made holds it for the platform life. Aerial image qualification grows at 18.4% on exactly this transition. Arriving late means waiting for the following generation, since nobody requalifies a working mask infrastructure mid-programme, and those generations are many years apart. Generations are many years apart and nobody requalifies mid-programme. Timing decides the platform.
Market Impact: That one segment now grows at 18.4% annually

Serve the Pellicle Problem Nobody Owned Before

Pellicles reaching production created a monitoring requirement that did not previously exist, growing at 21.9%, and supply is less concentrated because the measurement does not require generating extreme ultraviolet light. That makes it the one segment in this market genuinely open to suppliers without an actinic source capability. A degrading membrane is invisible during exposure and its failure exposes a mask worth USD 340,000, which gives the argument the same severity as everything else here. Positions established now will be difficult to displace afterwards. Qualification histories accumulate quickly once positions are taken.
Market Impact: Protects every mask set costing USD 340,000 each

Who Controls the Margin Pool

Concentration is extreme at roughly 91% across the top five on measured system revenue, which understates individual categories where single suppliers hold effective monopolies. Actinic inspection has 2 qualified suppliers and aerial image qualification rests on capability concentrated in one organisation. The gap between leaders and anybody else is a capability gap rather than a commercial one, and it has persisted for over a decade.
Competition runs on three dimensions, none of which is price. Delivery capacity is first, because manufacturers plan fab readiness around lead times and cannot substitute suppliers. Second is readiness for the next optics generation, since tools do not scale across it and the supplier present holds the platform. Third is service and requalification depth inside the fab, which sustains revenue between capital cycles and shapes the next purchase.

Two pressures are shaping the field, neither of them competitive in a conventional sense. Pellicle monitoring has opened the one category accessible without an extreme ultraviolet source, attracting suppliers who could never contest actinic inspection. Export controls have also removed Chinese demand entirely, which constrains growth rather than threatening anybody. Rankings will move very little.
euv-mask-inspection-and-pellicle-monitoring-system-company-positioning-matrix-1788423732845

Competitive Moat and Risk Dimensions

LASERTEC

Moat: Actinic inspection technical position

Lasertec holds the dominant position in actinic patterned mask inspection, built on the ability to generate and use extreme ultraviolet light for inspection at production throughput, which almost nobody else has achieved. Qualification histories with leading manufacturers span several generations and resist displacement. Delivery capacity rather than demand limits its revenue, which is an enviable commercial position.
LASERTEC

Risk: Extreme customer concentration

Revenue depends on fewer than 8 major manufacturers whose capital programmes move together with lithography deployment, so a slowdown removes demand across the entire base at once. Export controls have also closed off Chinese demand permanently rather than temporarily. Capacity expansion is limited by source engineering capability and the few people who understand it, capping growth even against excess demand.
CARL ZEISS SMT

Moat: Optical qualification and repair depth

Zeiss holds aerial image measurement capability that rests on optical design and manufacturing expertise concentrated in one organisation with no genuine competitor, and it supplies the optics inside the lithography systems these masks are used in. That gives visibility into optics transitions before customers formalise requirements. Repair capability alongside qualification addresses both what a mask shows and what needs correcting.
CARL ZEISS SMT

Risk: Lithography programme dependence

The company's position is tied closely to a single lithography platform whose pace and roadmap it does not control, and qualification demand follows scanner installation rather than leading it. High numerical aperture transitions create demand and require substantial development ahead of revenue. Its pellicle monitoring position is narrower than its qualification strength, leaving the fastest growing category thinly covered.

Players Tracked

Prominent Players

Lasertec
Carl Zeiss SMT
KLA
Applied Materials
Hitachi High-Tech

Other Key Players

ASML
NuFlare Technology
Toppan Photomasks
Photronics
Dai Nippon Printing
Mitsui Chemicals
S and S Tech
Hoya
AGC
Shin-Etsu Chemical
JEOL
Bruker
Park Systems
Onto Innovation
SCREEN Holdings

Recent Developments

MARCH 2025

Pellicle deployment reaches standard practice on production mask sets

Leading manufacturers completed transition to pellicle-protected masks across production extreme ultraviolet layers, following membrane developments that finally survived operating source power. Monitoring requirements were specified alongside deployment rather than developed afterwards, which was a change from earlier practice. Earlier deployments had run without pellicles entirely.
Signal: A monitoring category that did not exist three years ago is now the fastest growing part of this whole market.
AUGUST 2025

High numerical aperture qualification requirements diverge from existing tooling

Manufacturers preparing for anamorphic optics established that existing aerial image qualification could not be recalibrated across the transition and required new capability. The finding emerged from pilot line work rather than from any supplier announcement or product introduction. Suppliers were informed after the assessment concluded.
Signal: Each optics generation resets qualification tooling entirely, which creates demand arriving in steps rather than continuously.
NOVEMBER 2025

Mask inspection delivery lead times extend as capacity remains constrained

Lead times for actinic patterned inspection systems extended further as fab construction outpaced supplier delivery capacity. Manufacturers adjusted facility readiness schedules around tool availability rather than seeking alternative suppliers, since qualified alternatives do not exist. No qualified alternative supplier exists to approach. Capacity expansion remained slow.
Signal: Delivery capacity rather than demand determines what this market can absorb, which is a rare position for equipment.

What These Systems Cost to Build

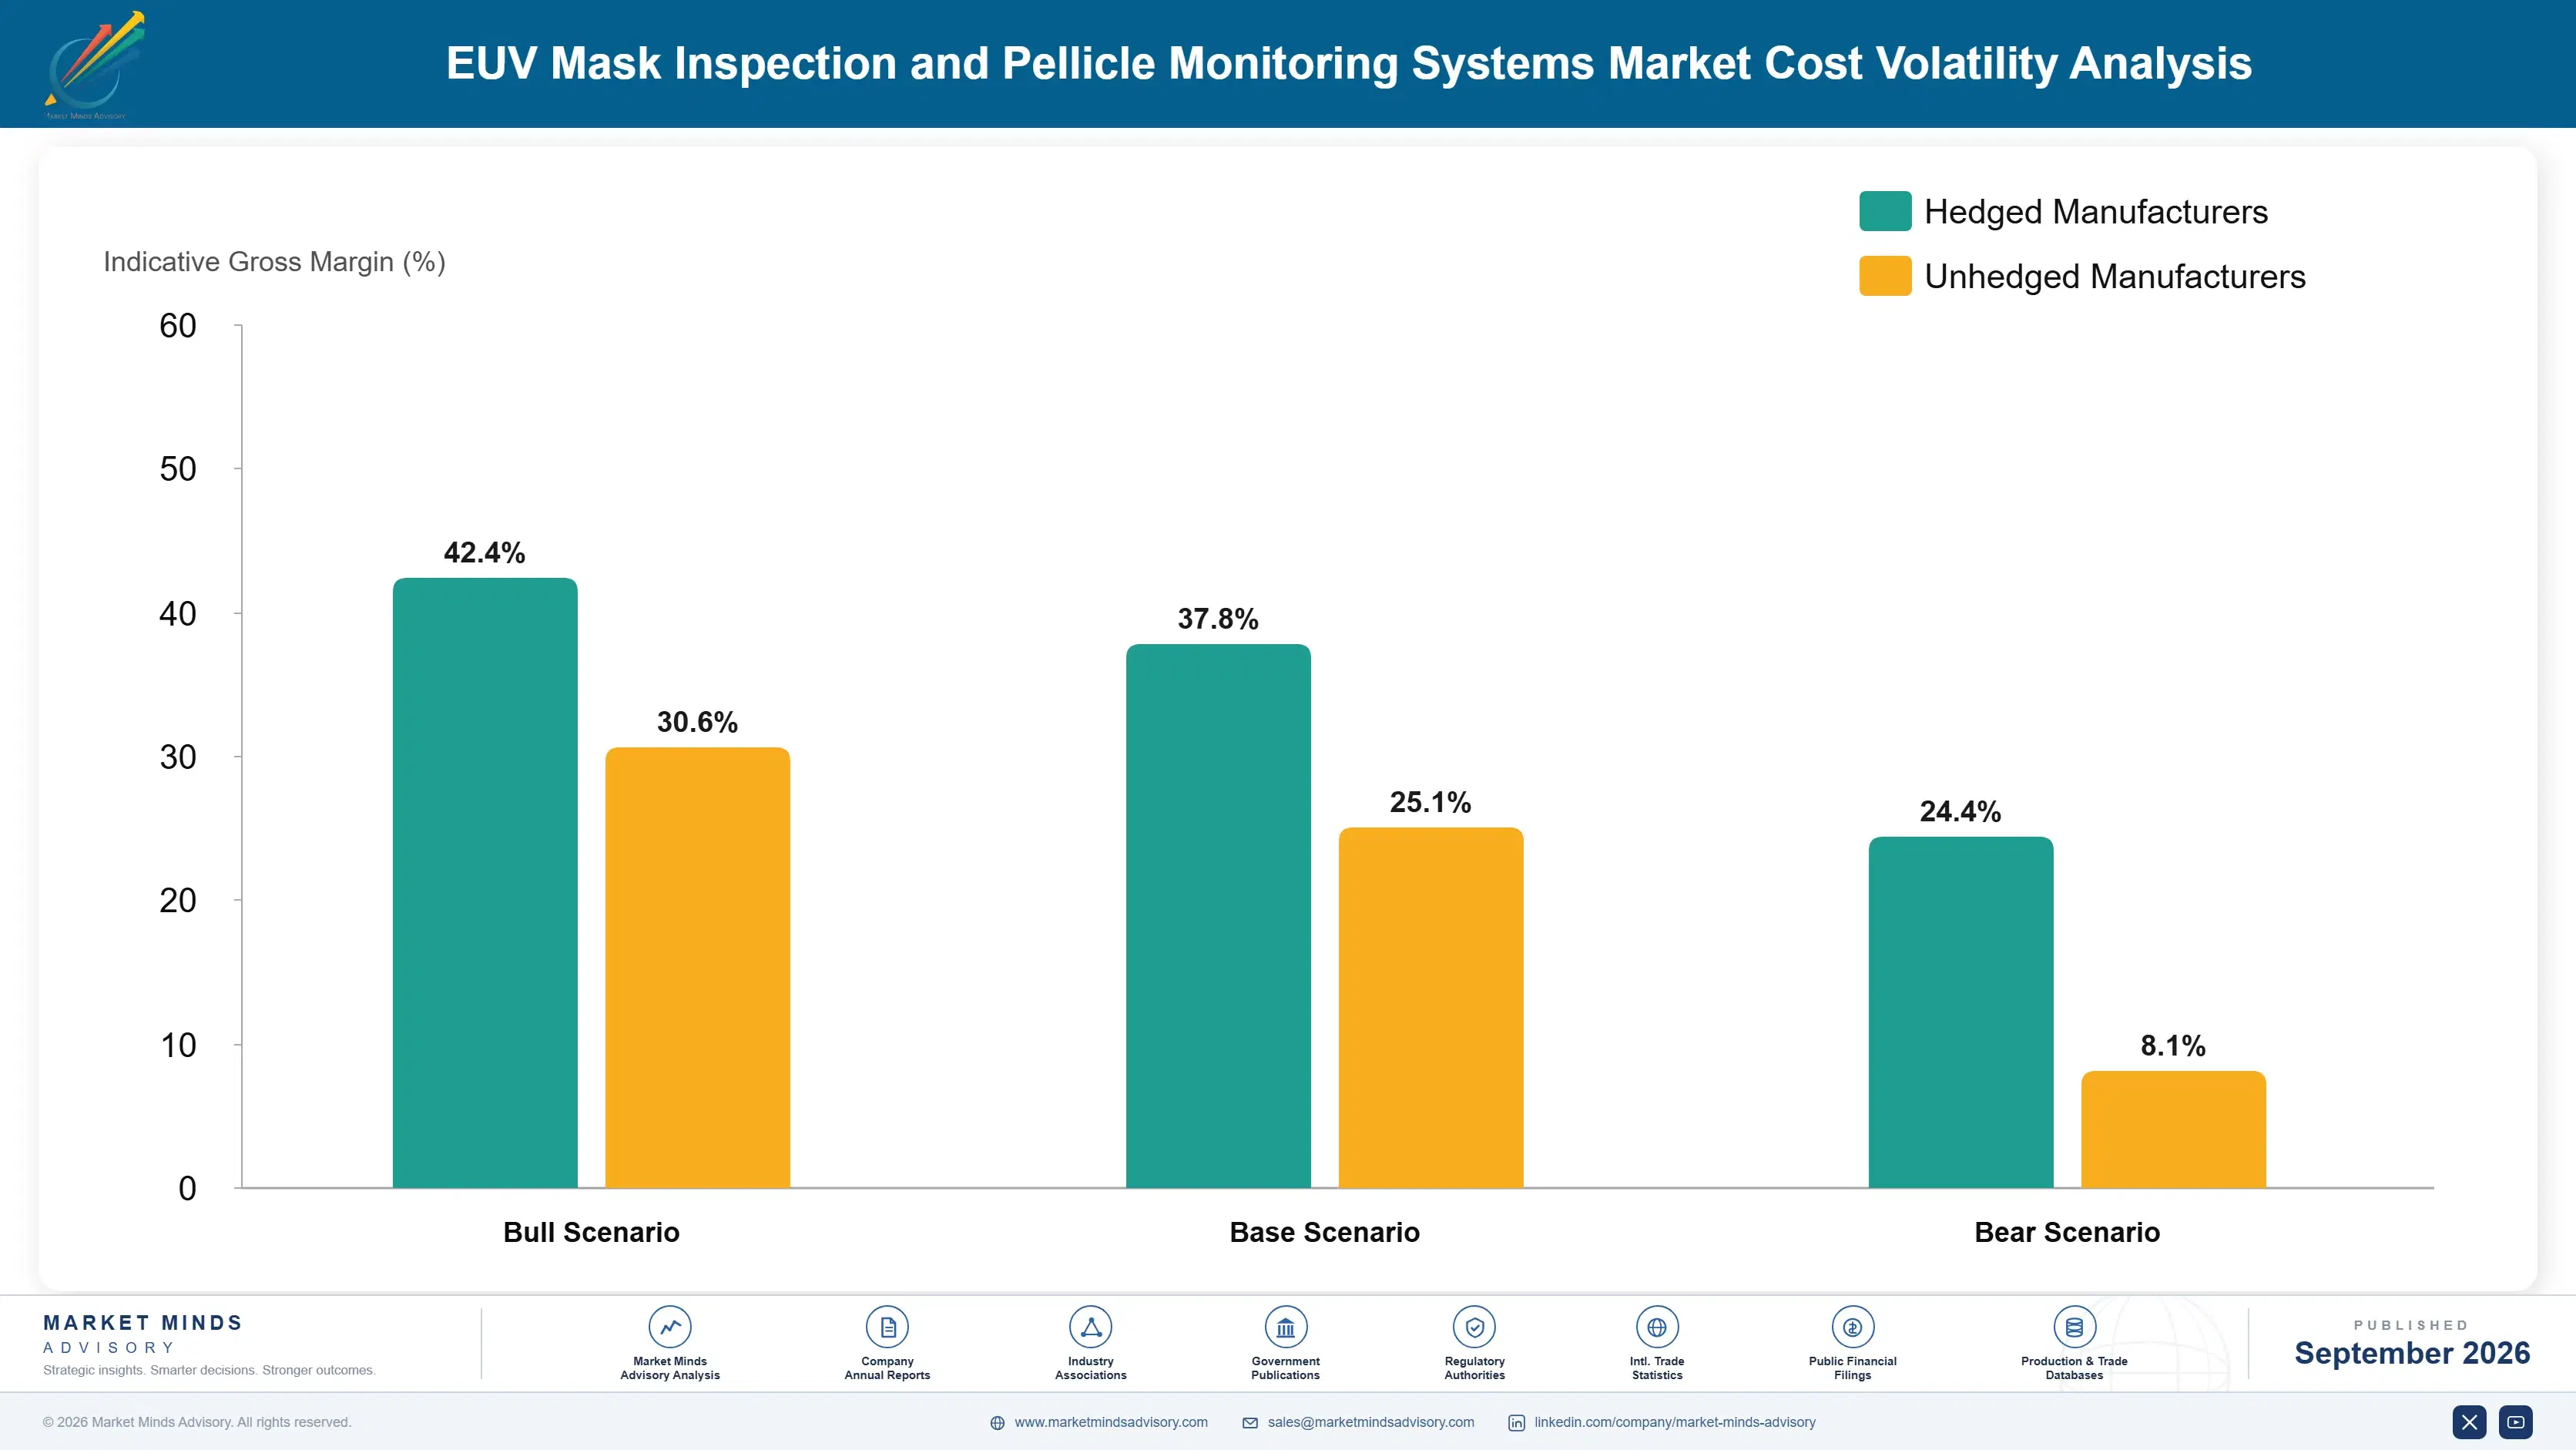
Extreme ultraviolet source and optics content dominates everything else. Source generation, multilayer mirror optics and vacuum systems run between 46% and 62% of cost of goods on actinic tools, the range reflecting source architecture and required throughput. Precision stages and metrology add roughly 16%, control electronics and compute 11%, and assembly, alignment and qualification the balance. Non-actinic tools including pellicle monitoring carry an entirely different and considerably lighter structure.
Multilayer optics supply has been the sharpest constraint. Mirrors reflecting extreme ultraviolet need dozens of precisely deposited layers and come from very few qualified producers who also supply scanner makers. Lasertec and ASML both referenced component and capacity conditions in recent annual reporting. Inspection tool makers are secondary customers for exactly the components that constrain their own output. Inspection tool makers are secondary customers for the components constraining their own output.

Exposure varies by tool type rather than by supplier scale. Actinic tool makers carry source and optics exposure that limits output regardless of demand. Pellicle and handling suppliers avoid it entirely and compete on lower barriers. Service revenue carries fixed and scarce engineering labour, since extreme ultraviolet metrology specialists cannot be recruited quickly. Everyone draws on the same small pool.
euv-mask-inspection-and-pellicle-monitoring-system-cost-volatility-analysis-1788423733040

Secure multilayer optics capacity contractually

Mirrors for extreme ultraviolet come from very few qualified producers who also serve lithography scanner makers with far greater purchasing volume, which leaves inspection tool suppliers as secondary customers whenever capacity tightens. Multi-year contracted supply removes the exposure that most directly limits output. It requires committing capital ahead of confirmed orders, which is straightforward where demand already exceeds capacity.

Extend installed tool capability rather than only shipping new systems

Delivery capacity limits how many new tools reach customers, while installed systems can often be upgraded to handle additional inspection modes or improved sensitivity. Upgrade programmes generate revenue without consuming scarce build capacity and reach customers waiting for new equipment. They also deepen the relationship precisely when a customer is frustrated by lead times.

Train extreme ultraviolet metrology engineers internally

The people who understand actinic metrology and can support these tools inside a fab number in the low hundreds worldwide, and competing for them raises cost without expanding the pool at all. Training pathways from adjacent optical and metrology disciplines build capacity competitors cannot recruit away. It takes two years to produce someone useful, which is why few commit.

Portfolio Architecture for Margin Defence

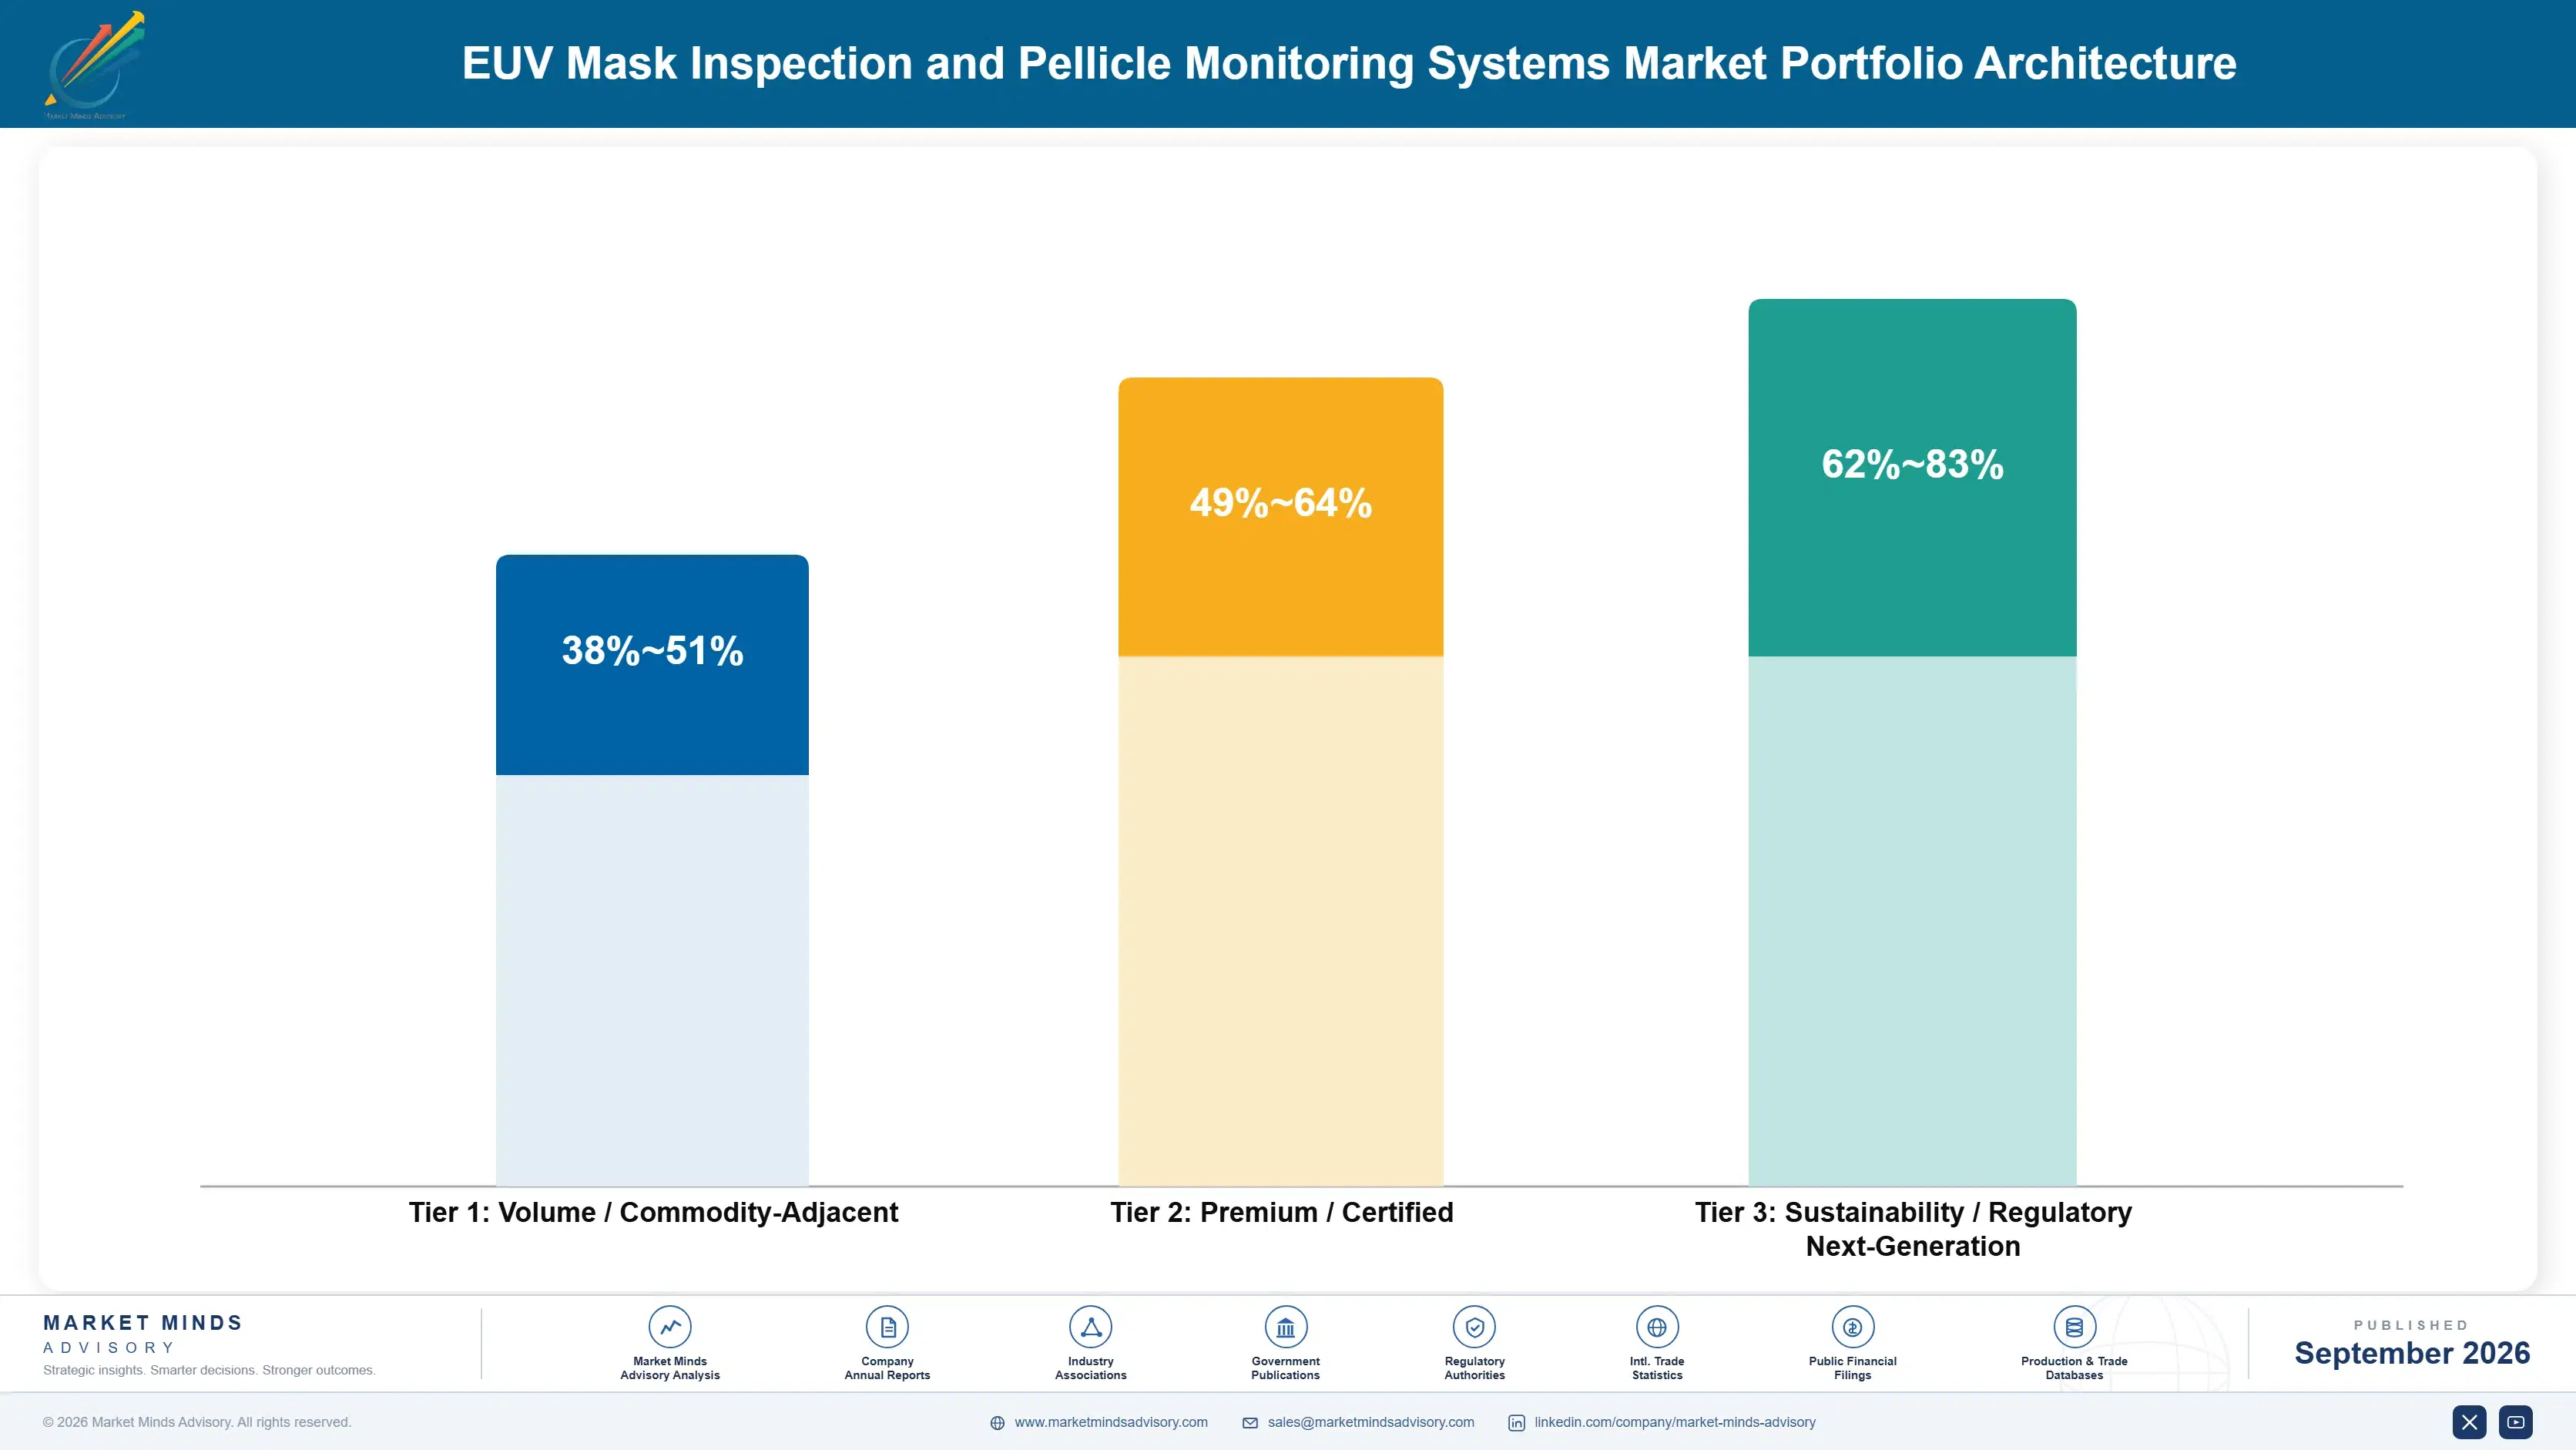
Margin architecture reflects barriers rather than value delivered. Actinic inspection tools earn exceptional margins because two suppliers exist, demand exceeds capacity and the alternative is not inspecting. Aerial image qualification earns comparably on optical capability nobody else holds. Pellicle and handling monitoring earn well but noticeably less, because the measurement problem is difficult without requiring an extreme ultraviolet source and more suppliers can therefore compete.
The volume tension is between capital shipments and service revenue. Tool shipments carry very large revenue per unit and are limited by build capacity rather than by demand, which caps growth in a way most equipment suppliers never experience. Requalification, calibration and defect review scale with installed base and mask counts rather than build capacity, continuing when capital pauses. Suppliers organised around shipments leave the only uncapped revenue unclaimed.

High-value revenue concentrates in actinic inspection and in aerial image qualification, both protected by capability barriers that have held for over a decade. Both involve a customer with no alternative supplier and no way to proceed without the capability. Pellicle monitoring occupies the growth position and the most contestable one, which is why positions taken now will determine that category for a long time.

Volume / Commodity-Adjacent

Mask handling, contamination control and in-fab support equipment where several suppliers compete. The wide range reflects how much measurement capability is included beyond handling itself. This is the only part of the market that resembles conventional equipment competition.
Gross Margin: 38-51%

Premium / Certified

Pellicle monitoring, blank inspection and mask repair systems requiring demanding measurement without an extreme ultraviolet source. Margin holds on capability barriers that are real but not absolute. This is where new entrants have a genuine route into the market.
Gross Margin: 49-64%

Sustainability / Regulatory / Next-Generation

Actinic patterned inspection and aerial image qualification, where two suppliers and one supplier respectively hold the capability. The widest range in the portfolio, reflecting source architecture and throughput. Highest margin anywhere in semiconductor equipment and constrained only by build capacity.
Gross Margin: 62-83%
euv-mask-inspection-and-pellicle-monitoring-system-portfolio-architecture-1788423733543

High-value Sub-segments and Strategic Watch-out

Actinic Patterned Inspection

High value with strong growth, limited by delivery capacity rather than by demand, which is a position almost no equipment supplier occupies. The margin range reflects source architecture and required throughput. Only 2 suppliers can build these tools and no credible third has emerged despite the obvious commercial attraction.
Gross Margin: 68-83%

Pellicle Monitoring Systems

High value with the fastest growth here, addressing a requirement that did not exist three years ago and does not need an extreme ultraviolet source to serve. The range reflects measurement scope and integration depth. It is the one genuinely contestable category, which makes current positioning unusually consequential.
Gross Margin: 52-66%

Mask Handling and Contamination Control

The volume core in unit terms and the least protected commercially, with several suppliers competing on conventional equipment terms. It provides fab presence and relationships that higher-value systems are sold alongside. Margins here look ordinary against everything else in this market. Ordinary equipment competition applies only here.
Gross Margin: 36-50%

Export Restricted Demand

The strategic watch-out, carried at zero because it represents demand permanently outside the addressable market rather than revenue anybody can pursue. Export controls have removed Chinese extreme ultraviolet capability entirely. Suppliers treating that as a deferred opportunity rather than a closed one are misreading the direction of policy.
Gross Margin: 0-0%

How This Demand Arrives

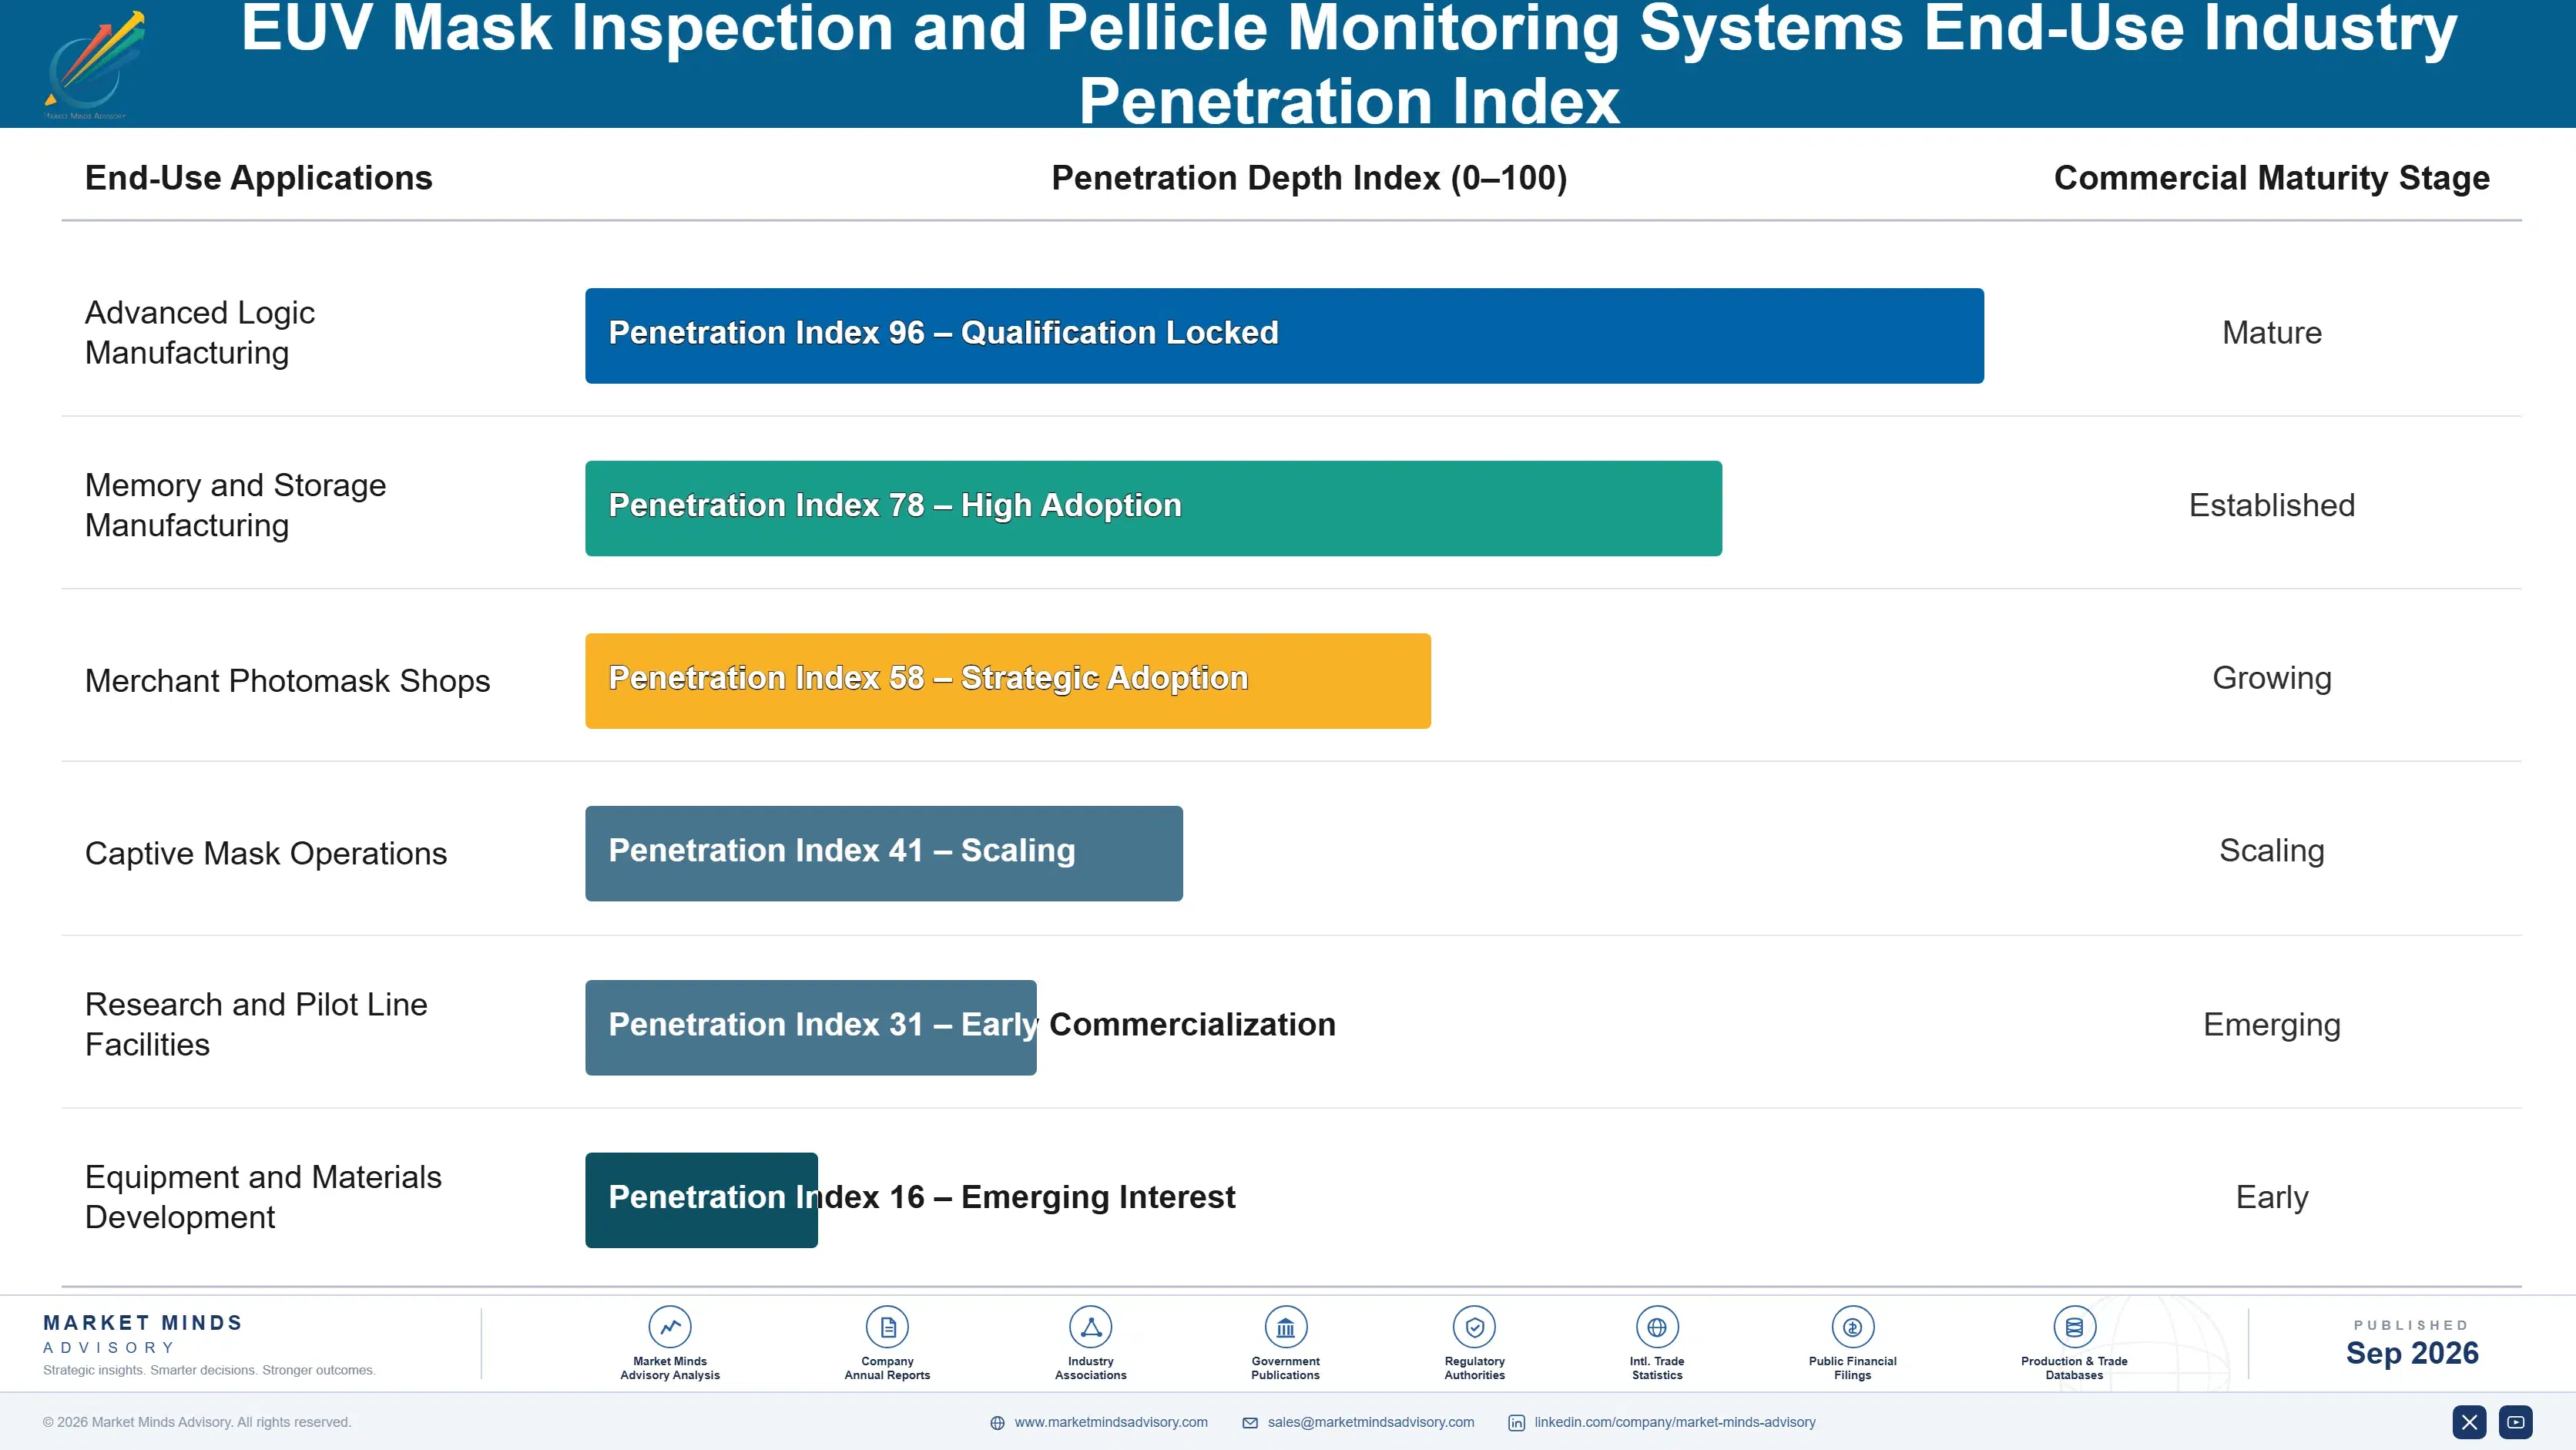
Demand arrives in two quite different rhythms. Tool purchases follow fab construction and lithography deployment, arriving in concentrated periods tied to a handful of manufacturers' capital programmes and stopping entirely between them. Requalification, calibration and support run continuously against installed tools and mask populations, scaling with mask counts and exposure volumes rather than with construction. The first is large and lumpy, the second smaller and reliable.
Adoption depth varies by manufacturer position. Leading logic manufacturers use every category intensively and drive specification for the rest of the industry. Memory manufacturers run high exposure volumes and value requalification throughput most. Mask shops serving multiple customers need broader capability than any single manufacturer but buy fewer tools of each type. Research institutions buy ahead of production requirements, technically influential and commercially minor.

The buyer is unusually consistent and unusually senior. Mask infrastructure decisions are made by lithography and mask operations leadership with direct board visibility, because the equipment is a condition of running the most expensive process step in the fab. Finance approves without much examination given the defect escape arithmetic. Suppliers meet scheduling constraints rather than procurement resistance, which is a completely different conversation.
euv-mask-inspection-and-pellicle-monitoring-system-end-use-penetration-index-1788423734032

What Governs This Market

These are among the four positions where our research anticipates prominent divergence between winners and laggards over the coming forecast period. Each is grounded in the demand model, the regulatory perimeter, and the announced capacity pipeline.
01 / DELIVERY CAPACITY EXPANSION

Build more tools, because demand is already waiting

Only 2 suppliers anywhere can deliver actinic patterned mask inspection, and annual shipments reflect what those suppliers can build rather than what manufacturers would willingly buy at prevailing prices. Capacity expansion converts almost directly into revenue, which is a position that virtually no capital equipment supplier anywhere ever gets to occupy. The constraint is extreme ultraviolet source engineering and the very small pool of people who understand it, neither of which expands on any timetable a commercial decision can accelerate.
02 / REQUALIFICATION SERVICE DEPTH

Sell the recurring work, not only the installed tool

Masks are requalified roughly every 740 wafer exposures throughout their entire production life, which turns installed equipment into continuous utilisation rather than a completed one-time capital sale. Suppliers that contract requalification, calibration and defect review capture around 30% of the original system value annually across the installation life. That revenue continues when capital programmes pause, which matters considerably when fewer than 8 major customers are able to defer construction at the same moment and have frequently done so in recent years.
03 / OPTICS TRANSITION READINESS

Arrive before the generation changes, or wait for the next

High numerical aperture optics alter the relationship between mask geometry and printed image enough that existing qualification tooling simply cannot be recalibrated across the transition. Each manufacturer adopting the generation requires new capability, and whoever is present when that decision is taken holds the platform for its entire life. Aerial image qualification grows at 18.4% on precisely that mechanism, and arriving late means waiting several years for the following generation, since nobody in this industry requalifies working mask infrastructure mid-programme.
04 / PELLICLE CATEGORY POSITIONING

Contest the one segment that needs no actinic source

Pellicle monitoring grows at 21.9% and is the single category in this market accessible without the ability to generate extreme ultraviolet light, which is what has limited every other segment to a handful of suppliers. A membrane degrading during exposure is invisible without measurement and its failure exposes a mask worth USD 340,000, so the commercial argument carries the same severity as everything else. Positions taken now will be very difficult indeed to displace once qualification histories start to accumulate.

Engagement Snapshot From the Field

A live engagement with an industry participant carrying material or product regulatory and market exposure ahead of a defining policy shift, showing how our research translates into a defensible multi-year portfolio strategy.
MARKET MINDS ADVISORY · CLIENT ENGAGEMENT SUMMARY
EUV Mask Inspection and Pellicle Monitoring Systems Producer Strategic Portfolio Review and Transition Roadmap 2026·Investment Scenario on EUV Mask Inspection and Pellicle Monitoring Systems Exposure Evaluation 2025-26
CLIENT PROFILE
An advanced logic manufacturer operating extreme ultraviolet lithography across two production fabs with a third then under construction (client-reported, unverified by MMA). Mask infrastructure comprised actinic patterned inspection, aerial image qualification and mask repair capability across both operating sites, while pellicle monitoring was handled through periodic offline measurement rather than through any dedicated continuous system.
STRATEGIC CHALLENGE
Facility readiness for the third fab depended on mask inspection tool delivery that suppliers could not confirm within the construction schedule (client-reported, unverified by MMA). Separately, two pellicle failures during production had exposed masks to particle contamination, costing an estimated USD 21 million in scrapped material, and the offline measurement regime had not detected degradation beforehand.
MMA APPROACH
MMA assessed mask infrastructure requirements against exposure volumes and layer counts rather than against fab count, which the manufacturer had used as its planning basis. We interviewed 14 lithography and mask operations staff, five suppliers and two mask shops. Options were evaluated against schedule risk and defect escape exposure rather than against capital cost, which had never been the binding consideration.
KEY FINDINGS
  1. Requalification throughput rather than tool count was the actual constraint, and existing tools were running at 91% utilisation before the third fab was considered at all.
  2. Both of the pellicle failures showed clear transmission degradation in retrospective analysis of measurement data the manufacturer already held but was not monitoring continuously.
  3. An installed tool upgrade programme available from one supplier would have added roughly 30% requalification throughput without consuming any new build capacity.
  4. Mask shop partners held inspection capacity that could have absorbed qualification work during the construction period, and nobody had approached them about it.
CLIENT PROFILE
An advanced logic manufacturer operating extreme ultraviolet lithography across two production fabs with a third then under construction (client-reported, unverified by MMA). Mask infrastructure comprised actinic patterned inspection, aerial image qualification and mask repair capability across both operating sites, while pellicle monitoring was handled through periodic offline measurement rather than through any dedicated continuous system.
STRATEGIC CHALLENGE
Facility readiness for the third fab depended on mask inspection tool delivery that suppliers could not confirm within the construction schedule (client-reported, unverified by MMA). Separately, two pellicle failures during production had exposed masks to particle contamination, costing an estimated USD 21 million in scrapped material, and the offline measurement regime had not detected degradation beforehand.
MMA APPROACH
MMA assessed mask infrastructure requirements against exposure volumes and layer counts rather than against fab count, which the manufacturer had used as its planning basis. We interviewed 14 lithography and mask operations staff, five suppliers and two mask shops. Options were evaluated against schedule risk and defect escape exposure rather than against capital cost, which had never been the binding consideration.
KEY FINDINGS
  1. Requalification throughput rather than tool count was the actual constraint, and existing tools were running at 91% utilisation before the third fab was considered at all.
  2. Both of the pellicle failures showed clear transmission degradation in retrospective analysis of measurement data the manufacturer already held but was not monitoring continuously.
  3. An installed tool upgrade programme available from one supplier would have added roughly 30% requalification throughput without consuming any new build capacity.
  4. Mask shop partners held inspection capacity that could have absorbed qualification work during the construction period, and nobody had approached them about it.
RECOMMENDED STRATEGY
Phase 1: Take the installed tool upgrade immediately to relieve requalification throughput, rather than waiting on new system delivery the supplier cannot commit to. Phase 2: Deploy continuous pellicle transmission monitoring rather than periodic offline measurement, since both failures were visible in data already being collected. Phase 3: Contract qualification capacity from mask shop partners for the construction period, which requires no new equipment and was never considered internally.
OUTCOME
The manufacturer met third fab readiness without new inspection tool delivery, using upgrades and partner capacity (client-reported, unverified by MMA). Continuous pellicle monitoring detected two degrading membranes in the following nine months before either reached failure, avoiding losses of a scale comparable to the two earlier contamination incidents.

Frequently Asked Questions

Foundational context covering the market sizes, CAGR, scope, country, region and competition that inform every finding below. This section is provided to cover basics and most often pre-purchase conversations, answered from the MMA Primary Research Dataset.

What is the current size of the EUV Mask Inspection and Pellicle Monitoring Systems Market?

The market was worth USD 1.3 billion in 2025 and reaches USD 1.49 billion in 2026. Delivery capacity rather than demand limits what the market absorbs in any year.

How large will the EUV Mask Inspection and Pellicle Monitoring Systems Market be by 2036?

MMA forecasts USD 5.82 billion by 2036, an expansion of 3.91 times over the forecast period. That represents USD 4.33 billion of incremental annual revenue against 2026.

What is the CAGR for the EUV Mask Inspection and Pellicle Monitoring Systems Market 2026 to 2036?

The base case is 14.6% compound annual growth, with a bull case at 15.8% and a bear case at 13.4%. High numerical aperture adoption pace separates the three scenarios.

Which segment is growing fastest?

Pellicle integrity and transmission monitoring grows at 21.9%, half again the market rate of 14.6%. A membrane degrading during exposure is invisible without measurement and exposes the mask when it fails.

Who are the major companies in the EUV Mask Inspection and Pellicle Monitoring Systems Market?

Lasertec, Carl Zeiss SMT, KLA, Applied Materials and Hitachi High-Tech lead on measured system revenue. Together they hold roughly 91%, with near monopoly positions in individual categories.

Which country is growing fastest?

Taiwan grows fastest at 18.6%, operating the largest installed extreme ultraviolet base anywhere alongside high numerical aperture preparation that requires entirely new qualification capability rather than upgrades.

Report Segmentation Architecture

The full report scope spans multiple orthogonal segmentation dimensions, with cross-tabulated demand data provided for each dimension pair. Coverage extends further to regional breakdowns, trend trajectories, and the competitive detail needed to support segment-level decision-making.

By Primary Market Dimension

  • Actinic Patterned Mask Inspection
  • Actinic Blank Inspection
  • Pellicle Integrity and Transmission Monitoring
  • Aerial Image Measurement and Qualification
  • Mask Repair Systems
  • In-Fab Mask Handling and Contamination Control

By End-Use Industry

  • Advanced Logic Manufacturing
  • Memory and Storage Manufacturing
  • Merchant Photomask Shops
  • Captive Mask Operations
  • Research and Pilot Line Facilities
  • Equipment and Materials Development

By Commercial Dimension

  • Direct Fab Capital Procurement
  • Mask Shop Equipment Supply
  • Installed Tool Upgrade Programmes
  • Requalification Service Contracts
  • Research Institution Procurement
  • New Fab Programme Supply

By Region

  • East Asia
  • Western Europe
  • North America
  • South Asia and Pacific
  • Latin America
  • Middle East and Africa
  • Eastern Europe

Scope, Methodology, and Coverage

Every figure in this report is reproducible from documented input assumptions. The scope below maps the historical period, the forecast horizon, the segmentation dimensions, and the countries covered, alongside the underlying primary and qualitative methodology.
Historical Period
2020 to 2025
Forecast Period
2026 to 2036
Base Year
2025 (USD billions; MMA Primary Research Dataset, September 2026)
Market Definition
This market covers inspection, monitoring and qualification systems for extreme ultraviolet photomasks and pellicles, spanning actinic patterned mask inspection, actinic blank inspection, pellicle integrity and transmission monitoring, aerial image measurement and qualification, mask repair systems, and in-fab mask handling and contamination control. Revenue is measured as system shipment value, installed tool upgrade programmes and directly attributable requalification and support services at supplier level. Lithography scanners and light sources, mask writing and patterning equipment, wafer-level inspection and metrology, photomask blanks and pellicle membranes as consumables, and deep ultraviolet mask tooling are excluded.
Quantitative Units
USD billions, system, upgrade and attributable service revenue
Segmentation Dimensions
System type, manufacturer category, commercial model, region
Regions Covered
East Asia, Western Europe, North America, South Asia and Pacific, Latin America, Middle East and Africa, Eastern Europe
Countries Covered
Taiwan, South Korea, Japan, China, Singapore, India, Australia, United States, Canada, Mexico, Brazil, Germany, Netherlands, Belgium, France, United Kingdom, Ireland, Switzerland, Austria, Poland, Czechia, Israel, United Arab Emirates, Saudi Arabia
Key Companies Profiled
Lasertec, Carl Zeiss SMT, KLA, Applied Materials, Hitachi High-Tech, ASML, NuFlare Technology, Toppan Photomasks, Photronics, Dai Nippon Printing, Mitsui Chemicals, S and S Tech, Hoya, AGC, Shin-Etsu Chemical, JEOL, Bruker, Park Systems, Onto Innovation, SCREEN Holdings
Quantitative Methodology
Primary survey, n=3,800 respondents, Q4 2025, six countries; demand-side model with trade association cross-validation
Qualitative Methodology
47 expert interviews, Q4 2025; applied to validate demand model assumptions, identify emerging dynamics, and assess competitive positioning
Report Format
PDF and XLSX data workbook (Word format preview document)
Publisher
Market Minds Advisory
Report Code
MMA-2026-TEC-931
Published
September 2026
Contact
sales@marketmindsadvisory.com | www.marketmindsadvisory.com

Purchase the full EUV Mask Inspection and Pellicle Monitoring Systems Market Report (2026 to 2036).

The full MMA report examines a market where two suppliers set what the world can buy and a single escaped defect costs more than the tool preventing it. It sizes the market to 2036 across six system types, seven regions and 24 countries, with segment growth rates and regional demand mechanisms set out in full. Competitive analysis covers 20 participants assessed on measured system and service revenue, including moat and risk assessment for the two leaders. The report quantifies cost structure, optics supply exposure and margin architecture across three portfolio tiers. It closes with four strategic verdicts and an anonymised logic manufacturer engagement.
Six system types sized to 2036
Seven regions with demand mechanism analysis
Twenty participants on consistent revenue basis
Defect escape cost and requalification benchmarks
Margin architecture across three portfolio tiers
Anonymised logic manufacturer mask infrastructure engagement

Built For The People Who Decide

From boardroom strategy to bench-side execution, this report is read cover-to-cover by leaders shaping the next decade of their industry, turning demand scenarios, market dynamics and valuation benchmarks into decisions.
CXOs/ Presidents/ VPs/ Managers
M&A and Corporate Development
Strategy Teams and R&D Heads
Procurement and Product Directors
Regulatory and Compliance Leaders
Investor Relations and Equity Analysts