Market Minds Advisory
Europe Defense Market

Europe Defense Market: Europe Defence Procurement: Money Solved, Fragmentation Unsolved, And Consolidation Nobody Will Vote For

A continent that fixed its defence budget in three years and still buys twelve different main battle tanks, because every consolidation proposal ends with somebody agreeing to close their own factory.

Lead Analyst

Published

September 2026

Make Smarter Decisions with Customized Research Insights

Request a free sample report and evaluate market opportunities, growth trends, and competitive dynamics relevant to your business needs.

2025 MARKET VALUE$198.0BMarket Size 2025
2036 FORECAST VALUE$452.3BBase Case , 2026 to 2036
CAGR 2026 TO 20367.8 %Bull 9.0% / Bear 6.6%
INCREMENTAL OPPORTUNITY$238.9BNet 10- year value creation
EXPANSION MULTIPLE2.12x2036 value over 2026 base
Strategic Levers
M&A Pipeline
Regional Outlook
Country Rankings
Competitive Intelligence
Segmental Deep-dive
Call-Us : 91 93563 13602

Executive Snapshot and Market Trajectory.

Europe solved its defence budget problem faster than anybody expected and has made almost no progress on the harder one. Twelve different main battle tank types remain in service across the continent, and collaborative procurement still accounts for only around 21% of equipment spending.
That fragmentation is the actual constraint, and it is political rather than industrial. Every credible consolidation proposal requires a member state to accept that a factory in its own territory closes so that a factory elsewhere can run at scale, which no government has yet been willing to sign. European Union funding instruments are explicit attempts to purchase consolidation with subsidy, and they remain small against the national procurement budgets involved. Nobody has signed.
The money is meanwhile going somewhere. Alliance commitments agreed during 2025 point toward sustained increases through the middle of the next decade, air and missile defence grows fastest at 11.7% after Ukraine demonstrated what a shortage looks like, and roughly 34% of equipment value is bought from outside the continent entirely because European industry could not deliver anything like quickly enough. That share quietly embarrasses every government involved in it.
Market Definition
European government spending on defence equipment procurement, research and development, and equipment support, awarded to domestic and foreign suppliers across NATO European members, European Union member states and European non-aligned nations. Excludes personnel costs and pensions, civilian staff costs, non-equipment infrastructure spending, and military aid transferred to recipients outside Europe.
Base Year Value
$198.0B in 2025 (MMA Primary Research Dataset, August 2026)
Forecast Period
2026 to 2036, eleven discrete annual values
CAGR
7.8% base case. Bull 9.0%. Bear 6.6%.
Fastest Growth Segment
Air and Missile Defence: 11.7% CAGR
Fastest Growth Country
India: 9.8% CAGR
Fastest Growth Region
South Asia and Pacific: 9.8% CAGR
Largest Region
Western Europe: 74% of 2025 global value
Market Leaders
BAE Systems, Airbus Defence and Space, Leonardo, Thales and Rheinmetall lead on European contract award value. Source: company annual reports and MMA Primary Research Dataset, July 2026.
Primary Survey
n=3,800 procurement and R&D decision-makers, Q4 2025, six countries
Methodology
Demand-side build-up, cross-validated against public data, 47 expert interviews

Europe Defense Market Forecast Scenarios

europe-defense-market-size-forecast-scenario-1787997769923
The 2020 to 2025 period contained the sharpest reversal in European defence since the Cold War ended. Budgets were still being defended against competing priorities in 2021, and by 2025 alliance members had agreed a trajectory toward figures nobody would have proposed publicly four years earlier. Spending compounded near 6.4% across the period, with almost all of the acceleration concentrated in its final three years.
Three mechanisms carry the base case. Alliance commitments agreed during 2025 extend spending growth across a decade rather than a parliament, which changes what suppliers will invest capital against. Munitions and energetics capacity continues rebuilding from holdings that Ukraine support exposed as inadequate for any sustained conflict. And air and missile defence procurement expands as multiple states buy layered capability they had allowed to lapse entirely since the early 1990s onward.
The bull catalyst is genuine procurement consolidation, since collaborative buying at the benchmark share rather than 21% would deliver considerably more capability from identical spending. The bear risk is capacity: European industry already loses roughly 34% of equipment value to non-European suppliers because it cannot deliver on the required timescale, and appropriated money that cannot be spent domestically simply leaves.

Twelve Tanks And One Continent

Concentration at around 33% across the five largest suppliers is low for a defence market, and it is low by design rather than by accident. National procurement preferences protect domestic industrial bases across more than twenty countries, so a continent comparable to the United States in economic size supports twelve main battle tank types where America supports one. That duplication consumes development money and raises unit cost on everything.
MARKET CONCENTRATION CR533%Share of contract award value held by leading suppliers
COLLABORATIVE PROCUREMENT SHARE21%Equipment bought jointly rather than by single nations
MAIN BATTLE TANK TYPES12Distinct tank models operated across the continent today
NON EUROPEAN PURCHASE SHARE34%Equipment value bought from suppliers outside the continent
MUNITIONS OUTPUT GROWTH3.2 timesAnnual artillery production against the pre conflict level
PROGRAMME DELIVERY SLIPPAGE29 monthsAverage delay across major multinational equipment programmes today
Collaborative procurement was supposed to solve it and has not. Around 21% of equipment spending is bought jointly against a benchmark set considerably higher, and the reason is simple: joint programmes require somebody to accept less workshare than their contribution justifies, and ministers answer to national parliaments rather than to continental efficiency. Multinational programmes also slip, averaging 29 months against plan, which procurement officials cite as justification for avoiding them.
Foreign purchase is the pressure valve nobody wanted. Roughly 34% of equipment value goes to suppliers outside Europe, concentrated in air defence, rotorcraft and munitions where domestic capacity could not deliver on the timescale a government needed. That share is politically uncomfortable and operationally necessary, and it falls only as fast as European production capacity is actually built rather than announced.
"Every European defence conference reaches the same conclusion about consolidation and every European defence minister goes home to a constituency with a factory in it. That is the whole market in one sentence."
Director, European Defence Programmes Practice · MMA Aerospace and Defence Programmes Practice · August 2026

Market Trends

European Union Instruments Buy Consolidation With Subsidy

Union funding instruments established since 2023 pay member states to procure jointly, subsidise ammunition production capacity and part-fund industrial expansion, which is an explicit attempt to purchase behaviour that persuasion never achieved. The sums are meaningful in the sectors they target and small against national procurement budgets overall. Where they have worked, they worked by making joint purchase cheaper than national purchase rather than by arguing it was wiser. Where they have not, national workshare politics simply outweighed the subsidy on offer. Subsidy achieved what three decades of argument never managed.
Market Impact: Targets 3.5% output by 2035

Munitions Capacity Rebuilds Faster Than Anything Else

Artillery ammunition output across the continent has risen to roughly 3.2 times its pre-conflict level, driven by production capacity that governments guaranteed to fund whether or not it was fully used. New energetics and shell plants have opened in Germany, Lithuania, Romania and elsewhere, and several were built specifically because supply to Ukraine exposed how thin peacetime ordering had left everybody. Energetics rather than shell bodies remains the binding constraint, since propellant capacity takes years to build and is heavily regulated everywhere. Nobody has said what happens to that capacity afterwards.
Market Impact: Grows air defence 11.7% annually

Market Opportunities and Growth Drivers

Alliance Commitments Extend Growth Beyond Any Parliament

Members agreed during 2025 to raise defence-related spending substantially by the middle of the next decade, split between core defence and broader resilience categories. That converts procurement from an annual argument into a decade-long trajectory, which is the distinction that determines whether a company builds capacity or merely bids for work. Suppliers across munitions, air defence and land systems are finally committing capital rather than adding shifts. A trajectory changes board behaviour in a way that any single budget never does. Adding shifts is not the same thing as adding capacity.
Market Impact: Sustains 12 tank types today

Air Defence Rebuilt From Capability Allowed To Lapse

European states spent three decades reducing ground based air defence on the reasonable assumption that nobody would contest their airspace, and Ukraine demonstrated the cost of that assumption in a way no analysis had managed. Multi-state initiatives now coordinate layered procurement across short, medium and long range systems. Demand exceeds European production capacity substantially, which is why a large share of these purchases goes to American and Israeli suppliers. Air and missile defence grows fastest in this market at 11.7% as a direct consequence. Thirty years of reduction cannot be reversed in three.
Market Impact: Sends 34% of value abroad

Market Restraints and Challenges

Consolidation Requires A Government To Close Its Factory

Every credible proposal to reduce twelve tank types toward two requires member states to accept that production consolidates somewhere other than their own territory. The root cause is that defence industrial capacity is a national employment and sovereignty asset before it is an efficiency question. Commercially it sustains duplicated development and short production runs that raise unit cost across the continent. Mitigation runs through joint programmes with distributed workshare, union instruments subsidising common purchase, and export success that makes a longer production run viable regardless. No efficiency argument has ever reached that constituency.
Market Impact: Commits 1.5 billion euro instrument

Domestic Capacity Cannot Absorb Appropriated Money

Around 34% of equipment value goes to suppliers outside Europe because domestic industry could not deliver air defence, rotorcraft or munitions on the timescale governments needed. The root cause is decades of low order volumes that gave nobody reason to hold capacity against demand that never came. Money appropriated faster than capacity can be built either goes unspent or leaves the continent. Mitigation runs through multi-year contracting that justifies capital investment, government-funded facilities, and licensed production of foreign designs on European lines. Announcements arrive years before the capacity that follows them.
Market Impact: Raises output 3.2 times pre-war
3 additional market trends, 4 additional growth drivers, and 2 additional restraints and challenges are covered in the full report. Contact sales@marketmindsadvisory.com to access the complete intelligence.

Segment CAGR and Growth Architecture

Segmentation follows capability domain, since that determines which national industries compete, whether European capacity exists at all and how much of the requirement must be bought abroad. Six domains describe the market completely, from the land systems where fragmentation is most visible through to the air and missile defence that Europe allowed to lapse and is now rebuilding urgently.
europe-defense-market-market-share-analysis-1787997770482

Air and Missile Defence

The fastest domain grows at 11.7%, half again the market rate of 7.8%, and it grows because Europe spent three decades dismantling a capability it assumed nobody would ever need again. Multi-state initiatives now coordinate layered procurement across short, medium and long range systems, which is genuine collaborative behaviour of exactly the kind this market usually fails to produce. The difficulty is capacity. European production of interceptors and radars cannot meet the demand on the timescale governments require, so a large share of the spending reaches American and Israeli suppliers instead. That outcome is politically uncomfortable across the continent and entirely predictable given where the continent actually started from. Nobody should be surprised.
CAGR 11.7%

Munitions and Energetics

Munitions grow at 10.4% and represent the clearest case of European industry actually responding at speed. Artillery output has reached roughly 3.2 times its pre-conflict level, new shell and energetics plants have opened across Germany, Lithuania and Romania, and governments underwrote capacity that no commercial calculation would have justified. Energetics is where the constraint genuinely sits rather than shell bodies, because propellant and explosive production requires heavily regulated sites that take years to permit and build. The commercial question is what happens to that capacity when the current demand normalises, and no government has yet given a convincing answer to it. Capacity built for a war does not obviously suit a peace.
CAGR 10.4%
Full segment breakdown across 6 segments available in the complete report.

Regional Architecture and Country Demand Map

This is a European market, so Western Europe and Eastern Europe carry essentially all of it between them. Other regions appear as equipment suppliers filling gaps European industry cannot, as export customers, and as competitors for the same industrial capacity rather than as spending locations.

North America

Share sits far below the standard band because this report measures spending appropriated by European governments, though American suppliers capture a substantial part of what those governments actually spend. Roughly 34% of equipment value leaves the continent and the majority reaches United States industry, concentrated in air defence, rotorcraft, combat aircraft and munitions where European capacity could not deliver on the required timescale. Alliance interoperability requirements also shape European architectural choices well beyond the equipment purchased directly from American sources. A continent that appropriates the money and then watches a third of it leave for suppliers elsewhere has an industrial problem rather than a budgetary one, and every government involved understands that perfectly well.
Share: 3% | CAGR: 7.2% (2026 to 2036)

Western Europe

Effectively three quarters of the market sits here, far above the standard band, for the definitional reason that this report measures European government spending and the largest budgets are western. Fragmentation is most visible in this half of the continent, with France, Germany, Italy, Spain and the United Kingdom each protecting national industrial bases that duplicate one another comprehensively. Two competing sixth generation combat aircraft programmes run concurrently across these countries, which illustrates the consolidation problem more clearly than any statistic could. Running two competing sixth generation combat aircraft programmes across neighbouring countries at the same time is not a hedging strategy, and both groupings know that only one of them can plausibly reach production.
Share: 74% | CAGR: 6.4% (2026 to 2036)
Regional intelligence for 5 additional markets available in the complete report: East Asia, South Asia and Pacific, Latin America, Middle East and Africa, Eastern Europe. Contact sales@marketmindsadvisory.com.
europe-defense-market-country-cagr-analysis-1787997771007

Where European Defence Margin Sits

Four levers work on capacity, collaboration structure and export access rather than on technology, which European industry holds in genuine depth. Capacity commitment against multi-year contracts, union instrument positioning, licensed production of foreign designs and export run extension each address something a supplier controls without waiting for a consolidation that may never arrive at all.

Commit Capacity Against The Decade Not The Budget

Alliance commitments extend spending growth across a decade rather than a parliament, which is the first time in thirty years that a European supplier has been able to invest capital against a visible trajectory. Suppliers committing capacity early capture 25% to 35% more of the available work than those waiting for orders to prove the demand. The 34% of equipment value currently leaving the continent goes to whoever can deliver, and capacity built now determines how much of that returns to European lines within the next five years. The trajectory is the point.
Market Impact: Captures around 30% more of the available work

Position Inside Union Instruments Before They Allocate

Union funding instruments pay member states to buy jointly and subsidise industrial expansion, and the industrial participation is largely determined during programme design rather than through open competition afterwards. Suppliers engaged with national representatives during instrument design capture workshare at roughly 2.4 times the rate of those responding to published calls. The engagement costs government affairs staff rather than capital. Most suppliers treat these instruments as grant applications rather than as allocation processes, which is precisely why the positions remain available. Allocation happens well before anybody publishes anything at all.
Market Impact: Wins workshare at around 2.4 times the rate

Take Licensed Production Of Designs You Did Not Create

European states buying foreign air defence, artillery and rotorcraft increasingly attach domestic production requirements to those purchases, which places manufacturing with European suppliers on designs owned elsewhere. Margins run 3 to 5 points below own-design work and the volumes are considerable, and the capability transferred persists after the licence expires. Suppliers refusing licensed work on principle are conceding factory loading to competitors who accept it. The 34% of value leaving Europe is precisely the pool that licensed production recaptures. Principle is expensive when a competitor simply accepts the work instead.
Market Impact: Recaptures part of that 34% of equipment outflow

Extend Production Runs Through Export Campaigns

European domestic orders alone leave most production lines below efficient scale, because national requirements are fragmented across too many competing designs. Export orders from India, the Gulf, Latin America and Southeast Asia extend runs and improve unit cost by 12% to 20% on programmes that would otherwise carry fixed cost across very few units. Export campaigns require political support that suppliers cannot arrange alone. Those treating exports as opportunistic rather than as an essential element of programme economics consistently price uncompetitively. Political support has to be arranged years before the campaign starts.
Market Impact: Improves the programme unit cost by around 16%

Who Controls the Margin Pool

Concentration is low at around 33% across the five largest suppliers, and that fragmentation is the market's defining feature rather than an incidental statistic. National procurement preference protects domestic industry across more than twenty countries, so suppliers compete inside protected home markets and only occasionally against each other. Below them sits a deep tier of national champions, substantial at home and rarely competitive abroad.
Competition runs on three dimensions and price is seldom decisive. National standing is first, since a supplier without domestic presence frequently cannot bid at all. Delivery capacity is second and now the sharpest differentiator, since states buying urgently choose whoever can deliver. Export capability is the third, determining whether a programme reaches efficient scale or carries fixed cost across too few units.

Pressure is arriving from outside the continent. South Korean suppliers have won substantial European contracts on delivery speed, and American and Israeli industry captures most of the 34% leaving Europe. Union instruments meanwhile reallocate industrial participation toward whoever engages during design. Rankings shift against suppliers holding neither delivery capacity nor export reach, since national protection no longer guarantees work.
europe-defense-market-company-positioning-matrix-1787997771525

Competitive Moat and Risk Dimensions

RHEINMETALL

Moat: Munitions capacity built early

Rheinmetall committed to ammunition and energetics capacity expansion earlier and more aggressively than any European competitor, opening plants across several countries while others were still assessing whether demand would persist. That capacity is now the scarcest asset in European land warfare procurement. Building comparable energetics capability requires permitting and construction measured in years that no competitor can compress.
RHEINMETALL

Risk: Capacity sized against current demand

Energetics and shell capacity built against wartime consumption rates carries substantial fixed cost if demand normalises, and no government has yet committed to sustaining orders at the current level indefinitely. The plants cannot be repurposed to anything else. Capacity that is presently an advantage becomes an obligation the moment the ordering pattern shifts back toward peacetime volumes.
THALES

Moat: Sovereign positions across multiple states

Thales holds protected national positions across French, British and other European procurement in command systems, radar, communications and cyber, which produces revenue visibility across decades and insulation from open competition. Alliance spending commitments extend that trajectory considerably. Building comparable national standing from outside is effectively impossible, because the qualifying criteria are industrial and political rather than commercial.
THALES

Risk: Fragmented national requirement sets

Serving many European nations with distinct requirements, classification rules and release authorities produces engineering cost that a single-nation competitor never carries, and volume cannot recover it because each variant is small. Consolidation would help enormously and has been discussed for thirty years without result. Every additional national customer adds cost faster than it adds margin.

Players Tracked

Prominent Players

BAE Systems
Airbus Defence and Space
Leonardo
Thales
Rheinmetall

Other Key Players

Dassault Aviation
Saab
Naval Group
thyssenkrupp Marine Systems
Fincantieri
KNDS
Hensoldt
MBDA
Navantia
Diehl Defence
Rolls-Royce
Babcock International
Polska Grupa Zbrojeniowa
Kongsberg Gruppen
Indra Sistemas

Recent Developments

JUNE 2025

Alliance members agreed a higher long-term spending trajectory

Members of the principal Western alliance agreed at a summit during 2025 to raise defence-related spending substantially by the middle of the next decade, split between core defence and wider resilience categories. This was a multilateral political commitment rather than any commercial arrangement between suppliers or governments involved.
Signal: A decade-long trajectory changes what boards approve, which annual budget cycles never once managed to do.
MAY 2025

Union loan instrument established for joint defence procurement

A European Union instrument providing substantial loan capacity to member states for defence procurement was adopted, with conditions favouring joint purchase and European industrial content. This was regulatory and financial instrument creation by union institutions rather than any commercial arrangement between any of the defence suppliers themselves.
Signal: Making joint purchase cheaper than national purchase achieved what three decades of argument had not managed.
FEBRUARY 2025

New German ammunition plant entered production

A major new artillery ammunition manufacturing facility began production in Germany, part of a wider capacity expansion across several European countries funded partly by government guarantees on future ordering. This was a capacity investment decision by a manufacturer supported by public commitment rather than any merger or acquisition.
Signal: Capacity built ahead of confirmed demand is the only thing that has actually closed the shortfall.

What European Defence Production Costs

Programme cost divides into four components behaving very differently under expansion. Materials and purchased components absorb roughly 33% of production cost, with energetics, propellant and specialist metals all constrained independently. Manufacturing labour runs near 27%, engineering and development near 25%, and compliance with national certification and export control obligations accounts for the remaining 15% across a typical multinational programme.
The 2022 energy and materials shock demonstrated how exposed long-duration European programmes are. Energy intensive processes including forging, smelting and energetics production faced input costs that fixed price contracts signed years earlier could not accommodate, and several suppliers reported compressed programme profitability as a direct result. Rheinmetall and Thales both discussed input cost and supply chain pressure across that period in their annual reporting. Contract indexation varied enormously and determined who absorbed what.

Exposure varies by domain and by how many nations a programme serves. Multinational programmes carry certification and variant engineering cost that single-nation work never does, which is the mechanism through which fragmentation actually raises unit cost. Munitions producers carry energy intensity that other domains do not. Suppliers on licensed production of foreign designs carry royalty cost but avoid development risk entirely, which several have come to prefer.
europe-defense-market-cost-volatility-analysis-1787997771722

Multi-year contracting justifying capacity investment

No board installs energetics or shell capacity against a single year of orders, so multi-year contracting is the mechanism making capacity investment financeable at all. Governments have increasingly guaranteed offtake to secure it. Suppliers committing early capture disproportionate share, while those waiting find the capacity question settled by whoever happened to move first instead.

Variant reduction within multinational programme design

Multinational programmes accumulate national variants that each carry separate certification, engineering and support cost recovered across very few units. Constraining variants during programme design rather than accommodating every national preference is the single largest available cost saving. It requires member states to concede requirements, which is precisely why it so rarely happens at all.

Energy cost hedging across intensive production processes

Forging, smelting and energetics production are energy intensive enough that price movement materially changes programme profitability on fixed price terms. Hedging or indexation matched to actual consumption protects margin directly. Suppliers who arranged either before 2022 fared considerably better than those who assumed energy pricing would somehow remain stable indefinitely on into the future.

Portfolio Architecture for Margin Defence

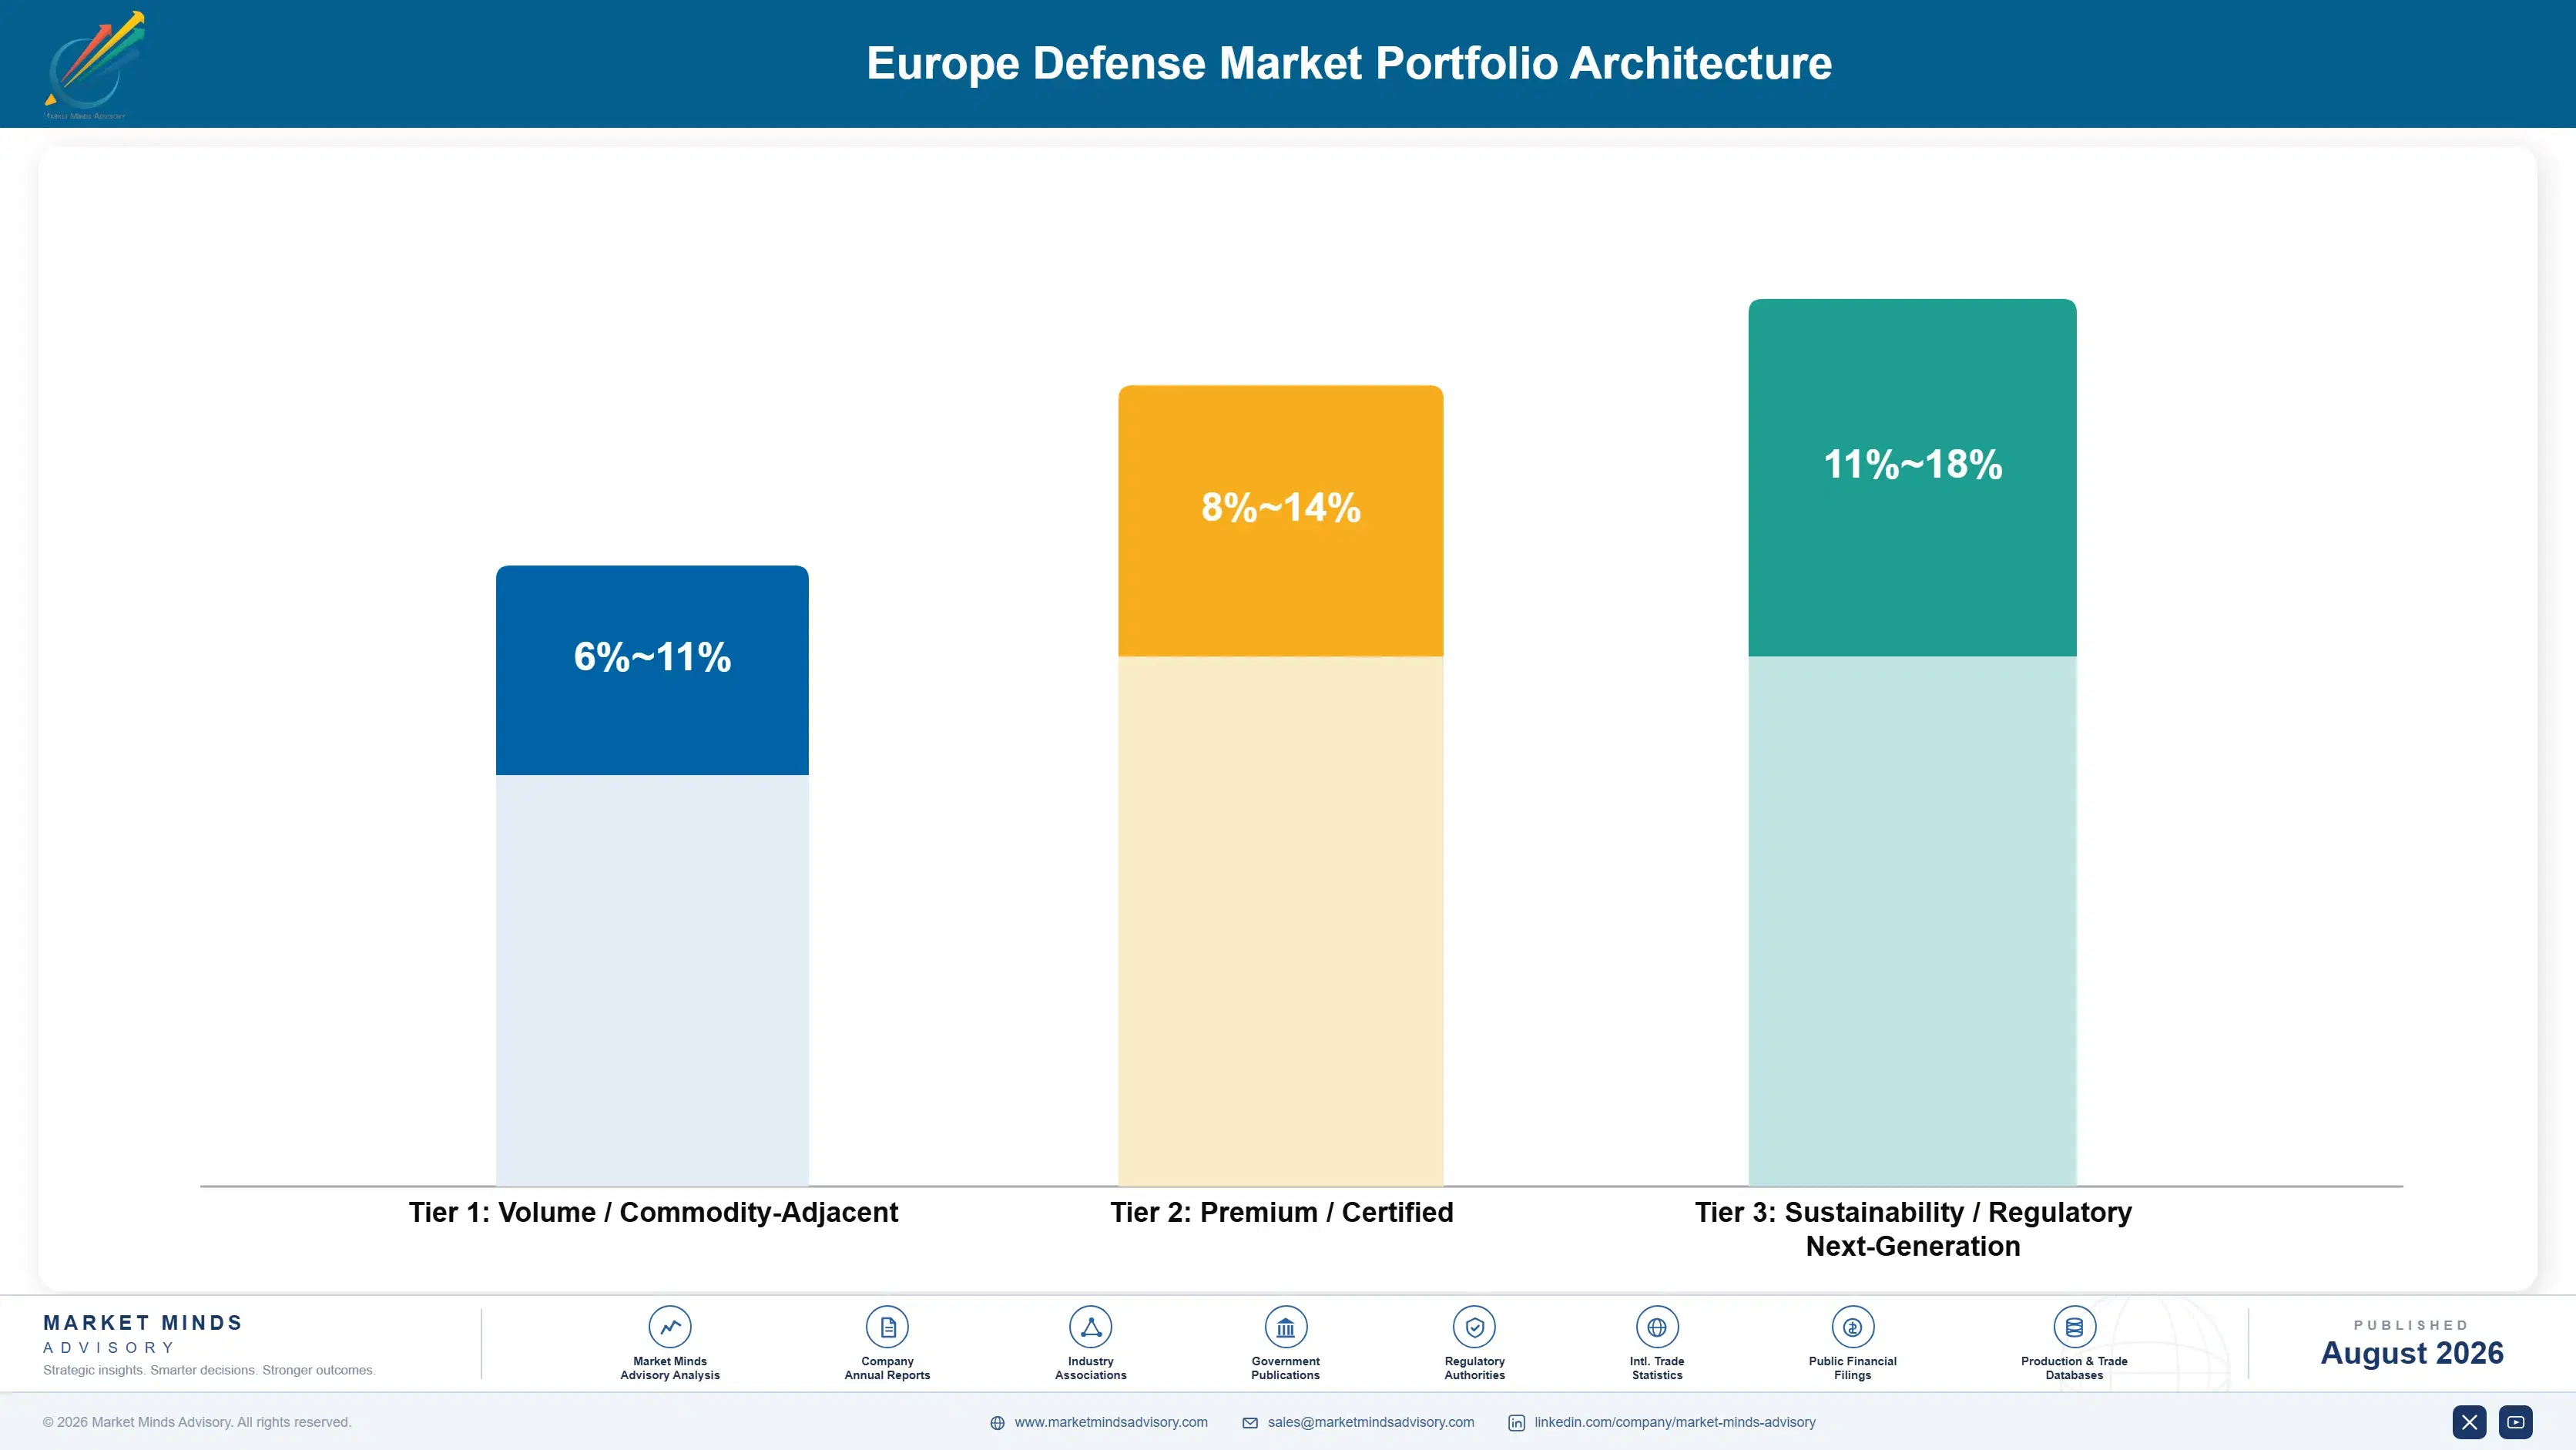
The portfolio separates by whether European capacity exists at the rate required. Land systems and support form the volume layer: substantial spending, many competing national suppliers, and margins compressed by fragmentation that spreads development cost across production runs far too short to be efficient. Suppliers hold this work because national protection guarantees it, not because the economics reward anybody involved particularly well at all. Nobody pretends otherwise.
Margin improves where capacity is genuinely scarce. Munitions, energetics and air defence all command pricing that reflects delivery capability rather than competitive tender, because states buying urgently choose whoever can actually deliver. The tension is that this scarcity is a function of current demand, and capacity built against wartime consumption becomes an expensive obligation if ordering normalises toward peacetime volumes again. Nobody will say when that happens.

The most durable positions are the sovereign ones. Command systems, cryptography and national nuclear-adjacent work are allocated by industrial policy rather than competition, produce revenue visibility across decades and cannot be reached by any foreign competitor whatever it offers. They will never grow quickly and they will also never disappear anywhere. That is worth more than it sounds.

Volume / Commodity-Adjacent

Land systems, armoured vehicles and equipment support across national programmes. Range spans five points because fragmentation spreads development cost across production runs whose length varies enormously between the various national requirements.
Gross Margin: 6-11%

Premium / Certified

Naval vessels, combat aircraft and major multinational platform programmes. Range spans six points because export participation changes unit economics substantially on otherwise comparable domestic production programmes right across the board.
Gross Margin: 8-14%

Sustainability / Regulatory / Next-Generation

Air and missile defence, munitions and energetics, and space, cyber and command systems. Range spans seven points because delivery capacity commands pricing that competitive tender in other domains never produces.
Gross Margin: 11-18%
europe-defense-market-portfolio-architecture-1787997772218

High-value Sub-segments and Strategic Watch-out

Air and Missile Defence

High value and high growth at 11.7%, rebuilding capability Europe dismantled across three decades. The five point range reflects whether a supplier holds actual production capacity or is competing on a specification against somebody who does. A specification on paper does not deliver any interceptors.
Gross Margin: 13-18%

Munitions and Energetics

High value with moderate growth at 10.4%, with output at roughly 3.2 times pre-conflict levels. The five point range separates suppliers holding permitted energetics capacity from those assembling shells with propellant bought from elsewhere. Propellant rather than shell bodies remains the actual binding constraint here.
Gross Margin: 11-16%

Land Systems and Armoured Vehicles

The volume core and the domain where fragmentation is most visible and most expensive. Twelve tank types across one continent spreads development cost across production runs that no manufacturer would choose to accept. No manufacturer anywhere would ever choose that particular arrangement voluntarily at all.
Gross Margin: 6-11%

Duplicated National Programmes

The strategic watch-out rather than a growth pool. Two competing sixth generation combat aircraft programmes run concurrently across Europe, and both cannot succeed commercially, yet neither government grouping will withdraw first. Somebody will eventually pay for that duplication, and it will not be the governments.
Gross Margin: Variable

Why National Programmes Persist

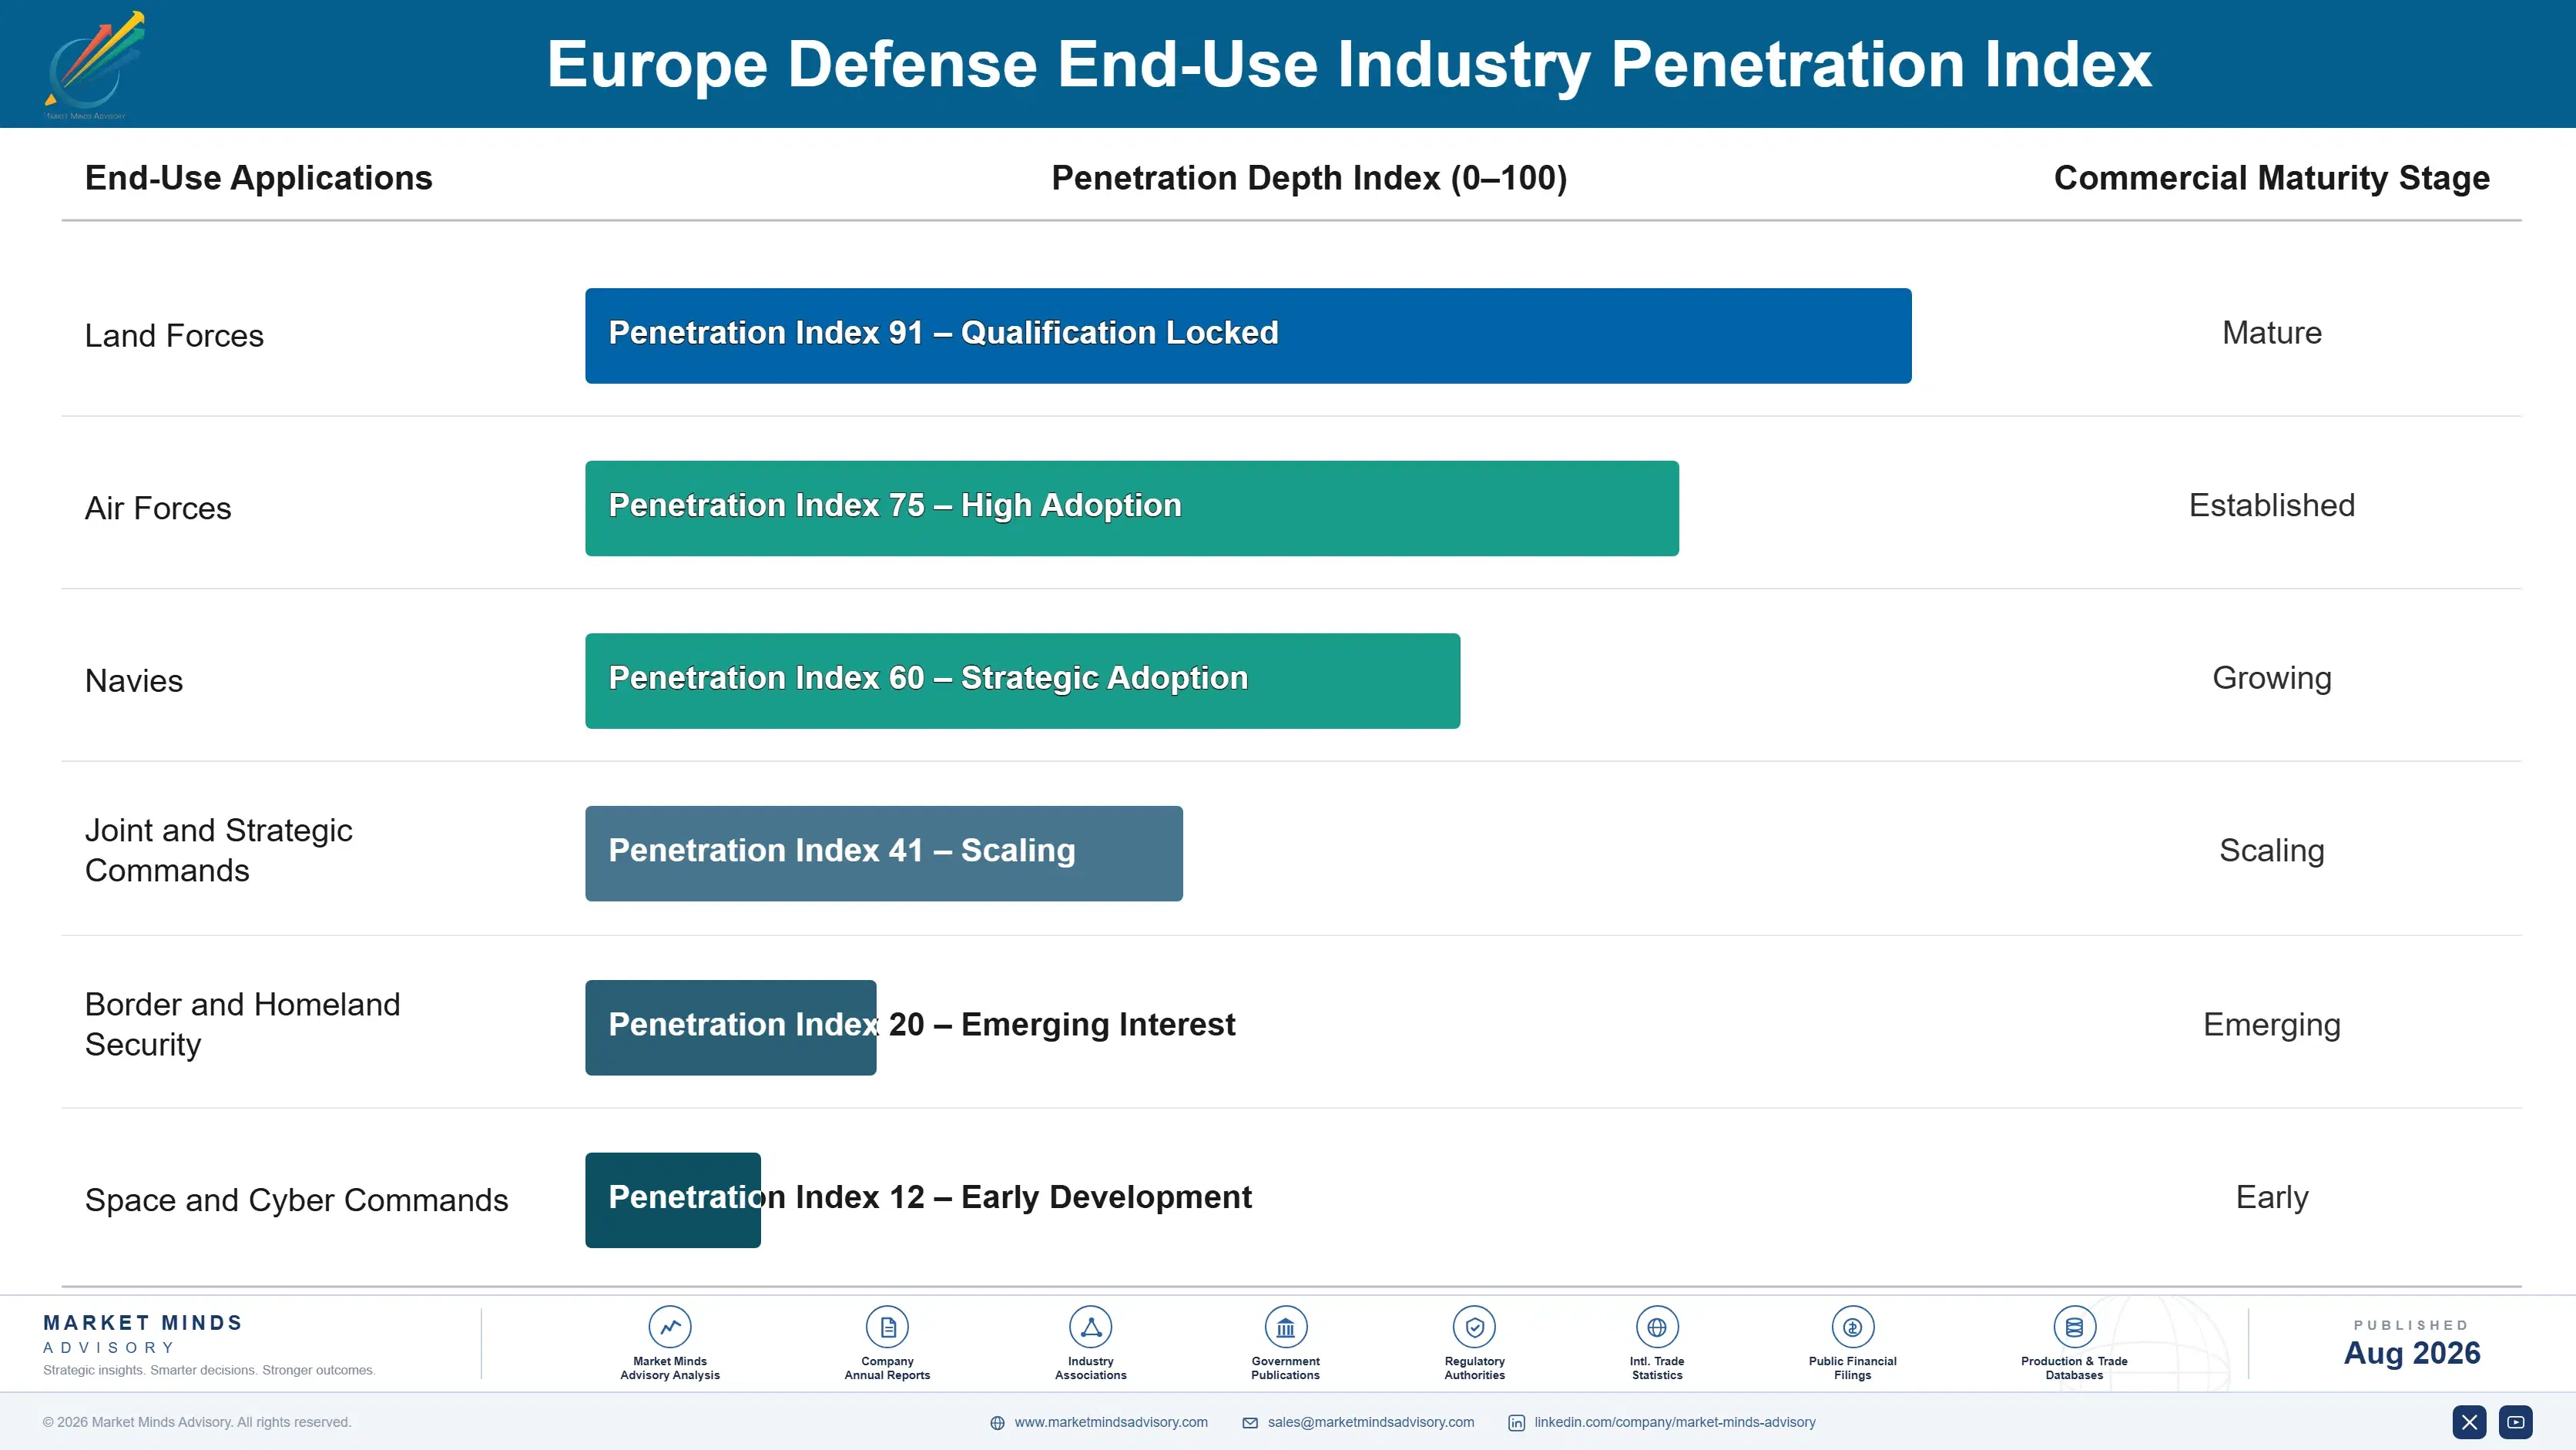
European defence demand persists because it is allocated politically rather than competitively. A national supplier holding a domestic programme keeps it for as long as the capability is required, since replacing it means importing something a parliament must then justify. That produces revenue visibility measured in decades and it is precisely the mechanism sustaining twelve tank types, because each one has a constituency defending it that no efficiency argument reaches.
Stickiness varies by how sovereign the capability is considered. Command systems, cryptography and nuclear-adjacent work never move, being allocated by industrial policy with no competitive process involved. Platform programmes move at generational refresh and only occasionally across borders. Munitions and commodity equipment move most readily, which is exactly why South Korean and American suppliers have won substantial European contracts on delivery speed alone.

The customer has changed faster than the industry has. Ministries accustomed to managing affordability by deferring programmes are now managing delivery against growing budgets, which demands different behaviour from everybody involved. Procurement officials who spent fifteen years negotiating scope reductions are now negotiating acceleration, and European industry is telling them capacity cannot be built at the speed the money arrives.
europe-defense-market-end-use-penetration-index-1787997772704

Where European Suppliers Should Commit

These are among the four positions where our research anticipates prominent divergence between winners and laggards over the coming forecast period. Each is grounded in the demand model, the regulatory perimeter, and the announced capacity pipeline.
01 / CAPACITY COMMITMENT TIMING

Build against the decade or watch the money leave

Alliance commitments extend spending growth across a decade rather than a single parliament, giving European suppliers their first visible investment trajectory in some thirty years of managed decline. Suppliers committing capacity early capture 25% to 35% more of the available work than those waiting for orders to prove that the demand is genuine. Roughly 34% of equipment value currently leaves the continent because domestic industry cannot deliver, and capacity built now determines how much of that value ever returns here.
02 / UNION INSTRUMENT POSITIONING

Workshare is allocated during design, not during tender

Union funding instruments pay member states to buy jointly and subsidise industrial expansion, and the industrial participation is largely determined while a programme is being designed rather than through any open competition afterwards. Suppliers engaged with national representatives during instrument design capture workshare at roughly 2.4 times the rate of those merely responding to published calls. The engagement costs government affairs staff rather than any capital, and most suppliers still treat these instruments as grant applications instead of allocation processes.
03 / LICENSED PRODUCTION ACCEPTANCE

Building somebody else's design keeps your factory loaded

European states buying foreign air defence, artillery and rotorcraft increasingly attach their own domestic production requirements, placing manufacturing with European suppliers on designs that are owned elsewhere entirely. Margins run some 3 to 5 points below own-design work, the volumes are considerable, and the capability transferred persists long after the licence itself expires. Suppliers refusing licensed work on principle are simply conceding factory loading to competitors who accept it, and the 34% outflow is exactly the pool that licensed production recaptures.
04 / EXPORT RUN EXTENSION

Domestic orders alone never reach efficient scale

European domestic orders leave most production lines below efficient scale, because national requirements fragment across too many competing designs to fill any single line properly. Export orders from India, the Gulf, Latin America and Southeast Asia extend runs and improve unit cost by 12% to 20% on programmes that would otherwise spread fixed cost across very few units. Export campaigns need political support suppliers cannot arrange alone, and treating them as opportunistic produces uncompetitive pricing more or less every time.

Engagement Snapshot From the Field

A live engagement with an industry participant carrying material or product regulatory and market exposure ahead of a defining policy shift, showing how our research translates into a defensible multi-year portfolio strategy.
MARKET MINDS ADVISORY · CLIENT ENGAGEMENT SUMMARY
Europe Defense Producer Strategic Portfolio Review and Transition Roadmap 2026·Investment Scenario on Europe Defense Exposure Evaluation 2025-26
CLIENT PROFILE
A European land systems manufacturer supplying armoured vehicles and support equipment to its own national customer and to two neighbouring states, holding a protected domestic position and a modest export record. Order intake had risen sharply after 2022 while delivery performance deteriorated, and management attributed the slippage to supply chain disruption rather than to any decision it had taken about its own capacity.
STRATEGIC CHALLENGE
The board needed to decide whether to commit capital to production capacity against a demand increase it suspected might prove temporary, knowing that a South Korean competitor had already won a substantial contract in a neighbouring market on delivery timescale alone. It also had no position inside the union funding instruments that were beginning to allocate industrial workshare across the continent.
MMA APPROACH
MMA decomposed delivery variance across eleven contracts, separating supplier constraint from internal capacity limits, and modelled return on capacity investment against several demand scenarios including a return toward pre-2022 ordering. Expert interviews with procurement officials, union programme staff and competing suppliers established what delivery timescales were actually deciding contracts and how workshare was being allocated.
KEY FINDINGS
  1. Internal capacity rather than supplier disruption accounted for 61% of delivery slippage across the eleven contracts, contradicting the explanation given to the board for three years.
  2. The lost neighbouring contract had been decided on delivery date rather than price or capability, and the client's quoted timescale had been eleven months longer than the winner's.
  3. Capacity investment returned above the cost of capital in four of five scenarios, including one assuming ordering fell back toward pre-2022 levels within four years.
  4. No engagement existed with union instrument programme design, and two workshare allocations in the client's own domain had already been settled without it being consulted.
CLIENT PROFILE
A European land systems manufacturer supplying armoured vehicles and support equipment to its own national customer and to two neighbouring states, holding a protected domestic position and a modest export record. Order intake had risen sharply after 2022 while delivery performance deteriorated, and management attributed the slippage to supply chain disruption rather than to any decision it had taken about its own capacity.
STRATEGIC CHALLENGE
The board needed to decide whether to commit capital to production capacity against a demand increase it suspected might prove temporary, knowing that a South Korean competitor had already won a substantial contract in a neighbouring market on delivery timescale alone. It also had no position inside the union funding instruments that were beginning to allocate industrial workshare across the continent.
MMA APPROACH
MMA decomposed delivery variance across eleven contracts, separating supplier constraint from internal capacity limits, and modelled return on capacity investment against several demand scenarios including a return toward pre-2022 ordering. Expert interviews with procurement officials, union programme staff and competing suppliers established what delivery timescales were actually deciding contracts and how workshare was being allocated.
KEY FINDINGS
  1. Internal capacity rather than supplier disruption accounted for 61% of delivery slippage across the eleven contracts, contradicting the explanation given to the board for three years.
  2. The lost neighbouring contract had been decided on delivery date rather than price or capability, and the client's quoted timescale had been eleven months longer than the winner's.
  3. Capacity investment returned above the cost of capital in four of five scenarios, including one assuming ordering fell back toward pre-2022 levels within four years.
  4. No engagement existed with union instrument programme design, and two workshare allocations in the client's own domain had already been settled without it being consulted.
RECOMMENDED STRATEGY
Phase 1: Phase one: commit capacity investment against multi-year contracting, prioritising the assembly and testing constraints that account for most delivery slippage. Phase 2: Phase two: place government affairs resource inside union instrument programme design rather than responding to published calls long after the allocation has happened. Phase 3: Phase three: pursue licensed production of a foreign air defence design to load capacity that domestic vehicle orders alone cannot fill efficiently.
OUTCOME
The client reported delivery slippage falling 42% within five quarters (client-reported, unverified by MMA), with most improvement following capacity rather than supplier changes. Workshare was secured on one union instrument programme after engagement began. A licensed production agreement entered negotiation during the fourth quarter of the review period.

Frequently Asked Questions

Foundational context covering the market sizes, CAGR, scope, country, region and competition that inform every finding below. This section is provided to cover basics and most often pre-purchase conversations, answered from the MMA Primary Research Dataset.

What is the current size of the Europe Defense Market?

The market is valued at USD 198.0 billion in 2025, measured as European government spending on defence equipment procurement, research and development, and equipment support.

How large will the Europe Defense Market be by 2036?

MMA forecasts USD 452.34 billion by 2036, up from USD 213.44 billion in 2026. That represents incremental spending of USD 238.90 billion and an expansion multiple of 2.12 times.

What is the CAGR for the Europe Defense Market 2026 to 2036?

The base case CAGR is 7.8%, with a bull case of 9.0% and a bear case of 6.6%. Alliance spending commitments agreed during 2025 supply most of that growth.

Which segment is growing fastest?

Air and missile defence grows at 11.7%, half again the market rate of 7.8%. Europe spent three decades dismantling a capability it is now rebuilding urgently.

Who are the major companies in the Europe Defense Market?

BAE Systems, Airbus Defence and Space, Leonardo, Thales and Rheinmetall lead on contract award value, holding around 33% between them across a deliberately fragmented market.

Which country is growing fastest?

India grows fastest at 9.8%, reflecting European defence exports of combat aircraft, submarines and helicopters there rather than any spending appropriated anywhere outside Europe itself.

Report Segmentation Architecture

The full report scope spans multiple orthogonal segmentation dimensions, with cross-tabulated demand data provided for each dimension pair. Coverage extends further to regional breakdowns, trend trajectories, and the competitive detail needed to support segment-level decision-making.

By Capability Domain

  • Land Systems and Armoured Vehicles
  • Air Combat and Aviation
  • Naval and Maritime
  • Air and Missile Defence
  • Munitions and Energetics
  • Space, Cyber and Command Systems

By End-Use Industry

  • Land Forces
  • Air Forces
  • Navies
  • Joint and Strategic Commands
  • Border and Homeland Security
  • Space and Cyber Commands

By Commercial Dimension

  • National Prime Contracting
  • Multinational Collaborative Programmes
  • European Union Funded Instruments
  • Foreign Military Sales
  • Licensed Domestic Production
  • Support and Availability Contracting

By Region

  • North America
  • Western Europe
  • East Asia
  • South Asia and Pacific
  • Latin America
  • Middle East and Africa
  • Eastern Europe

Scope, Methodology, and Coverage

Every figure in this report is reproducible from documented input assumptions. The scope below maps the historical period, the forecast horizon, the segmentation dimensions, and the countries covered, alongside the underlying primary and qualitative methodology.
Historical Period
2020 to 2025
Forecast Period
2026 to 2036
Base Year
2025 (USD billions; MMA Primary Research Dataset, August 2026)
Market Definition
European government spending on defence equipment procurement, research and development, and equipment support, spanning land systems and armoured vehicles, air combat and aviation, naval and maritime, air and missile defence, munitions and energetics, and space, cyber and command systems, across NATO European members, European Union member states and European non-aligned nations. National prime contracting, multinational collaborative programmes, union funded instruments, foreign military sales, licensed production and availability contracting are included. Personnel costs and pensions, civilian staff costs, non-equipment infrastructure and military aid transferred outside Europe are excluded.
Quantitative Units
USD billions, contract award value
Segmentation Dimensions
Capability domain, end-use force branch, commercial contracting dimension, region
Regions Covered
North America, Western Europe, East Asia, South Asia and Pacific, Latin America, Middle East and Africa, Eastern Europe
Countries Covered
United Kingdom, France, Germany, Italy, Spain, Poland, Netherlands, Sweden, Norway, Finland, Romania, Czechia, Greece, Denmark
Key Companies Profiled
BAE Systems, Airbus Defence and Space, Leonardo, Thales, Rheinmetall, Dassault Aviation, Saab, Naval Group, KNDS, MBDA
Quantitative Methodology
Primary survey, n=3,800 respondents, Q4 2025, six countries; demand-side model with trade association cross-validation
Qualitative Methodology
47 expert interviews, Q4 2025; applied to validate demand model assumptions, identify emerging dynamics, and assess competitive positioning
Report Format
PDF and XLSX data workbook (Word format preview document)
Publisher
Market Minds Advisory
Report Code
MMA-2026-CON-281
Published
August 2026
Contact
sales@marketmindsadvisory.com | www.marketmindsadvisory.com

Purchase the full Europe Defense Market Report (2026 to 2036).

The full report treats European defence as a fragmentation problem that money has made more visible rather than less, and shows where suppliers can act without waiting for consolidation. It quantifies the cost of duplicated national programmes, traces the 34% of equipment value leaving the continent by capability domain, and models capacity investment returns against demand scenarios including a return toward pre-2022 ordering. Segment analysis covers all six capability domains, with particular attention to air and missile defence where demand most exceeds European production capacity. Competitive assessment ranks twenty participants on European contract award value.
Six capability domain segmentation with growth rates
Equipment value leaving Europe by domain
Twenty participant assessment on award value
Capacity investment returns across demand scenarios
Union instrument workshare allocation analysis by state
Duplicated national programme cost quantified by domain

Built For The People Who Decide

From boardroom strategy to bench-side execution, this report is read cover-to-cover by leaders shaping the next decade of their industry, turning demand scenarios, market dynamics and valuation benchmarks into decisions.
CXOs/ Presidents/ VPs/ Managers
M&A and Corporate Development
Strategy Teams and R&D Heads
Procurement and Product Directors
Regulatory and Compliance Leaders
Investor Relations and Equity Analysts