Market Minds Advisory
Europe Charter Jet Services Market

Europe Charter Jet Services Market: Europe Charter Jet Services: Empty Legs, Fleet Access And The Broker Who Owns Nothing

Roughly two in five charter flights across Europe carry nobody at all, and the industry has spent twenty years failing to sell the empty seats on any of them profitably.

Lead Analyst

Published

September 2026

Make Smarter Decisions with Customized Research Insights

Request a free sample report and evaluate market opportunities, growth trends, and competitive dynamics relevant to your business needs.

2025 MARKET VALUE$6.8BMarket Size 2025
2036 FORECAST VALUE$14.6BBase Case , 2026 to 2036
CAGR 2026 TO 20367.2 %Bull 8.4% / Bear 6.0%
INCREMENTAL OPPORTUNITY$7.3BNet 10- year value creation
EXPANSION MULTIPLE2.00x2036 value over 2026 base
Strategic Levers
M&A Pipeline
Regional Outlook
Country Rankings
Competitive Intelligence
Segmental Deep-dive
Call-Us : 91 93563 13602

Executive Snapshot and Market Trajectory.

The economics of this business are decided by aircraft that fly empty. Positioning legs, repositioning after a one-way trip and return flights with nobody aboard consume roughly two fifths of all flying hours, and every attempt to sell that capacity has underdelivered. Nothing else matters as much.
Programme and jet card membership services grow fastest at 10.8%, because a customer who has prepaid wants guaranteed availability and a fixed rate rather than a quotation each time. That converts an unpredictable transactional business into contracted revenue with cash collected upfront. Operators without programme products depend entirely on brokers who own no aircraft and control the customer relationship completely. The prepaid balance also funds working capital that transactional charter never provides at all.
Concentration is very low at 26%. Most European operators run fewer than ten aircraft, national regulators certify them separately, and consolidation has repeatedly failed on cultural and regulatory grounds rather than commercial ones. The brokers meanwhile have consolidated considerably faster than the fleets they sell. That gap between who sells the flying and who operates it explains most of where the margin in this business has ended up.
Market Definition
Revenue from on-demand and contracted private jet charter flown within, from and to Europe, covering ad hoc charter brokerage, direct operator charter sales, programme and jet card membership services, fractional ownership programme flight revenue, aircraft management with charter release, and empty leg and shared charter distribution. Excludes aircraft sales and acquisition, scheduled commercial aviation, cargo charter, helicopter operations, and maintenance revenue not associated with a charter flight.
Base Year Value
$6.8B in 2025 (MMA Primary Research Dataset, August 2026)
Forecast Period
2026 to 2036, eleven discrete annual values
CAGR
7.2% base case. Bull 8.4%. Bear 6.0%.
Fastest Growth Segment
Programme and Jet Card Membership Services: 10.8% CAGR
Fastest Growth Country
India: 9.2% CAGR
Fastest Growth Region
South Asia and Pacific: 9.2% CAGR
Largest Region
Western Europe: 58% of 2025 global value
Market Leaders
VistaJet, NetJets Europe, Luxaviation, GlobeAir and Air Charter Service lead on European charter flight revenue. Source: company annual reports and MMA Primary Research Dataset, July 2026.
Primary Survey
n=3,800 procurement and R&D decision-makers, Q4 2025, six countries
Methodology
Demand-side build-up, cross-validated against public data, 47 expert interviews

Europe Charter Jet Services Market Forecast Scenarios

europe-charter-jet-services-market-size-forecast-scenario-1788025470905
The 2020 to 2025 period brought a wave of new customers and then tested whether they would stay. Travellers who moved to private aviation during the disruption of scheduled service kept flying at rates the industry had not expected, though price sensitivity returned considerably faster than operators assumed. Environmental scrutiny intensified across several jurisdictions. Revenue compounded near 6.0%, on higher flight volumes at rates that softened through the later years.
Three mechanisms carry the base case. Programme and membership products continue converting transactional customers into contracted ones with prepaid balances. Fleet renewal toward newer light and midsize aircraft lowers operating cost per hour on the routes that dominate European charter. And corporate demand is recovering as scheduled network cuts on secondary city pairs make charter genuinely competitive rather than merely faster. None of the three requires the empty leg problem solved.
The bull catalyst is a workable market for empty leg capacity, which would convert roughly two fifths of flying hours from cost into revenue and reset industry economics entirely. The bear risk is regulatory: departure taxation or movement restrictions aimed at private aviation would fall hardest on the short intra-European sectors that generate most of the volume.

Two In Five Flights Carry Nobody

Nothing about this business makes sense until the empty legs are understood. Around 41% of flying hours carry no passengers, because an aircraft flying a client to Geneva has to get there first and get somewhere useful afterwards. Average sector length of about 1.6 hours makes those positioning flights proportionally enormous. Every attempt to sell that capacity hits the same problem: the customer wanting it rarely wants it exactly then.
MARKET CONCENTRATION CR526%Share of European charter revenue held by leading participants
EMPTY LEG SHARE41%Proportion of flying hours operated without any passengers aboard
AVERAGE SECTOR LENGTH1.6 hoursTypical flight duration across intra-European charter movements today
BROKER INTERMEDIATED SHARE63%Charter revenue booked through parties owning no aircraft
FLEET UTILISATION412 hoursAverage annual flying hours per aircraft across managed fleets
PROGRAMME REVENUE SHARE29%Revenue from prepaid membership rather than transactional booking
The second thing to understand is who actually holds the customer. Roughly 63% of charter revenue is booked through brokers who own no aircraft, carry no operating risk and control the relationship. Operators supplying capacity compete on price for work whose origin they never see. The brokers have consolidated steadily while the operating fleet has not, shifting margin toward the party carrying least exposure.
Fragmentation on the operating side is extreme and durable. Concentration sits at 26%, most operators run fewer than ten aircraft, and each national authority certifies separately in ways that make cross-border consolidation genuinely difficult rather than merely tiresome. Utilisation around 412 hours per aircraft annually reflects fleets sized for peak demand they cannot fill the rest of the year.
"The whole industry knows that two in five flights are empty and has known for decades. Nobody has fixed it because fixing it requires operators to cooperate on capacity, which is precisely the thing this business has never been able to do."
Director, Business Aviation Practice · MMA Business Aviation Services Practice · August 2026

Market Trends

Programme Products Convert Transactional Customers Into Contracted Ones

Membership and jet card products give the customer guaranteed availability at a fixed hourly rate and give the operator prepaid cash and predictable demand, which is a considerably better business than quoting every trip individually. Programme revenue now represents 29% of the total and grows at 10.8% against a market rate of 7.2%. Operators without a programme product depend on brokers for demand and hold no customer relationship of their own at all. A relationship the operator owns is worth considerably more than a trip it merely happens to fly.
Market Impact: Replaces 2 flight connections
Broker Consolidation Outpaced Operator Consolidation Considerably

Around 63% of European charter revenue is now booked through brokers, and those brokers have combined into larger groups while the operating fleet remains split across hundreds of small certificate holders. The party owning no aircraft and carrying no operational risk has therefore gained negotiating position against the party carrying all of it. Operators supplying capacity into broker demand compete on price for trips whose customers they never meet or identify. The party with the least exposure has ended up with the strongest position, which is an unusual outcome and a durable one.
Market Impact: Cuts hourly cost by 12%

Market Opportunities and Growth Drivers

Scheduled Network Cuts Make Charter Competitive On Secondary Routes

Airlines withdrawing from secondary European city pairs have left connections requiring two flights and most of a day, against a charter sector averaging around 1.6 hours direct. For a small group travelling together the arithmetic works commercially rather than merely conveniently, which is a different customer from the traditional private aviation buyer. Corporate demand on those routes has recovered faster than leisure demand. The pattern follows airline network decisions rather than anything charter operators control. Charter competing on arithmetic rather than on exclusivity is a genuinely different proposition to sell.
Market Impact: Wastes 41% of flying hours

Light And Midsize Fleet Renewal Lowers Cost Per Hour

Newer light and midsize aircraft entering European fleets carry lower fuel burn, longer maintenance intervals and better dispatch reliability than the types they replace, which matters disproportionately on sectors averaging 1.6 hours where fixed costs dominate. Operators renewing fleets can price below competitors flying older equipment while holding margin. The effect compounds with utilisation, since a more reliable aircraft flies more of the hours it is scheduled for and cancels considerably fewer trips. Reliability matters more than speed on these sectors, because a cancelled trip costs the relationship rather than the hour.
Market Impact: Holds concentration at 26%

Market Restraints and Challenges

Empty Legs Resist Every Attempt To Monetise Them

Roughly 41% of flying hours carry no passengers and every platform built to sell that capacity has underdelivered against its projections. The root cause is timing rather than pricing: the customer who would happily fly Nice to Geneva for a fraction of the charter rate almost never wants to do it in the ninety minute window when the aircraft is actually going. Mitigation runs through flexible date products, shared charter aggregation, and operator cooperation on capacity that this industry has never managed. Timing is a harder problem than price and always has been.
Market Impact: Produces 29% of total revenue

National Certification Blocks Cross Border Consolidation

Operators hold air operator certificates issued by national authorities, and combining fleets across borders means reconciling separate approvals, crew licensing arrangements and oversight relationships rather than simply merging companies. The root cause is that safety oversight remains national despite common European rules. Commercially it keeps concentration at 26% and prevents the scale that would fix utilisation. Mitigation runs through multi-certificate group structures, capacity sharing agreements short of merger, and management contracts across borders. Every one of those routes stops short of the scale that would actually fix utilisation across the region.
Market Impact: Intermediates 63% of revenue
4 additional market trends, 3 additional growth drivers, and 2 additional restraints and challenges are covered in the full report. Contact sales@marketmindsadvisory.com to access the complete intelligence.

Segment CAGR and Growth Architecture

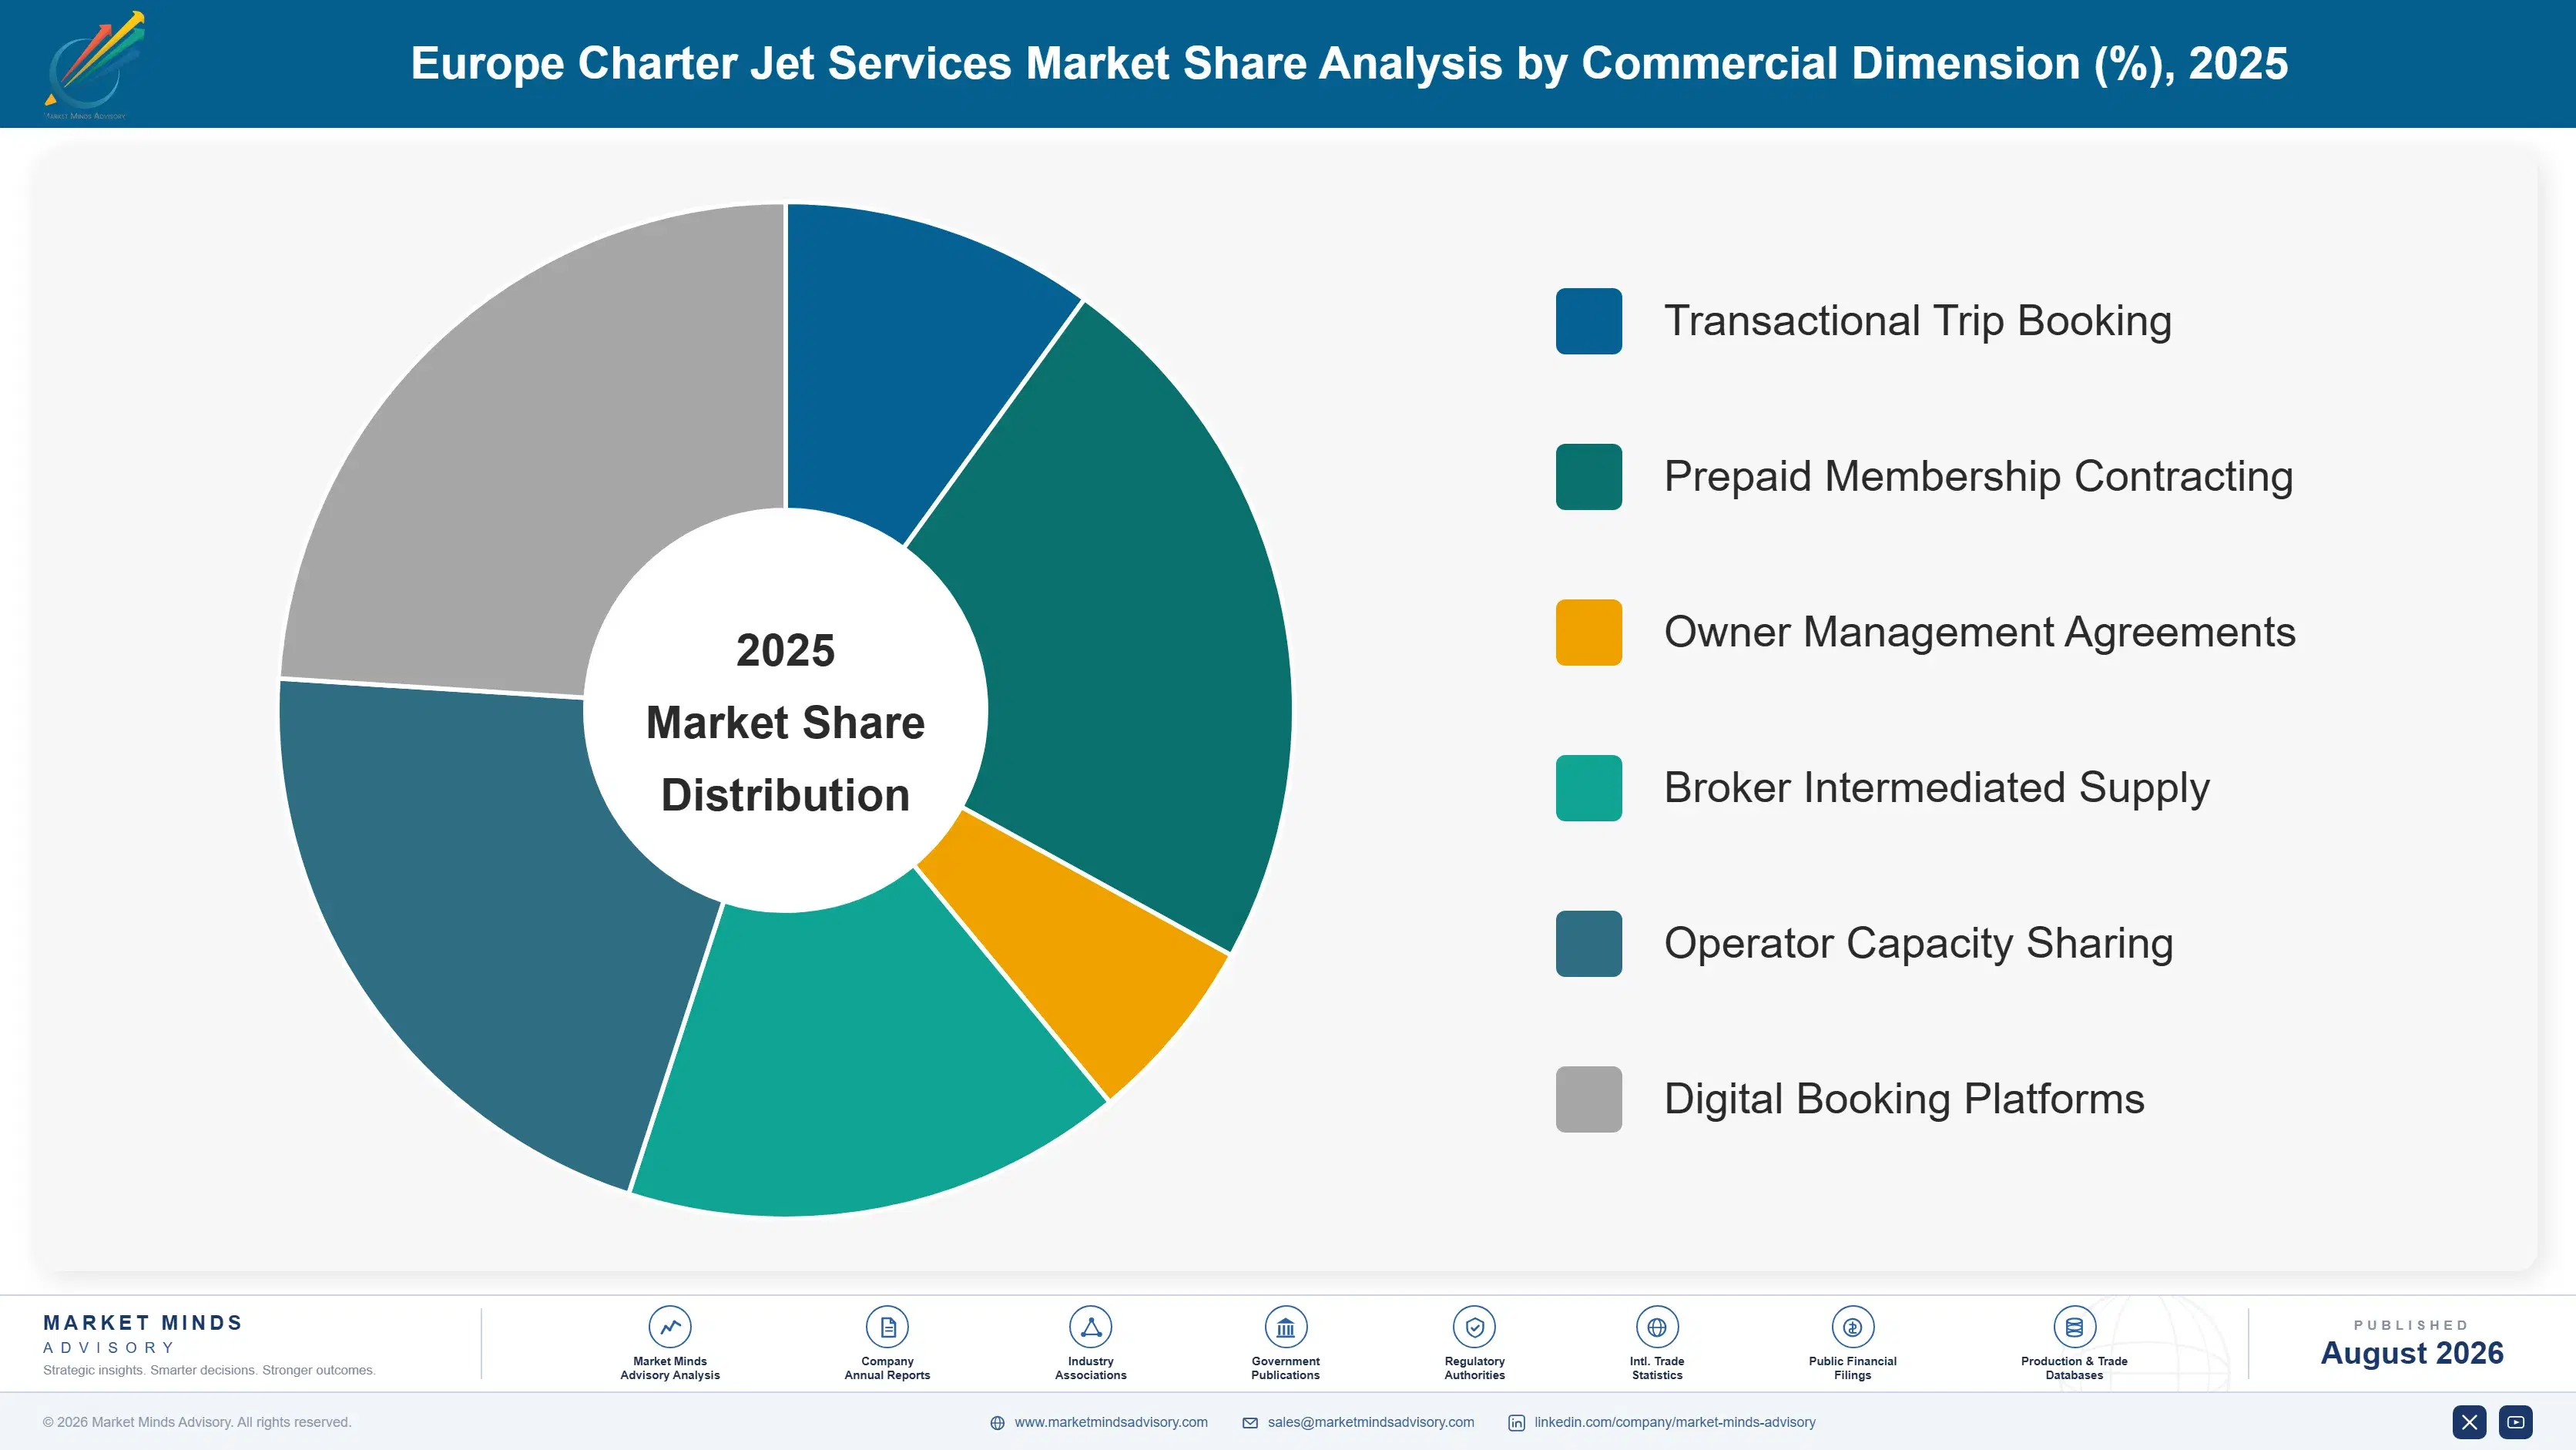
Segmentation follows commercial model, since each carries a different customer relationship, a different revenue pattern and a different position between operator and passenger. Six models describe the market completely, from ad hoc brokerage where the intermediary owns nothing through to programme membership where the customer has already paid before choosing any destination at all.
europe-charter-jet-services-market-market-share-analysis-1788025471515

Programme and Jet Card Membership Services

The fastest model grows at 10.8%, half again the market rate of 7.2%, and it grows because it solves problems for both sides at once. The customer gets guaranteed availability and a fixed hourly rate instead of a quotation that moves with demand. The operator gets prepaid cash, predictable flying and a relationship it owns rather than rents from a broker. Programme revenue now carries 29% of the market. Operators without such a product depend on intermediaries for demand, never meet the passenger, and compete purely on price for trips whose origin they cannot see and cannot influence at all. Owning the customer relationship is the whole argument for this product.
CAGR 10.8%

Aircraft Management With Charter Release

Management with charter release grows at 8.6% on a proposition that suits owners and operators equally. An owner flying perhaps 120 hours a year carries the full fixed cost of an aircraft used a third as much as it could be, and releasing it for charter recovers a meaningful share of that without surrendering control of availability. The operator gains fleet capacity without capital. Managed aircraft now supply much of the European charter fleet, and utilisation near 412 hours annually reflects how much of the flying comes from exactly this arrangement rather than from owned aircraft. Capacity that arrives without capital attached is worth a great deal in a fragmented business.
CAGR 8.6%
Full segment breakdown across 6 segments available in the complete report.

Regional Architecture and Country Demand Map

This is a regionally scoped market, so the flying sits within and around Europe. The seven-region split therefore describes where the customers, capital, fleet supply and competing operating models associated with that flying originate rather than distributing the revenue itself. The distinction matters commercially in this case.

Western Europe

Out-of-band note: this region holds 58% against a band of 18 to 26% because the market is defined as charter flown within and around Europe, so the home region necessarily dominates. Flying concentrates on a small number of city pairs and seasonal patterns, with the Mediterranean, the Alps and the major financial centres accounting for a disproportionate share. Operator fragmentation is extreme, with hundreds of certificate holders running fewer than ten aircraft each. Fleet renewal toward light and midsize types continues steadily across the region. Seasonality is more pronounced here than in any comparable market, with summer Mediterranean traffic and winter Alpine demand producing peaks that fleets sized for them cannot fill across the rest of the year.
Share: 58% | CAGR: 6.0% (2026 to 2036)

North America

Out-of-band note: the 14% share reflects capital, operating models and fleet supply rather than demand located here. American programme and fractional models were imported into Europe and adapted rather than invented locally, and the largest programme operators here hold European subsidiaries. Investment capital for European operator consolidation originates substantially in this region. Aircraft acquisition, management practice and jet card product design all follow patterns established across the Atlantic considerably earlier than they arrived in Europe. The direction of influence has been one-way for thirty years, and European operators adapting American commercial models rather than inventing their own is the reason this market looks familiar to anybody who knows the domestic business there.
Share: 14% | CAGR: 7.6% (2026 to 2036)
Regional intelligence for 5 additional markets available in the complete report: Eastern Europe, Middle East and Africa, East Asia, South Asia and Pacific, Latin America. Contact sales@marketmindsadvisory.com.
europe-charter-jet-services-market-country-cagr-analysis-1788025472040

Where Charter Operators Actually Earn

Four levers work on customer ownership, capacity utilisation and cost position rather than on fleet size, which decides considerably less than operators assume. Programme products, direct distribution, capacity cooperation and managed fleet expansion each address something an operator can act on now. None of the four requires buying a single additional aircraft, which is rather the point.

Launch A Programme Product Before Brokers Take Everything

Programme and jet card products carry 29% of market revenue, grow at 10.8%, and give an operator a customer relationship it owns rather than rents from an intermediary. Prepaid balances also fund working capital that transactional charter never provides. Building the product needs pricing discipline, availability guarantees and a service organisation rather than more aircraft. Operators without one will keep supplying broker demand at prices set by whoever bids lowest on the day, indefinitely. Nobody in this market has ever won a broker-intermediated trip on anything except price alone, ever.
Market Impact: Captures the whole 29% programme revenue share directly

Take Direct Distribution Back From Intermediaries

Roughly 63% of European charter revenue is booked through brokers who own no aircraft and carry no operational risk, and the commission on that sits between 8 and 15 percent of trip value. Operators building direct booking, repeat customer relationships and their own demand generation recover both the commission and the relationship. It requires commercial capability most operating businesses have never employed. The brokers consolidated while operators did not, and that gap widens every year it goes unaddressed. Recovering 12% of trip value is the difference between margin and none.
Market Impact: Recovers roughly 12% paid in broker commission typically

Cooperate On Capacity Rather Than Competing Blindly

Around 41% of flying hours carry nobody, and the reason is that each operator plans capacity alone while an aircraft positioning empty passes another doing exactly the same thing in reverse. Capacity sharing arrangements short of merger address that without touching certificates or ownership. The commercial obstacle is trust rather than regulation or technology. Operators who have tried it report utilisation gains of 6 to 10 percent, which on these margins is the difference between a good year and a poor one. Nobody has to give up a certificate to do it.
Market Impact: Lifts fleet utilisation by roughly 8 points annually

Grow Managed Fleet Instead Of Buying Aircraft

An owner flying perhaps 120 hours a year holds an asset used at a third of its capability, and charter release recovers cost for them while supplying an operator with fleet capacity requiring no capital at all. Managed aircraft already supply much of the European charter fleet. The proposition is genuinely mutual rather than merely presented as such, and it scales considerably faster than any acquisition programme. Operators buying aircraft to grow are choosing the slowest and most expensive available route. Capital committed to aircraft is capital not spent on customers.
Market Impact: Adds fleet capacity at 0 capital cost whatsoever

Who Controls the Margin Pool

Concentration is very low at around 26% across the five largest participants measured on European charter flight revenue, and it has stayed low for reasons that are regulatory as much as commercial. Hundreds of operators hold national certificates and run fewer than ten aircraft each. The group at the top mixes programme operators, large managed fleets and brokers who own nothing at all.
Competition runs on customer access, availability and price, roughly in that order of durability. Customer access decides who captures margin rather than supplying capacity, and brokers currently hold most of it. Availability decides whether a programme product is worth what customers pay for it. Price decides everything on the broker-intermediated work, which is a competition on cost with no relationship attached.

Pressure is arriving from brokers moving toward capacity control and from programme operators expanding fleets. Both are attempts to hold customer and aircraft together, which is the position the fragmented middle of this market cannot occupy. Rankings will shift toward participants combining owned customer relationships with reliable capacity access, since operators without customers and brokers without aircraft each depend on the other entirely.
europe-charter-jet-services-market-company-positioning-matrix-1788025472563

Competitive Moat and Risk Dimensions

VISTAJET

Moat: Programme model with owned fleet

VistaJet built a programme business around a single-type owned fleet, which gives it consistent product delivery and a direct customer relationship that most European operators never acquire. Prepaid programme balances fund working capital that transactional operators have to finance themselves. Global positioning lets it recover empty sectors across a wider network than any purely European operator can access.
VISTAJET

Risk: Capital intensity of owned fleet

Owning the fleet rather than managing it carries financing cost and residual value exposure through demand cycles that asset-light competitors avoid entirely. A soft period leaves fixed capital against reduced flying. Programme commitments also oblige availability whether or not the underlying demand supports the aircraft standing ready for it.
AIR CHARTER SERVICE

Moat: Customer access without operating risk

Air Charter Service holds customer relationships across a very wide base while owning no aircraft and carrying no operational exposure, which is the most comfortable position in this market by some distance. Around 63% of European charter revenue moves through intermediaries of this kind. Scale in demand aggregation gives it pricing position against fragmented operators competing for each trip.
AIR CHARTER SERVICE

Risk: No capacity control during peaks

Owning no aircraft means availability during peak periods depends entirely on operators who may prefer their own programme customers, which is precisely when the customer relationship is tested. Programme operators moving to hold customers directly attack the intermediated share. A broker without capacity access has very little to defend.

Players Tracked

Prominent Players

VistaJet
NetJets Europe
Luxaviation
GlobeAir
Air Charter Service

Other Key Players

Flexjet Europe
Jet Aviation
TAG Aviation
Gama Aviation
Elit'Avia
Comlux
DC Aviation
Air Hamburg
Albinati Aeronautics
Victor
PrivateFly
Avinode
Zenith Jet
Jetex
European Flight Service

Recent Developments

FEBRUARY 2024

Programme operator expanded membership product across European markets

A charter operator extended a prepaid membership product into additional European markets, offering guaranteed availability at fixed hourly rates in place of trip-by-trip quotation. This was a commercial product launch rather than any acquisition, merger or joint venture between the participants involved in the market.
Signal: Prepaid membership converts transactional demand into contracted revenue and funds working capital at the same time.
SEPTEMBER 2024

Broker group acquired a European charter operator outright

A charter brokerage group acquired an operating company holding its own air operator certificate, moving from pure intermediation toward controlling capacity during periods when availability rather than price determines the customer outcome. This was an acquisition rather than a merger or joint venture between the two businesses.
Signal: Brokers buying operators shows that capacity access matters most exactly when demand actually peaks in the year.
JUNE 2025

Operators agreed capacity sharing arrangement across national certificates

Several European operators agreed a capacity sharing arrangement covering positioning flights and peak overflow, coordinating availability without combining certificates or ownership between any of the businesses involved. This was a commercial cooperation agreement rather than any merger, acquisition or joint venture entity being formed between them.
Signal: Cooperation short of merger is the only route around certification barriers that continue to block consolidation.

What A Charter Hour Costs

Cost divides four ways and fuel is smaller than most people expect. Crew, training and positioning absorb roughly 33% of hourly cost, maintenance and airworthiness near 26%, fuel near 22%, and navigation, handling and airport charges the remaining 19%. Sectors averaging 1.6 hours make handling and airport charges disproportionately heavy, since those are levied per movement rather than per hour flown.
Jet fuel pricing moved sharply across recent years and moved charter economics with it, though less than commonly assumed given fuel is only about a fifth of hourly cost. IEA aviation fuel price data tracks the movement through the period. Crew availability has been the more damaging constraint, since a shortage of type-rated pilots raised salaries across the whole industry and those increases have proved entirely permanent rather than cyclical.

Exposure varies by fleet model rather than by geography. Operators flying managed aircraft pass ownership and financing cost to the owner and carry only operating exposure. Owned-fleet operators carry both, which is comfortable in a strong market and painful otherwise. Operators on broker-intermediated work carry full cost against pricing set by whoever bids lowest, while programme operators price ahead and hold cash before the flying happens.
europe-charter-jet-services-market-cost-volatility-analysis-1788025472758

Crew retention against permanently higher salary levels

Type-rated crew shortage raised salaries across the industry and those increases have not reversed, which makes retention considerably cheaper than replacement at current market rates. Rostering stability, base predictability and type continuity retain crew more effectively than pay alone does. Operators competing purely on salary are bidding against every other operator for the same very small pool.

Handling and airport charge negotiation at high frequency bases

Sectors averaging 1.6 hours make per-movement charges disproportionately heavy, and operators flying repeatedly through the same bases rarely negotiate rates reflecting that frequency. Volume agreements at handling agents and airports are available and routinely left unrequested. The saving is unglamorous and it falls straight through to margin on every single sector the operator actually flies.

Managed fleet growth transferring ownership cost to owners

Managed aircraft carry ownership, financing and residual value exposure on the owner's balance sheet rather than the operator's, while still supplying charter capacity. Growing through management rather than acquisition removes the cost that punishes owned-fleet operators through soft periods. The proposition genuinely suits owners flying well below what their aircraft could comfortably achieve in any given year.

Portfolio Architecture for Margin Defence

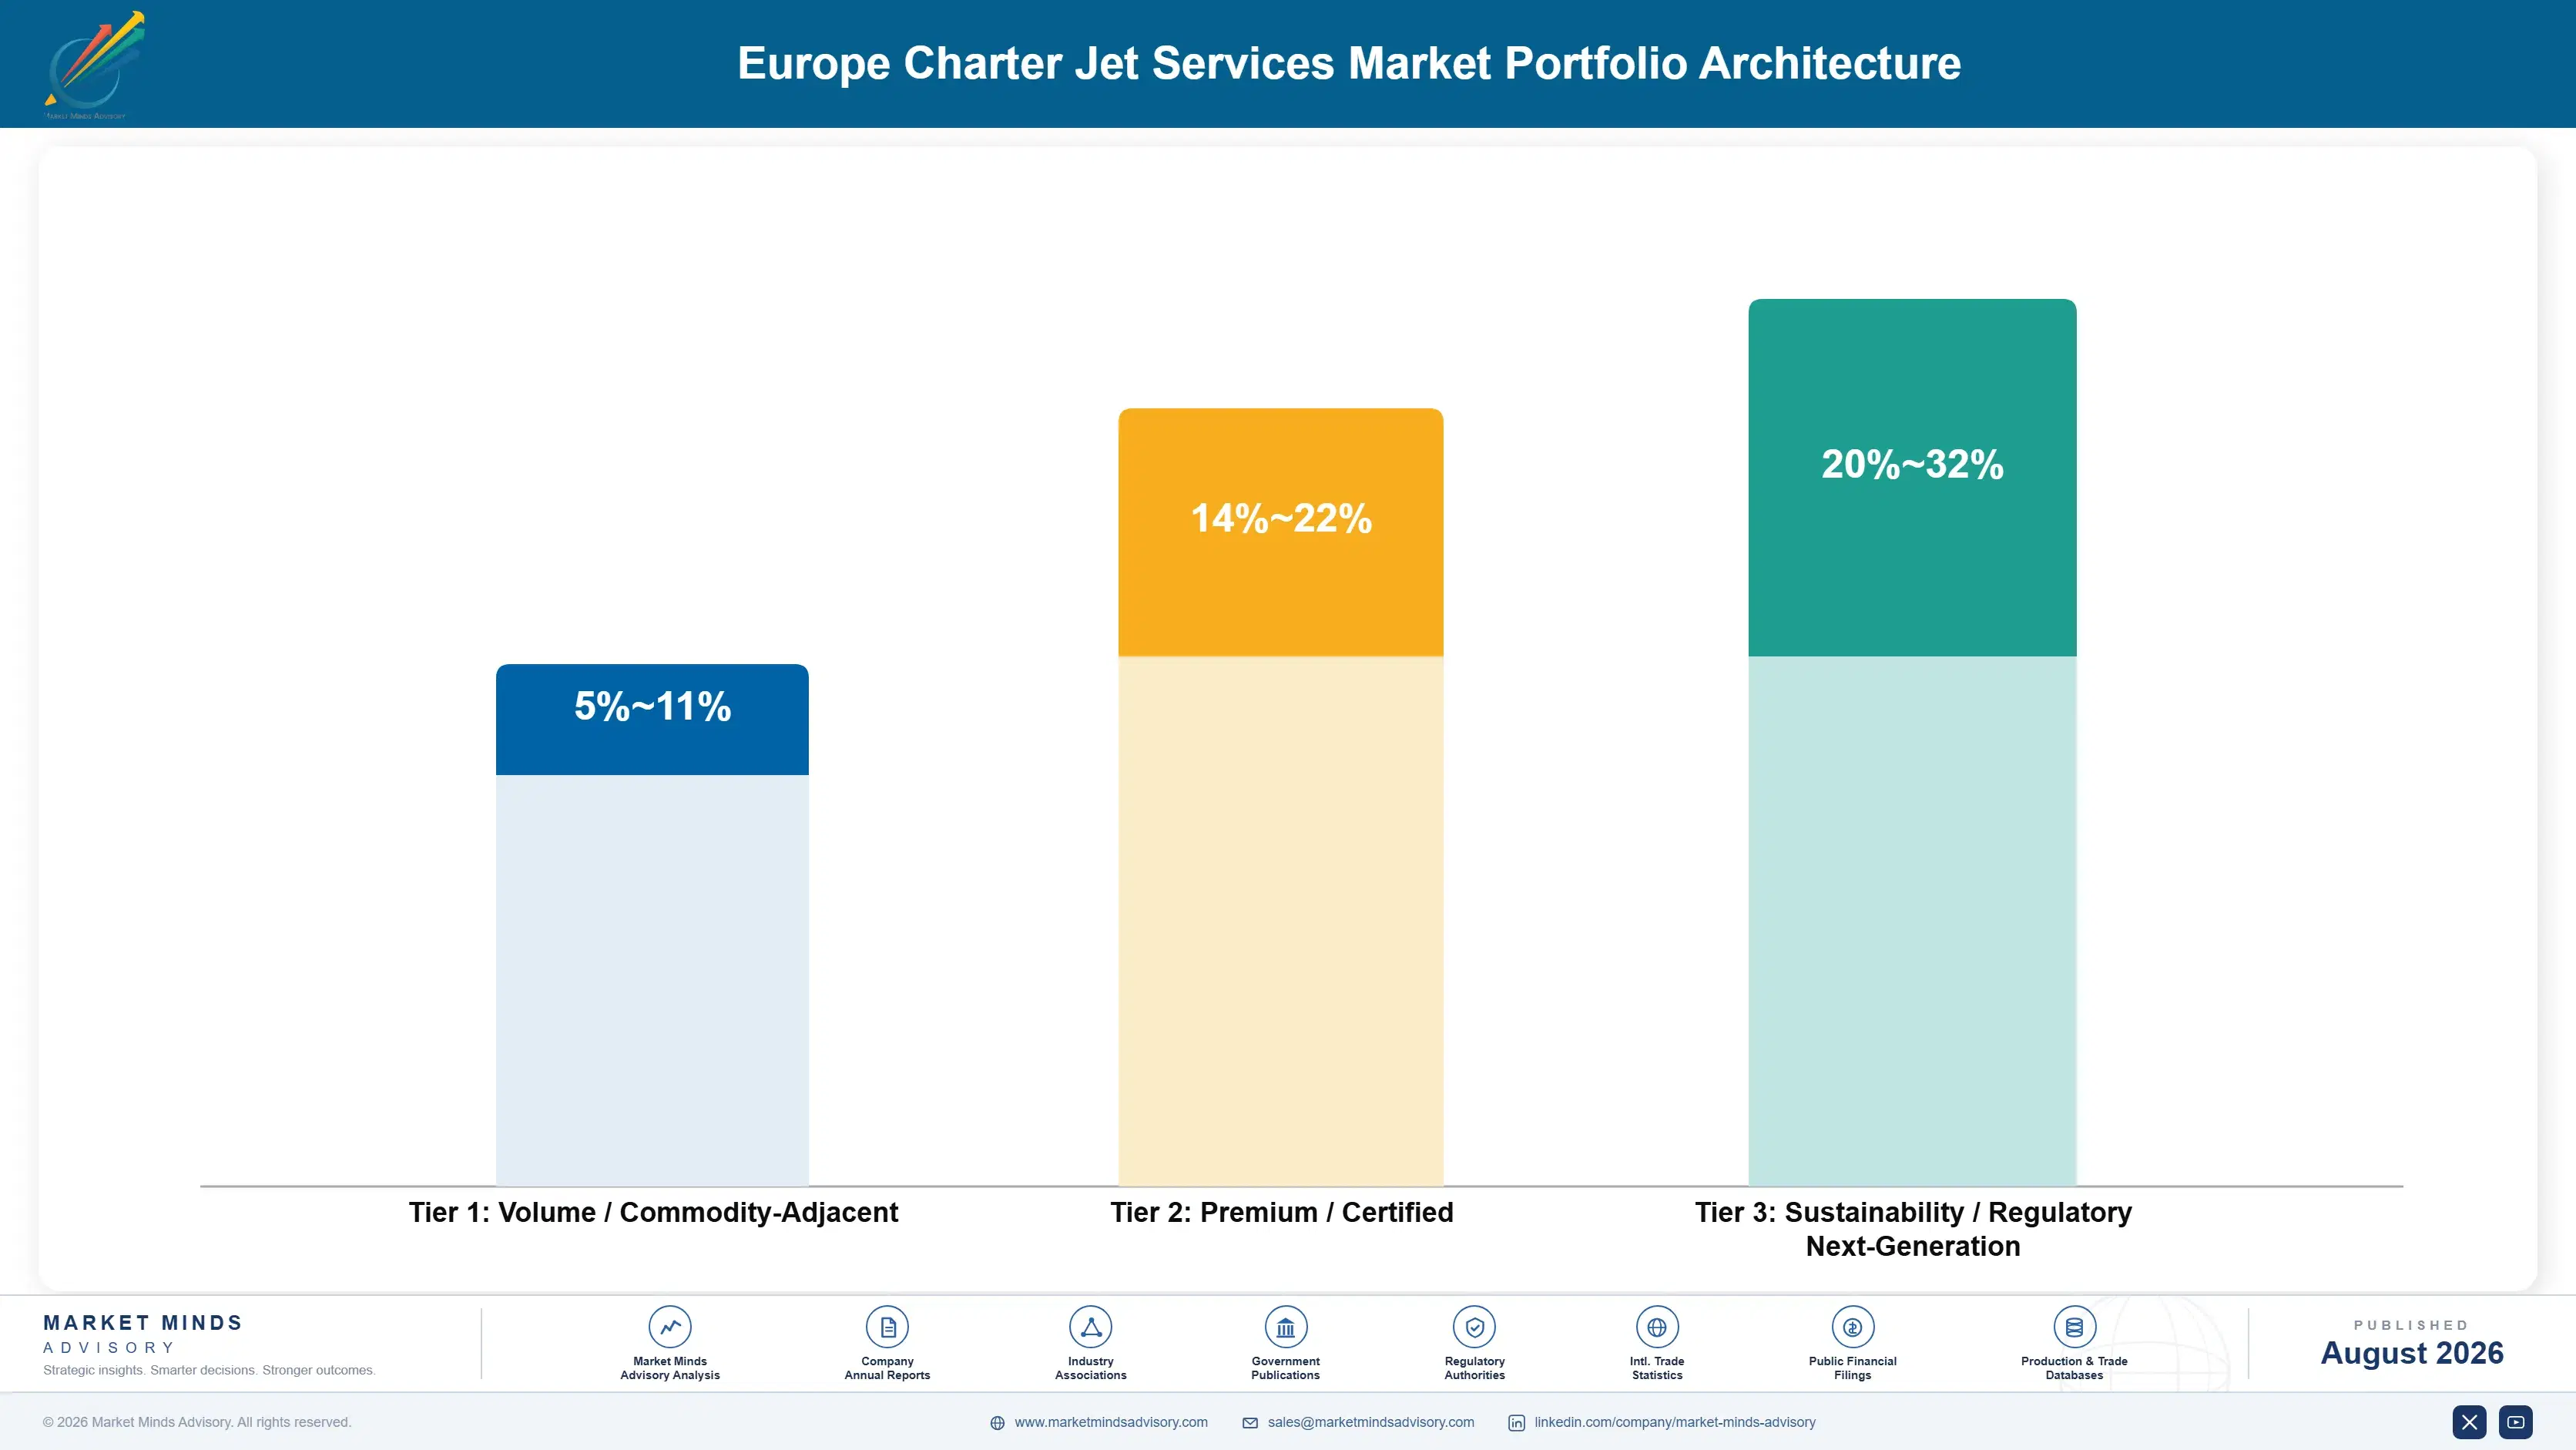
The portfolio separates by who owns the customer. Broker-intermediated ad hoc charter is the volume core: roughly 63% of revenue moves through it, operators compete on price for trips whose origin they never see, and margins reflect a capacity supply business rather than a service one. Large revenue, no relationship, and no defensible position of any kind. The operator is interchangeable and knows it.
Margin concentrates in programme membership and in management with charter release. Both give the operator something it owns: a prepaid customer in one case, and fleet capacity requiring no capital in the other. Programme revenue carries 29% of the market and grows at 10.8%, and the prepaid balances fund working capital that transactional operators must finance themselves at considerable cost. Both are worth building deliberately.

The overlooked pool is capacity cooperation. Around 41% of hours fly empty because every operator plans alone, and arrangements short of merger address that without touching certificates. Operators trying it report utilisation gains of six to ten percent. The obstacle is trust rather than regulation, which is why an obvious remedy has gone unimplemented for decades. The remedy has been obvious for decades.

Volume / Commodity-Adjacent

Broker-intermediated ad hoc charter and capacity supply into other participants' demand. Range spans six points because utilisation and positioning efficiency decide outcomes entirely, and pricing is set by whoever bids lowest.
Gross Margin: 5-11%

Premium / Certified

Direct operator charter sales, aircraft management with charter release and fractional programme flying. Range spans eight points because customer ownership and managed fleet scale vary enormously between operators in this tier.
Gross Margin: 14-22%

Sustainability / Regulatory / Next-Generation

Programme and jet card membership, shared charter distribution and empty leg monetisation products. Range spans twelve points because prepaid economics and distribution capability differ sharply between participants offering them. Distribution capability decides it.
Gross Margin: 20-32%
europe-charter-jet-services-market-portfolio-architecture-1788025473261

High-value Sub-segments and Strategic Watch-out

Programme and Jet Card Membership Services

High value and high growth at 10.8%, carrying prepaid cash and a customer relationship the operator actually owns. The ten point range separates operators with genuine availability guarantees from those selling membership against capacity they cannot reliably supply. Prepaid cash is the genuinely underrated part.
Gross Margin: 22-32%

Aircraft Management With Charter Release

High value with moderate growth at 8.6%, supplying fleet capacity that requires no operator capital whatsoever. The eight point range reflects how differently operators structure owner economics, particularly around charter revenue splits and guaranteed availability terms. Owners want charter release and are rarely offered it.
Gross Margin: 16-24%

Broker Intermediated Ad Hoc Charter

The volume core and roughly two thirds of all revenue, competed on price for trips whose customers the operator never meets. Thin margin, no relationship, and the part of this market that has commoditised most completely over two decades. Nothing about this position is defensible at all.
Gross Margin: 5-11%

Empty Leg Capacity

The strategic watch-out and the oldest unsolved problem here. Around 41% of hours fly without passengers, every monetisation platform has underdelivered, and the remedy needs cooperation this industry has never once managed. Fixing it requires cooperation between operators who have never cooperated on anything at all.
Gross Margin: Variable

Why Programme Customers Stay

Programme membership produces annuity economics that ad hoc charter never approaches. A customer who has prepaid flies against that balance rather than shopping each trip, and switching only arises at renewal. Programme revenue at 29% of the market arrives on that basis, funded upfront and insulated from the price competition governing everything else. The relationship belongs to the operator rather than to an intermediary.
Stickiness varies enormously by model. Programme and fractional customers are genuinely retained, since prepaid balances, service familiarity and availability history all sit behind the relationship. Management customers are stickier still, because moving an aircraft between operators means recertification, crew transition and a maintenance handover nobody undertakes casually. Broker-intermediated charter has no stickiness at all, since the customer belongs to the broker and the operator is interchangeable.

The customer base has shifted in composition rather than in size. Travellers who arrived during the disruption of scheduled service proved more price-sensitive than the traditional private aviation buyer and considerably more willing to compare. Corporate buyers on secondary city pairs evaluate charter against two connecting flights and most of a working day. Both ask questions that operators selling exclusivity rather than arithmetic find awkward to answer.
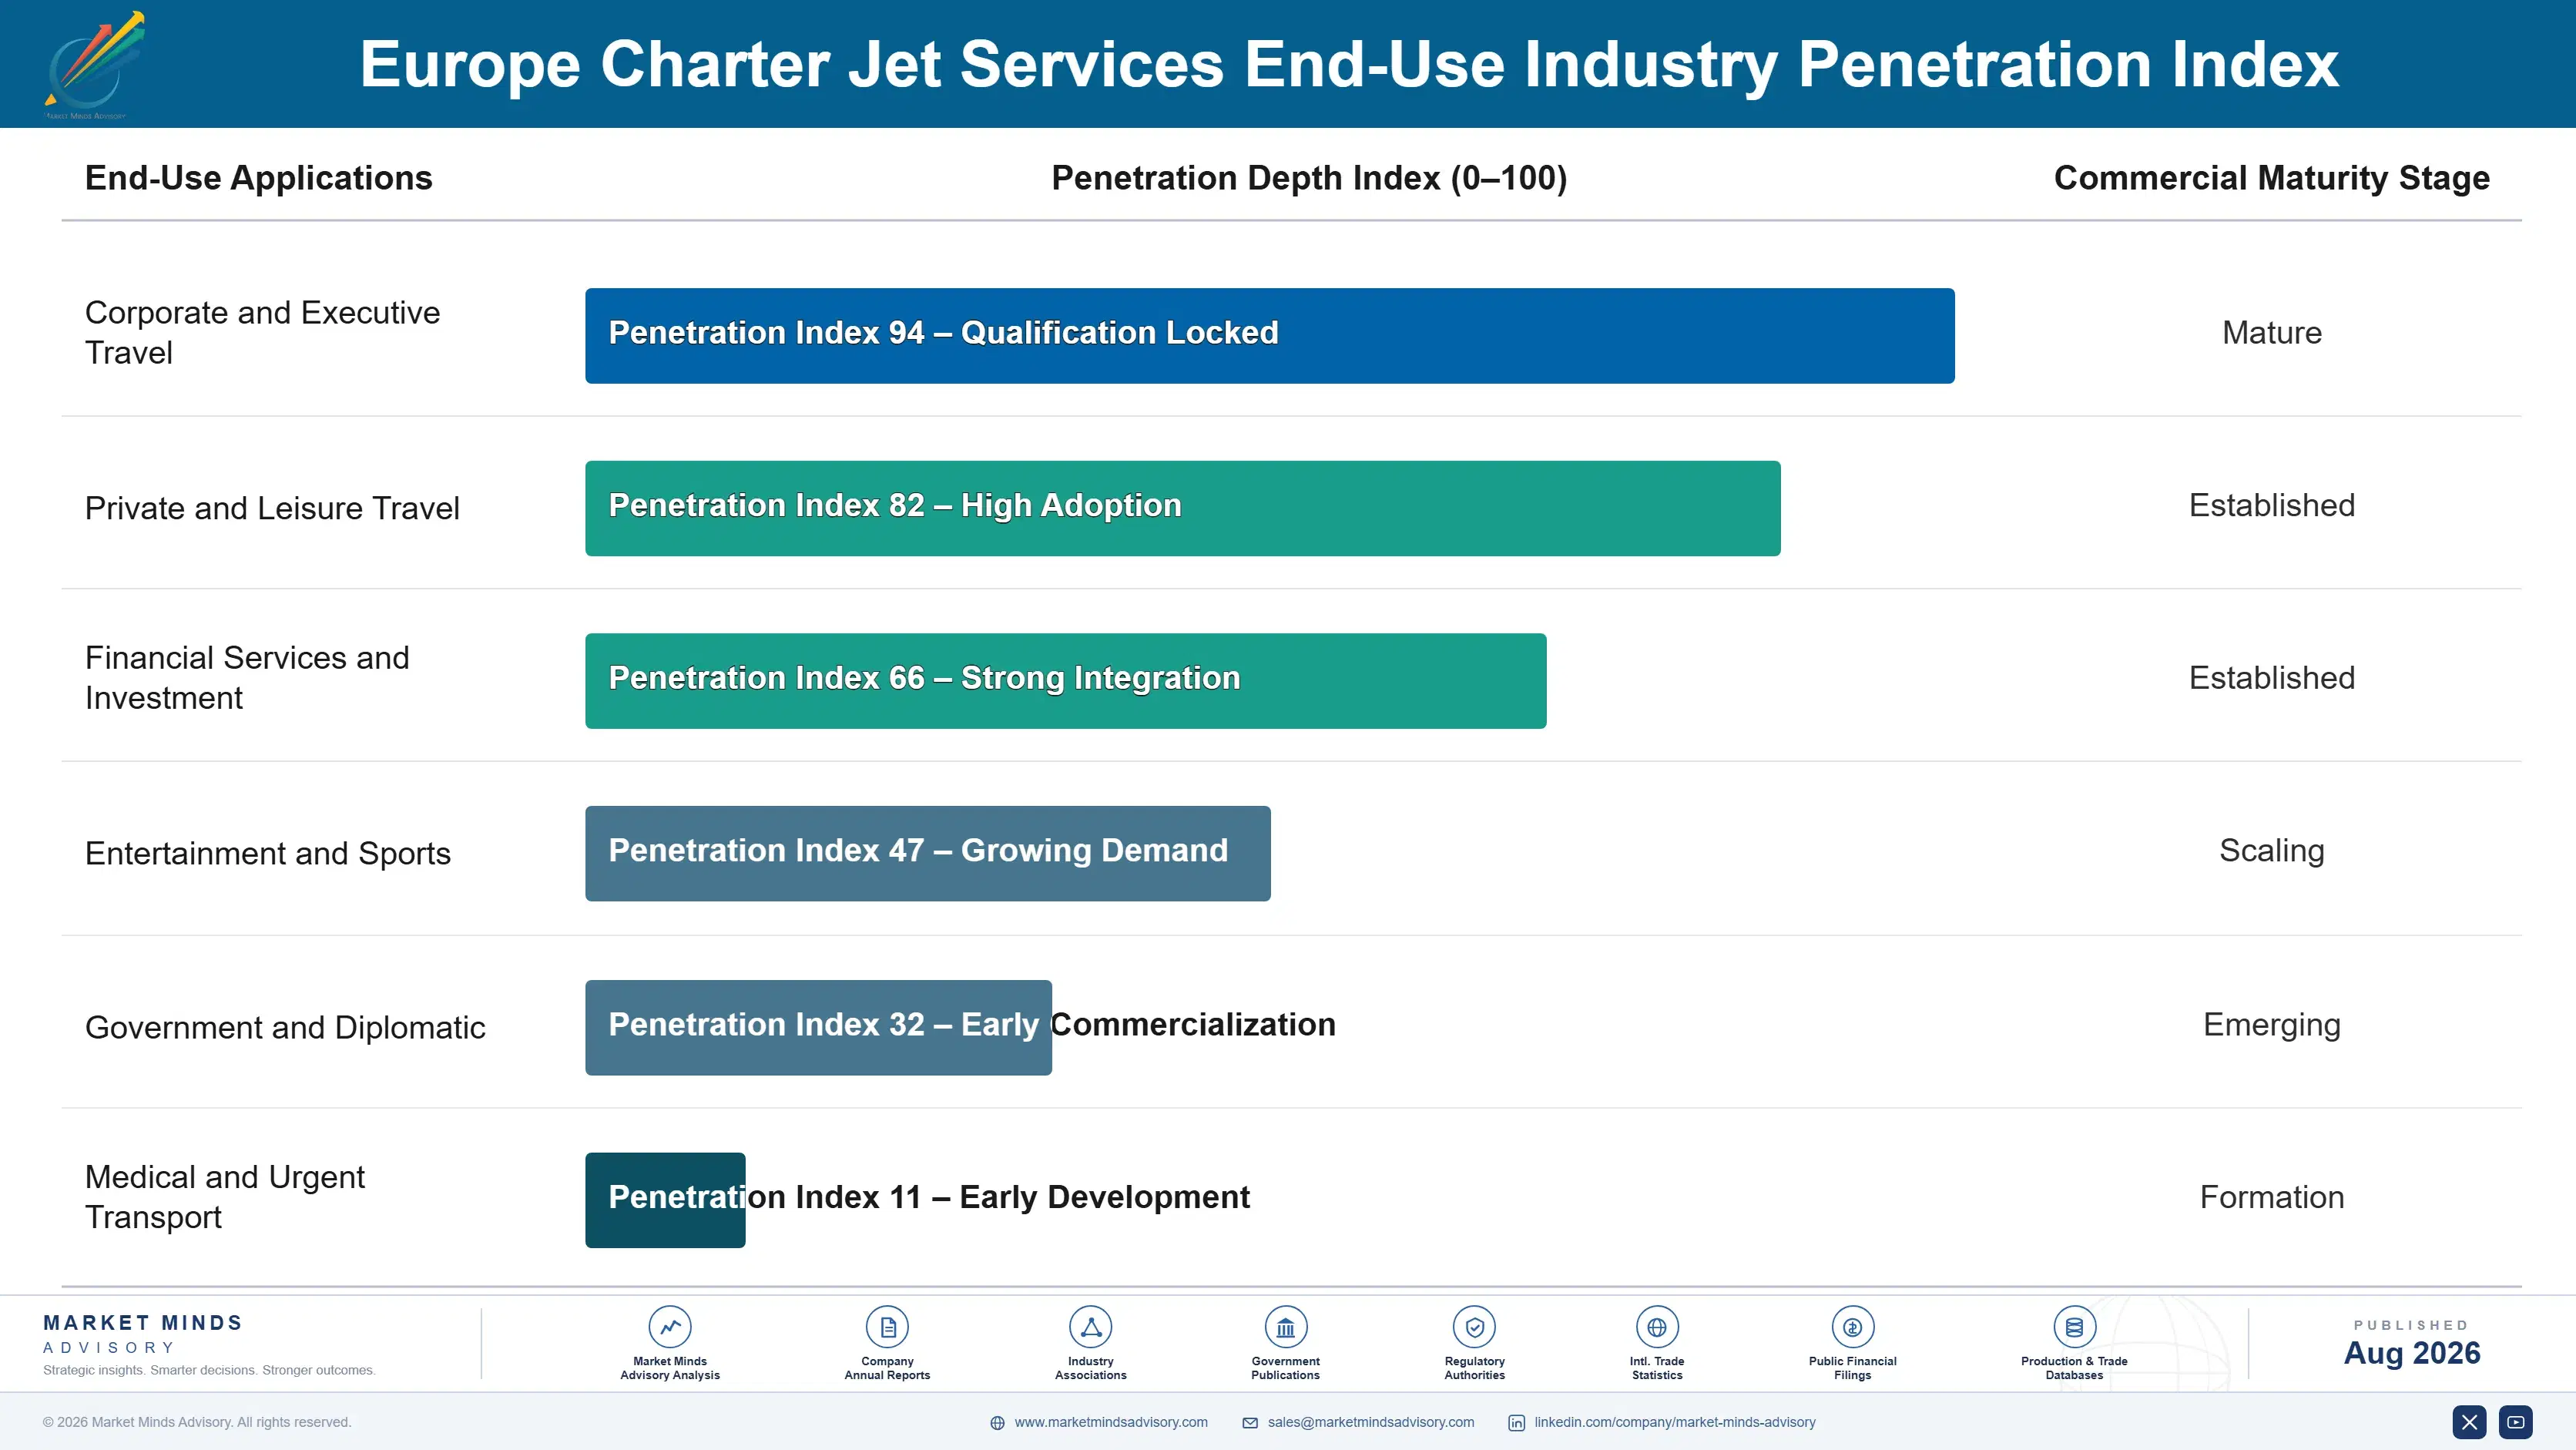
europe-charter-jet-services-market-end-use-penetration-index-1788025473752

Where Charter Operators Should Commit

These are among the four positions where our research anticipates prominent divergence between winners and laggards over the coming forecast period. Each is grounded in the demand model, the regulatory perimeter, and the announced capacity pipeline.
01 / PROGRAMME PRODUCT DEVELOPMENT

Own the customer or rent them forever from brokers

Programme and jet card products together carry 29% of market revenue, grow at 10.8% against a market rate of just 7.2%, and give an operator a customer relationship it genuinely owns rather than rents from an intermediary on each trip. Prepaid balances also fund working capital that transactional charter has never provided to anybody at all. Operators without such a product will simply keep supplying broker demand at prices set by whoever happens to bid lowest on any given day.
02 / DIRECT DISTRIBUTION RECOVERY

Sixty-three percent of revenue passes through somebody else

Roughly 63% of all European charter revenue is booked through brokers who own no aircraft at all and carry no operational risk whatsoever, and commission on that work sits between eight and fifteen percent of the trip value involved. Operators building direct booking, repeat relationships and their own demand generation capability recover both the commission and the customer relationship together. It requires commercial capability that most operating businesses in this market have simply never once employed for themselves at all.
03 / CAPACITY COOPERATION DISCIPLINE

Empty legs are a coordination failure, not a pricing one

Around 41% of flying hours carry nobody, and the reason is that every single operator plans its capacity alone while an aircraft positioning empty passes another doing exactly the same thing in the exact opposite direction. Capacity sharing arrangements short of merger address all of this without touching certificates, ownership or any oversight relationships at all. Operators who have actually tried it report utilisation gains of six to ten percent, which on margins this thin decides the whole trading year.
04 / MANAGED FLEET EXPANSION

Buying aircraft is the slowest way to grow here

An owner flying perhaps 120 hours annually holds an asset used at roughly one third of its capability, and charter release recovers real cost for them while supplying an operator with capacity requiring no capital commitment from them at all. Managed aircraft already supply a great deal of the European charter fleet for precisely this reason already. The proposition here is genuinely mutual rather than merely presented that way, and it scales considerably faster than any acquisition programme ever could.

Engagement Snapshot From the Field

A live engagement with an industry participant carrying material or product regulatory and market exposure ahead of a defining policy shift, showing how our research translates into a defensible multi-year portfolio strategy.
MARKET MINDS ADVISORY · CLIENT ENGAGEMENT SUMMARY
Europe Charter Jet Services Producer Strategic Portfolio Review and Transition Roadmap 2026·Investment Scenario on Europe Charter Jet Services Exposure Evaluation 2025-26
CLIENT PROFILE
A European charter operator running fourteen light and midsize aircraft under a single national certificate, selling almost entirely through brokers and holding no direct customer relationships of any consequence. Flying hours had grown steadily for three years while margin per hour declined across the same period, and management attributed the decline to competitive pressure rather than to its own distribution position.
STRATEGIC CHALLENGE
The board needed to establish whether building a programme product and direct sales capability justified the investment against continuing to supply broker demand at scale. It also faced a decision on whether to grow by purchasing three additional aircraft or by expanding managed fleet, which split opinion between the finance and operations sides of the business entirely.
MMA APPROACH
MMA rebuilt margin per flying hour by demand source across three years, separating broker-intermediated work from the small direct book properly for the first time. It modelled programme product economics against continued intermediation under several volume scenarios. Expert interviews with customers, brokers, owners and competing operators established what buyers value and what owners actually want.
KEY FINDINGS
  1. Broker-intermediated flying carried margin per hour roughly 60% below the small direct book, and it represented almost nine tenths of total flying hours.
  2. Positioning and empty sectors consumed 43% of flying hours, slightly above the market average, and no capacity coordination of any kind had ever been attempted.
  3. Owners approached about management wanted charter release and had been offered nothing, while the client was simultaneously planning to purchase aircraft outright.
  4. Customers interviewed would consider a programme product from this operator, and none had been aware it existed as a company at all before the interview.
CLIENT PROFILE
A European charter operator running fourteen light and midsize aircraft under a single national certificate, selling almost entirely through brokers and holding no direct customer relationships of any consequence. Flying hours had grown steadily for three years while margin per hour declined across the same period, and management attributed the decline to competitive pressure rather than to its own distribution position.
STRATEGIC CHALLENGE
The board needed to establish whether building a programme product and direct sales capability justified the investment against continuing to supply broker demand at scale. It also faced a decision on whether to grow by purchasing three additional aircraft or by expanding managed fleet, which split opinion between the finance and operations sides of the business entirely.
MMA APPROACH
MMA rebuilt margin per flying hour by demand source across three years, separating broker-intermediated work from the small direct book properly for the first time. It modelled programme product economics against continued intermediation under several volume scenarios. Expert interviews with customers, brokers, owners and competing operators established what buyers value and what owners actually want.
KEY FINDINGS
  1. Broker-intermediated flying carried margin per hour roughly 60% below the small direct book, and it represented almost nine tenths of total flying hours.
  2. Positioning and empty sectors consumed 43% of flying hours, slightly above the market average, and no capacity coordination of any kind had ever been attempted.
  3. Owners approached about management wanted charter release and had been offered nothing, while the client was simultaneously planning to purchase aircraft outright.
  4. Customers interviewed would consider a programme product from this operator, and none had been aware it existed as a company at all before the interview.
RECOMMENDED STRATEGY
Phase 1: Phase one: launch a programme product with genuine availability guarantees, priced from actual positioning cost rather than from published market rates. Phase 2: Phase two: build direct sales and repeat customer capability, and cap broker-intermediated flying rather than accepting whatever volume happens to arrive. Phase 3: Phase three: grow through managed fleet with charter release instead of purchasing the three aircraft currently planned for outright acquisition.
OUTCOME
The client reported margin per flying hour improving 5.6 points within five quarters (client-reported, unverified by MMA). Programme membership reached a meaningful share of total flying. Two aircraft joined under management rather than being purchased, and broker-intermediated flying fell sharply as a proportion of the total.

Frequently Asked Questions

Foundational context covering the market sizes, CAGR, scope, country, region and competition that inform every finding below. This section is provided to cover basics and most often pre-purchase conversations, answered from the MMA Primary Research Dataset.

What is the current size of the Europe Charter Jet Services Market?

The market is valued at USD 6.8 billion in 2025, measured as revenue from on-demand and contracted private jet charter flown within, from and to Europe.

How large will the Europe Charter Jet Services Market be by 2036?

MMA forecasts USD 14.61 billion by 2036, up from USD 7.29 billion in 2026. That represents incremental revenue of USD 7.32 billion and an expansion multiple of 2.00 times.

What is the CAGR for the Europe Charter Jet Services Market 2026 to 2036?

The base case CAGR is 7.2%, with a bull case of 8.4% and a bear case of 6.0%. Programme and membership conversion supplies the largest part of that growth.

Which segment is growing fastest?

Programme and jet card membership services grow at 10.8%, half again the market rate of 7.2%, because prepaid membership suits customers and operators considerably better than trip-by-trip quotation.

Who are the major companies in the Europe Charter Jet Services Market?

VistaJet, NetJets Europe, Luxaviation, GlobeAir and Air Charter Service lead on European charter revenue, holding only around 26% between them in a very fragmented market.

Which country is growing fastest?

India grows fastest at 9.2%, driven by corporate travel into Europe expanding faster than any other inbound source and generating onward charter demand at the European end.

Report Segmentation Architecture

The full report scope spans multiple orthogonal segmentation dimensions, with cross-tabulated demand data provided for each dimension pair. Coverage extends further to regional breakdowns, trend trajectories, and the competitive detail needed to support segment-level decision-making.

By Commercial Model

  • Ad Hoc Charter Brokerage
  • Direct Operator Charter Sales
  • Programme and Jet Card Membership Services
  • Fractional Ownership Programme Flying
  • Aircraft Management With Charter Release
  • Empty Leg and Shared Charter Distribution

By End-Use Industry

  • Corporate and Executive Travel
  • Private and Leisure Travel
  • Financial Services and Investment
  • Entertainment and Sports
  • Government and Diplomatic
  • Medical and Urgent Transport

By Commercial Dimension

  • Transactional Trip Booking
  • Prepaid Membership Contracting
  • Owner Management Agreements
  • Broker Intermediated Supply
  • Operator Capacity Sharing
  • Digital Booking Platforms

By Region

  • Western Europe
  • Eastern Europe
  • North America
  • Middle East and Africa
  • East Asia
  • South Asia and Pacific
  • Latin America

Scope, Methodology, and Coverage

Every figure in this report is reproducible from documented input assumptions. The scope below maps the historical period, the forecast horizon, the segmentation dimensions, and the countries covered, alongside the underlying primary and qualitative methodology.
Historical Period
2020 to 2025
Forecast Period
2026 to 2036
Base Year
2025 (USD billions; MMA Primary Research Dataset, August 2026)
Market Definition
Revenue from on-demand and contracted private jet charter flown within, from and to Europe, spanning ad hoc charter brokerage, direct operator charter sales, programme and jet card membership services, fractional ownership programme flying, aircraft management with charter release, and empty leg and shared charter distribution. Transactional booking, prepaid membership contracting, owner management agreements, broker intermediated supply, operator capacity sharing and digital booking platforms are all included. Aircraft sales and acquisition, scheduled commercial aviation, cargo charter, helicopter operations, and maintenance revenue not associated with a charter flight are excluded.
Quantitative Units
USD billions, charter flight revenue flown within and around Europe
Segmentation Dimensions
Commercial model, customer category, contracting dimension, region of origin
Regions Covered
Western Europe, Eastern Europe, North America, Middle East and Africa, East Asia, South Asia and Pacific, Latin America
Countries Covered
United Kingdom, France, Germany, Switzerland, Italy, Spain, Austria, Malta, Poland, United States, United Arab Emirates, India, China, Brazil
Key Companies Profiled
VistaJet, NetJets Europe, Luxaviation, GlobeAir, Air Charter Service, Flexjet Europe, Jet Aviation, Gama Aviation, Comlux, Air Hamburg
Quantitative Methodology
Primary survey, n=3,800 respondents, Q4 2025, six countries; demand-side model with trade association cross-validation
Qualitative Methodology
47 expert interviews, Q4 2025; applied to validate demand model assumptions, identify emerging dynamics, and assess competitive positioning
Report Format
PDF and XLSX data workbook (Word format preview document)
Publisher
Market Minds Advisory
Report Code
MMA-2026-CON-411
Published
August 2026
Contact
sales@marketmindsadvisory.com | www.marketmindsadvisory.com

Purchase the full Europe Charter Jet Services Market Report (2026 to 2036).

The full report addresses the two facts that decide this business and that operators discuss least willingly. It quantifies empty leg hours against the platforms that have failed to sell them, traces how much revenue passes through parties owning no aircraft, and separates programme economics from transactional charter properly across the participant base. Segment analysis covers all six commercial models, with particular attention to programme membership where prepaid economics and customer ownership together explain the growth rate. Competitive assessment ranks twenty participants on European charter flight revenue.
Six commercial model segmentation with growth rates
Empty leg hours quantified against monetisation attempts
Twenty participant assessment on European charter revenue
Broker intermediation share traced across demand sources
Programme economics compared against transactional charter margins
Managed fleet growth assessed against aircraft acquisition

Built For The People Who Decide

From boardroom strategy to bench-side execution, this report is read cover-to-cover by leaders shaping the next decade of their industry, turning demand scenarios, market dynamics and valuation benchmarks into decisions.
CXOs/ Presidents/ VPs/ Managers
M&A and Corporate Development
Strategy Teams and R&D Heads
Procurement and Product Directors
Regulatory and Compliance Leaders
Investor Relations and Equity Analysts