Market Minds Advisory
Ethylene Glycol Market

Ethylene Glycol Market: Polyester Demand and Feedstock Route Competition Through 2036

Polyester fiber and PET bottle demand keep pulling ethylene glycol volume higher, even as coal-based and bio-based production routes reshape who can compete on cost across a market still dominated by petrochemical crackers.

Lead Analyst

Bilal Shaikh

Published

September 2026

Make Smarter Decisions with Customized Research Insights

Request a free sample report and evaluate market opportunities, growth trends, and competitive dynamics relevant to your business needs.

2025 MARKET VALUE$34.0BMarket Size 2025
2036 FORECAST VALUE$55.2BBase Case , 2026 to 2036
CAGR 2026 TO 20364.5 %Bull 5.7% / Bear 3.3%
INCREMENTAL OPPORTUNITY$19.6BNet 10- year value creation
EXPANSION MULTIPLE1.55x2036 value over 2026 base
Strategic Levers
M&A Pipeline
Regional Outlook
Country Rankings
Competitive Intelligence
Segmental Deep-dive
Call-Us : 91 93563 13602

Executive Snapshot and Market Trajectory

Ethylene glycol is a workhorse chemical hiding behind two very different end products: the polyester shirt on a hanger and the plastic bottle in a recycling bin, and both keep pulling volume in the same direction even as production economics shift beneath the surface across major producing regions worldwide today.
SABIC and Shell Chemicals continue supplying established petrochemical route ethylene glycol from steam-cracked ethylene, since that pathway remains the lowest-cost option wherever cheap natural gas feedstock is available across major producing regions worldwide today and for the foreseeable future. Coal-based production is capturing disproportionate share in China specifically, where domestic coal reserves offer a cost advantage that petrochemical routes dependent on imported naphtha cannot match.
India Glycols and a handful of specialty producers are investing in bio-based ethylene glycol derived from sugarcane and corn feedstock, betting that brand owner sustainability commitments will pay a premium for renewable content across packaging and textile categories worldwide over time. Producers without flexible feedstock access or the capital to build alternative production routes increasingly find themselves exposed to volatile petrochemical input costs and pricing swings that erode margin unpredictably.
Market Definition
The ethylene glycol market covers petrochemical route ethylene glycol, coal-based ethylene glycol, bio-based ethylene glycol, monoethylene glycol, diethylene glycol, and triethylene glycol grades sold for polyester fiber, PET resin, antifreeze, and industrial solvent applications. It excludes finished polyester fiber, finished PET bottles, and finished antifreeze formulations sold as separate downstream product categories.
Base Year Value
$34.0B in 2025 (MMA Primary Research Dataset, August 2026)
Forecast Period
2026 to 2036, eleven discrete annual values
CAGR
4.5% base case. Bull 5.7%. Bear 3.3%.
Fastest Growth Segment
Bio-Based Ethylene Glycol: 9.5% CAGR
Fastest Growth Country
China: 6.0% CAGR
Fastest Growth Region
South Asia and Pacific: 6.5% CAGR
Largest Region
East Asia: 34% of 2025 global value
Market Leaders
SABIC, Shell Chemicals, MEGlobal, India Glycols, Reliance Industries. Source: MMA Analysis based on company annual reports.
Primary Survey
n=3,800 procurement and R&D decision-makers, Q4 2025, six countries
Methodology
Demand-side build-up, cross-validated against public data, 47 expert interviews

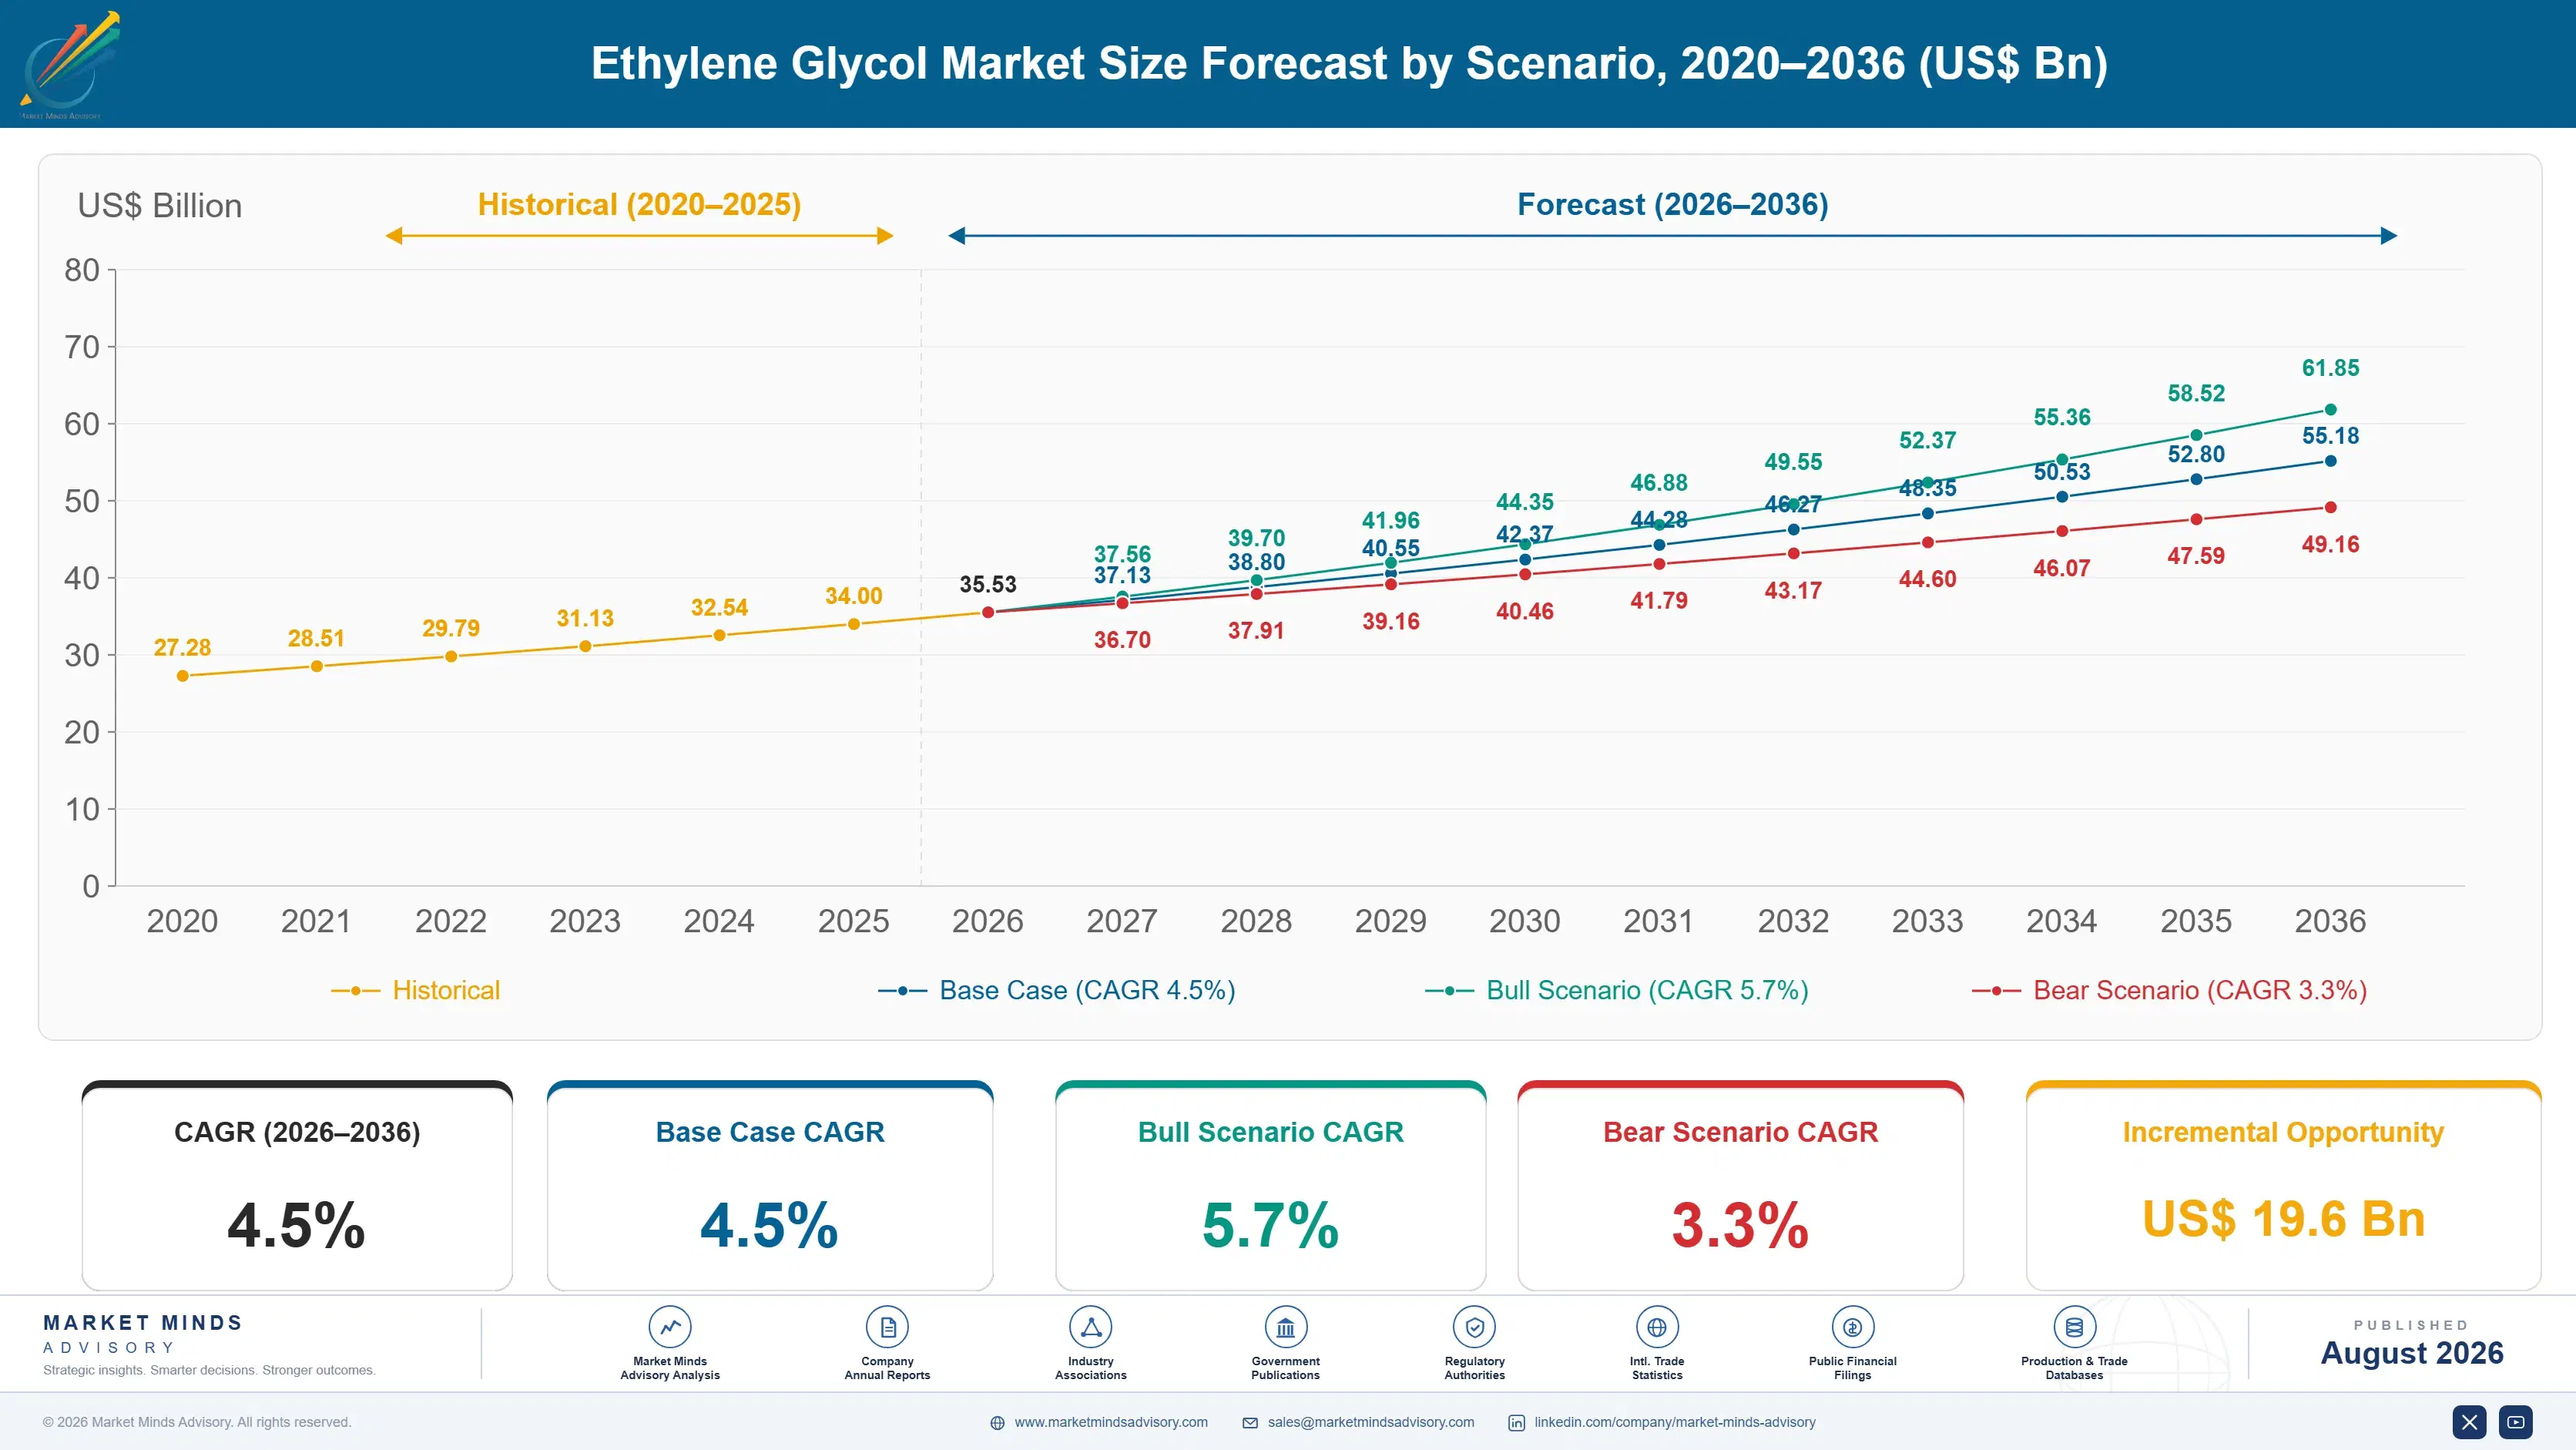
Ethylene Glycol Market Forecast Scenarios

ethylene-glycol-market-trends-size-forecast-scenario-1787548466227
Between 2020 and 2025 the market grew at roughly 3.7 percent a year, as polyester fiber demand recovered from pandemic-era disruption and PET bottle consumption continued climbing across both developed and emerging beverage packaging markets worldwide, supported by steady population and income growth across most consuming regions during that entire stretch of years and well beyond into the current period.
The base case assumes 4.5 percent annual growth to 2036, built on three mechanisms: rising polyester fiber demand tracking global textile consumption growth, PET resin demand expanding alongside packaged beverage volume in emerging markets, and bio-based ethylene glycol capturing incremental share as brand owners commit to renewable content targets across their packaging and textile supply chains over the coming decade of sustained investment and continued regulatory pressure worldwide across many jurisdictions.
A bull case near 5.7 percent depends on bio-based production scaling faster than currently planned as feedstock costs decline with technology maturity across multiple producing regions worldwide over time and with continued investment. The bear case near 3.3 percent assumes textile recycling and PET circularity initiatives reduce virgin ethylene glycol demand growth more than currently projected across major consuming markets.

One Chemical, Two Very Different Growth Stories

Ethylene glycol sits at a genuine fork in production chemistry: the petrochemical route cracks ethylene from natural gas or naphtha, while the coal-based route gasifies coal into syngas and builds ethylene glycol through a completely different chemical pathway entirely from start to finish. Both routes produce a chemically identical product, meaning buyers select suppliers on price and reliability rather than any performance distinction between production methods used.
MARKET CONCENTRATIONCR5 42%Moderate concentration exists with many regional coal-based producers
AVERAGE SELLING PRICE$680 per tonnePrice tracks crude oil and naphtha benchmarks closely
TOP PRODUCING COUNTRY SHAREChina 38%Largest base tied to domestic coal-based production capacity
CAPACITY UTILIZATION72%Reflects persistent overcapacity built across Chinese coal-based plants
TRADE INTENSITY36% cross-borderMeaningful volume moves from the Middle East to Asia
FEEDSTOCK COST SHARE72%Ethylene or coal feedstock dominates total production cost
Demand splits roughly between polyester fiber production and PET resin production, two end markets that move somewhat independently of each other depending on textile versus packaged beverage consumption trends across major consuming regions. Bio-based ethylene glycol remains a small but fast-growing niche, capturing brand owners willing to pay a premium for renewable content claims on finished polyester and PET products entering retail shelves.
Production remains heavily concentrated in China given its massive coal-based capacity buildout over the past fifteen years, alongside substantial Middle Eastern petrochemical capacity exporting into Asian demand centers steadily and reliably each year without much interruption at all. The United States retains meaningful capacity tied to its abundant shale gas feedstock advantage relative to naphtha-based competitors elsewhere.
"Ethylene glycol is about as unglamorous as chemicals get, yet it sits behind nearly every polyester shirt and plastic bottle on the planet. That is exactly why feedstock economics here matter more than most people realize."
Practice Lead, Petrochemicals and Polymer Feedstocks · MMA Chemicals and Materials Practice · August 2026

Market Trends

Coal-Based Route Reshapes Chinese Cost Leadership

China's coal-based ethylene glycol capacity has expanded dramatically over the past fifteen years, giving domestic producers a durable cost position that petrochemical route competitors dependent on imported naphtha struggle to match during periods of elevated crude oil pricing. This shift has pushed meaningful production capacity offline among higher-cost petrochemical route producers in Asia unable to compete on price against domestic coal-based supply. The coal route carries a notably larger carbon footprint than petrochemical alternatives, drawing increasing scrutiny from brand owners managing supply chain emissions commitments, even as it continues expanding production share within China specifically.
Market Impact: Adds 4 percent annual PET demand
Bio-Based Production Gains Brand Owner Commitment

Major beverage and apparel brands have begun committing to renewable content targets for their PET packaging and polyester textile supply chains, creating dedicated demand for bio-based ethylene glycol derived from sugarcane and corn feedstock rather than fossil sources. India Glycols and a small group of specialty producers have built dedicated bio-based production capacity to serve these commitments, commanding meaningful price premiums over conventional grades in exchange for verified renewable content certification. Scaling beyond current niche volume remains constrained by feedstock availability and production cost that has not yet reached parity with petrochemical alternatives.
Market Impact: Polyester demand grows 3 percent yearly

Market Opportunities and Growth Drivers

PET Bottle Demand Sustains Baseline Consumption Growth

Packaged beverage consumption continues climbing across emerging markets as rising incomes shift consumer preference toward bottled water, soft drinks, and juice products over unpackaged alternatives common in earlier decades. Each additional PET bottle produced requires ethylene glycol as a core polymer input, making beverage packaging growth a direct and fairly predictable driver of ethylene glycol demand across most consuming regions. Southeast Asia and India in particular are seeing packaged beverage penetration rates climb from a still-low base, expanding the addressable market well beyond what mature market growth rates alone would suggest for the category going forward.
Market Impact: Suppresses prices by 15 percent

Polyester Textile Consumption Keeps Climbing Globally

Global textile consumption continues rising as population growth and rising per-capita clothing purchases across emerging markets outpace any offsetting decline in developed market apparel spending patterns. Polyester fiber remains the dominant textile fiber by volume globally, holding a durable cost advantage over cotton that has widened during periods of volatile cotton harvest yields tied to weather disruption and climate variability. This sustained fiber demand growth translates directly into ethylene glycol consumption, since polyester production requires it as an essential input regardless of which specific textile application ultimately uses the finished fiber.
Market Impact: Recycling could cut demand 8 percent

Market Restraints and Challenges

Chinese Overcapacity Suppresses Global Price Levels

Persistent overcapacity across Chinese coal-based ethylene glycol plants has suppressed global price levels for several years running, squeezing margins for petrochemical route producers elsewhere who cannot match domestic Chinese coal-based cost structures. The root cause is aggressive capacity buildout during a period of anticipated demand growth that did not fully materialize at the pace planners expected, leaving the market meaningfully oversupplied relative to actual consumption. This has forced several higher-cost petrochemical route plants outside China into extended shutdowns or permanent closure. Producers are mitigating exposure by shifting output toward higher-value specialty glycol grades less exposed to commodity pricing pressure.
Market Impact: Holds 42 percent Chinese share

PET Circularity Initiatives Threaten Virgin Demand

Growing PET bottle recycling and circularity initiatives among major beverage brands aim to reduce virgin PET resin consumption over time, which would directly reduce virgin ethylene glycol demand tied to that resin production. The root cause is genuine brand owner sustainability commitment combined with regulatory pressure in several markets mandating recycled content minimums in packaging. This restraint operates on a multi-year timeline given the capital investment required to scale recycling infrastructure at a pace matching stated brand commitments. Producers are mitigating exposure by expanding into bio-based ethylene glycol production that serves the same sustainability-driven demand shift.
Market Impact: Bio-based grades command 35 percent premium
3 additional market trends, 2 additional growth drivers, and 4 additional restraints and challenges are covered in the full report. Contact sales@marketmindsadvisory.com to access the complete intelligence.

Segment CAGR and Growth Architecture

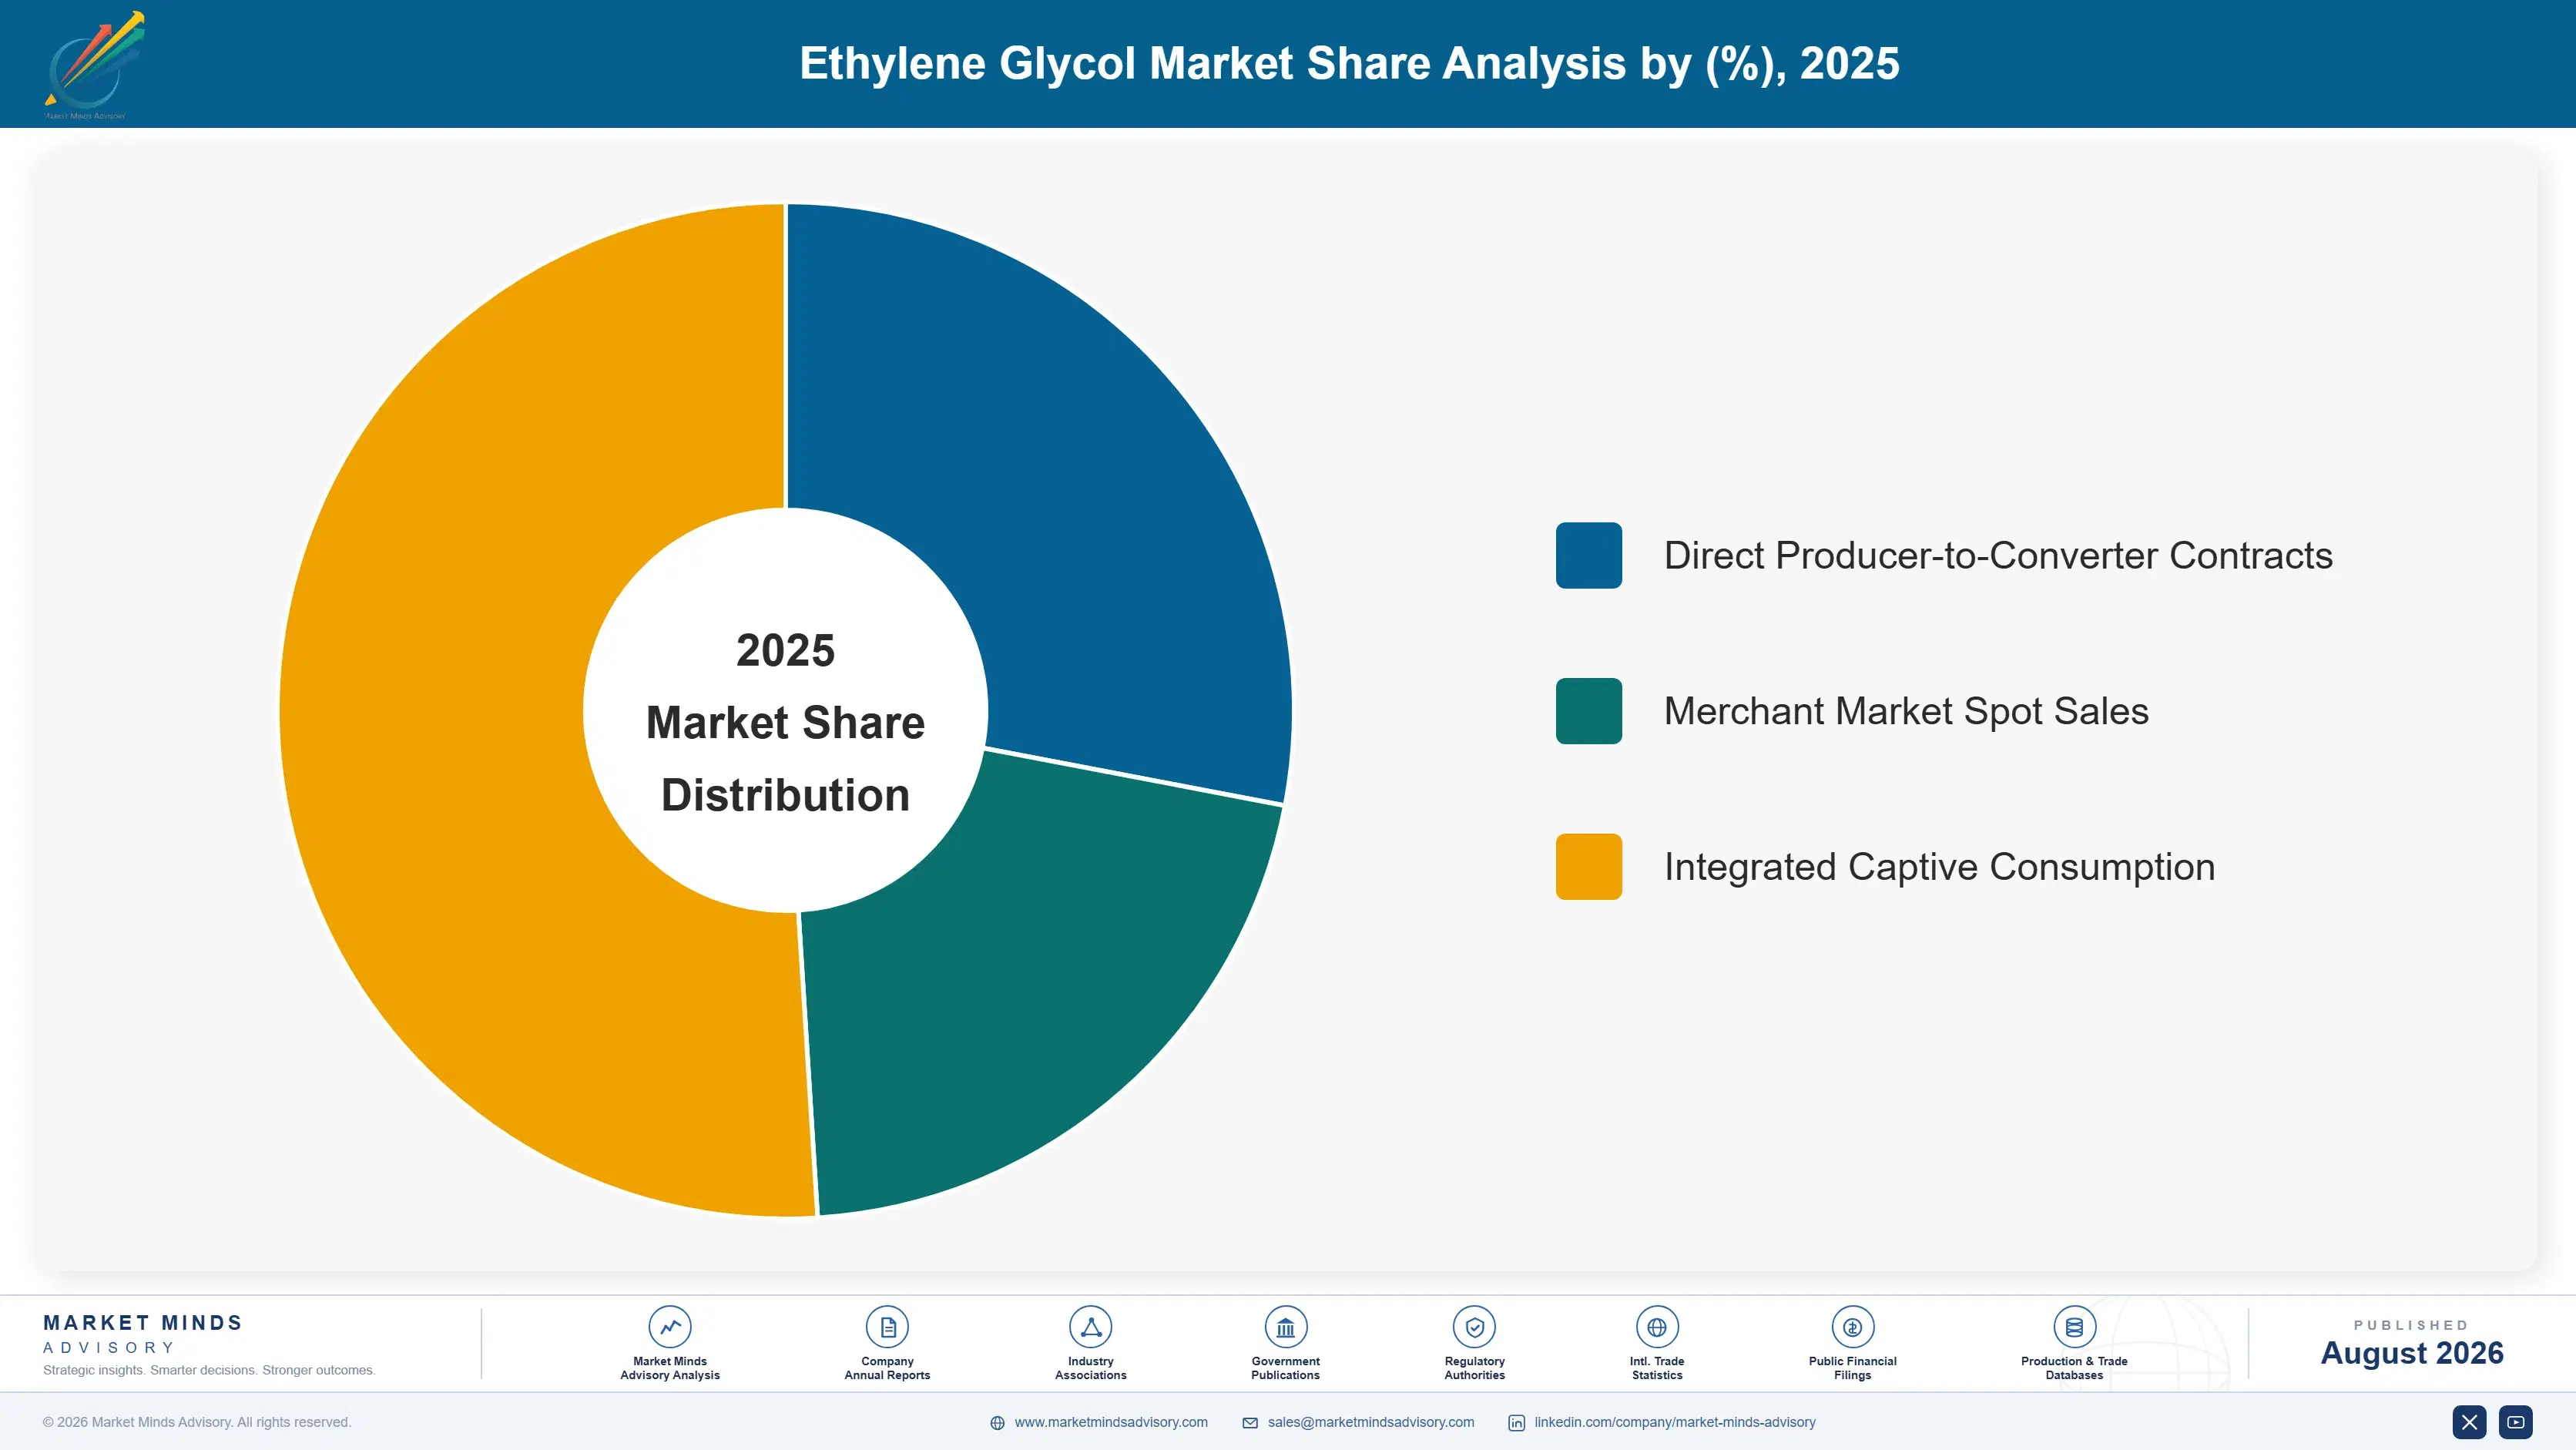
The market splits by production route and product grade into six segments, since feedstock chemistry drives most of the cost and sustainability variation buyers actually evaluate. Petrochemical route monoethylene glycol holds the largest installed base globally, while bio-based ethylene glycol and coal-based routes grow fastest as feedstock economics and sustainability commitments reshape purchasing decisions.
ethylene-glycol-market-trends-market-share-analysis-1787548466760

Bio-Based Ethylene Glycol

Bio-based ethylene glycol remains the smallest segment by volume but is growing fastest by a wide margin, as beverage and apparel brands commit to renewable content targets that only bio-based feedstock can satisfy under current certification standards and audit requirements. India Glycols has built the deepest production capability here, sourcing sugarcane feedstock domestically to supply both regional and export customers seeking verified renewable content credentials. Production cost still runs meaningfully above conventional petrochemical routes, limiting the segment to customers willing to pay a sustainability premium rather than competing on pure price. Scaling further will require feedstock cost declines that most producers expect only gradually over the coming decade of continued investment and process refinement.
CAGR 9.5%

Coal-Based Ethylene Glycol

Coal-based ethylene glycol has grown from a negligible share two decades ago into a quarter of global supply, driven almost entirely by Chinese domestic capacity buildout taking advantage of abundant local coal reserves relative to imported petrochemical feedstock costs across most producing provinces nationwide today. The segment carries a meaningfully larger carbon footprint than petrochemical alternatives, drawing increasing scrutiny from brand owners managing supply chain emissions targets even as it remains the lowest-cost production route within China specifically for now. Growth is expected to moderate as overcapacity concerns limit further capacity additions, though existing plants will continue supplying domestic and regional export demand for years to come regardless of pricing pressure.
CAGR 6.0%
Full segment breakdown across 7 segments available in the complete report.

Regional Architecture and Country Demand Map

Regional demand concentrates wherever polyester textile manufacturing and PET packaging consumption intersect at scale. East Asia holds the largest share by a wide margin given China's dominant position in both categories, while South Asia and Pacific posts the fastest regional growth as India's textile and packaging industries expand rapidly.

North America

Shale gas feedstock advantage keeps United States petrochemical route production cost competitive with Middle Eastern exporters despite the region's relatively modest overall demand growth compared with faster-expanding emerging markets elsewhere in the world. Shell Chemicals and other major producers maintain significant Gulf Coast capacity built around abundant ethane feedstock, exporting meaningful volume into Latin American and Asian markets when domestic demand growth runs below available capacity. Domestic PET bottle and polyester fiber demand grows modestly given already mature packaged beverage penetration relative to emerging markets elsewhere. Canada contributes smaller volume tied primarily to its own petrochemical feedstock base and regional distribution needs across its more limited domestic market and smaller population base.
Share: 22% | CAGR: 4.5% (2026 to 2036)

East Asia

China dominates regional and global demand alike, consuming ethylene glycol at massive scale for both its enormous polyester textile export industry and its rapidly growing domestic PET bottle consumption base across most major cities. Chinese coal-based production capacity has grown to supply a large share of this domestic demand directly, reducing historical reliance on imported petrochemical route material from the Middle East. Japanese and South Korean demand remains comparatively modest and stable, reflecting mature domestic textile and packaging industries growing only incrementally each year. The region's share sits above the standard regional band deliberately, reflecting China's outsized concentration of both global polyester manufacturing and PET bottle demand worldwide, not an estimation error.
Share: 34% | CAGR: 5.5% (2026 to 2036)
Regional intelligence for 5 additional markets available in the complete report: Western Europe, South Asia and Pacific, Latin America, Middle East and Africa, Eastern Europe. Contact sales@marketmindsadvisory.com.
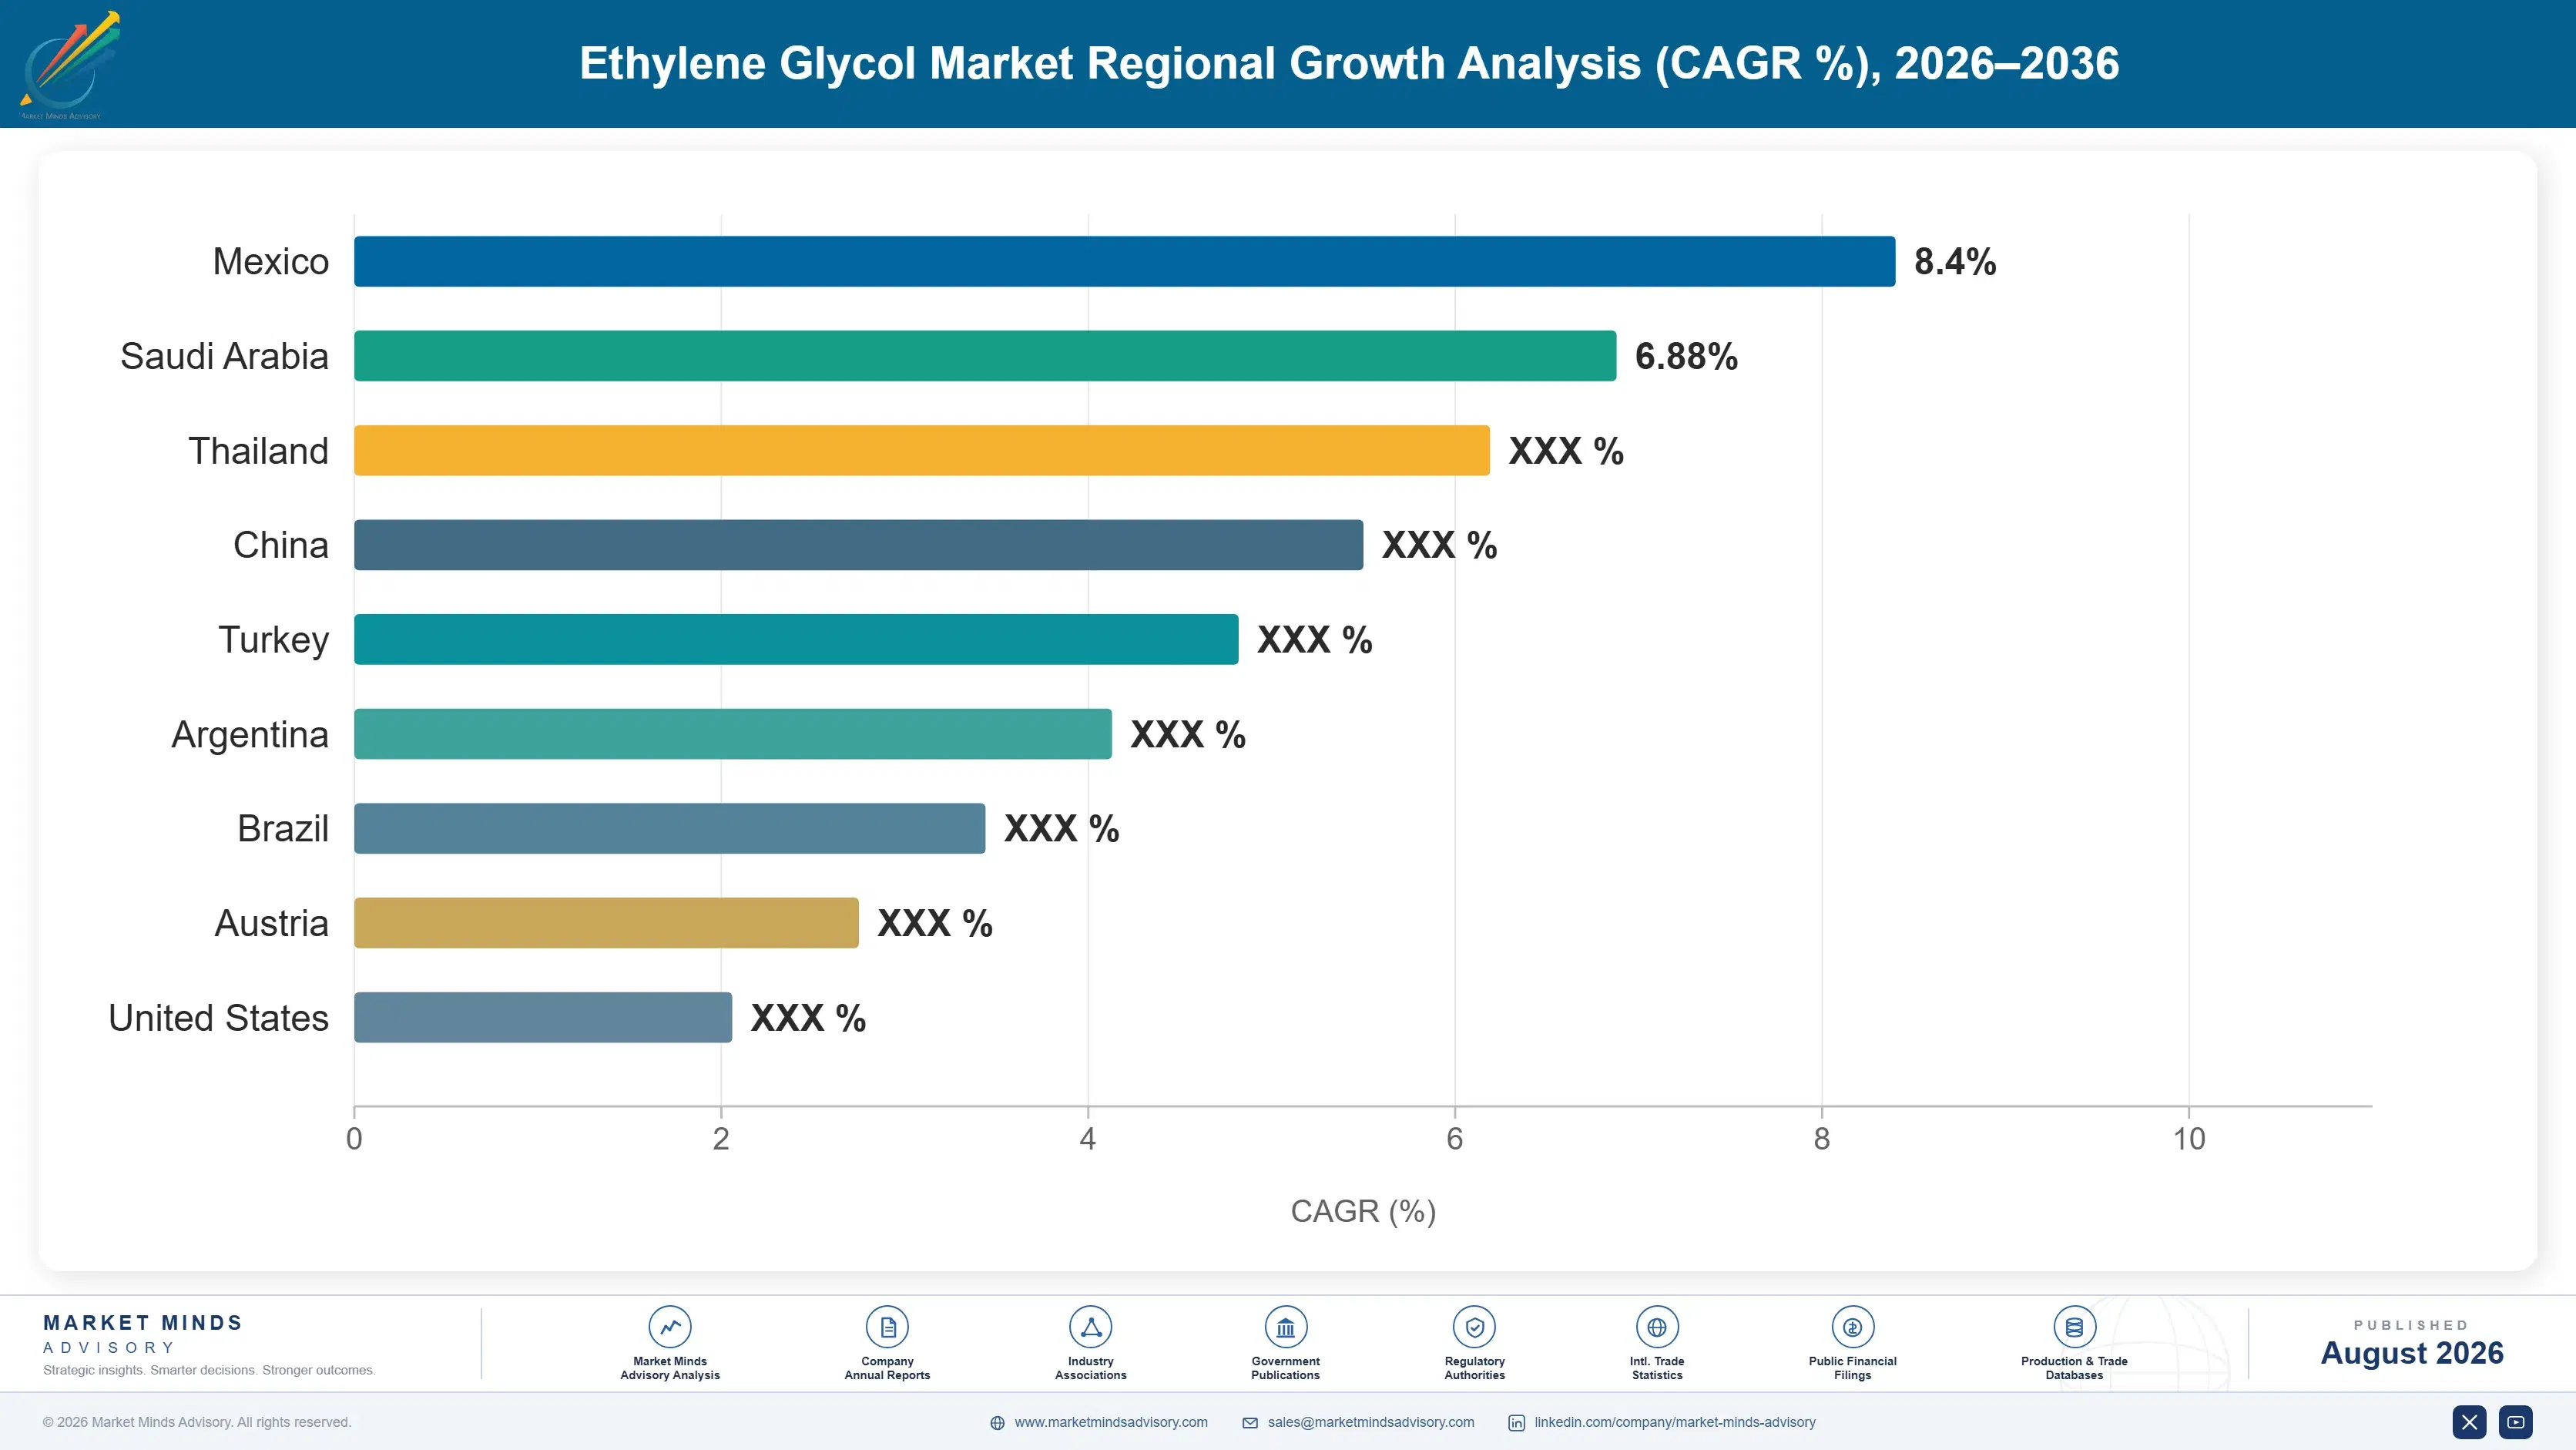
ethylene-glycol-market-trends-country-cagr-analysis-1787548467322

Where Producers Actually Make Money Here

Commodity monoethylene glycol competes almost entirely on delivered price once a plant is running, leaving thin margins tied directly to feedstock cost spreads. The stronger revenue opportunities sit in bio-based production, specialty glycol grades, and integrated feedstock positions, categories where certification, purity requirements, and cost structure still support meaningfully better economics than commodity monoethylene glycol.

Building Out Certified Bio-Based Production Capacity

Producers who build certified bio-based ethylene glycol capacity capture pricing roughly 35 percent above conventional petrochemical grades from brand owners committed to renewable content targets across their packaging and textile lines. This requires securing reliable sugarcane or corn feedstock supply and investing in the certification infrastructure that lets customers verify renewable content claims for their own sustainability reporting requirements. India Glycols built this capability years before demand fully materialized, positioning it to capture premium contracts as more brand owners finalize their renewable content commitments over the coming several years of continued investment.
Market Impact: Captures a full 35 percent premium overall today

Expanding Into Higher-Purity Specialty Glycol Grades

Specialty glycol grades used in antifreeze, industrial solvents, and polyester resins requiring exceptionally tight purity specifications command roughly 20 percent higher prices than commodity monoethylene glycol sold into standard polyester applications across most consuming industries and regions. Winning these contracts requires meaningfully tighter process control and quality testing infrastructure than commodity production demands, raising the capital bar for entry considerably higher. Producers who invest in this capability early capture longer-term customer relationships than those competing purely on commodity pricing and delivery reliability alone across a crowded field of merchant suppliers.
Market Impact: Commands a full 20 percent premium overall today

Securing Integrated Upstream Feedstock Positions Early

Producers with integrated upstream feedstock positions, whether ethane cracking capacity or coal gasification infrastructure, capture margin that standalone ethylene glycol plants dependent on merchant feedstock purchases cannot access during periods of feedstock price volatility and supply disruption across most producing regions. This integration requires substantial upfront capital investment but insulates producers from the roughly 25 percent margin compression that hits merchant buyers hardest during feedstock price spikes across most producing regions worldwide. SABIC and Shell Chemicals both benefit from this integration, capturing value across the full production chain rather than just the final conversion step alone.
Market Impact: Improves overall margin stability by 25 percent yearly

Who Controls the Margin Pool

Concentration sits moderate at a CR5 near 42 percent, calculated on production capacity across all routes and grades. SABIC holds the clearest leadership position given its scale across both petrochemical route production and integrated feedstock access through its broader chemicals portfolio. The gap to challengers like Shell Chemicals is narrower in specialty glycol grades than in commodity monoethylene glycol, where Chinese coal-based producers increasingly compete on pure price.
Current competitive activity centers on bio-based capacity expansion and specialty grade development, as producers race to capture premium pricing beyond commodity monoethylene glycol economics across most consuming regions. India Glycols and a handful of specialty producers have both expanded bio-based production, while MEGlobal continues developing integrated feedstock positions to differentiate from producers confined to merchant feedstock purchasing.

Emerging pressure comes from Chinese coal-based producers scaling technical capability and product quality within their large domestic market, a trajectory that could eventually support competition beyond commodity grades into specialty and export markets currently dominated by established multinational suppliers. Rankings could shift meaningfully over the next decade if these producers close the remaining quality and certification gap that currently protects incumbent suppliers.
ethylene-glycol-market-trends-company-positioning-matrix-1787548467843

Competitive Moat and Risk Dimensions

SABIC

Moat: Integrated Feedstock and Scale

SABIC's integrated position across ethylene production and downstream glycol conversion lets it capture margin at multiple stages of the value chain that standalone merchant producers dependent on purchased feedstock cannot access, particularly during periods of feedstock price volatility across global markets and shifting demand cycles worldwide.
SABIC

Risk: Exposure to Oil Price Swings

SABIC's petrochemical route production remains exposed to crude oil and naphtha price swings that Chinese coal-based competitors largely avoid, creating periods where cost competitiveness shifts meaningfully against SABIC depending on relative feedstock pricing trends across different producing regions and demand cycles worldwide over the years.
SHELL CHEMICALS

Moat: Deep Ethane Feedstock Access

Shell Chemicals maintains deep integration with abundant shale gas ethane feedstock along the United States Gulf Coast, positioning it favorably on production cost relative to naphtha-dependent competitors elsewhere whenever crude oil prices run meaningfully above natural gas prices for extended periods of sustained market volatility.
SHELL CHEMICALS

Risk: Limited Bio-Based Presence

Shell Chemicals' relative focus on petrochemical route production potentially limits its exposure to the faster-growing bio-based segment that specialty producers increasingly capture as brand owner sustainability commitments expand across major consumer categories and packaging types worldwide over the entire coming decade of continued category growth.

Players Tracked

Prominent Players

SABIC
Shell Chemicals
MEGlobal
India Glycols
Reliance Industries

Other Key Players

Sinopec
PetroChina
LOTTE Chemical
Formosa Plastics
Indorama Ventures
MOL Group
Nan Ya Plastics
Sasol
TotalEnergies
ExxonMobil Chemical
Huai'an Jinlin Chemical
Zhejiang Satellite Petrochemical
Yankuang Energy
OCI Company
Ineos

Recent Developments

MAY 2025

SABIC announced an expansion of its integrated ethylene glycol production capacity at its Middle East facility, adding capacity specifically to serve growing Asian polyester and PET resin demand ahead of continued regional packaging and textile consumption growth over the coming several years and well beyond.
Signal: Signals supplier confidence that Asian demand will sustain long-term production capacity utilization broadly across most regions
NOVEMBER 2025

India Glycols entered a multi-year supply agreement with a major global beverage brand to provide bio-based ethylene glycol across several regional bottling facilities, reinforcing its position in a category increasingly valued for verified renewable content certification and traceable feedstock sourcing practices across entire supply chains.
Signal: Confirms major beverage brands increasingly commit to multi-year bio-based supply contracts over spot market purchasing today
FEBRUARY 2026

Shell Chemicals launched an expanded specialty glycol grade production line aimed at accelerating customer qualification timelines for high-purity antifreeze and industrial solvent applications entering broader commercial development across several regional export markets this year and well into the entire following calendar year still further ahead.
Signal: Signals a competitive shift toward specialty grade capability rather than commodity production scale alone here today

Feedstock Choice Decides Who Actually Wins

Ethylene or coal feedstock together account for roughly 72 percent of total ethylene glycol production cost, the highest feedstock cost share of any market MMA covers in this sector. Ethylene traces back to steam crackers in the Gulf Coast, the Middle East, and East Asia, while coal feedstock sources almost entirely from domestic Chinese coal reserves feeding gasification plants.
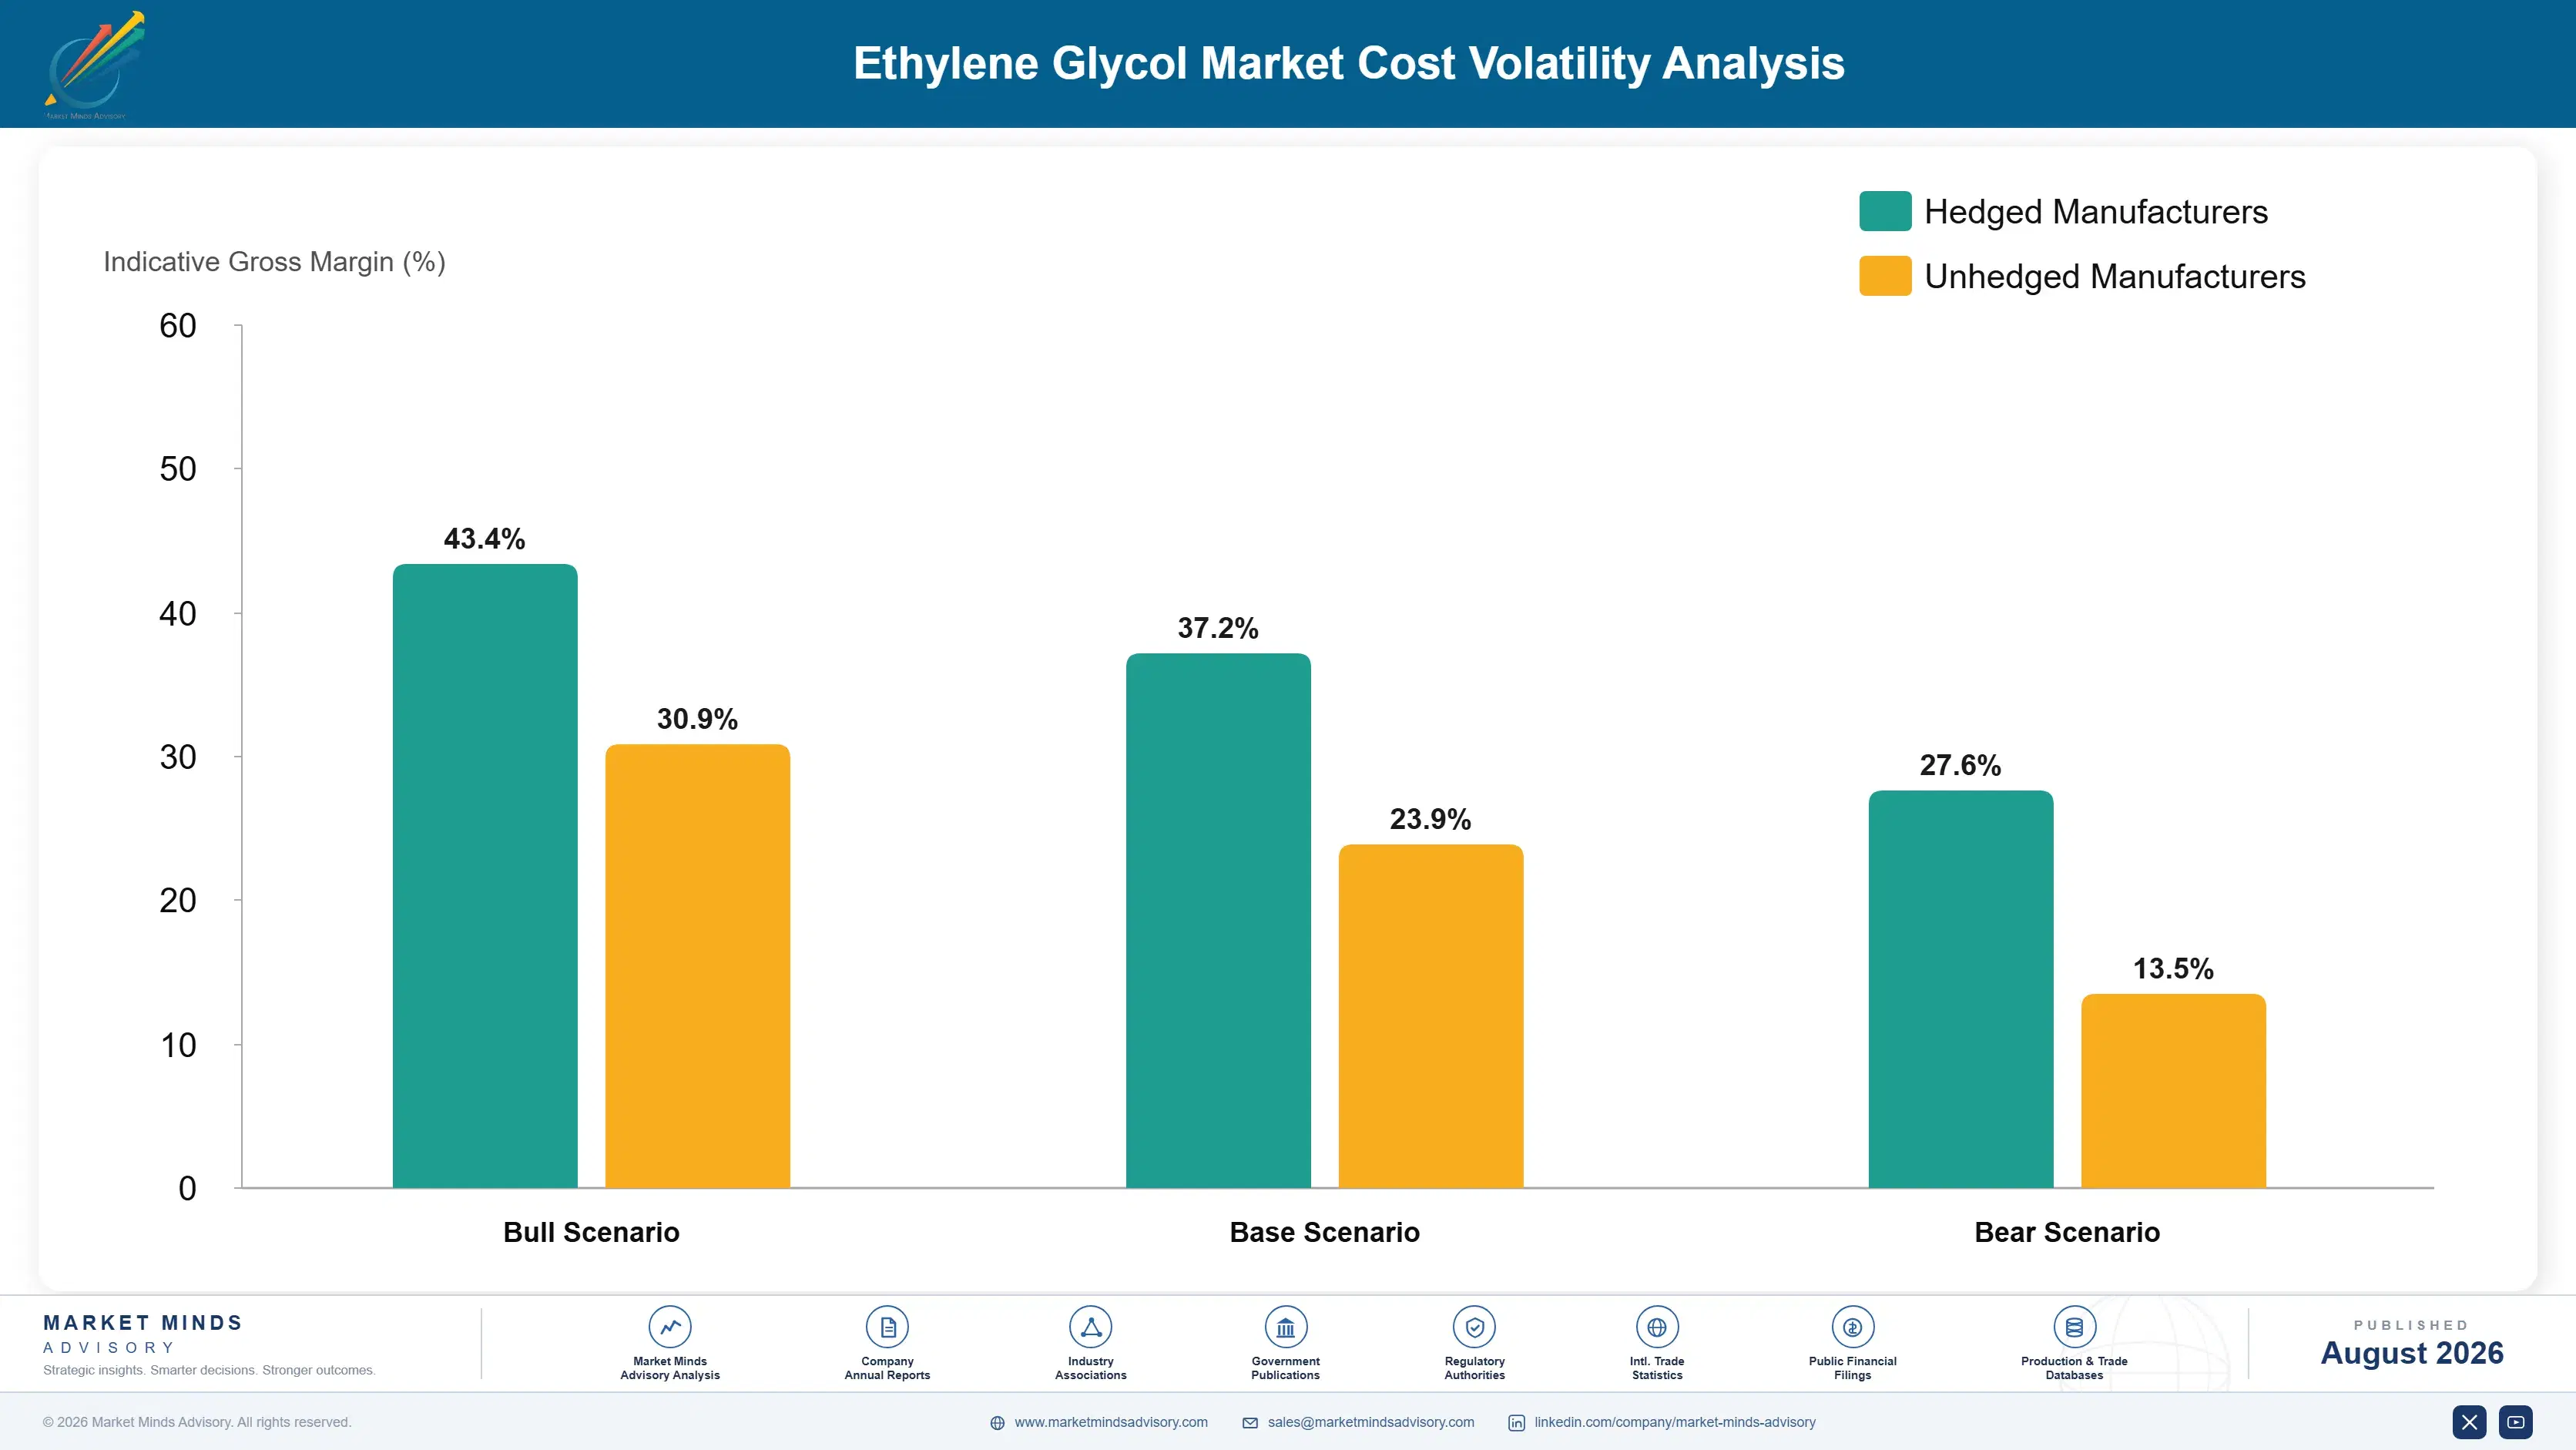
Crude oil and naphtha prices spiked sharply during 2022 as geopolitical supply disruption coincided with broader energy market volatility, according to EIA data, pushing petrochemical route producer input costs up meaningfully within a single quarter. Producers locked into annual polyester and PET resin supply contracts could not pass that increase through immediately, compressing margins for several quarters until contract renewal cycles allowed repricing closer to current feedstock cost levels.

Petrochemical route producers without integrated ethylene production face proportionally larger margin swings than integrated producers who can shift internal ethylene allocation toward glycol production depending on relative product economics and demand signals. This creates a durable cost advantage for integrated players, since captive feedstock access functions as a hedge unavailable to merchant producers buying ethylene on the open market.
ethylene-glycol-market-trends-cost-volatility-analysis-1787548468038

Index-Linked Feedstock Pricing in Contracts

Larger producers are negotiating index-linked pricing clauses tied to published crude oil and naphtha benchmarks directly into annual polyester and PET resin supply contracts, letting cost pass-through occur quarterly rather than waiting for full contract renewal. This reduces the multi-quarter margin compression smaller producers without comparable negotiating leverage continue to experience during feedstock price spikes.

Building Integrated Upstream Ethylene Capacity

Producers are actively investing in integrated upstream ethylene cracking capacity specifically to reduce dependence on merchant feedstock purchases during periods of price volatility or regional supply disruption across major markets. This integration strategy requires substantial upfront capital investment but pays off during exactly the volatility periods when merchant-dependent competitors face the largest margin pressure.

Portfolio Architecture for Margin Defence

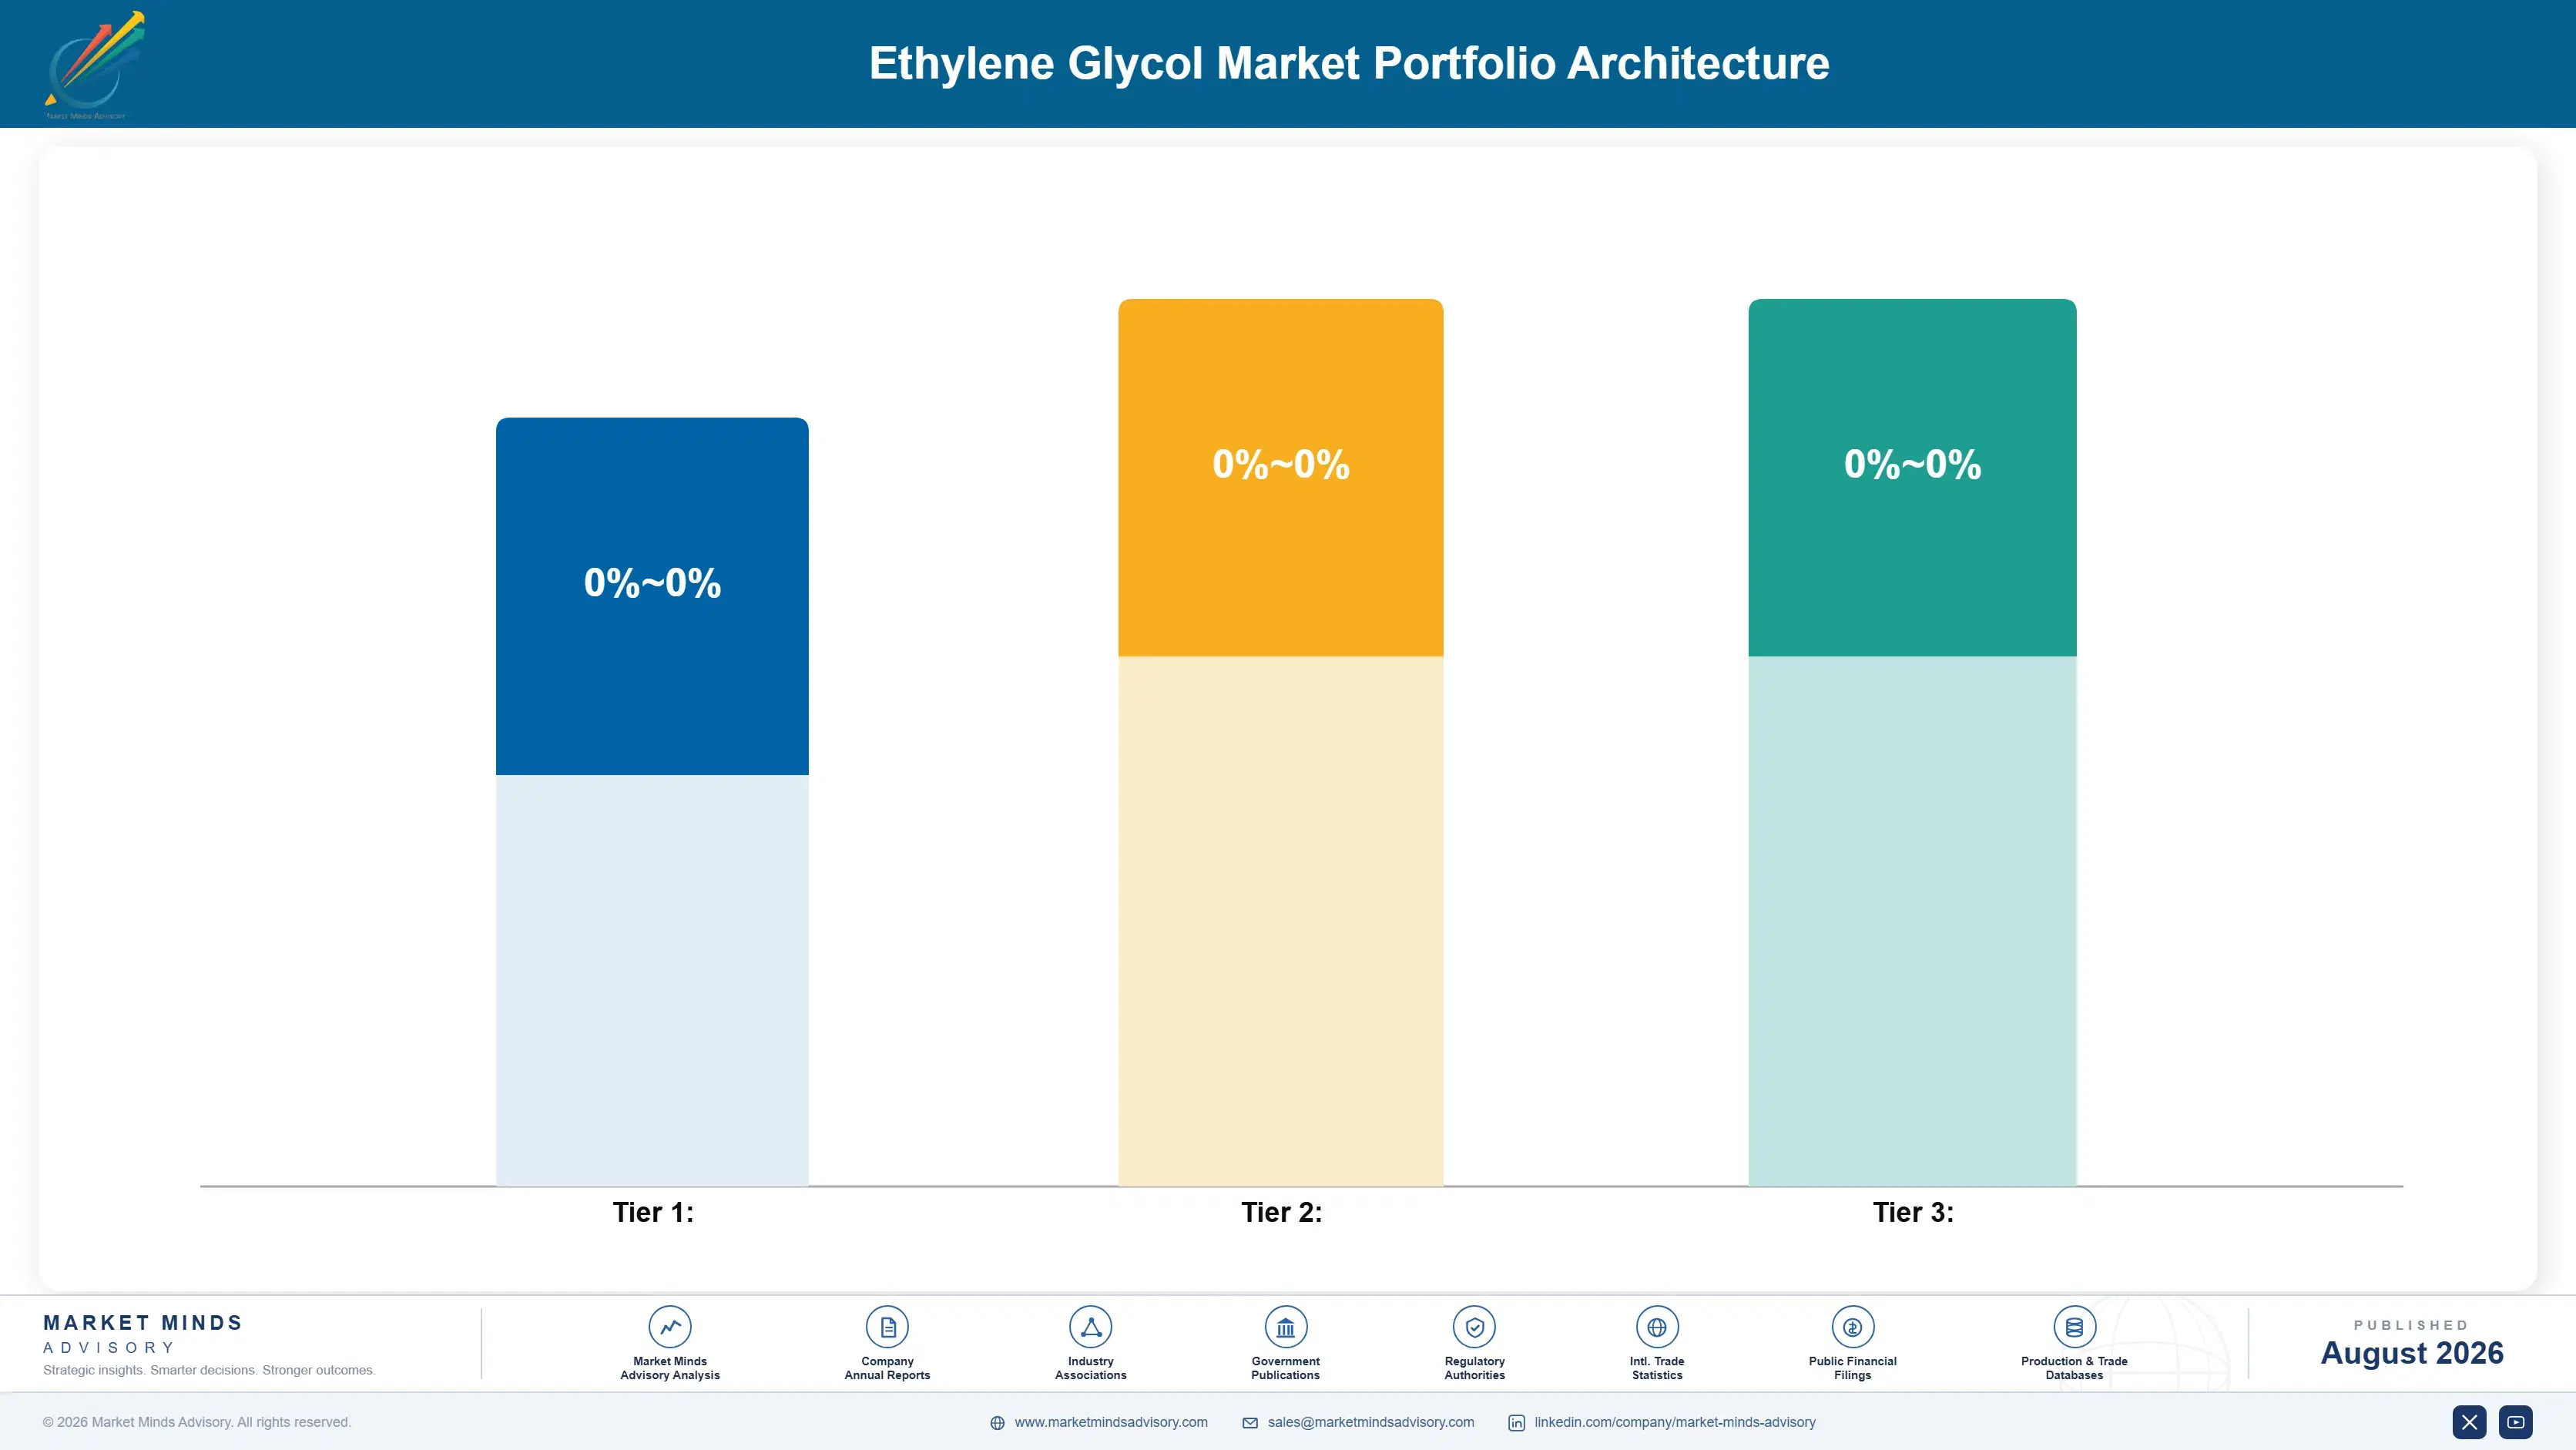
Three margin tiers define this category. Volume and commodity-adjacent products, mostly standard petrochemical and coal-based monoethylene glycol, compete on price with gross margins around 8 to 14 percent given the category's commodity nature. Premium and certified products including specialty purity grades command 18 to 25 percent margins. Sustainability and next-generation bio-based ethylene glycol sits highest, reflecting both feedstock scarcity and buyer willingness to pay for verified renewable content.
The volume versus premium tension shows up clearest in capital allocation decisions, since building bio-based or specialty capacity draws investment away from expanding commodity monoethylene glycol capacity that still represents the overwhelming majority of category revenue today. Producers balancing this tradeoff carefully tend to outperform those chasing premium categories too aggressively before brand owner demand fully materializes across their target end markets, particularly when feedstock costs remain volatile.

High-value margin pools concentrate specifically around bio-based production and high-purity specialty grades, both categories where feedstock differentiation and certification depth support pricing well above commodity monoethylene glycol levels sustainably, even as overall category volume growth moderates toward the middle of the forecast period and buyers consolidate toward certified suppliers.

Standard petrochemical and coal-based monoethylene glycol sold primarily on delivered price to polyester and PET resin producers, with minimal differentiation between suppliers beyond logistics cost, reliability of scheduled shipments, and modest volume discount structures for large accounts.
Gross Margin

High-purity specialty glycol grades sold to antifreeze, industrial solvent, and precision polyester applications where tight purity specifications justify meaningfully higher unit prices than commodity grades, with quality testing creating a real barrier smaller producers rarely clear.
Gross Margin

Bio-based ethylene glycol sold to brand owners with active renewable content commitments, commanding the category's highest margins given constrained feedstock supply relative to rapidly rising demand and continued capacity lag among smaller specialty producers entering the category.
Gross Margin
ethylene-glycol-market-trends-portfolio-architecture-1787548468531

High-value Sub-segments and Strategic Watch-out

Bio-Based Ethylene Glycol

Bio-based ethylene glycol combines premium pricing with the fastest growth in the category, as beverage and apparel brands increasingly commit to renewable content targets across their packaging and textile supply chains worldwide, a shift accelerating faster than overall category volume growth would suggest across most tracked markets.

Coal-Based Ethylene Glycol

Coal-based ethylene glycol carries meaningful cost advantages within China and steady adoption momentum, though growth has moderated slightly as overcapacity concerns limit further domestic capacity additions across most provinces and regional export markets serving neighboring Asian economies with growing packaging and textile demand each year.

Petrochemical Route Monoethylene Glycol

Petrochemical route monoethylene glycol remains the volume backbone of the category, generating the largest absolute revenue even as its relative share slowly declines against faster-growing coal-based and bio-based alternatives across most consuming regions worldwide over the entire coming decade of continued transition and shifting feedstock economics.

Industrial and Antifreeze Grade Glycol

Industrial and antifreeze grade glycol remains a smaller niche today but warrants close monitoring, since electric vehicle adoption could gradually reduce antifreeze demand as combustion vehicle fleets shrink steadily over time across major automotive markets globally and regionally in the decades ahead and well beyond.

A Feedstock Story, Not a Brand

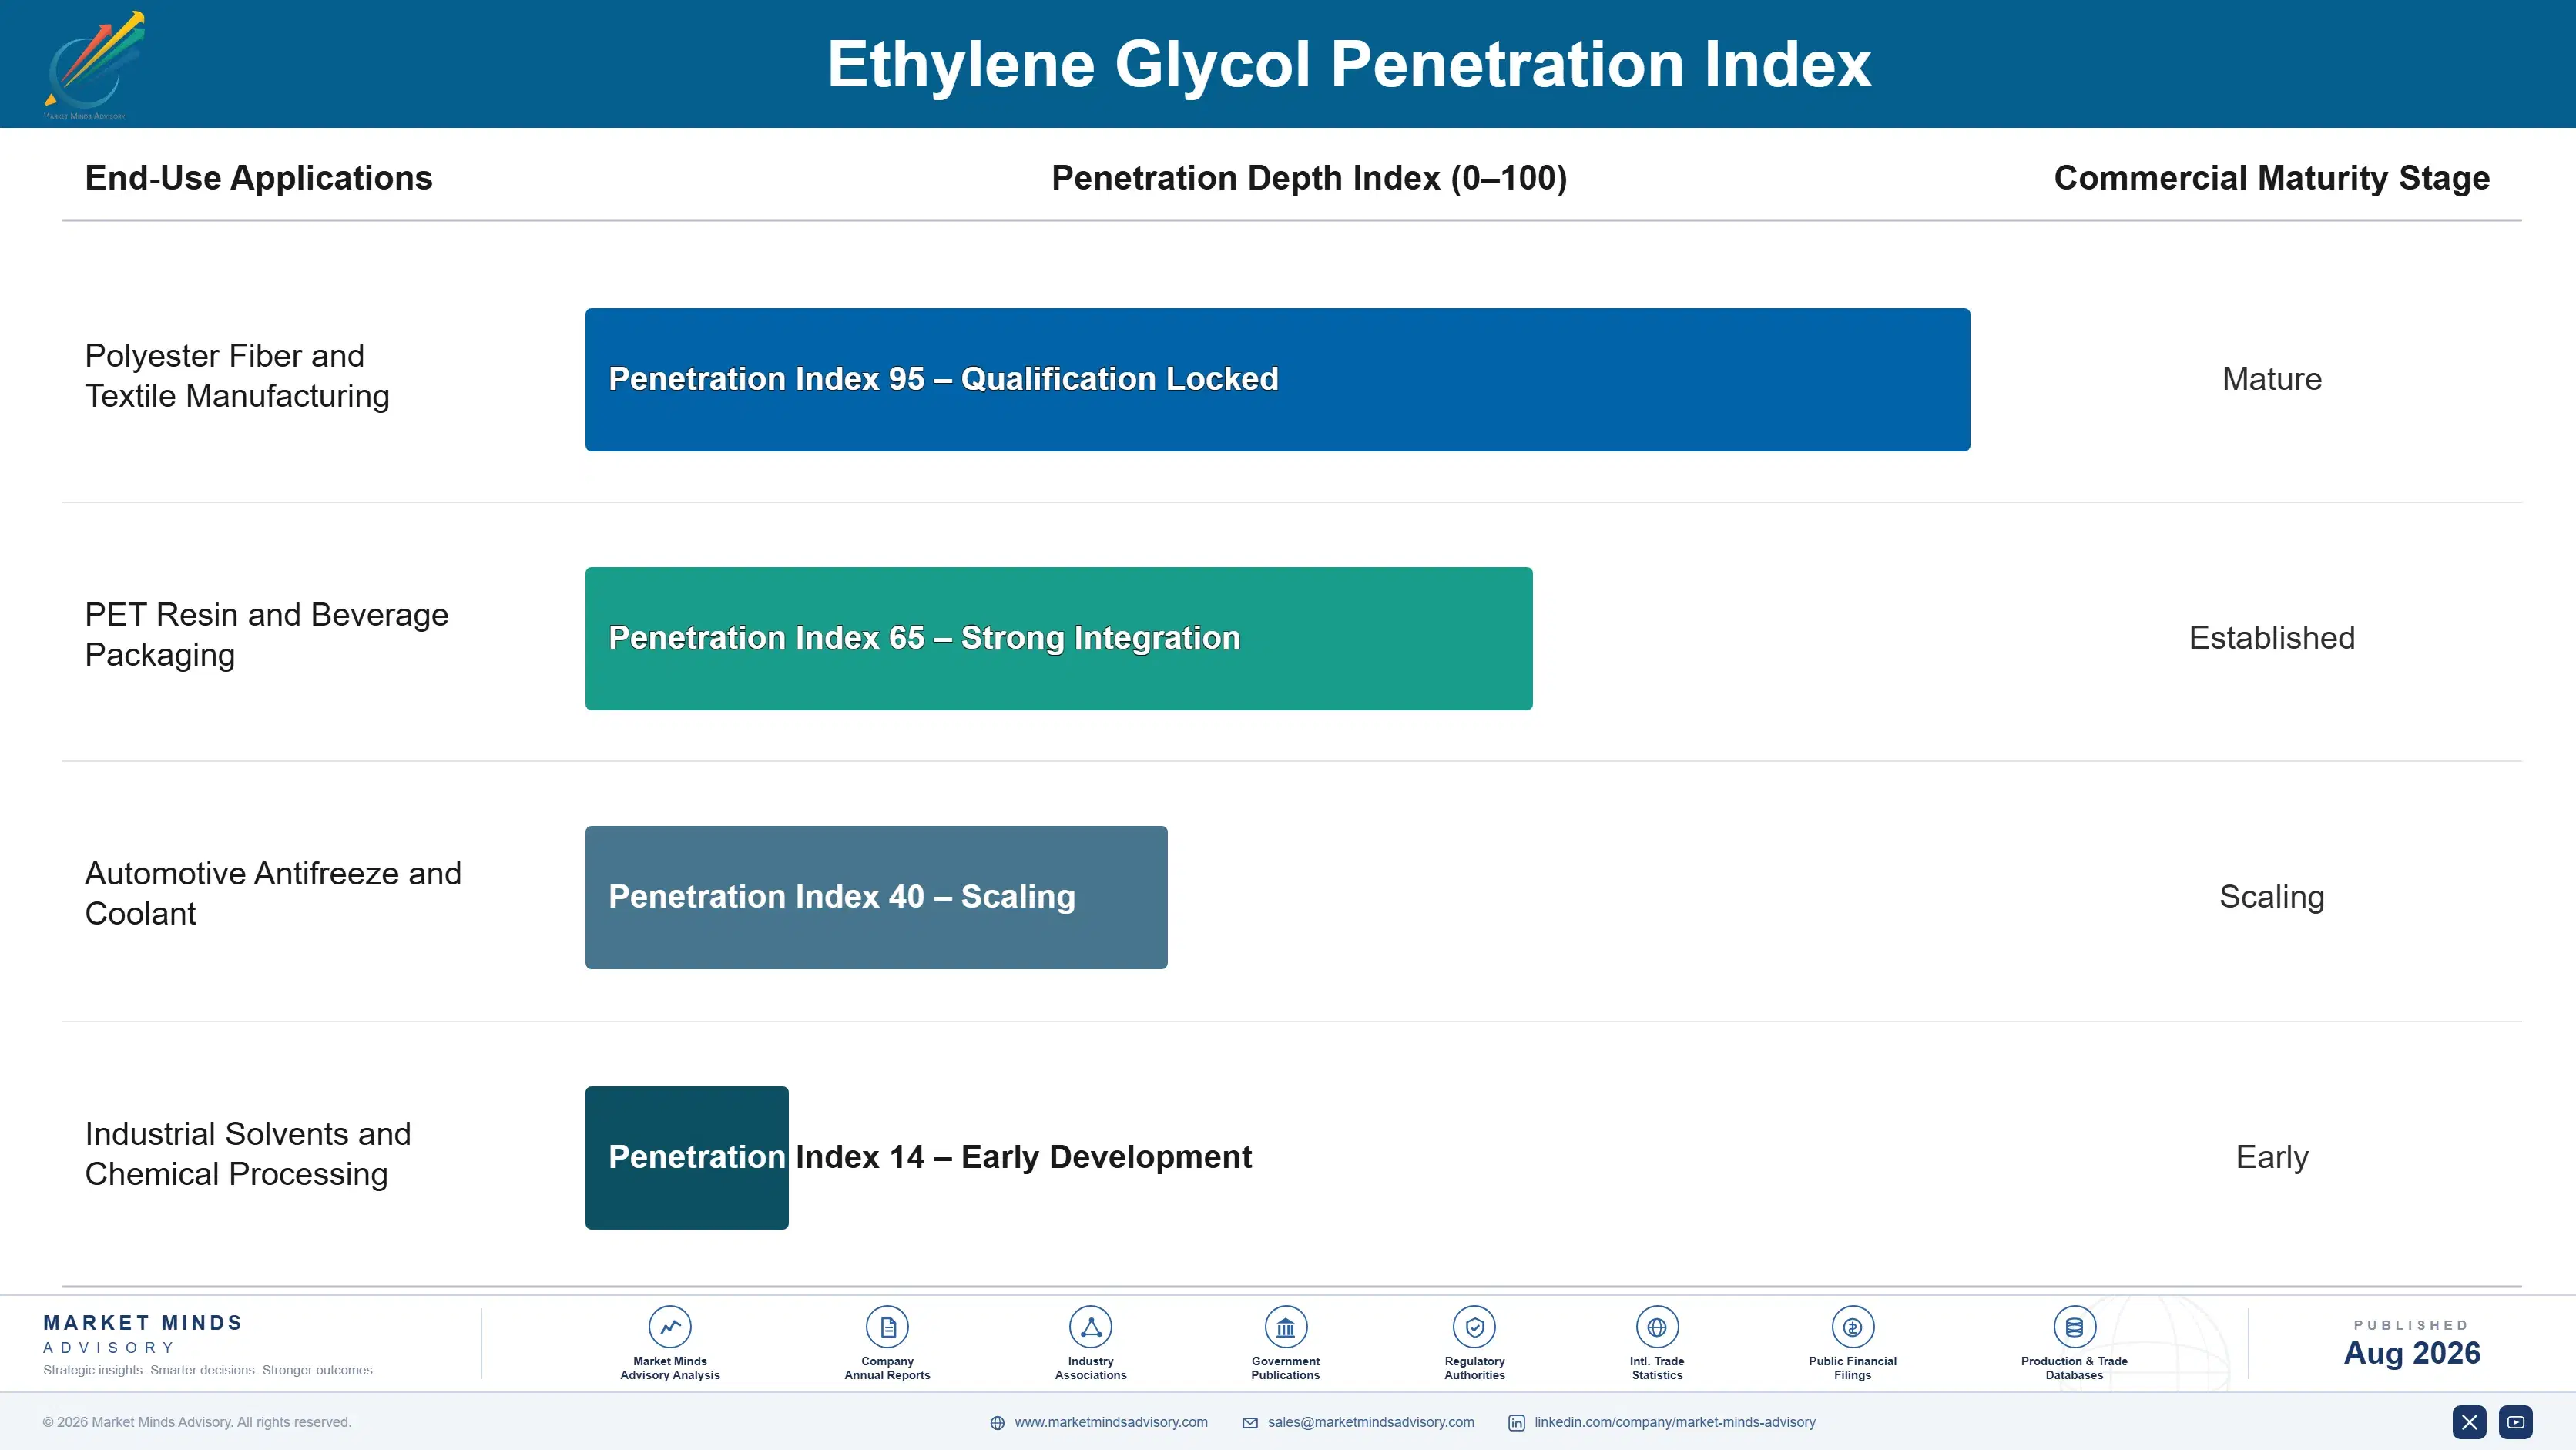
Ethylene glycol is a pure intermediate chemical with no brand presence at the consumer level, meaning demand behaves as a derived function of polyester and PET resin production volume rather than any direct purchasing relationship with end consumers. Contracts run on annual or multi-year terms tied to polyester and PET producer output plans, giving demand a planning-driven rhythm rather than the discretionary purchase pattern found in consumer-facing chemical categories.
Adoption stickiness varies meaningfully by end-use vertical. PET bottle producers show shallower switching costs, since the chemistry is largely interchangeable between petrochemical, coal-based, and bio-based sources as long as purity specifications are met consistently. Specialty antifreeze and industrial solvent customers show deeper lock-in, given formulation-specific qualification requirements that make switching suppliers costly and slow relative to commodity polyester applications.

Buyer profiles are shifting generationally as brand owner sustainability officers increasingly influence upstream feedstock sourcing decisions that previously sat entirely within procurement departments focused purely on cost. This has elevated bio-based and certified renewable content sourcing considerations in supplier selection criteria at major beverage and apparel companies, a shift that traditional commodity-focused petrochemical route producers are still adjusting their sales approach to address.
ethylene-glycol-market-trends-end-use-penetration-index-1787548469015

What Separates Winners in Ethylene Glycol

These are among the four positions where our research anticipates prominent divergence between winners and laggards over the coming forecast period. Each is grounded in the demand model, the regulatory perimeter, and the announced capacity pipeline.
01 / FEEDSTOCK ROUTE FLEXIBILITY

Build Multi-Route Capability Before Costs Diverge

Producers who maintain flexibility across petrochemical, coal-based, and bio-based production routes can shift output toward whichever pathway offers the best margin at a given moment, capturing value that single-route competitors cannot access as easily. Those locked into one feedstock route risk sustained margin compression whenever that specific pathway's relative cost position deteriorates against alternatives across shifting energy markets. Capital committed early to multi-route flexibility tends to compound into a durable advantage that pure petrochemical or pure coal-based producers struggle to replicate quickly.
02 / BIO-BASED CREDIBILITY BUILDING

Establish Renewable Certification Before Demand Peaks

Producers who invest in certified bio-based production and renewable content verification before brand owner demand fully materializes capture premium contracts more easily than those entering after commitments are already locked with established suppliers and long-term agreements. Building that credibility after demand is visible means competing against producers who established documented supply chain traceability years earlier through sustained investment and patient relationship building. The certification cycle itself takes long enough that late movers effectively concede the category's highest-margin segment to whoever invested first.
03 / SPECIALTY GRADE EXPANSION

Prioritize High-Purity Applications Over Commodity Volume

Producers who build high-purity specialty glycol capability capture meaningfully higher margins than those confined to commodity monoethylene glycol sold purely on delivered price to polyester producers. This works best for producers who can demonstrate consistent quality control and testing infrastructure that antifreeze and industrial solvent customers require before committing to a supplier relationship over the long term. Producers pursuing this strategy should prioritize customers with the most demanding purity specifications first, since those relationships prove hardest for competitors to displace afterward.
04 / GEOGRAPHIC CAPACITY REBALANCING

Weight New Capacity Toward South Asia and Pacific

Producers concentrated in Western Europe and mature East Asian markets should weight incremental capacity investment toward South Asia and Pacific, where polyester textile and PET packaging growth is fastest but local supply relationships remain less settled than in mature markets. Waiting for demand to fully materialize before investing risks ceding early customer relationships to regional producers who move faster despite weaker technical capability and thinner certification infrastructure. Early capacity commitment there compounds into durable customer relationships as regional production volume keeps climbing.

Engagement Snapshot From the Field

A live engagement with an industry participant carrying material or product regulatory and market exposure ahead of a defining policy shift, showing how our research translates into a defensible multi-year portfolio strategy.
MARKET MINDS ADVISORY · CLIENT ENGAGEMENT SUMMARY
Ethylene Glycol Producer Strategic Portfolio Review and Transition Roadmap 2026·Investment Scenario on Ethylene Glycol Exposure Evaluation 2025-26
CLIENT PROFILE
The client is a global beverage brand owner with packaging operations spanning multiple continents and a public commitment to increase renewable content in its PET bottle supply chain by a specific target date. Facing pressure from investors and advocacy groups to demonstrate measurable progress, the sustainable sourcing team needed to determine how quickly bio-based ethylene glycol supply could realistically scale to meet its stated packaging commitments without disrupting bottling operations.
STRATEGIC CHALLENGE
The client needed to determine whether current bio-based ethylene glycol production capacity could support its renewable content targets across its full global bottling network, or whether it would need to prioritize specific regions and product lines first while broader supply capacity continued scaling over the subsequent several years of investment.
MMA APPROACH
MMA conducted a structured supply capacity assessment across major bio-based ethylene glycol producers, supplemented by primary interviews with production planners at comparable beverage brands already sourcing bio-based material at meaningful scale across several continents. The analysis modeled supply availability against the client's stated renewable content targets across multiple timeline scenarios.
KEY FINDINGS
  1. Current global bio-based ethylene glycol capacity could support only a modest share of the client's total PET bottle volume within its stated target timeline.
  2. Regional bottling facilities located closer to established bio-based production hubs could achieve renewable content targets years ahead of facilities dependent on longer supply chains.
  3. Competitors who announced renewable content commitments without securing supply agreements in advance faced meaningful delays reaching their own stated target timelines eventually.
  4. Long-term offtake agreements with expanding bio-based producers secured meaningfully better pricing than spot market purchases attempted closer to the stated target deadline.
CLIENT PROFILE
The client is a global beverage brand owner with packaging operations spanning multiple continents and a public commitment to increase renewable content in its PET bottle supply chain by a specific target date. Facing pressure from investors and advocacy groups to demonstrate measurable progress, the sustainable sourcing team needed to determine how quickly bio-based ethylene glycol supply could realistically scale to meet its stated packaging commitments without disrupting bottling operations.
STRATEGIC CHALLENGE
The client needed to determine whether current bio-based ethylene glycol production capacity could support its renewable content targets across its full global bottling network, or whether it would need to prioritize specific regions and product lines first while broader supply capacity continued scaling over the subsequent several years of investment.
MMA APPROACH
MMA conducted a structured supply capacity assessment across major bio-based ethylene glycol producers, supplemented by primary interviews with production planners at comparable beverage brands already sourcing bio-based material at meaningful scale across several continents. The analysis modeled supply availability against the client's stated renewable content targets across multiple timeline scenarios.
KEY FINDINGS
  1. Current global bio-based ethylene glycol capacity could support only a modest share of the client's total PET bottle volume within its stated target timeline.
  2. Regional bottling facilities located closer to established bio-based production hubs could achieve renewable content targets years ahead of facilities dependent on longer supply chains.
  3. Competitors who announced renewable content commitments without securing supply agreements in advance faced meaningful delays reaching their own stated target timelines eventually.
  4. Long-term offtake agreements with expanding bio-based producers secured meaningfully better pricing than spot market purchases attempted closer to the stated target deadline.
RECOMMENDED STRATEGY
Phase 1: Phase one: secure long-term offtake agreements with bio-based producers serving the client's highest-priority bottling regions immediately and without any delay. Phase 2: Phase two: prioritize renewable content conversion at facilities closest to established bio-based supply sources, deferring more distant facilities for later phases. Phase 3: Phase three: reassess remaining facility conversion timelines annually as global bio-based production capacity keeps steadily expanding each and every successive year.
OUTCOME
The client secured long-term offtake agreements covering its highest-priority bottling regions, putting its stated renewable content target within reach for a meaningful share of total volume (client-reported, unverified by MMA), according to the client's own internal sustainability reporting shared during the engagement process this year.

Frequently Asked Questions

Foundational context covering the market sizes, CAGR, scope, country, region and competition that inform every finding below. This section is provided to cover basics and most often pre-purchase conversations, answered from the MMA Primary Research Dataset.

What is the current size of the Ethylene Glycol Market?

The global ethylene glycol market reached approximately 34.0 billion dollars in 2025. Growth is driven by rising polyester fiber demand and expanding PET bottle consumption worldwide.

How large will the Ethylene Glycol Market be by 2036?

MMA projects the market will reach approximately 55.18 billion dollars by 2036, roughly 1.55 times its 2026 value. Bio-based and specialty grades will drive a growing share of that expansion.

What is the CAGR for the Ethylene Glycol Market 2026 to 2036?

The market is projected to grow at a 4.5 percent compound annual rate between 2026 and 2036. Bull and bear scenarios range from 3.3 to 5.7 percent depending on bio-based production scaling speed.

Which segment is growing fastest?

Bio-based ethylene glycol is growing fastest at a 9.5 percent CAGR, roughly 2.11 times the overall market rate. Brand owner renewable content commitments drive this outperformance.

Who are the major companies in the Ethylene Glycol Market?

SABIC, Shell Chemicals, MEGlobal, India Glycols, and Reliance Industries lead the market. Together they hold roughly 42 percent combined share on a production capacity basis.

Which country is growing fastest?

China leads regional growth at a 5.5 percent CAGR, supported by its dominant position in both global polyester manufacturing and PET bottle demand. India follows closely within South Asia and Pacific.

Report Segmentation Architecture

The full report scope spans multiple orthogonal segmentation dimensions, with cross-tabulated demand data provided for each dimension pair. Coverage extends further to regional breakdowns, trend trajectories, and the competitive detail needed to support segment-level decision-making.
  • Petrochemical Route Monoethylene Glycol
  • Coal-Based Ethylene Glycol
  • Bio-Based Ethylene Glycol
  • Diethylene Glycol
  • Triethylene Glycol
  • Industrial and Antifreeze Grade Glycol
  • Polyester Fiber and Textile Manufacturing
  • PET Resin and Beverage Packaging
  • Automotive Antifreeze and Coolant
  • Industrial Solvents and Chemical Processing
  • Direct Producer-to-Converter Contracts
  • Merchant Market Spot Sales
  • Integrated Captive Consumption

By Region

  • North America
  • East Asia
  • Western Europe
  • South Asia and Pacific
  • Latin America
  • Middle East and Africa
  • Eastern Europe

Scope, Methodology, and Coverage

Every figure in this report is reproducible from documented input assumptions. The scope below maps the historical period, the forecast horizon, the segmentation dimensions, and the countries covered, alongside the underlying primary and qualitative methodology.
Historical Period
2020 to 2025
Forecast Period
2026 to 2036
Base Year
2025 (USD billions; MMA Primary Research Dataset, August 2026)
Market Definition
The ethylene glycol market covers petrochemical route, coal-based, and bio-based ethylene glycol, along with monoethylene, diethylene, and triethylene glycol grades sold for polyester fiber, PET resin, antifreeze, and industrial solvent applications. It excludes finished polyester fiber, finished PET bottles, and finished antifreeze formulations sold as separate downstream product categories.
Quantitative Units
USD billions
Segmentation Dimensions
Regions Covered
North America, East Asia, Western Europe, South Asia and Pacific, Latin America, Middle East and Africa, Eastern Europe
Countries Covered
Key Companies Profiled
SABIC, Shell Chemicals, MEGlobal, India Glycols, Reliance Industries, Sinopec, PetroChina, LOTTE Chemical, Formosa Plastics, Indorama Ventures, MOL Group, Nan Ya Plastics, Sasol, TotalEnergies, ExxonMobil Chemical, Huai'an Jinlin Chemical, Zhejiang Satellite Petrochemical, Yankuang Energy, OCI Company, Ineos
Quantitative Methodology
Primary survey, n=3,800 respondents, Q4 2025, six countries; demand-side model with trade association cross-validation
Qualitative Methodology
47 expert interviews, Q4 2025; applied to validate demand model assumptions, identify emerging dynamics, and assess competitive positioning
Report Format
PDF and XLSX data workbook (Word format preview document)
Publisher
Market Minds Advisory
Report Code
MMA-2026-CHM-107
Published
August 2026
Contact
sales@marketmindsadvisory.com | www.marketmindsadvisory.com

Purchase the full Ethylene Glycol Market Report (2026 to 2036).

This report provides a comprehensive assessment of the global ethylene glycol market. It covers sizing, segmentation, competitive dynamics, and regional demand through 2036. The analysis examines the competition between petrochemical, coal-based, and bio-based production routes as feedstock economics and brand owner sustainability commitments reshape purchasing decisions across polyester and PET packaging supply chains worldwide, from raw feedstock through finished resin. It includes detailed competitive profiling of leading producers, feedstock cost exposure across the ethylene and coal supply chain, and a phased case study on renewable content sourcing strategy.
Ten-year market sizing and forecast scenarios
Six-segment MECE production route classification framework
Seven-region demand and growth rate analysis
Competitive profiling of five leading producers
Feedstock cost exposure across ethylene and coal supply chains
Anonymized client case study on renewable sourcing strategy

Built For The People Who Decide

From boardroom strategy to bench-side execution, this report is read cover-to-cover by leaders shaping the next decade of their industry, turning demand scenarios, market dynamics and valuation benchmarks into decisions.
CXOs/ Presidents/ VPs/ Managers
M&A and Corporate Development
Strategy Teams and R&D Heads
Procurement and Product Directors
Regulatory and Compliance Leaders
Investor Relations and Equity Analysts