Market Minds Advisory
Ethylene Dichloride Market

Ethylene Dichloride Market: Trends and Analysis 2026 to 2036

Chinese chlor-alkali producers keep adding integrated ethylene dichloride and PVC capacity even as European plants close under high energy costs, shifting the world's chlorine value chain decisively toward Asia's cost-advantaged production base.

Lead Analyst

Bilal Shaikh

Published

September 2026

Make Smarter Decisions with Customized Research Insights

Request a free sample report and evaluate market opportunities, growth trends, and competitive dynamics relevant to your business needs.

2025 MARKET VALUE$32.5BMarket Size 2025
2036 FORECAST VALUE$51.1BBase Case , 2026 to 2036
CAGR 2026 TO 20364.2 %Bull 5.4% / Bear 3.0%
INCREMENTAL OPPORTUNITY$17.2BNet 10- year value creation
EXPANSION MULTIPLE1.51x2036 value over 2026 base
Strategic Levers
M&A Pipeline
Regional Outlook
Country Rankings
Competitive Intelligence
Segmental Deep-dive
Call-Us : 91 93563 13602

Executive Snapshot and Market Trajectory

Ethylene dichloride has stayed a captive intermediate for decades, but the merchant market is growing steadily as smaller PVC producers without integrated chlorine capacity increasingly buy EDC directly rather than building their own upstream chlor-alkali units from scratch at considerable capital expense.
Vinyl chloride monomer production absorbs more than 90% of global EDC output, tying the market's fortunes tightly to PVC demand for pipe, siding, and cable insulation across construction and infrastructure sectors worldwide. Chelating agent production for water treatment and detergent formulation is the fastest-growing application, expanding well ahead of the dominant VCM segment, even though it remains a much smaller share of total volume. Demand concentrates heavily in China, where integrated chlor-alkali capacity keeps expanding.
Competitive dynamics favor vertically integrated producers who control both chlorine and ethylene feedstock, since standalone EDC merchants face margin pressure from producers who can subsidize pricing with captive downstream PVC economics across the cycle. European capacity rationalization, driven by high energy costs relative to Gulf Coast and Middle Eastern feedstock advantages, is accelerating a multi-year shift in where new capacity gets built and where trade flows increasingly originate.
Market Definition
The ethylene dichloride market covers EDC produced from ethylene and chlorine for use as a vinyl chloride monomer feedstock, chelating agent intermediate, and solvent application. It excludes downstream PVC resin, finished chelating agent products, and standalone chlor-alkali capacity not tied to EDC production.
Base Year Value
$32.5B in 2025 (MMA Primary Research Dataset, August 2026)
Forecast Period
2026 to 2036, eleven discrete annual values
CAGR
4.2% base case. Bull 5.4%. Bear 3.0%.
Fastest Growth Segment
Chelating Agent (EDTA) Production: 6.0% CAGR
Fastest Growth Country
India: 6.8% CAGR
Fastest Growth Region
South Asia and Pacific: 6.2% CAGR
Largest Region
East Asia: 40% of 2025 global value
Market Leaders
Leading suppliers: Formosa Plastics, Westlake Chemical, Shin-Etsu Chemical, OxyChem, and INEOS. Source: MMA Primary Research Dataset, July 2026.
Primary Survey
n=3,800 procurement and R&D decision-makers, Q4 2025, six countries
Methodology
Demand-side build-up, cross-validated against public data, 47 expert interviews

Ethylene Dichloride Market Forecast Scenarios

ethylene-dichloride-market-trends-size-forecast-scenario-1787548770657
Between 2020 and 2025 the market grew at an estimated 3.6% annually as PVC demand recovered unevenly from pandemic-era construction slowdowns while European capacity rationalization began accelerating and Chinese producers kept adding integrated chlor-alkali capacity, producing a steadier but somewhat muted growth path relative to the stronger pre-2020 expansion years across most major producing regions.
The base case assumes 4.2% annual growth through 2036, anchored in three commercial mechanisms: continued Chinese chlor-alkali capacity expansion serving both domestic and export PVC demand, India's infrastructure-driven pipe and cable demand pulling merchant EDC purchases higher, and chelating agent demand for water treatment growing faster than the core VCM application. VCM production remains the base case's dominant volume driver even as chelating agents post the faster percentage growth rate.
The bull case, 5.4%, assumes faster global PVC demand recovery tied to accelerated infrastructure and housing construction across multiple emerging markets simultaneously and ahead of current expectations. The bear case, 3.0%, reflects a scenario where European capacity closures outpace new Asian and Middle Eastern additions, tightening merchant supply enough to dampen downstream PVC production growth rather than simply shifting where production occurs.

A Captive Chemical Finally Trades on Its Own

Roughly 85% to 90% of global EDC production never reaches the open market at all, consumed captively by producers who convert it directly into vinyl chloride monomer and then PVC resin on the same integrated site. The remaining merchant volume, small in percentage terms but meaningful in absolute tonnage, serves PVC producers who never built their own chlor-alkali capacity and rely entirely on external EDC supply contracts.
TOP-5 PRODUCER CONCENTRATION52%Reflects a market dominated by vertically integrated chlor-alkali producers
AVERAGE CONTRACT PRICE$450 per metric tonTracks typical pricing for merchant grade material sold under contract
CHINA PRODUCTION SHARE45%Shows how concentrated global production capacity has become domestically
ETHYLENE SHARE OF COGS55% to 65%Captures how exposed margins are to upstream ethylene feedstock pricing
CAPACITY UTILIZATION82% to 88%Indicates producers are running plants near practical operating ceiling levels
CAPTIVE CONSUMPTION SHARE85% to 90%Marks how much output never reaches the open merchant market
Capacity utilization runs 82% to 88% globally, tight enough that unplanned outages at major integrated sites can meaningfully disrupt merchant availability for buyers without long-term supply contracts in place. Average contract pricing sits around 450 dollars per metric ton, though spot pricing swings considerably wider during periods of ethylene feedstock volatility or unplanned regional capacity outages affecting supply.
Ethylene feedstock represents 55% to 65% of cost of goods sold, exposing producer margins directly to crude oil and natural gas liquids pricing cycles that vary considerably by region depending on feedstock source. Producers with ethane-advantaged feedstock, concentrated along the US Gulf Coast and increasingly the Middle East, carry a durable, long-lasting cost advantage over naphtha-based European and Asian competitors lacking comparable feedstock economics.
"People treat this as boring commodity chemistry, but it's really a proxy for who wins the next decade of chlor-alkali investment. Watch where the new EDC capacity gets built, not where the PVC plants already are."
Principal Analyst, Chemicals and Materials Practice · MMA Chemicals and Materials Practice · August 2026

Market Trends

European Capacity Rationalization Shifts Trade Flows to Asia

European chlor-alkali and EDC producers have announced or completed the closure of more than 1.5 million tons of annual capacity since 2023, citing natural gas and electricity costs that run several times higher than US Gulf Coast or Middle Eastern feedstock pricing for comparable production. This closure wave is redirecting merchant trade flows toward Asian and Middle Eastern exporters who increasingly supply European PVC producers that once sourced domestically. Suppliers with export-oriented logistics infrastructure are capturing this shifting trade pattern fastest, while European producers without ethane-advantaged feedstock access face a genuinely difficult long-term competitive position.
Market Impact: China added 4 million PVC tons

Merchant Market Grows as PVC Producers Outsource EDC Supply

The merchant share of global EDC volume has grown from roughly 8% a decade ago to an estimated 12% to 15% today, as smaller and mid-size PVC producers increasingly choose to purchase EDC externally rather than commit capital to their own chlor-alkali units amid uncertain long-term chlorine demand economics and steadily rising construction costs. This shift creates a genuinely larger addressable market for merchant-focused EDC producers than existed previously, even though captive consumption still dominates total volume by a wide margin across the industry overall and across most producing regions.
Market Impact: Targets rural water access by 2028

Market Opportunities and Growth Drivers

China's Chlor-Alkali Expansion Continues Adding PVC Capacity

China has added more than 4 million tons of annual PVC capacity since 2023, each ton requiring roughly 0.7 tons of EDC feedstock, directly expanding domestic EDC demand even as some older, less efficient Chinese plants face closure under environmental and energy efficiency standards. This expansion keeps China the largest single national driver of global EDC demand growth, with new capacity increasingly built at integrated coastal sites with direct ethylene cracker access. Suppliers serving China's integrated producers benefit from long-term offtake relationships that smaller merchant buyers in other regions typically cannot secure at comparable scale or pricing terms.
Market Impact: Ethylene costs swung over 25%

India's Jal Jeevan Mission Drives PVC Pipe Demand

India's Jal Jeevan Mission, targeting piped water connections for every rural household, has driven PVC pipe demand growth well above the country's broader industrial growth rate, pulling merchant EDC and VCM imports higher as domestic chlor-alkali capacity has not yet scaled to match this new demand fully. The programme's remaining connection targets extend into the late 2020s, suggesting sustained multi-year demand growth rather than a temporary spike tied to a single budget cycle. International EDC and VCM suppliers with established India distribution relationships are capturing the bulk of this incremental import demand ahead of domestic capacity catching up.
Market Impact: Fixed 1-to-1.4 chlorine-caustic output ratio

Market Restraints and Challenges

Ethylene Feedstock Volatility Compresses Producer Margins

Ethylene prices, representing 55% to 65% of cost of goods sold, swung by more than 25% between 2023 and 2025 as naphtha and natural gas liquids pricing moved with broader crude oil and gas market cycles largely unrelated to EDC-specific demand. The root cause is that most EDC producers lack long-term fixed-price ethylene contracts, leaving margins exposed to feedstock spot pricing that can move faster than downstream PVC contract pricing adjusts. Some producers are mitigating this by integrating backward into ethylene cracking capacity or negotiating index-linked pricing formulas that pass volatility through to customers more directly.
Market Impact: 1.5 million tons EU capacity closed

Chlor-Alkali Co-Product Balance Complicates Standalone Economics

EDC production consumes chlorine that chlor-alkali plants also produce caustic soda alongside, meaning EDC economics are partly hostage to caustic soda demand and pricing cycles that move independently and sometimes in the opposite direction from EDC or PVC demand trends. The root cause is the fixed stoichiometric ratio between chlorine and caustic soda output from any chlor-alkali plant, which producers cannot adjust independently of each other in the short term. Some producers are mitigating this by diversifying into multiple chlorine derivative products beyond EDC, spreading co-product balance risk across a broader portfolio of end applications.
Market Impact: Merchant share reaches 12% to 15%
4 additional market trends, 3 additional growth drivers, and 2 additional restraints and challenges are covered in the full report. Contact sales@marketmindsadvisory.com to access the complete intelligence.

Segment CAGR and Growth Architecture

Segmentation follows end-application, the classification producers and buyers use when structuring supply contracts, since each application draws on a distinct downstream value chain with its own demand drivers rather than a shared customer base or purchasing pathway, and each typically involves a separate specification, contract structure, and quality standard entirely across all six categories.
ethylene-dichloride-market-trends-market-share-analysis-1787548771197

Chelating Agent (EDTA) Production

Chelating agent production is the fastest-growing segment, expanding at 6.0% annually as water treatment facilities and detergent formulators increase EDTA and related chelating agent use to control scale-forming minerals and stabilize formulations across an expanding range of industrial and consumer applications worldwide today. This segment remains a small share of total EDC volume compared to vinyl chloride monomer production, but its growth rate reflects genuinely expanding end-use demand rather than a shift in existing chlorine allocation from other applications currently in place across the industry. Producers with dedicated chelating agent production lines are capturing this growth ahead of those still allocating capacity primarily to legacy VCM contracts across their broader portfolio.
CAGR 6.0%

Ethyleneamine Production

Ethyleneamine production, the second-fastest segment at 5.5% annually, is growing as demand for ethyleneamines used in fuel additives, epoxy curing agents, and agricultural chemical intermediates expands alongside broader industrial chemical demand across multiple downstream sectors simultaneously and across most major producing regions worldwide today and quite consistently. This segment sits at a genuine intersection of several distinct end markets, giving it more diversified demand exposure than the water treatment focus that concentrates chelating agent growth in a single application category almost entirely. Producers serving multiple ethyleneamine end markets simultaneously are better positioned than those dependent on a single downstream customer category for the bulk of their segment revenue overall today.
CAGR 5.5%
Full segment breakdown across 6 segments available in the complete report.

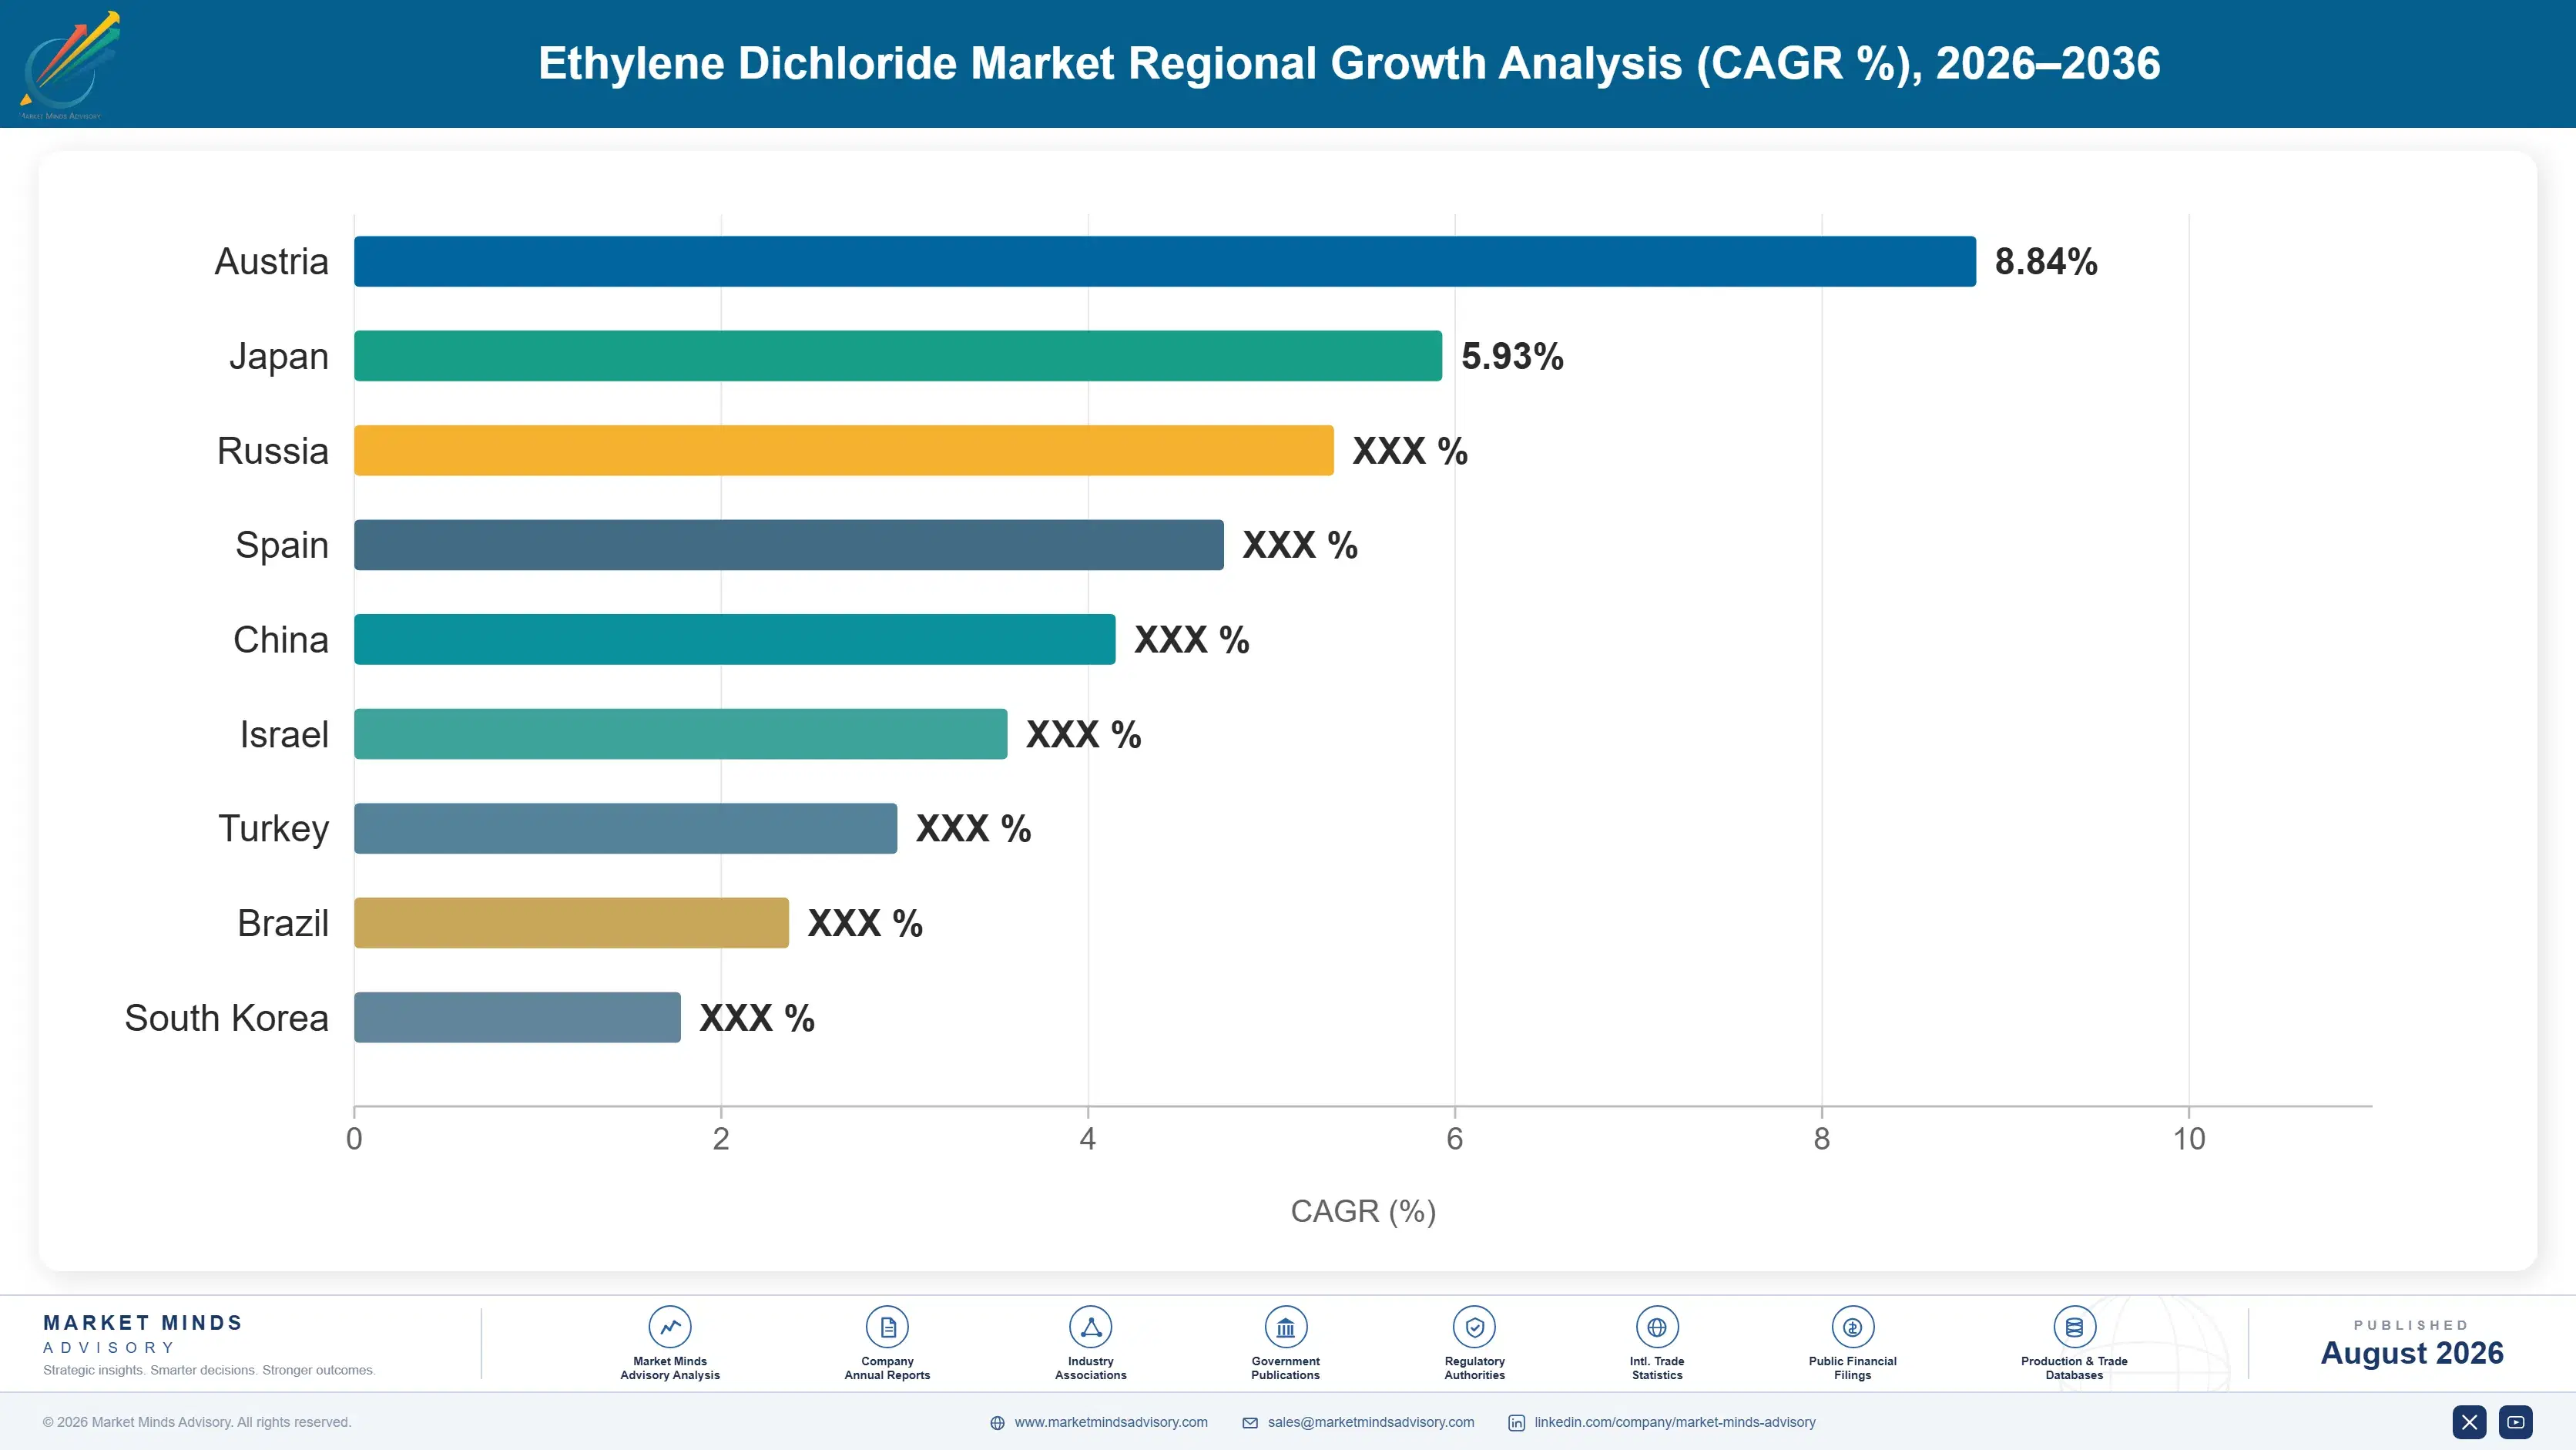
Regional Architecture and Country Demand Map

Demand concentrates heavily around China's vast integrated chlor-alkali and PVC production base, with East Asia broadly commanding the largest regional share by a wide margin worldwide today, while North America holds a meaningful feedstock-advantaged position and Western Europe's share continues declining amid ongoing capacity closures.

East Asia

China anchors East Asian demand through the sheer scale of its integrated chlor-alkali and PVC production base, the largest in the world by a wide margin and still expanding through new coastal capacity additions, and this dominance pushes the region's share meaningfully above MMA's standard band, a deliberate house-rule deviation reflecting China's genuinely outsized position in global EDC production and consumption relative to any other region on earth. Japan and South Korea contribute smaller but technically sophisticated production, while Chinese domestic producers keep adding integrated capacity fastest to serve both domestic and export PVC demand across the region. Regional growth outpaces most mature markets as new capacity continues coming online steadily.
Share: 40% | CAGR: 5.2% (2026 to 2036)

North America

US Gulf Coast ethane-advantaged feedstock economics anchor North American demand, giving integrated producers a durable cost advantage over naphtha-based competitors elsewhere and supporting steady export volumes to Latin American and even some Asian PVC producers seeking cost-competitive supply from abroad today. Domestic PVC demand tracks housing and infrastructure construction cycles closely, with pipe and cable applications representing the bulk of overall consumption across most end markets nationwide and consistently. Canadian chlor-alkali capacity adds a smaller, complementary regional contribution, though most North American capacity investment concentrates specifically along the Gulf Coast where ethylene cracker access remains most cost-advantaged industry-wide. Growth trails East Asia's pace but remains healthy and consistent overall today.
Share: 24% | CAGR: 3.7% (2026 to 2036)
Regional intelligence for 5 additional markets available in the complete report: Western Europe, South Asia and Pacific, Latin America, Middle East and Africa, Eastern Europe. Contact sales@marketmindsadvisory.com.
ethylene-dichloride-market-trends-country-cagr-analysis-1787548771716

Where EDC Producers Can Capture Margin

Four commercial levers determine which producers capture disproportionate margin as the market shifts toward merchant sales and feedstock-advantaged geographies: integrating backward into ethylene cracking, expanding merchant sales to non-integrated PVC producers, building chelating agent production capacity, and relocating output toward regions offering durable feedstock cost advantages over naphtha-based competitors located elsewhere in the world.

Backward Integrate Into Ethylene Cracking Capacity

Ethylene feedstock represents 55% to 65% of cost of goods sold, and producers without integrated cracking capacity remain exposed to spot pricing swings that hit margins hardest during periods of crude oil and natural gas liquids volatility. Integrating backward into ethylene production, particularly at ethane-advantaged Gulf Coast or Middle Eastern sites, captures the margin that would otherwise flow to third-party ethylene suppliers while gaining more predictable feedstock costs during periods of broader market tightness. This approach requires substantial upfront capital but pays back through reduced long-term margin volatility across market cycles.
Market Impact: Shields margins from 55% to 65% COGS exposure

Expand Merchant Sales to Non-Integrated PVC Producers

The merchant share of global EDC volume has grown from roughly 8% a decade ago to an estimated 12% to 15% today, as smaller PVC producers increasingly choose to purchase EDC externally rather than build their own chlor-alkali capacity from scratch. Producers with spare capacity or export-oriented logistics can capture this growing merchant demand ahead of competitors still focused primarily on captive consumption within their own integrated operations. Building dedicated merchant sales and logistics capability now positions producers to capture share as this segment continues expanding faster than captive consumption overall across the industry.
Market Impact: Merchant share grows from 8% to 15% today

Build Dedicated Chelating Agent Production Capacity

Chelating agent production is growing at 6.0% annually, nearly 1.4 times the overall market's 4.2% pace, as water treatment facilities and detergent formulators increase EDTA use across an expanding range of applications worldwide today. Producers with existing EDC production can extend into chelating agent manufacturing relatively efficiently, capturing incremental revenue from a genuinely growing adjacent category without building entirely new upstream chlorine and ethylene supply relationships from scratch. This diversification also reduces dependence on VCM and PVC demand cycles alone, smoothing revenue across a broader base of end applications and customer accounts.
Market Impact: Segment grows at 6.0% versus 4.2% market overall

Relocate Production Capacity Toward Feedstock-Advantaged Regions

European producers face natural gas and electricity costs running several times higher than US Gulf Coast or Middle Eastern feedstock economics, a gap that has already driven the closure of more than 1.5 million tons of regional capacity since 2023 and shows no sign of reversing soon. Producers relocating or expanding capacity toward ethane-advantaged Gulf Coast, Middle Eastern, or increasingly Chinese coastal sites capture durable cost advantages that European-based production simply cannot match under current energy pricing conditions. This relocation trend will likely continue reshaping where new capacity investment concentrates through 2036.
Market Impact: Avoids costs at closed 1.5 million ton sites

Who Controls the Margin Pool

Concentration is moderate to high, with a CR5 near 52% on a production capacity basis and a meaningful gap separating the five vertically integrated leaders from a substantial tail of regional and merchant-focused producers still building comparable scale and feedstock cost advantages of their own across most export markets.
Current competitive activity centers on three fronts: relocating or expanding capacity toward ethane-advantaged Gulf Coast and Middle Eastern sites, building merchant sales capability to serve non-integrated PVC producers, and diversifying into chelating agent and ethyleneamine production beyond core VCM feedstock supply across multiple downstream applications. Several producers are also negotiating index-linked ethylene pricing formulas to manage feedstock volatility more effectively.

Emerging pressure comes from Chinese domestic producers scaling integrated capacity fast enough to challenge established Western and Japanese suppliers on export pricing, particularly across Southeast Asia and increasingly Latin America and parts of Africa. Rankings could shift meaningfully over the next several years if Middle Eastern producers with genuinely lower feedstock costs than even Gulf Coast competitors expand export capacity aggressively, a transition several established suppliers are already watching closely and adjusting long-term capacity plans around.
ethylene-dichloride-market-trends-company-positioning-matrix-1787548772236

Competitive Moat and Risk Dimensions

FORMOSA PLASTICS

Moat: Massive Integrated Naphtha Cracker Scale

Formosa Plastics operates some of the largest integrated ethylene, chlorine, and PVC complexes in the world, giving it feedstock and logistics economies of scale that smaller standalone EDC producers cannot replicate without comparable capital investment. This integration lets Formosa absorb feedstock volatility more comfortably than merchants dependent on external ethylene supply.
FORMOSA PLASTICS

Risk: Heavy Naphtha Feedstock Cost Exposure

Formosa's Asian production relies heavily on naphtha-based ethylene rather than the ethane feedstock that gives US Gulf Coast producers a durable cost advantage, leaving Formosa more exposed to crude oil price cycles than ethane-advantaged competitors. This gap could widen further as more Gulf Coast and Middle Eastern capacity comes online.
WESTLAKE CHEMICAL

Moat: Ethane-Advantaged Gulf Coast Position

Westlake Chemical's Gulf Coast production base gives it direct access to ethane feedstock economics that naphtha-based Asian and European competitors cannot match, supporting durable cost advantages across market cycles. This positioning has let Westlake expand export volumes into Latin America and Asia profitably even during periods of weaker domestic demand.
WESTLAKE CHEMICAL

Risk: Limited Direct Presence in India

Westlake has a comparatively limited direct manufacturing and distribution presence in India relative to domestic producers like Reliance Industries, leaving it more dependent on export shipments to capture the country's rapidly expanding infrastructure-driven PVC demand. This gap in local presence could cost Westlake share as Indian domestic capacity continues scaling.

Players Tracked

Prominent Players

Formosa Plastics
Westlake Chemical
Shin-Etsu Chemical
OxyChem
INEOS

Other Key Players

Orbia
LG Chem
Hanwha Solutions
Reliance Industries
Xinjiang Zhongtai Chemical
Tianjin Bohai Chemical
Kem One
Vynova
Anwil
Borsodchem
SCG Chemicals
PTT Global Chemical
Sinochem International
Chemplast Sanmar
Grasim Industries

Recent Developments

FEBRUARY 2025

Westlake Chemical Expands Gulf Coast EDC and VCM Capacity

Westlake Chemical announced an expansion of its Gulf Coast EDC and VCM production capacity, adding capacity specifically to serve growing export demand to Latin American and Asian PVC producers seeking ethane-advantaged supply. The expansion was an organic capacity addition, not a joint venture or acquisition.
Signal: Confirms Gulf Coast producers are actively prioritizing export capacity growth over purely domestic market expansion alone.
JULY 2025

Reliance Industries Signs European Merchant Supply Agreement

Reliance Industries signed a long-term EDC supply agreement with a European trading house to secure additional merchant volume supporting its rapidly expanding domestic PVC production capacity across multiple facilities in India. The agreement was a direct commercial supply contract, not an equity stake or acquisition.
Signal: Shows Indian producers securing external merchant supply to bridge the gap during their own capacity buildout.
NOVEMBER 2025

INEOS Acquires European Chlorinated Solvents Producer

INEOS acquired a smaller European chlorinated solvents producer to consolidate capacity amid the broader wave of regional closures driven by high energy costs affecting the wider chemical industry today. The acquisition closed after regulatory review confirming limited antitrust concerns given the target's modest market position.
Signal: Signals consolidation is accelerating among surviving European producers as weaker competitors continue exiting the market entirely.

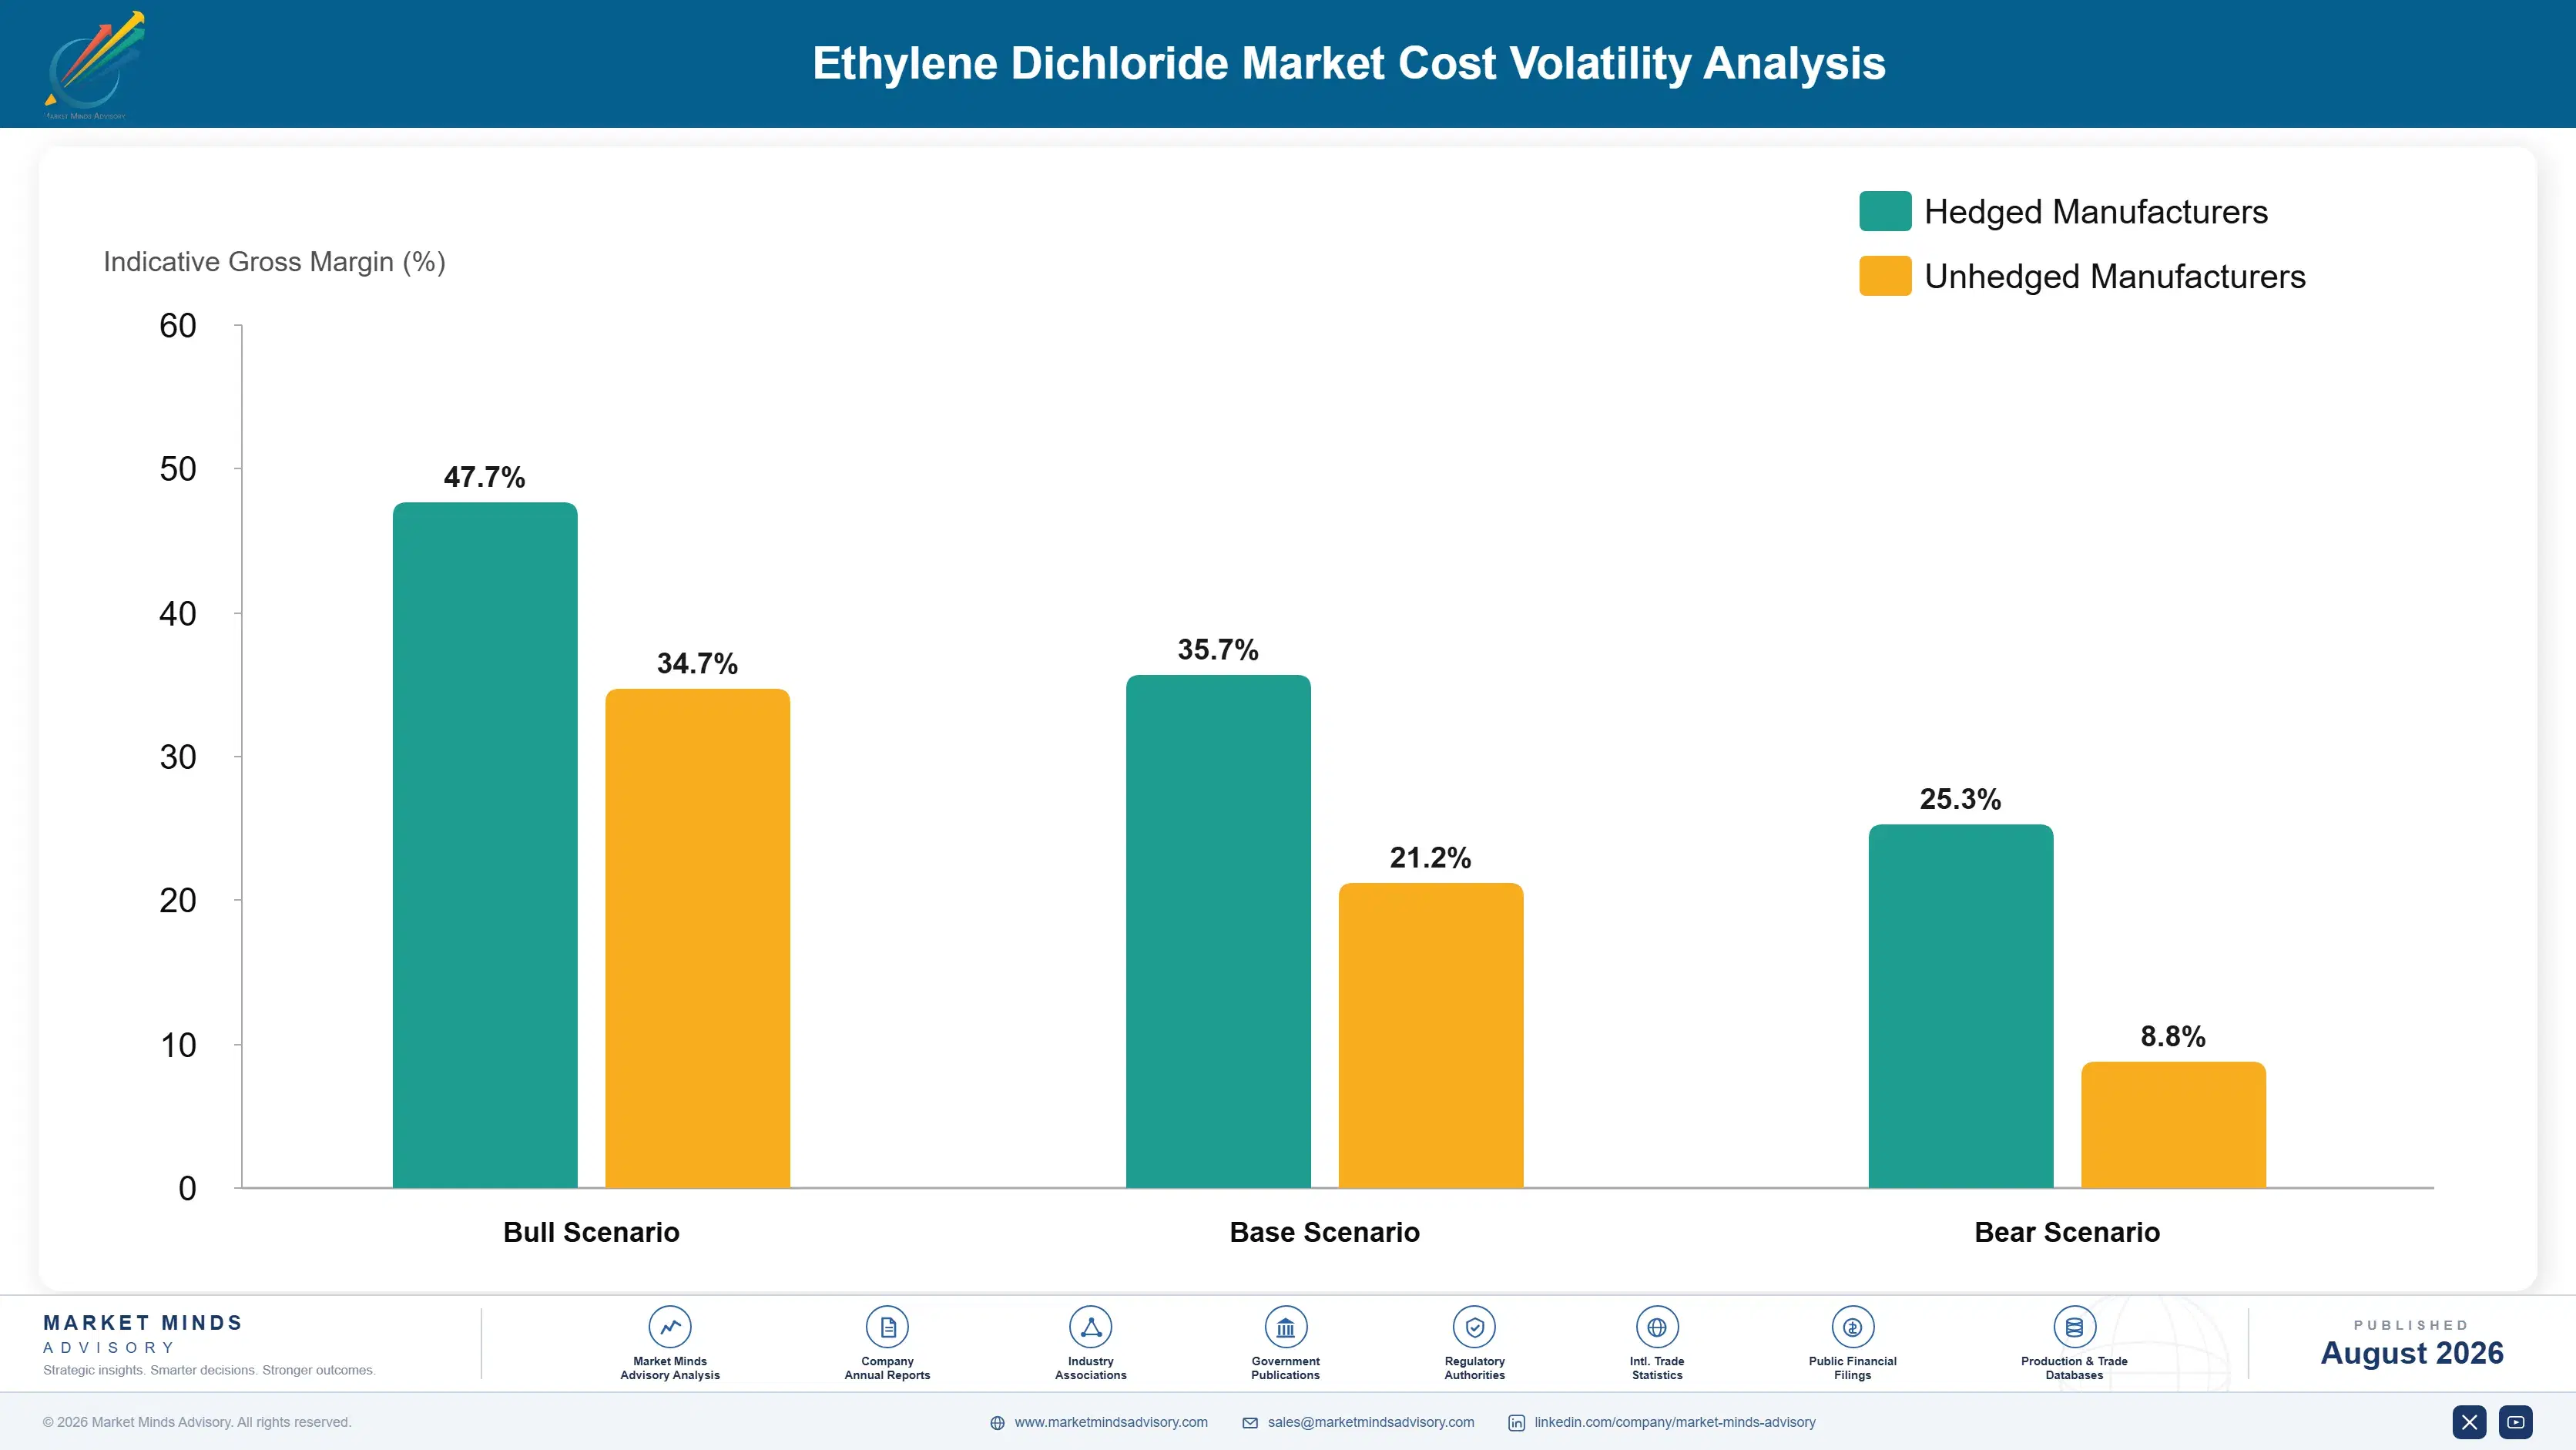
Ethylene Feedstock and Energy Cost Exposure

Ethylene feedstock represents 55% to 65% of cost of goods sold for EDC producers, sourced from naphtha crackers in Asia and Europe or ethane crackers along the Gulf Coast and increasingly the Middle East. Chlorine, produced captively at integrated sites, adds electricity as a secondary major input cost, particularly for producers without access to low-cost regional power.
Ethylene prices, tracked in EIA petrochemical feedstock data, swung by more than 25% between 2023 and 2025 as naphtha and natural gas liquids pricing moved with broader crude oil and gas market cycles. European producers, already facing natural gas and electricity costs several times higher than Gulf Coast levels, saw the compounding effect push more than 1.5 million tons of regional capacity into permanent closure since 2023 rather than absorbing the sustained cost pressure.

Exposure varies meaningfully by player type: producers with ethane-advantaged Gulf Coast or Middle Eastern feedstock access absorb ethylene price swings far better than naphtha-based Asian and European competitors, and this gap becomes a genuine competitive disadvantage during periods of crude oil volatility. Geographic exposure differs too, since European producers face the compounding burden of both feedstock cost and some of the highest industrial electricity prices among major producing regions.
ethylene-dichloride-market-trends-cost-volatility-analysis-1787548772431

Secure Long-Term Ethylene Supply Contracts

Negotiating multi-year ethylene supply agreements or index-linked pricing formulas protects margin against the kind of feedstock volatility that hit prices hard through 2024, giving EDC producers genuinely predictable input costs to plan production scheduling and customer contract pricing around well in advance, rather than absorbing spot-market swings directly into margins unpredictably every single production cycle.

Relocate Production Toward Ethane-Advantaged Sites

Producers with capital flexibility can relocate or expand new capacity toward ethane-advantaged Gulf Coast or Middle Eastern sites rather than continuing to invest in naphtha-based regions facing durably higher feedstock costs over the long term ahead across most future cycles. This approach requires substantial upfront investment but pays back through lasting cost advantages across future market cycles.

Diversify Into Higher-Margin Chelating Agent Production

Extending into chelating agent production, growing nearly 1.4 times faster than the overall market, reduces dependence on ethylene-exposed VCM margins alone and spreads feedstock cost risk across a broader base of end applications and customer accounts. Suppliers already pursuing this diversification reported steadier margin performance during the 2024 ethylene volatility than peers dependent solely on VCM.

Portfolio Architecture for Margin Defence

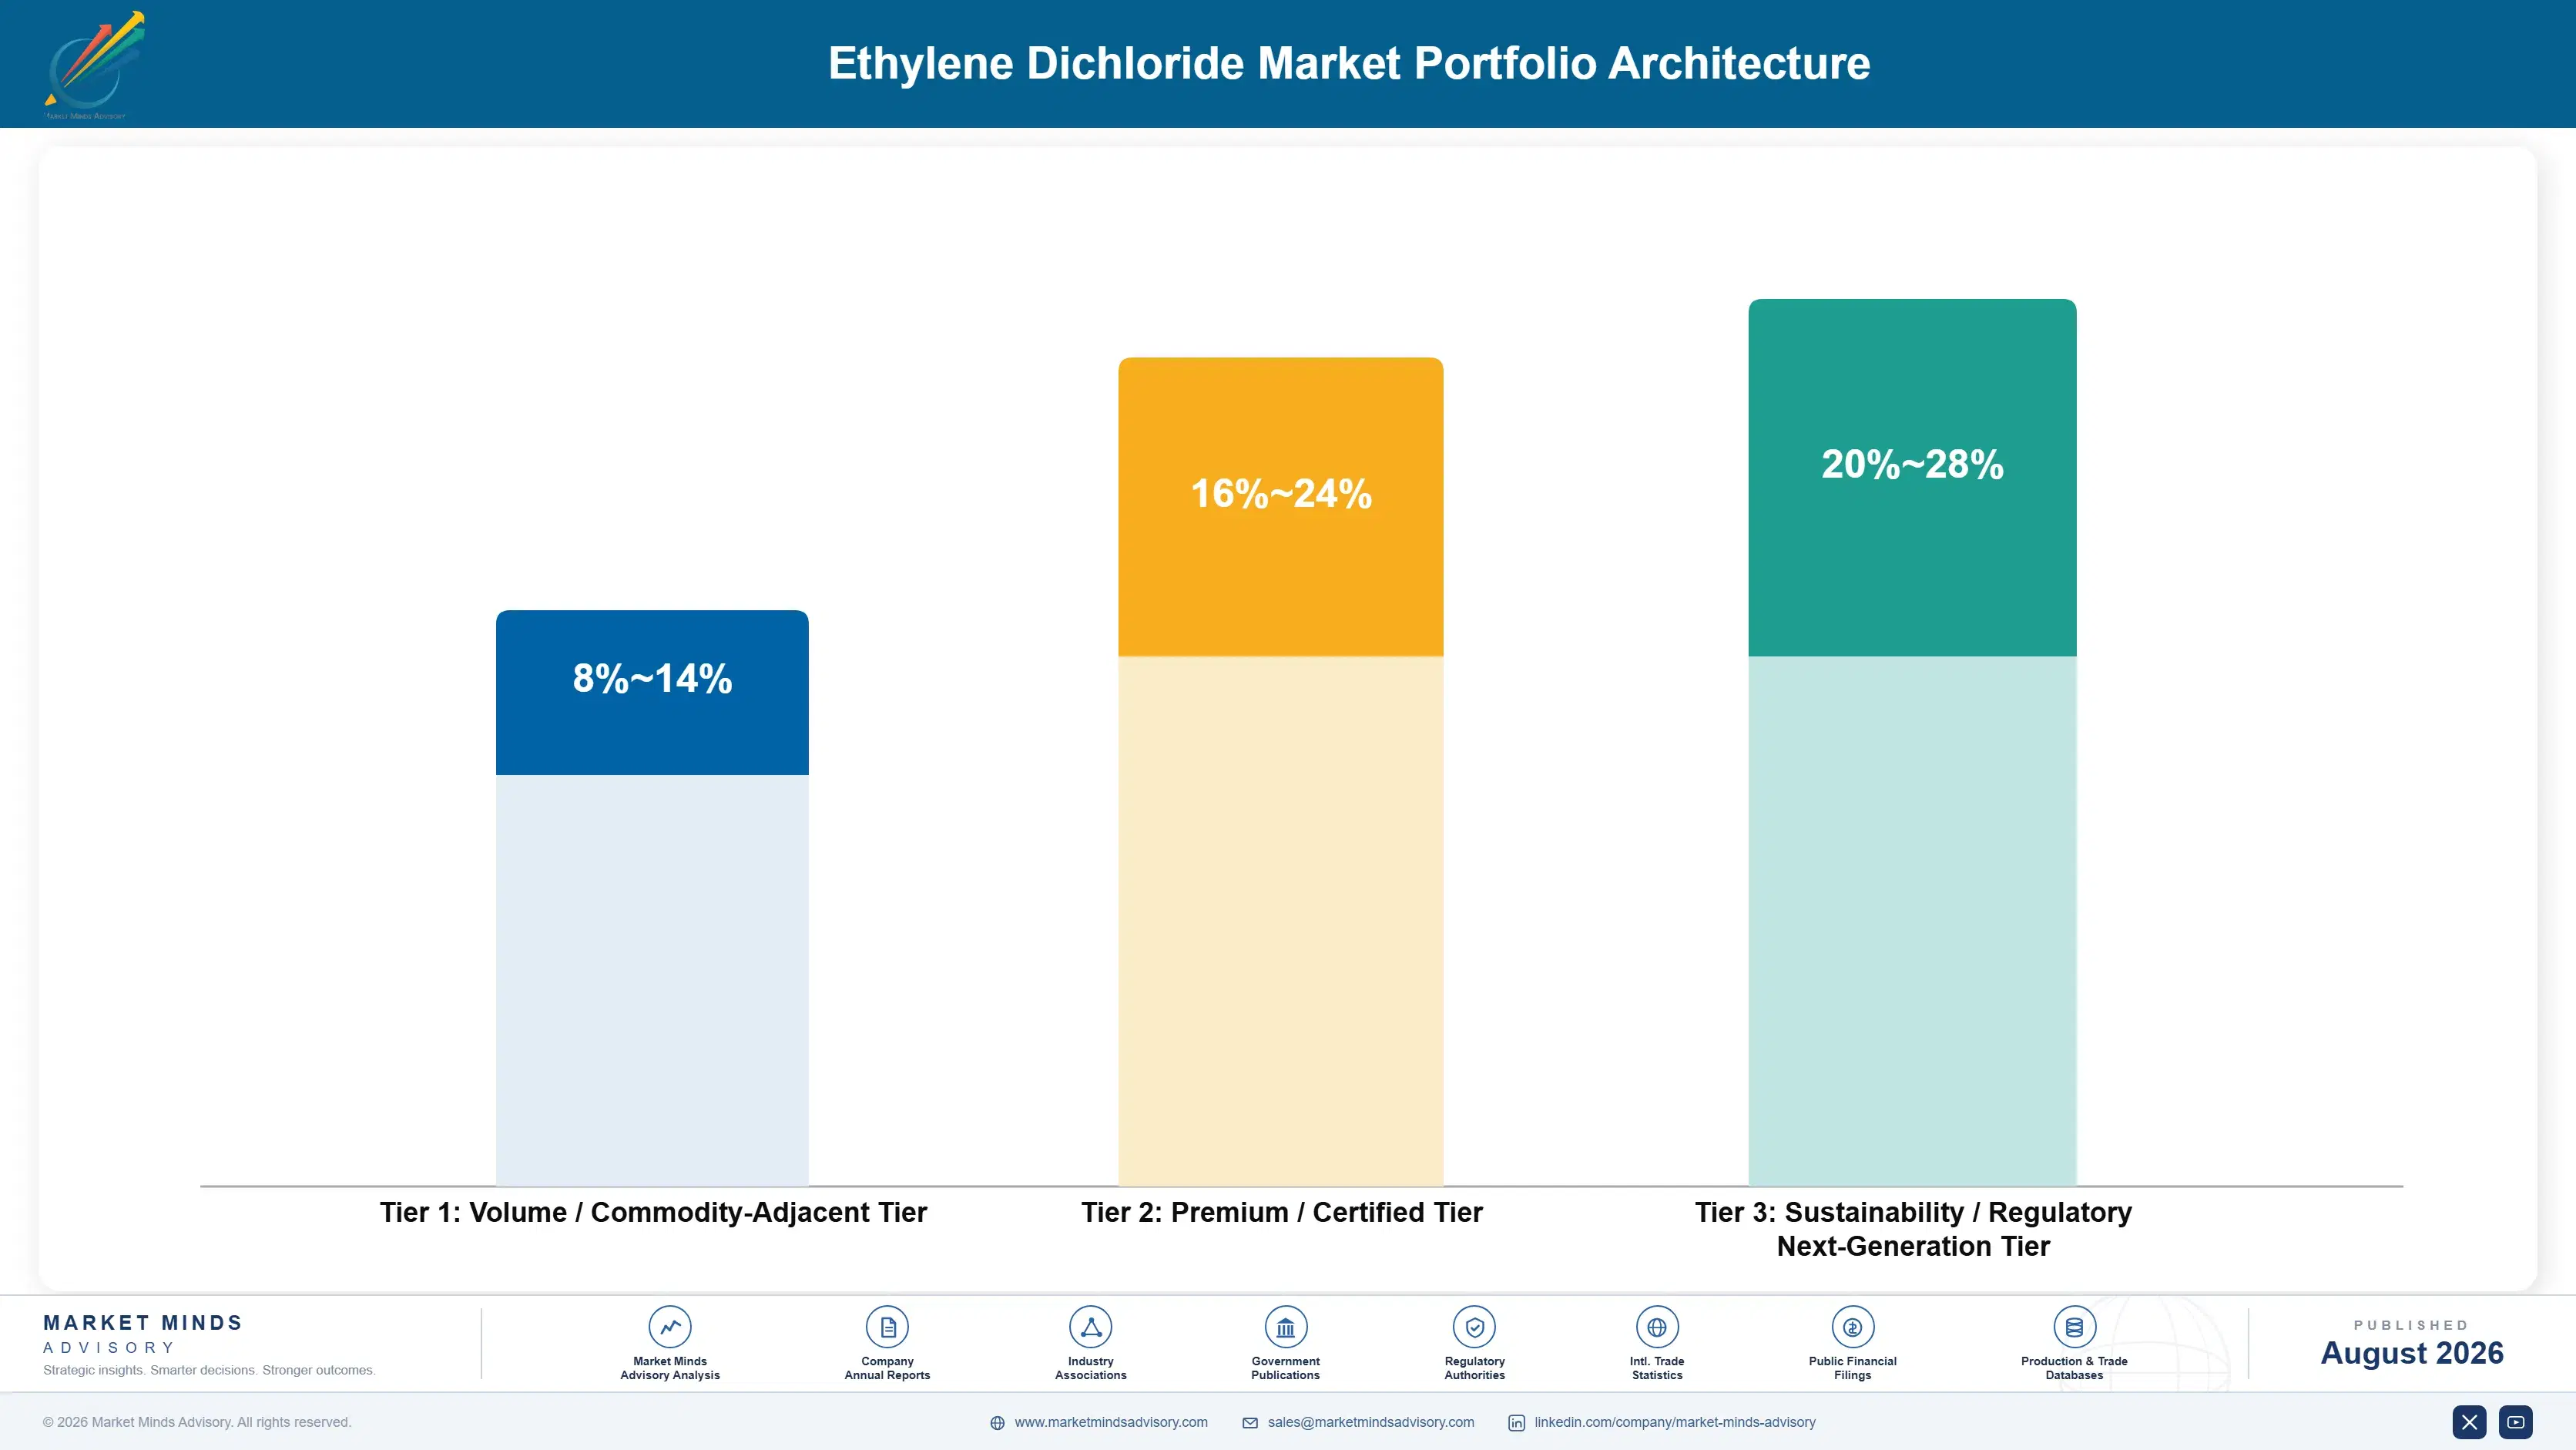
The portfolio splits into three tiers with meaningful margin separation tied to purity specification and feedstock sourcing rather than volume alone. Commodity VCM-grade EDC competes mainly on price and delivery reliability, while specialty-grade material for chelating agent and ethyleneamine applications commands durable premiums tied to purity certification and consistent supply quality.
The tension between volume commodity supply and specialty premium sharpens as chelating agent and ethyleneamine demand grows faster than core VCM demand, pulling some producer investment toward higher-margin specialty grades even though commodity VCM-grade material remains the overwhelming majority of total volume and captive consumption globally. Producers maintaining a foothold across all three tiers preserve optionality, while those chasing only specialty contracts risk losing the steady captive volume that commodity-grade production still reliably generates.

High-value margin pools concentrate specifically in specialty-grade EDC for chelating agent and ethyleneamine applications and in low-carbon, feedstock-advantaged production using renewable electricity for chlor-alkali operations, both requiring genuine process investment that commodity producers must build or acquire rather than simply extend from existing capacity. Commodity VCM-grade EDC, by contrast, remains the large, mature volume base offering thinner, more price-competitive margins for most participants going forward.

Volume / Commodity-Adjacent Tier

Commodity VCM-grade EDC sold primarily on price and delivery reliability into mainstream global PVC resin production without specialty purity or low-carbon sourcing requirements yet, particularly across cost-sensitive markets worldwide today.
Gross Margin: 8%-14%

Premium / Certified Tier

Specialty-grade EDC integrated into chelating agent and ethyleneamine production requiring higher purity certification commanding durable premiums tied to consistent supply quality and a proven multi-year track record with buyers worldwide.
Gross Margin: 16%-24%

Sustainability / Regulatory / Next-Generation Tier

Low-carbon, feedstock-advantaged EDC produced using renewable electricity for chlor-alkali operations, representing the newest and most technically demanding corner of the entire product portfolio as customers increasingly seek verified emissions data.
Gross Margin: 20%-28%
ethylene-dichloride-market-trends-portfolio-architecture-1787548772930

High-value Sub-segments and Strategic Watch-out

Chelating Agent (EDTA) Production

High value with strong growth, tied directly to global chelating agent demand scaling independent of broader mainstream VCM replacement cycles across water treatment and detergent applications worldwide today. Purity certification increasingly decides which supplier wins long-term specialty contracts across most major buyers and regions worldwide.
Gross Margin: 20%-26%

Ethyleneamine Production

High value with moderate growth, anchored in ethyleneamine production platforms where buyers value consistent supply quality over the fastest possible technical iteration across most industrial segments and production regions today. Suppliers here compete on reliability and diversified end-market exposure more than on the newest performance metrics alone.
Gross Margin: 16%-22%

VCM (Vinyl Chloride Monomer) Production

The volume core, serving mainstream VCM production across most global markets regardless of specialty or low-carbon sourcing adoption pace currently underway across the broader industry today. Steady growth tracks PVC production volume rather than any specific technology transition emerging across the wider category today and going forward.
Gross Margin: 8%-13%

Chlorinated Solvents

The strategic watch-out, facing accelerating price competition as Chinese and Middle Eastern producers scale feedstock-advantaged capacity for cost-sensitive commodity segments worldwide across nearly every price tier and geography today. Remaining European and Asian naphtha-based supplier volume concentrates in accounts requiring proven regional presence and established relationships built over many years.
Gross Margin: 6%-11%

The Captive Economics of Chlorine Chemistry

EDC revenue behaves like an annuity tied to integrated chlor-alkali and PVC plant operating life rather than a standalone chemical sale, since most volume is consumed captively on the same site where it is produced, generating value through the entire downstream PVC production chain rather than through a single merchant transaction that ends once the sale closes.
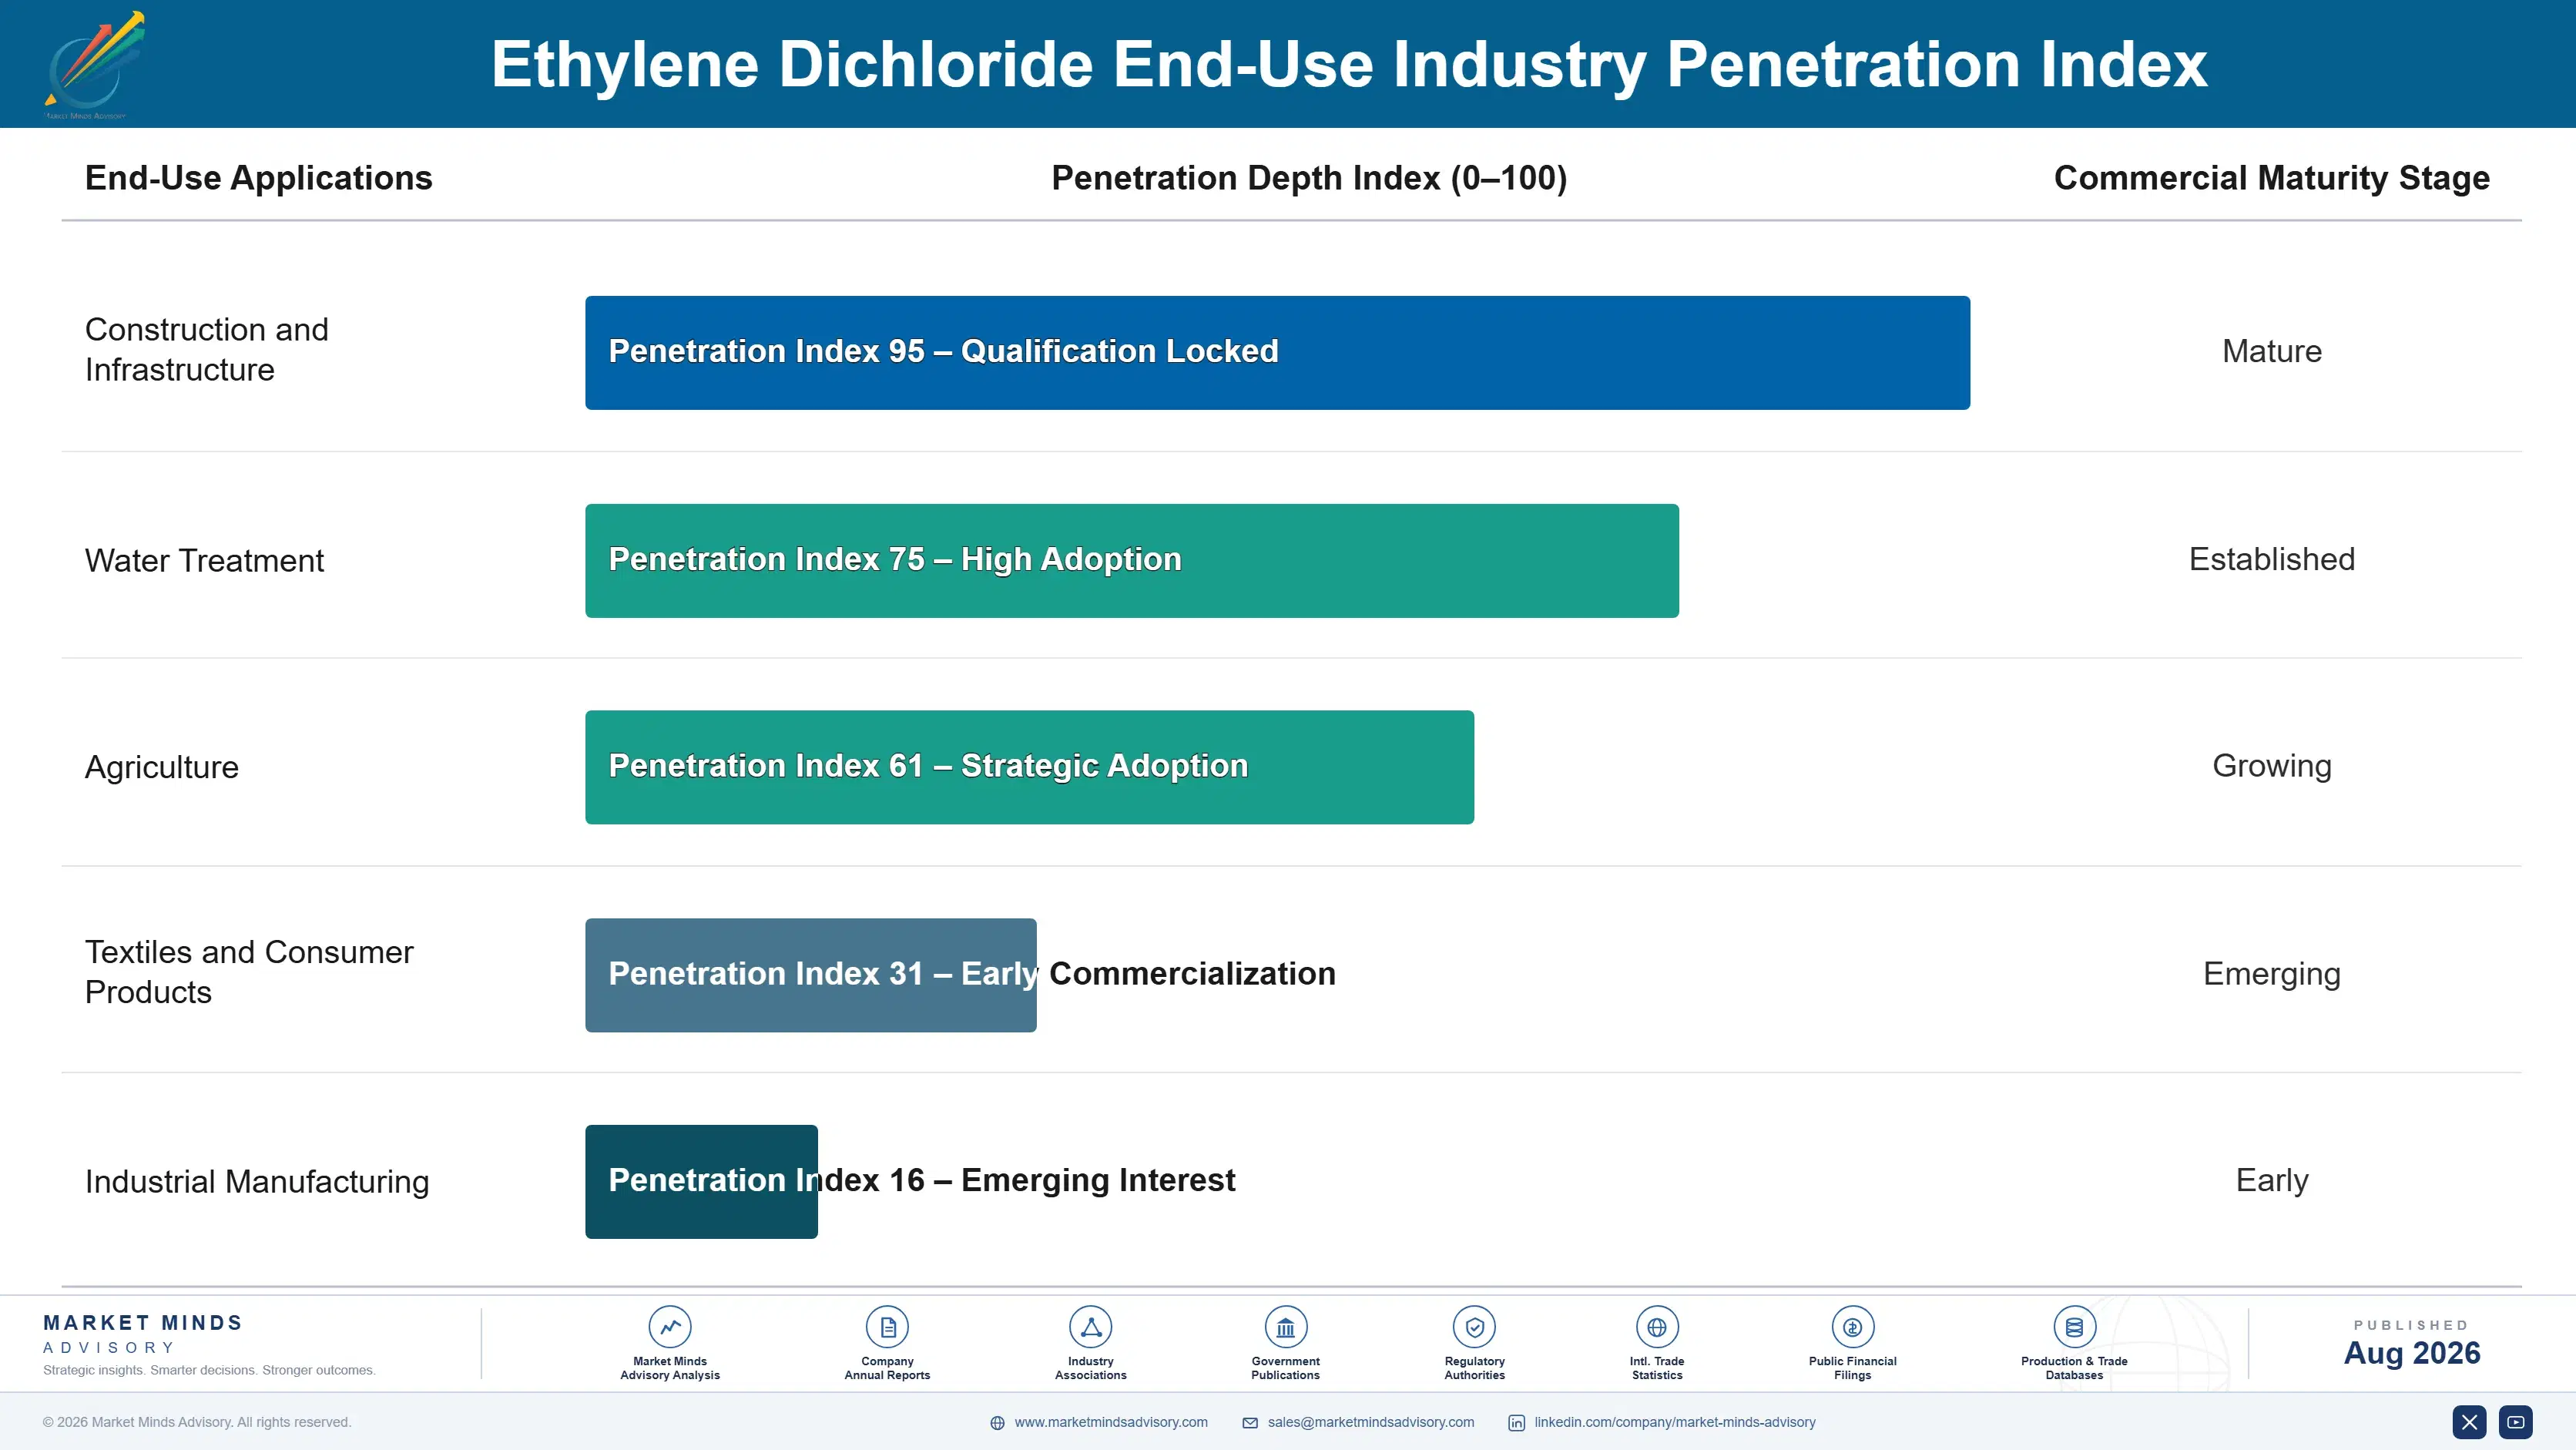
Adoption depth varies by end-use vertical: VCM production for construction-grade PVC pipe and siding represents the deepest, most mature application, while chelating agent and ethyleneamine applications remain earlier-stage verticals still building specification depth with water treatment and industrial chemical buyers across multiple regions. Solvent applications continue shrinking as environmental regulations phase out older chlorinated solvent uses across multiple jurisdictions gradually over time and at varying paces.

Buyer profiles are shifting generationally as sustainability and procurement officers, rather than purely technical purchasing staff, now weigh feedstock carbon intensity alongside price and delivery reliability when evaluating EDC and downstream PVC supply relationships across most industrial accounts today. This younger buyer cohort increasingly favors producers with verified low-carbon feedstock sourcing, reshaping which suppliers get invited to long-term supply negotiations and contract renewals.
ethylene-dichloride-market-trends-end-use-penetration-index-1787548773418

Priorities for EDC Producers and Buyers

These are among the four positions where our research anticipates prominent divergence between winners and laggards over the coming forecast period. Each is grounded in the demand model, the regulatory perimeter, and the announced capacity pipeline.
01 / FEEDSTOCK LOCATION STRATEGY

Prioritize ethane-advantaged capacity over continued naphtha-based investment

European producers face natural gas and electricity costs several times higher than US Gulf Coast or Middle Eastern feedstock economics, a gap that already drove the closure of more than 1.5 million tons of regional capacity since 2023 and shows no sign of reversing through 2036. Producers still weighted toward naphtha-based production risk facing the same fate as European competitors unless they relocate or partner with ethane-advantaged sites. The near-term priority is securing ethane-advantaged capacity access before the cost gap widens further and competitors lock in the remaining advantaged sites.
02 / PORTFOLIO DIVERSIFICATION STRATEGY

Shift investment toward chelating agent and ethyleneamine production

Chelating agent production is growing at 6.0% annually, roughly 1.43 times the overall market's 4.2% pace, as water treatment and detergent demand expands faster than core VCM applications through the entire 2026 to 2036 forecast period. Producers still fully dependent on commodity VCM-grade EDC risk missing this faster-growing, higher-margin opportunity while competitors build dedicated specialty production lines and customer relationships. The near-term priority is building or acquiring specialty production capability before competitors capture the early customer relationships in this expanding category.
03 / MERCHANT MARKET DEVELOPMENT

Build merchant sales capability ahead of continued market growth

The merchant share of global EDC volume has grown from roughly 8% a decade ago to an estimated 12% to 15% today, as smaller PVC producers increasingly choose to purchase EDC externally rather than build their own chlor-alkali capacity from the ground up. Producers still organized purely around captive consumption risk missing this expanding addressable market that competitors with dedicated merchant sales teams are already capturing across multiple regions. Building merchant logistics and sales capability now positions producers ahead of continued merchant segment expansion.
04 / GEOGRAPHIC EXPANSION STRATEGY

Prioritize India market entry over incremental European share

India's Jal Jeevan Mission is driving 6.8% annual country-level growth, roughly 1.62 times the overall market's 4.2% pace, and that gap will widen further as domestic infrastructure investment continues through the mission's remaining connection targets into the late 2020s. Producers still focused primarily on incremental European share risk missing India's faster-growing opportunity while domestic capacity gradually catches up to current import-dependent demand levels. The near-term priority is establishing distribution relationships in India before domestic capacity fully closes the import gap.

Engagement Snapshot From the Field

A live engagement with an industry participant carrying material or product regulatory and market exposure ahead of a defining policy shift, showing how our research translates into a defensible multi-year portfolio strategy.
MARKET MINDS ADVISORY · CLIENT ENGAGEMENT SUMMARY
Ethylene Dichloride Producer Strategic Portfolio Review and Transition Roadmap 2026·Investment Scenario on Ethylene Dichloride Exposure Evaluation 2025-26
CLIENT PROFILE
The client is a mid-size PVC producer without integrated chlor-alkali capacity, purchasing EDC entirely on the merchant market with annual EDC procurement spend of approximately 95 million dollars (client-reported, unverified by MMA). The company faced rising supply costs as its primary European EDC supplier announced planned capacity closure driven by high regional energy prices and gas costs.
STRATEGIC CHALLENGE
Leadership needed to secure alternative long-term EDC supply before the existing European contract expired, but internal procurement staff had limited experience evaluating Gulf Coast or Middle Eastern suppliers, leaving management uncertain whether switching regions would introduce unacceptable logistics cost or reliability risk relative to the familiar existing European relationship and terms.
MMA APPROACH
MMA combined primary interviews with Gulf Coast and Middle Eastern EDC exporters and a landed-cost modeling exercise comparing shipping, tariff, and feedstock pricing across three alternative supply regions, quantifying total delivered cost and reliability risk for each option against the client's existing European contract terms and volume requirements in detail.
KEY FINDINGS
  1. Gulf Coast EDC delivered a lower landed cost than continuing with European supply despite additional shipping distance, given the scale of the underlying feedstock cost advantage involved.
  2. Middle Eastern suppliers offered comparable pricing but longer contracted lead times, an important logistics consideration the client's initial screening had not fully weighted.
  3. Client-reported internal data (client-reported, unverified by MMA) showed European supply reliability had already declined measurably in the year before the closure announcement.
  4. Diversifying across two supply regions reduced single-source dependency risk more effectively than consolidating entirely with one new Gulf Coast supplier working alone.
CLIENT PROFILE
The client is a mid-size PVC producer without integrated chlor-alkali capacity, purchasing EDC entirely on the merchant market with annual EDC procurement spend of approximately 95 million dollars (client-reported, unverified by MMA). The company faced rising supply costs as its primary European EDC supplier announced planned capacity closure driven by high regional energy prices and gas costs.
STRATEGIC CHALLENGE
Leadership needed to secure alternative long-term EDC supply before the existing European contract expired, but internal procurement staff had limited experience evaluating Gulf Coast or Middle Eastern suppliers, leaving management uncertain whether switching regions would introduce unacceptable logistics cost or reliability risk relative to the familiar existing European relationship and terms.
MMA APPROACH
MMA combined primary interviews with Gulf Coast and Middle Eastern EDC exporters and a landed-cost modeling exercise comparing shipping, tariff, and feedstock pricing across three alternative supply regions, quantifying total delivered cost and reliability risk for each option against the client's existing European contract terms and volume requirements in detail.
KEY FINDINGS
  1. Gulf Coast EDC delivered a lower landed cost than continuing with European supply despite additional shipping distance, given the scale of the underlying feedstock cost advantage involved.
  2. Middle Eastern suppliers offered comparable pricing but longer contracted lead times, an important logistics consideration the client's initial screening had not fully weighted.
  3. Client-reported internal data (client-reported, unverified by MMA) showed European supply reliability had already declined measurably in the year before the closure announcement.
  4. Diversifying across two supply regions reduced single-source dependency risk more effectively than consolidating entirely with one new Gulf Coast supplier working alone.
RECOMMENDED STRATEGY
Phase 1: Phase 1 (Months 1 to 3): Complete landed-cost modeling and shortlist two to three alternative Gulf Coast and Middle Eastern suppliers. Phase 2: Phase 2 (Months 4 to 8): Negotiate and finalize supply contracts with two suppliers to diversify sourcing across two distinct regions. Phase 3: Phase 3 (Months 9 to 12): Transition volume away from the closing European contract ahead of its scheduled closure date.
OUTCOME
The client secured supply from two new suppliers within twelve months, avoiding any production disruption from the European closure and reporting an estimated 8% reduction in total landed EDC cost (client-reported, unverified by MMA). Leadership credited the landed-cost modeling MMA delivered early in the engagement.

Frequently Asked Questions

Foundational context covering the market sizes, CAGR, scope, country, region and competition that inform every finding below. This section is provided to cover basics and most often pre-purchase conversations, answered from the MMA Primary Research Dataset.

What is the current size of the Ethylene Dichloride Market?

The global ethylene dichloride market reached an estimated 32.5 billion dollars in 2025. Growth is driven by expanding PVC production capacity across China, India, and the Middle East.

How large will the Ethylene Dichloride Market be by 2036?

MMA projects the market will reach approximately 51.1 billion dollars by 2036. That represents roughly 1.51 times the 2026 market size over the forecast decade.

What is the CAGR for the Ethylene Dichloride Market 2026 to 2036?

The base case CAGR is 4.2% annually across the 2026 to 2036 forecast period. Bull and bear scenarios range from 5.4% to 3.0% depending on PVC demand recovery.

Which segment is growing fastest?

Chelating Agent (EDTA) Production is the fastest-growing segment, expanding at 6.0% annually, roughly 1.43 times the overall market rate. This reflects rising water treatment and detergent demand worldwide.

Who are the major companies in the Ethylene Dichloride Market?

Leading producers include Formosa Plastics, Westlake Chemical, Shin-Etsu Chemical, OxyChem, and INEOS, evaluated on a production capacity basis. Together these five producers hold an estimated 52% combined share.

Which country is growing fastest?

India leads country-level growth at 6.8% annually, outpacing the broader South Asia and Pacific regional average. The Jal Jeevan Mission's water infrastructure targets drive this acceleration.

Report Segmentation Architecture

The full report scope spans multiple orthogonal segmentation dimensions, with cross-tabulated demand data provided for each dimension pair. Coverage extends further to regional breakdowns, trend trajectories, and the competitive detail needed to support segment-level decision-making.

By Application

  • VCM (Vinyl Chloride Monomer) Production
  • Ethyleneamine Production
  • Chlorinated Solvents
  • Pesticide and Agrochemical Intermediates
  • Chelating Agent (EDTA) Production
  • Other Industrial Applications

By End-Use Industry

  • Construction and Infrastructure
  • Water Treatment
  • Agriculture
  • Textiles and Consumer Products
  • Industrial Manufacturing

By Commercial Dimension

  • Captive Consumption
  • Merchant Market Sales
  • Long-Term Supply Contracts
  • Spot Market Transactions

By Region

  • East Asia
  • North America
  • Western Europe
  • South Asia and Pacific
  • Latin America
  • Middle East and Africa
  • Eastern Europe

Scope, Methodology, and Coverage

Every figure in this report is reproducible from documented input assumptions. The scope below maps the historical period, the forecast horizon, the segmentation dimensions, and the countries covered, alongside the underlying primary and qualitative methodology.
Historical Period
2020 to 2025
Forecast Period
2026 to 2036
Base Year
2025 (USD billions; MMA Primary Research Dataset, August 2026)
Market Definition
The ethylene dichloride market covers EDC produced from ethylene and chlorine for use as a vinyl chloride monomer feedstock, chelating agent intermediate, and solvent application. It excludes downstream PVC resin, finished chelating agent products, and standalone chlor-alkali capacity not tied to EDC production.
Quantitative Units
USD billions (current prices); production volume in million metric tons where applicable
Segmentation Dimensions
By Application; By End-Use Industry; By Commercial Dimension; By Region
Regions Covered
East Asia, North America, Western Europe, South Asia and Pacific, Latin America, Middle East and Africa, Eastern Europe
Countries Covered
USA, China, Germany, France, UK, Japan, South Korea, India, Australia, Canada, Brazil, Mexico, Indonesia, Vietnam, Thailand, Malaysia, UAE, Saudi Arabia, South Africa, Nigeria, Turkey, Poland, Netherlands, Italy, Spain, Sweden, Switzerland, Argentina, Colombia, Singapore, and additional markets relevant to this sector
Key Companies Profiled
Formosa Plastics, Westlake Chemical, Shin-Etsu Chemical, OxyChem, INEOS, Orbia, LG Chem, Hanwha Solutions, Reliance Industries, Xinjiang Zhongtai Chemical, Tianjin Bohai Chemical, Kem One, Vynova, Anwil, Borsodchem, SCG Chemicals, PTT Global Chemical, Sinochem International, Chemplast Sanmar, Grasim Industries
Quantitative Methodology
Primary survey, n=3,800 respondents, Q4 2025, six countries; demand-side model with trade association cross-validation
Qualitative Methodology
47 expert interviews, Q4 2025; applied to validate demand model assumptions, identify emerging dynamics, and assess competitive positioning
Report Format
PDF and XLSX data workbook (Word format preview document)
Publisher
Market Minds Advisory
Report Code
MMA-2026-CHM-208
Published
August 2026
Contact
sales@marketmindsadvisory.com | www.marketmindsadvisory.com

Purchase the full Ethylene Dichloride Market Report (2026 to 2036).

This report provides a complete assessment of the global ethylene dichloride market across the 2026 to 2036 forecast period, covering sizing, segmentation, and regional demand patterns. It profiles the five leading producers and fifteen additional participants on a consistent production capacity basis, detailing competitive positioning, recent corporate developments, and moat and risk analysis for the top two players. The report also examines input cost exposure, portfolio margin architecture, and revenue lever opportunities tied to feedstock-advantaged geographies. A dedicated regional chapter breaks down demand across all seven MMA-tracked regions.
Ten-year global market sizing and CAGR forecast model
Six-segment MECE application breakdown and analysis
Seven-region demand share and growth rate analysis
Twenty-company competitive benchmarking and positioning dataset
Input cost exposure and portfolio margin modeling detail
Anonymized client engagement case study with outcomes

Built For The People Who Decide

From boardroom strategy to bench-side execution, this report is read cover-to-cover by leaders shaping the next decade of their industry, turning demand scenarios, market dynamics and valuation benchmarks into decisions.
CXOs/ Presidents/ VPs/ Managers
M&A and Corporate Development
Strategy Teams and R&D Heads
Procurement and Product Directors
Regulatory and Compliance Leaders
Investor Relations and Equity Analysts