Market Minds Advisory
Ethernet Backhaul Equipment Market

Ethernet Backhaul Equipment Market: Ethernet Backhaul Equipment: Timing Accuracy, Microwave Persistence and a Capex Base That Is Not Growing

Fibre was supposed to replace microwave at the cell site and roughly half of the world's sites still run on radio, because trenching economics never changed and nothing in the technology addressed that.

Lead Analyst

Published

September 2026

Make Smarter Decisions with Customized Research Insights

Request a free sample report and evaluate market opportunities, growth trends, and competitive dynamics relevant to your business needs.

2025 MARKET VALUE$8.4BMarket Size 2025
2036 FORECAST VALUE$14.7BBase Case , 2026 to 2036
CAGR 2026 TO 20365.2 %Bull 6.4% / Bear 4.0%
INCREMENTAL OPPORTUNITY$5.8BNet 10- year value creation
EXPANSION MULTIPLE1.66x2036 value over 2026 base
Strategic Levers
M&A Pipeline
Regional Outlook
Country Rankings
Competitive Intelligence
Segmental Deep-dive
Call-Us : 91 93563 13602

Executive Snapshot and Market Trajectory.

Roughly 48% of cell sites worldwide are still backhauled by microwave radio rather than fibre. That has barely moved in a decade, because the obstacle was never the technology and always the cost of digging. Every mobile generation arrived with a fibre forecast that failed. Nothing has changed that.
Growth is coming from the parts nobody markets. Optical transport for fronthaul and backhaul grows at 7.8%, half again the market rate of 5.2%, and timing equipment follows at 7.0% because time division duplex operation demands synchronisation to about 1.5 microseconds. East Asia takes 36% of value on cell site counts no other region approaches, and India is the fastest-growing country market at 9.8%.
Concentration sits near 66% across the top five on measured equipment shipment revenue, and it keeps rising through consolidation rather than competition. Operator capital intensity has been falling in real terms for years, so vendors that cannot grow are buying each other instead. Differentiation has moved from throughput to timing and transport software. Operators still compare throughput figures on equipment where throughput stopped being the constraint years ago. Consolidation raises concentration without improving anybody's trajectory.
Market Definition
This market covers packet transport equipment carrying traffic between radio sites and the mobile core, spanning microwave and millimetre wave radio links, cell site and access routers, aggregation and pre-aggregation routers, optical transport for mobile fronthaul and backhaul, timing and synchronisation equipment, and fixed wireless and satellite backhaul terminals. Revenue is measured as equipment shipment value at vendor level. Radio access base stations, mobile core network elements, passive fibre infrastructure, civil construction, network management software sold standalone and enterprise campus switching are excluded.
Base Year Value
$8.4B in 2025 (MMA Primary Research Dataset, September 2026)
Forecast Period
2026 to 2036, eleven discrete annual values
CAGR
5.2% base case. Bull 6.4%. Bear 4.0%.
Fastest Growth Segment
Optical Transport for Mobile Fronthaul and Backhaul: 7.8% CAGR
Fastest Growth Country
India: 9.8% CAGR
Fastest Growth Region
South Asia and Pacific: 7.2% CAGR
Largest Region
East Asia: 36% of 2025 global value
Market Leaders
Huawei, Ericsson, Nokia, Cisco and Ciena lead on measured backhaul transport equipment shipment revenue. Source: MMA Primary Research Dataset, July 2026.
Primary Survey
n=3,800 procurement and R&D decision-makers, Q4 2025, six countries
Methodology
Demand-side build-up, cross-validated against public data, 47 expert interviews

Ethernet Backhaul Equipment Market Forecast Scenarios

ethernet-backhaul-equipment-market-size-forecast-scenario-1788421747245
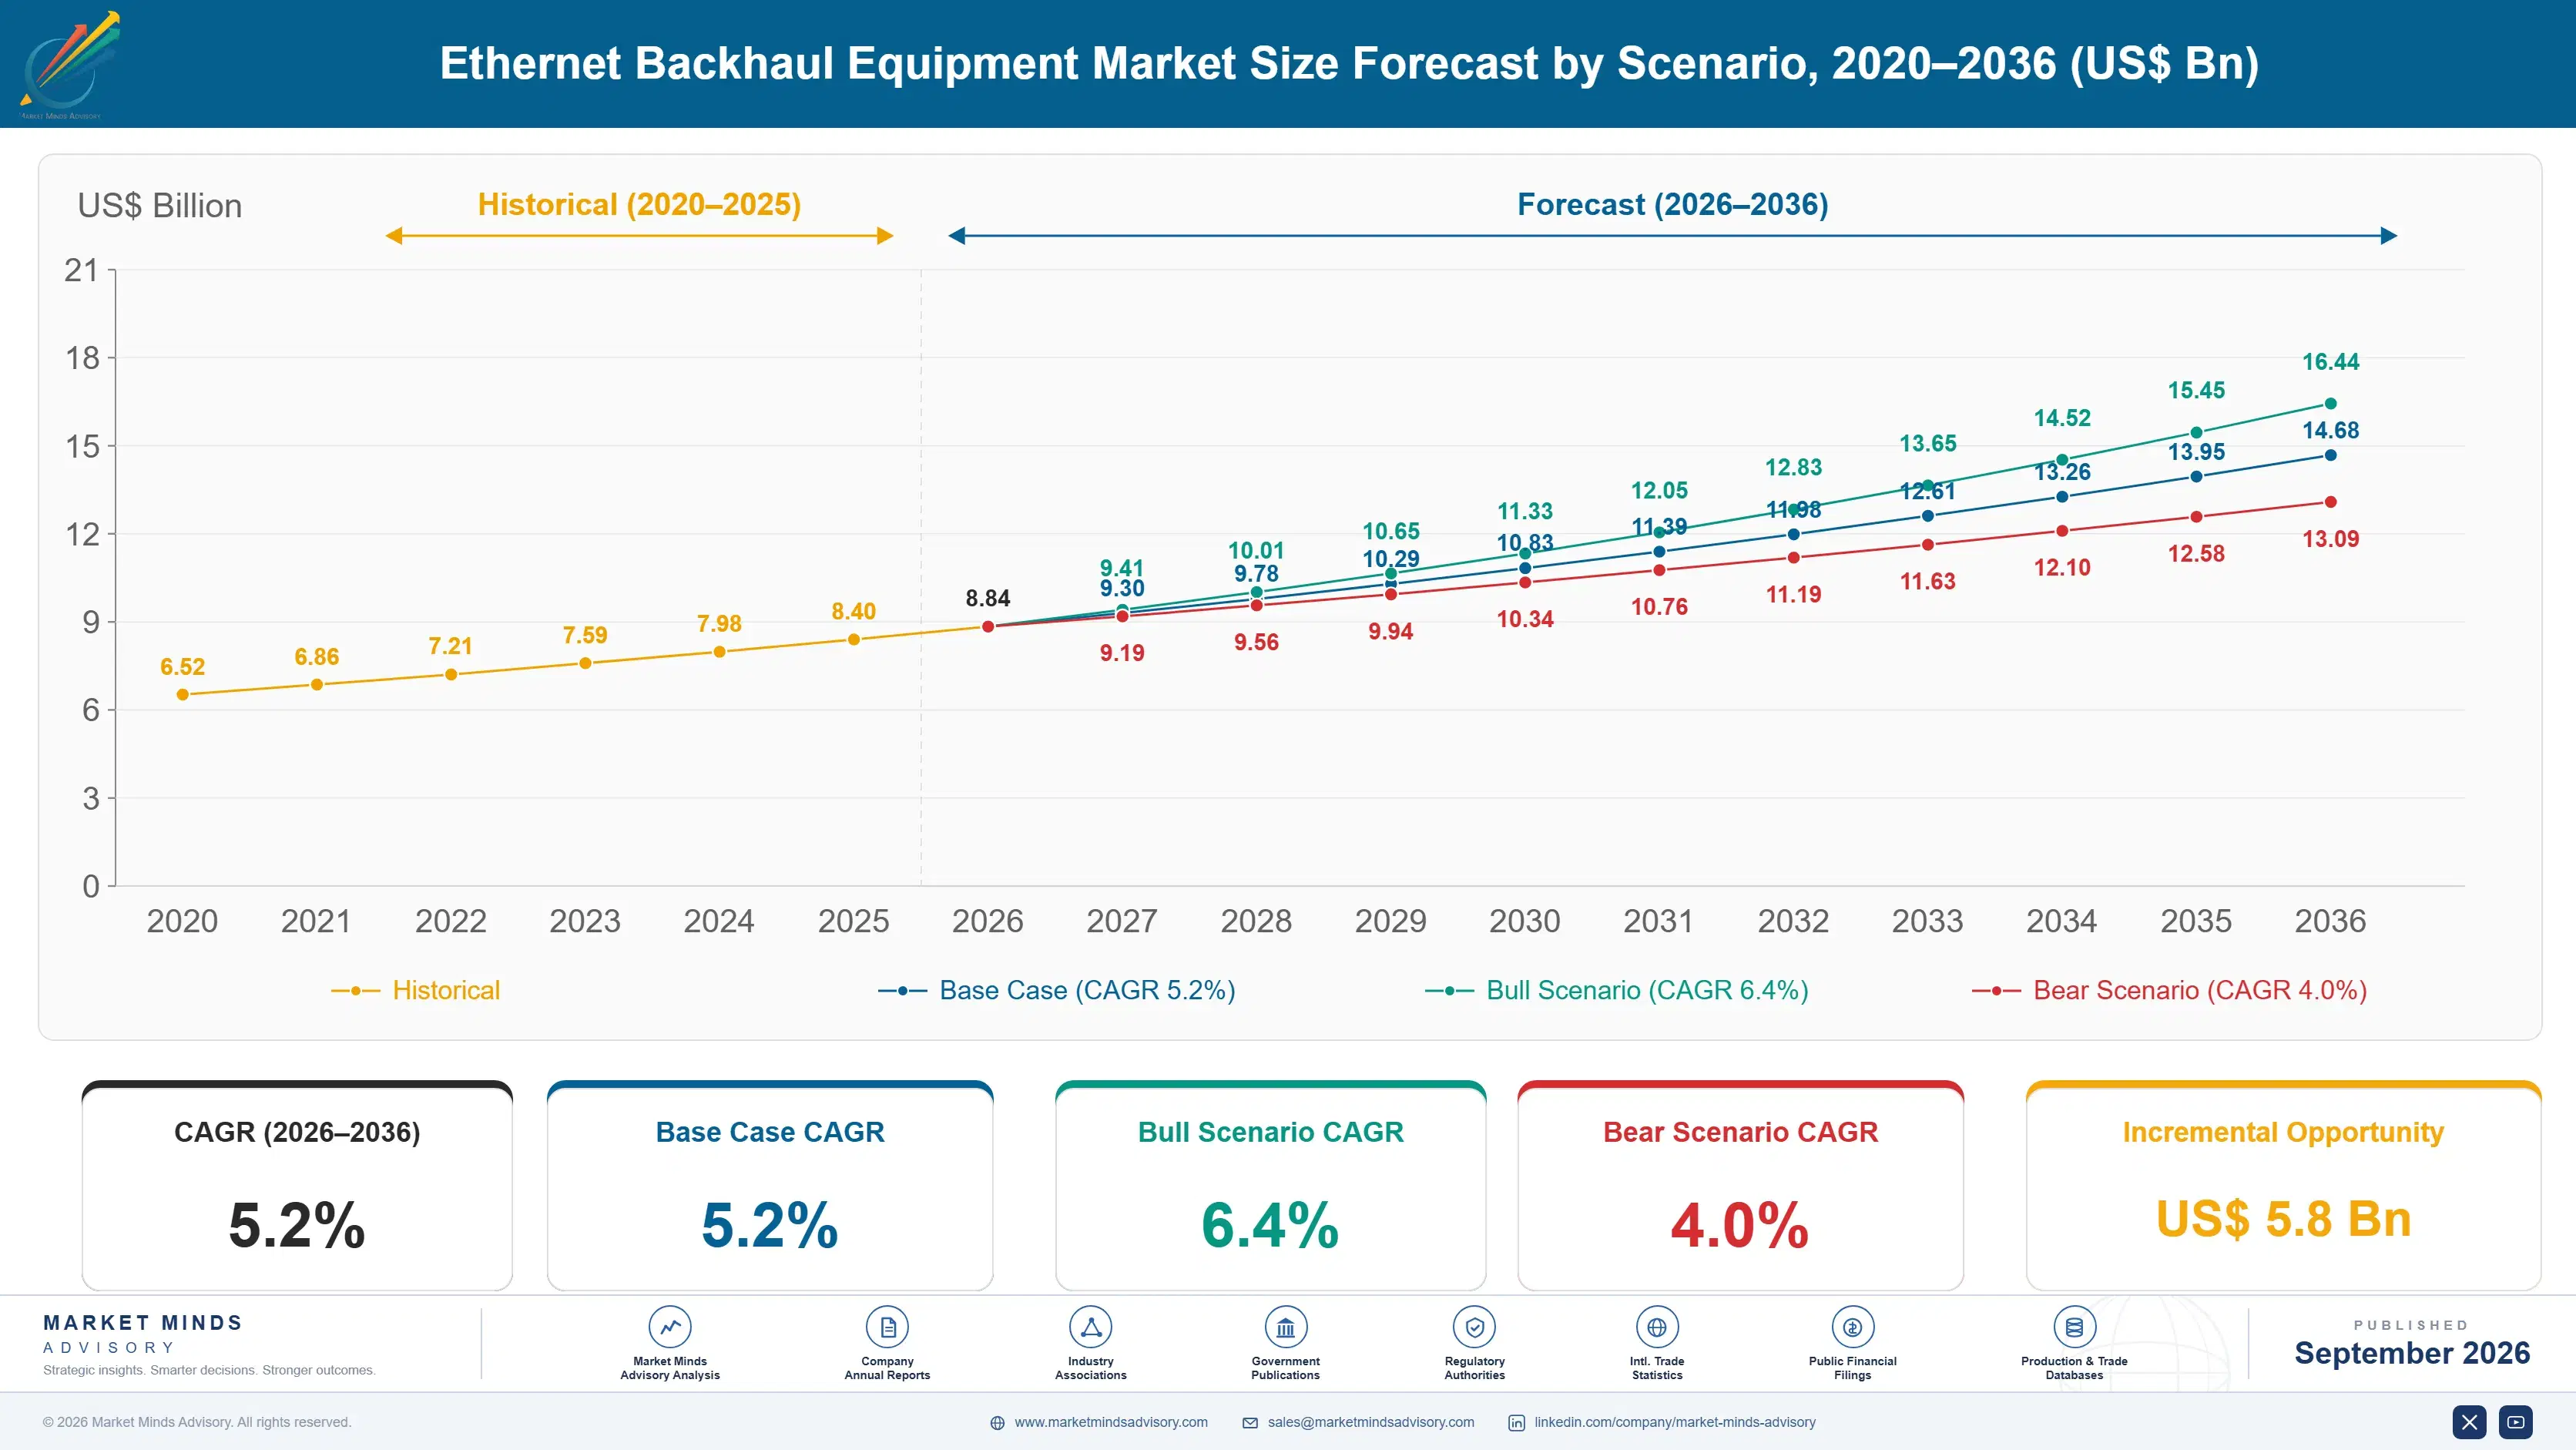
Growth ran at 4.2% from 2020 to 2025 and the shape was a wave rather than a trend. Fifth generation deployment pulled transport spending forward sharply through 2021 and 2022, particularly in China, Korea and India, and then fell away as those build programmes completed. Operators entered 2024 and 2025 reducing capital spending against flat service revenue, and transport was cut alongside everything else.
The base case at 5.2% rests on three mechanisms rather than on any new deployment wave. Fronthaul between radios and baseband processing requires optical capacity that microwave cannot supply, which is expanding regardless of overall capex direction. Time division duplex operation demands synchronisation accuracy near 1.5 microseconds, and legacy timing distribution cannot deliver it. Third, transport platforms increasingly carry enterprise, fixed wireless and data centre traffic alongside mobile, broadening the demand base.
The bull case at 6.4% assumes operator consolidation releases capital for network modernisation rather than debt reduction, which is what regulators have generally not allowed. The bear case at 4.0% is that capital intensity keeps falling toward 14% of service revenue and transport takes a proportional share of a shrinking pool. The second scenario describes the current direction more accurately than the first.

Half the Sites Still Run on Radio

Every generation of mobile technology has been accompanied by a confident forecast that fibre would reach the cell site, and roughly 48% of sites worldwide are still fed by microwave radio. The reason is unchanged: trenching costs what it costs, permits take what they take, and neither responds to a new air interface. Microwave has improved enormously in capacity and remains the correct answer in many places.
TOP FIVE CONCENTRATION66%Concentrated among a few full-portfolio network equipment vendors
MICROWAVE BACKHAULED SITES48%Share of cell sites still served without any fibre
TIMING ACCURACY REQUIREMENT1.5 microsecondsSynchronisation tolerance required for time division duplex operation
OPERATOR CAPEX INTENSITY16%Network investment measured against total operator service revenue
EQUIPMENT REPLACEMENT CYCLE8 yearsInterval before transport hardware is refreshed at a site
SITE TRANSPORT EQUIPMENT COSTUSD 4,200Equipment outlay per cell site across mixed transport types
What has genuinely changed is timing. Time division duplex operation, which nearly all new spectrum uses, requires cell sites to be synchronised to within about 1.5 microseconds of each other, and older methods of distributing time cannot achieve that reliably. Operators discovered this during deployment rather than during planning, and timing equipment has become a distinct purchase with its own specification rather than a feature inside a router.
The commercial backdrop is unhelpful. Operator capital intensity sits near 16% of service revenue and has been drifting down for years against flat revenue, so transport competes for a shrinking pool alongside radio and core spending. Vendors that cannot grow the market have consolidated instead. Equipment refreshes at around eight year intervals, which sets the rhythm of what demand exists.
"The most valuable thing in a modern backhaul router is the clock, and almost nobody sells it that way. Operators are still comparing throughput numbers on equipment where throughput has not been the constraint for years, and the vendors are happy to let them."
Director, Mobile Network Infrastructure Practice · MMA Technology Practice · September 2026

Market Trends

Synchronisation Becomes a Purchase Rather Than a Feature

Time division duplex operation requires cell sites to hold time within roughly 1.5 microseconds of each other, and interference between neighbouring sites appears immediately when they drift. Operators that assumed satellite timing at each site would suffice found jamming, spoofing and urban signal blockage produced failures that were difficult to diagnose. Timing and synchronisation equipment now carries its own specification, its own test regime and increasingly its own vendor selection, growing at 7.0%. Vendors treating the clock as an embedded router function are being evaluated against specialists who treat it as the product.
Market Impact: Fastest layer at 7.8% growth
Transport Platforms Carry Traffic Beyond Mobile Networks

The same routers and optical equipment that carry mobile backhaul increasingly carry enterprise connectivity, fixed wireless access, data centre interconnect and private network traffic, because operators cannot justify parallel infrastructure for each. That broadens the demand base beyond mobile capital spending, which has been the constraint on this market for a decade. It also changes the buyer, since transport decisions now involve wholesale and enterprise business units rather than only mobile network planning. Vendors positioned purely as mobile transport suppliers are missing the part of the demand that is actually growing.
Market Impact: India grows at 9.8% annually

Market Opportunities and Growth Drivers

Fronthaul Capacity Requirements Rule Out Microwave Entirely

Splitting radio processing between a site antenna and centralised baseband creates a fronthaul link carrying far more traffic than backhaul does, at latency tolerances measured in tens of microseconds. Microwave cannot serve it, which makes fibre or dedicated optical transport the only option wherever centralised processing is deployed. Optical transport for fronthaul and backhaul accordingly grows at 7.8%, faster than any other layer here. The requirement is architectural rather than a matter of operator preference, which makes the demand considerably more predictable than general capacity growth. Radio architecture decisions made years earlier set this demand.
Market Impact: Capex intensity near 16%

Dense Site Deployment Across Asia Sustains Volume Demand

China, India, Japan and Korea between them operate more cell sites than the rest of the world combined, and site counts rather than subscriber numbers determine how much transport equipment is required. Indian network expansion has continued at a pace no mature market matches, making it the fastest-growing country market at 9.8%. Densification for capacity in urban areas adds sites that each need transport regardless of whether total traffic grows. Vendors with delivery and support capability across these markets capture volume that mature market operators are no longer generating. Site counts rather than traffic set the requirement.
Market Impact: Leaves 48% on radio links

Market Restraints and Challenges

Operator Capital Intensity Keeps Falling Against Flat Revenue

Network capital spending sits near 16% of service revenue and has been drifting downward for years while service revenue has barely grown, which means the pool this market draws from is shrinking in real terms. The root cause is that operators cannot monetise capacity increases, so every additional gigabit is delivered against flat average revenue per user. Transport competes inside that pool against radio and core spending with stronger internal advocates. Vendors mitigate by targeting enterprise, wholesale and data centre budgets that sit outside mobile network capital plans entirely. Those budgets sit outside the mobile network capital plan.
Market Impact: Requires 1.5 microsecond accuracy

Fibre Reaches Sites Only Where Civil Works Already Exist

Roughly 48% of cell sites remain on microwave because trenching cost and permitting time have not improved, and neither responds to anything equipment vendors do. The root cause is civil engineering and municipal process rather than transport technology. Commercially this caps optical transport growth in exactly the markets where site counts are highest and civil costs are worst. Vendors mitigate by improving microwave capacity toward multi-gigabit performance and by supporting hybrid designs where radio carries the site and fibre carries aggregation. Multi-gigabit radio now serves capacity that once demanded fibre connections, which changes the calculation at many sites.
Market Impact: Serves 4 distinct traffic types
3 additional market trends, 4 additional growth drivers, and 2 additional restraints and challenges are covered in the full report. Contact sales@marketmindsadvisory.com to access the complete intelligence.

Segment CAGR and Growth Architecture

Segmentation follows the transport layer, because each layer is constrained by something different: microwave by spectrum and civil economics, optical by fibre availability, and timing by physics that no other layer addresses. Growth divergence between them is wide enough that aggregate market figures describe none of the individual equipment businesses accurately. Aggregates describe none of them.
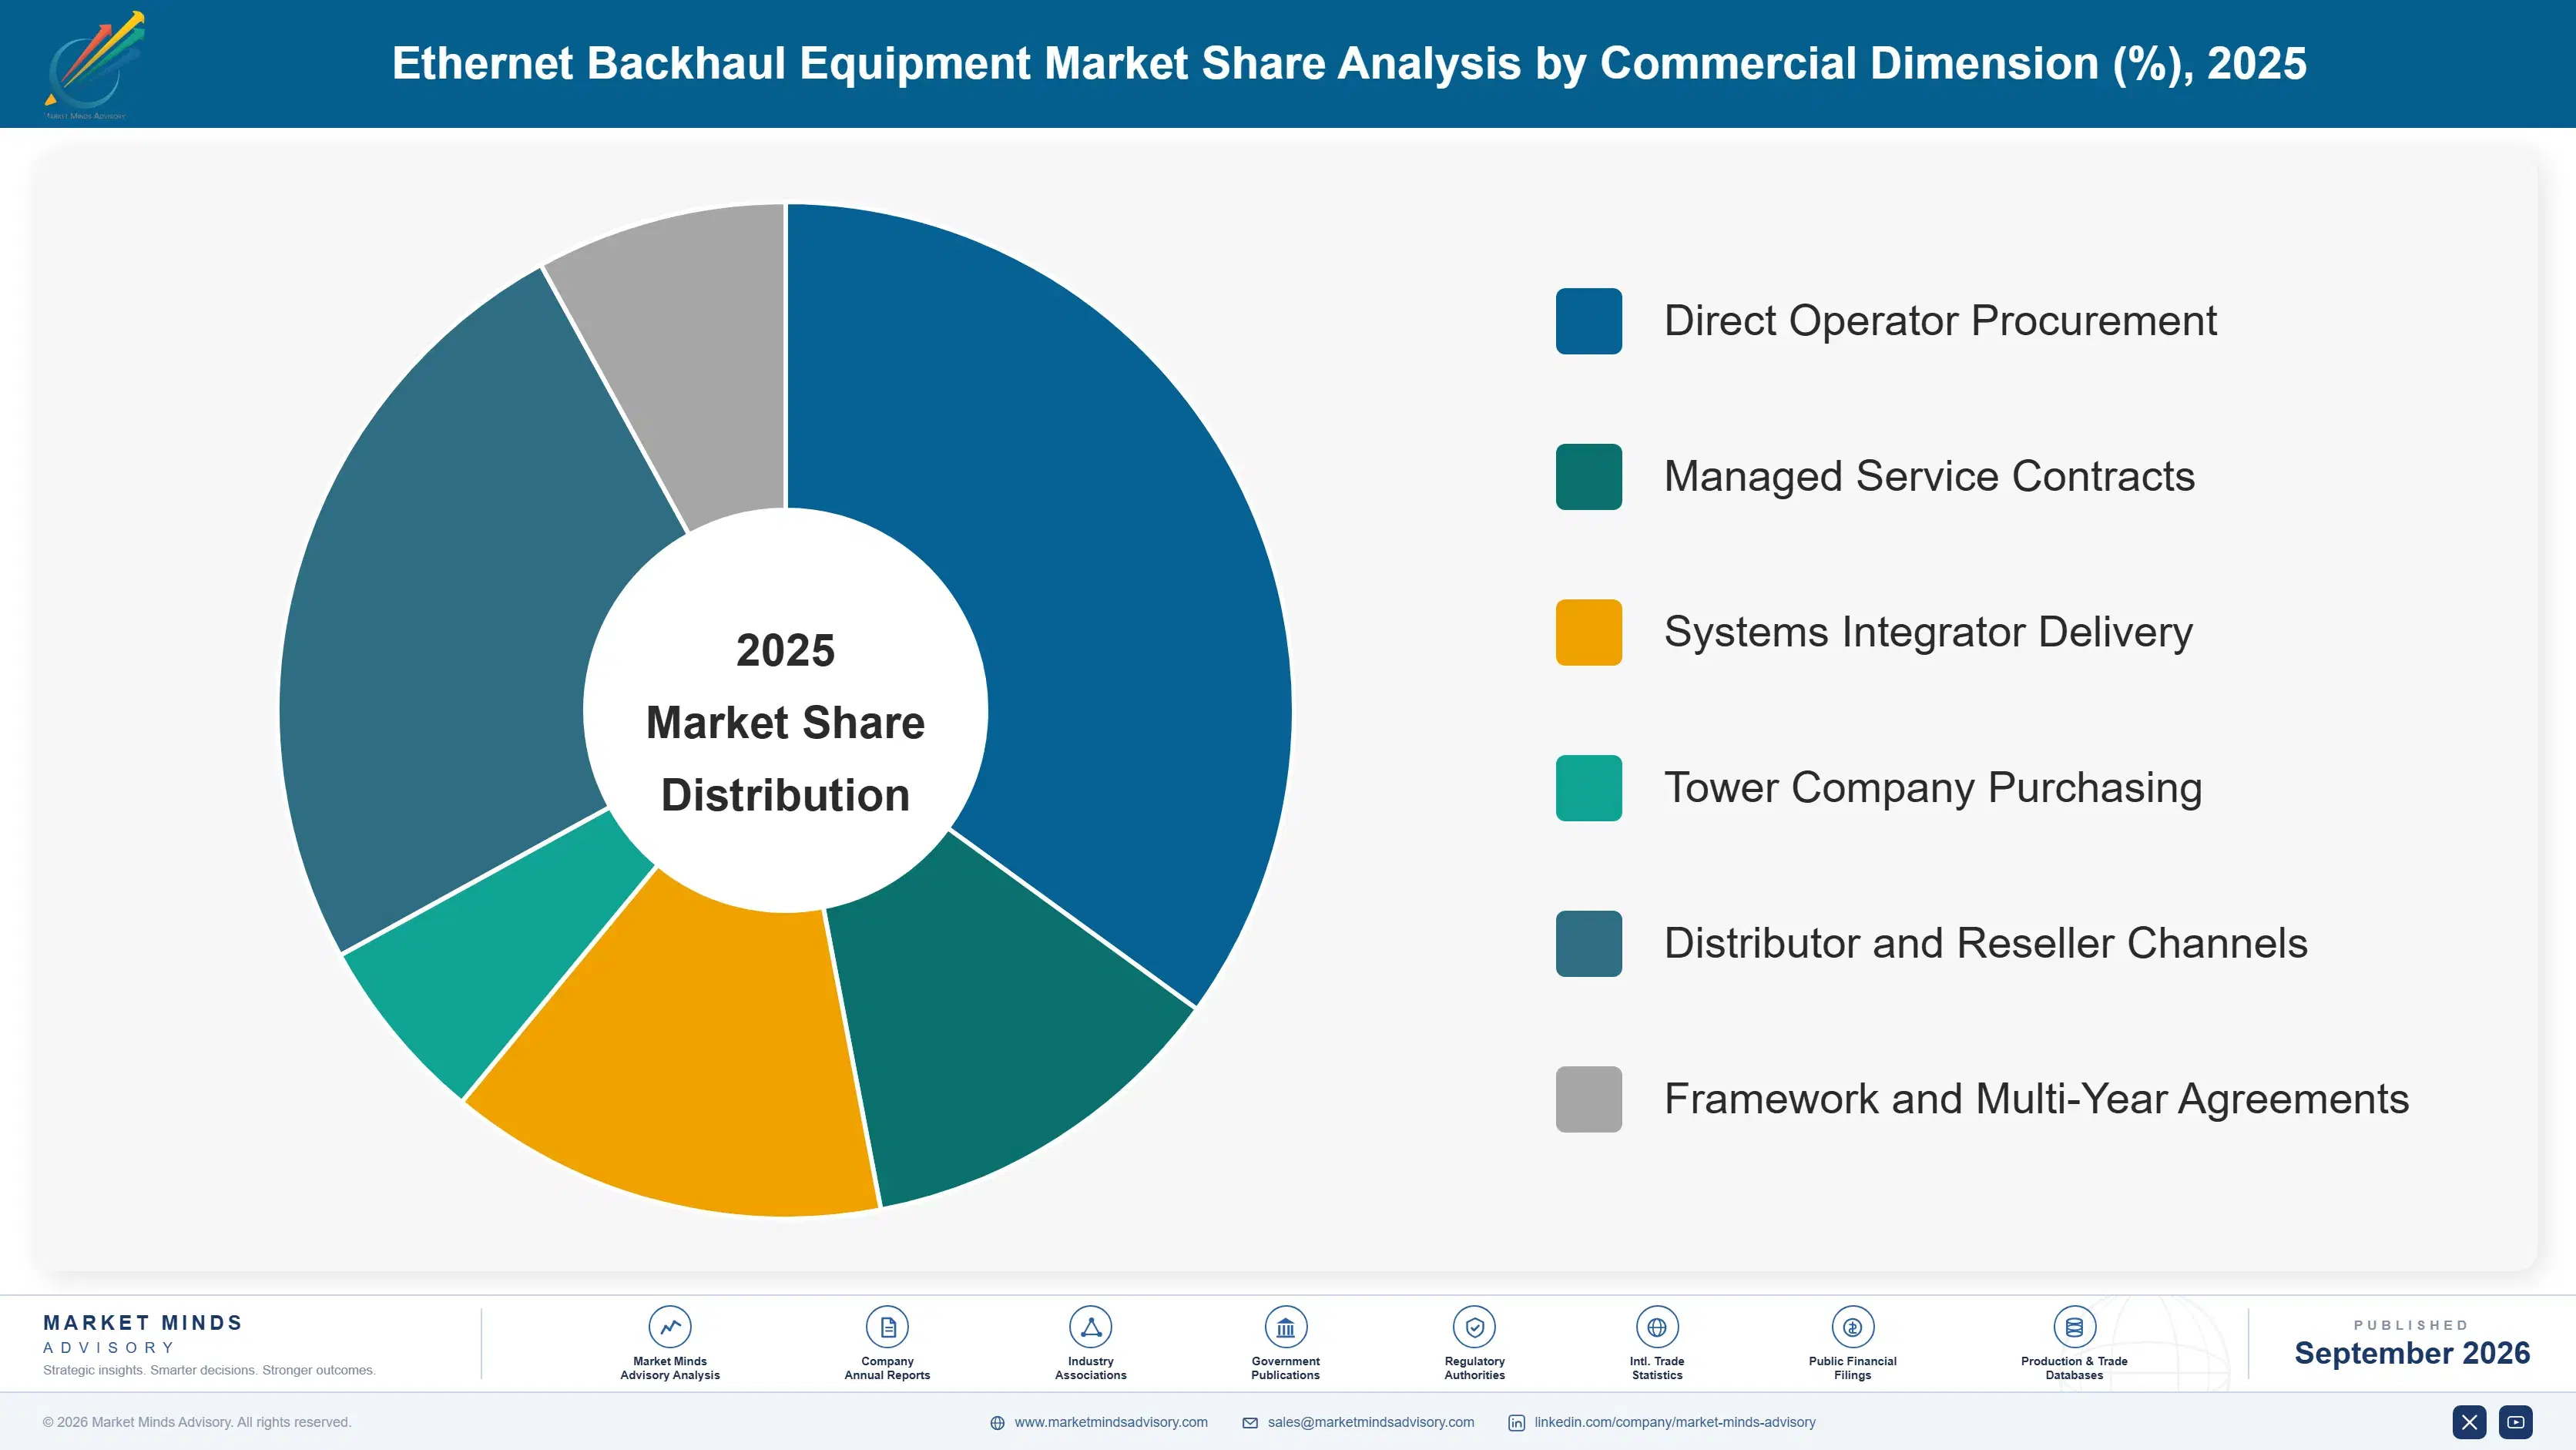
ethernet-backhaul-equipment-market-market-share-analysis-1788421747810

Optical Transport for Mobile Fronthaul and Backhaul

Optical transport is the fastest layer at 7.8%, half again the market rate of 5.2%, and it grows on architecture rather than on traffic. Splitting radio processing between the antenna site and centralised baseband creates fronthaul links carrying far more capacity than backhaul at latency tolerances microwave cannot approach, so wherever centralised processing is deployed the transport must be optical. Demand therefore follows radio architecture decisions made years earlier rather than any capacity forecast. The segment also benefits from carrying enterprise and data centre interconnect traffic on the same platforms, which is where operators are finding revenue that mobile services no longer provide. Component supply from adjacent industries affects this layer more than any other.
CAGR 7.8%

Timing and Synchronisation Equipment

Timing has become a distinct purchase because time division duplex operation requires cell sites synchronised within roughly 1.5 microseconds, and drift produces interference between neighbouring sites rather than degradation at one. Operators that relied on satellite timing at each site discovered jamming, spoofing and urban blockage caused failures that were genuinely hard to diagnose, and regulators in several regions have since raised resilience expectations. Growth at 7.0% reflects terrestrial time distribution being built across transport networks with boundary clocks and holdover at aggregation points. Specialist timing vendors compete credibly here against full-portfolio suppliers, which is unusual in this market. Boundary clocks and holdover capability at aggregation points are what operators are actually specifying now.
CAGR 7.0%
Full segment breakdown across 6 segments available in the complete report.

Regional Architecture and Country Demand Map

Demand follows cell site counts rather than subscriber numbers or economic size, because transport equipment is required per site regardless of how much traffic that site carries. Dense deployment and continuing network expansion therefore matter far more than market maturity. Traffic volumes matter surprisingly little.

East Asia

East Asia holds 36%, above the regional band, and the justification is site density: Chinese operators deployed more radio sites than the rest of the world combined and each one requires transport regardless of the traffic it carries. Domestic vendors serve most of that demand, which shapes the competitive picture more than technology preference does. Japanese and Korean networks are among the densest anywhere and specify timing and fronthaul capability at demanding tolerances. Regional growth at 6.2% now comes from densification, transport modernisation and enterprise traffic rather than from any remaining coverage build programme. Regional growth at 6.2% sits ahead of the market on a very large base indeed. Vendor competition here is largely domestic.
Share: 36% | CAGR: 6.2% (2026 to 2036)

North America

North America holds 18%, below the regional band, on cell site counts that are modest relative to geography because coverage is achieved with fewer, larger sites than dense urban markets require. Operators here run the highest capital spending per site anywhere and specify capability well ahead of average, particularly in timing resilience following documented interference incidents. Fixed wireless access has become a genuine revenue line, which places enterprise and residential traffic onto the same transport platforms as mobile. Consolidation among operators has reduced the number of purchasing decisions substantially over the past decade. Regional growth at 4.4% therefore reflects capability purchases rather than any site count expansion, which keeps average values high and volumes modest.
Share: 18% | CAGR: 4.4% (2026 to 2036)
Regional intelligence for 5 additional markets available in the complete report: Western Europe, South Asia and Pacific, Latin America, Middle East and Africa, Eastern Europe. Contact sales@marketmindsadvisory.com.
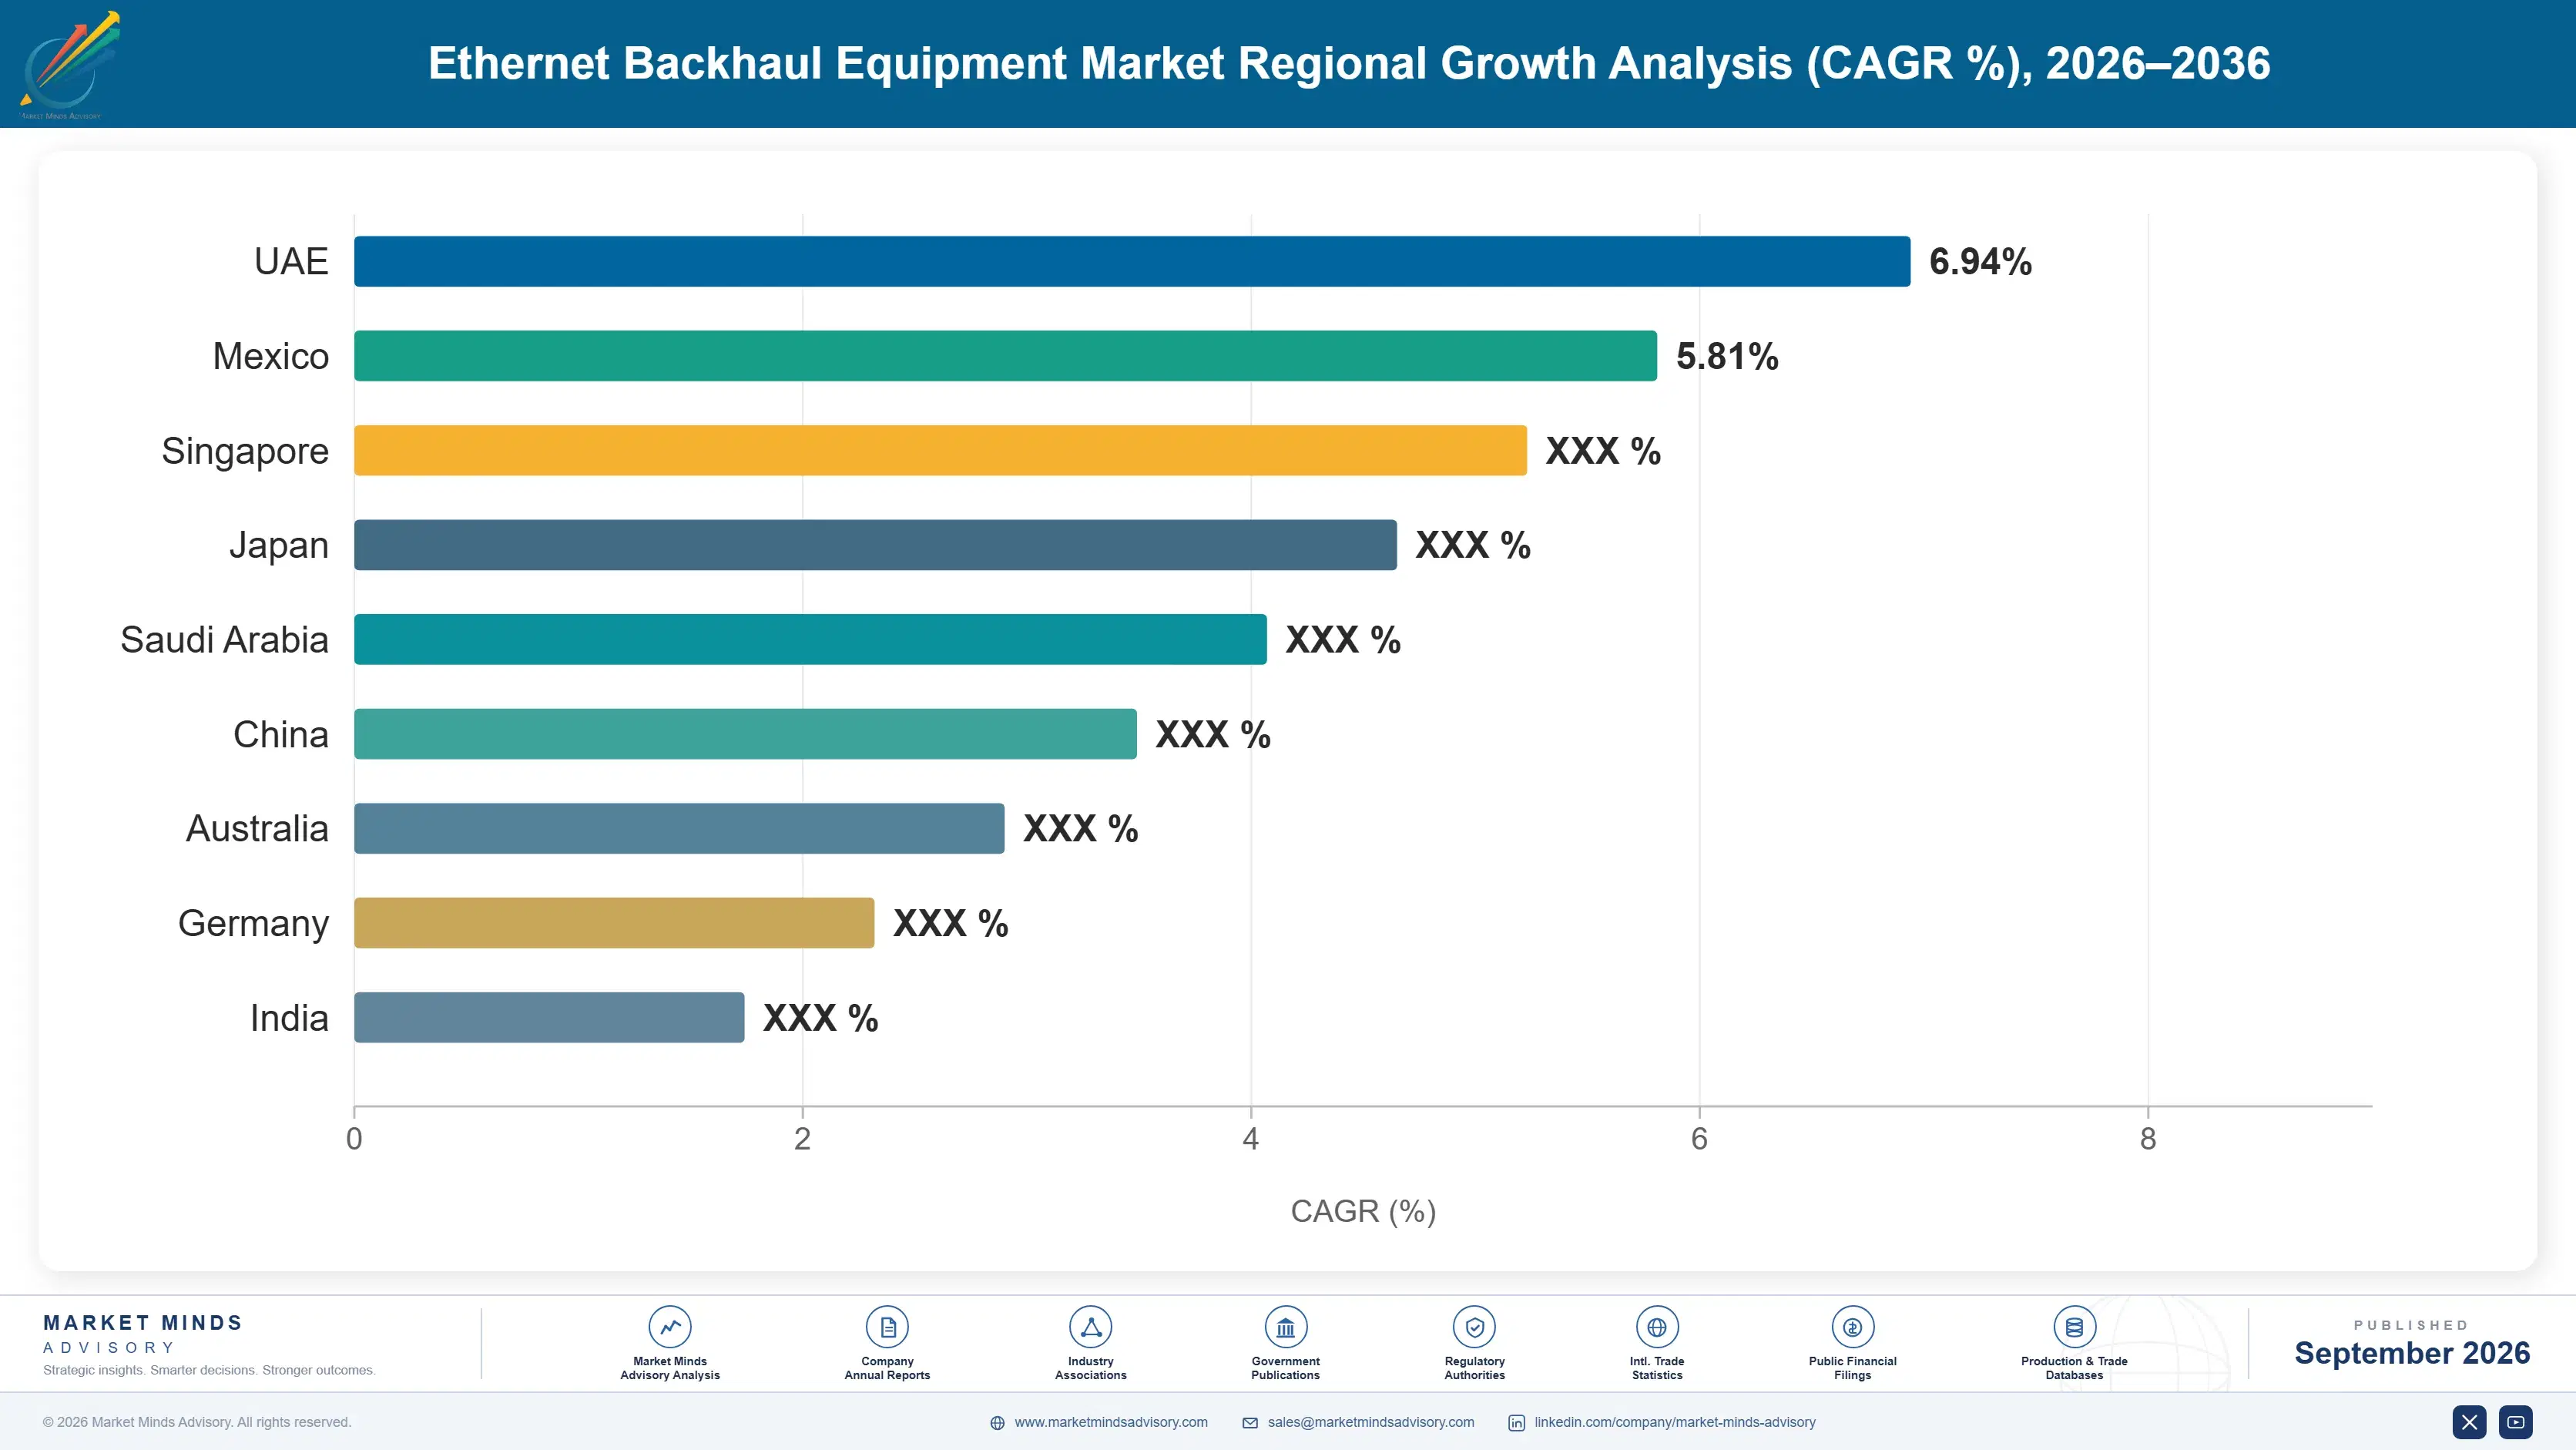
ethernet-backhaul-equipment-market-country-cagr-analysis-1788421748374

Where Transport Vendors Can Still Grow

Mobile capital spending is not going to expand, so growth has to come from selling capability operators cannot avoid buying, from budgets outside the mobile network plan, and from the microwave installed base that fibre has failed to displace for a decade and shows no sign of displacing now. Nothing else in this market is growing.

Sell the Clock as a Product Not a Feature

Time division duplex operation requires synchronisation within roughly 1.5 microseconds and satellite timing at each site has proved unreliable, which makes terrestrial time distribution a network design problem rather than a router setting. Vendors selling timing with its own specification, test evidence and resilience story win against full-portfolio competitors who bury the clock in a datasheet, and command roughly 3 times the attach value of embedded timing. Operators are procuring it separately now. Specialists have proved this repeatedly against much larger competitors. Operators now procure timing as a separate line item.
Market Impact: Commands 3 times the embedded timing attach value

Reach Budgets Outside the Mobile Capital Plan

Mobile capital intensity near 16% of service revenue is falling, and transport competes inside that pool against radio and core spending with stronger internal advocates. Enterprise connectivity, wholesale, fixed wireless access and data centre interconnect all ride the same platforms and are funded from budgets that mobile network planning does not control. Vendors selling into those units achieve roughly 2 times the growth rate available from mobile capital plans alone. It requires a different account team, since the buyer sits in a business unit most transport sales organisations never call.
Market Impact: Delivers 2 times the mobile capex growth rate

Invest in Microwave Capacity Rather Than Abandoning It

Around 48% of cell sites remain on radio backhaul because trenching cost and permitting have not improved in a decade and will not improve because of anything a vendor builds. Multi-gigabit microwave and millimetre wave links now serve capacity that once demanded fibre, and vendors that kept investing hold a position competitors abandoned on a forecast that never materialised. Volume concentrates in exactly the high site count markets where growth remains. Writing microwave off has been a recurring and expensive strategic error across this industry. The forecast that killed it never actually arrived.
Market Impact: Still serves 48% of all global cell sites

Sell Transport Software Where Hardware Cannot Differentiate

Routing hardware has converged to the point where operators compare throughput figures that stopped constraining anything years ago. Segment routing, network slicing and assurance software determine whether a transport network can support differentiated enterprise services, and they carry gross margins roughly 26 percentage points above hardware. Operators buy them because enterprise revenue depends on them rather than because the network needs them. Vendors leading with hardware specifications are competing in the layer that has least remaining room to differentiate. Enterprise revenue depends on it rather than network capacity. That argument sells where a datasheet cannot.
Market Impact: Holds 26 further points of gross margin overall

Who Controls the Margin Pool

Concentration sits near 66% across the top five on measured equipment shipment revenue, and it has been rising through consolidation rather than through anybody winning. A market whose capital pool is not growing produces mergers rather than share shifts, and recent years delivered exactly that. The gap between leaders and challengers is one of portfolio breadth and operator relationship depth rather than product, since specialists frequently hold better microwave and timing capability.
Competition runs on three dimensions. Portfolio breadth is first, since operators buy transport alongside radio and prefer fewer suppliers. Second is timing and synchronisation credibility, which has become a distinct evaluation with its own test regime. Third is supply origin and security qualification, which in several markets determines who may bid at all before any technical comparison begins.

Two pressures are reshaping the field. Security-driven restrictions on equipment origin have redistributed substantial share in Europe and elsewhere without expanding the market, and the replacement programmes consumed capital that would otherwise have funded capability. Meanwhile specialist timing and microwave vendors are winning evaluations against far larger competitors on depth. Rankings will move toward vendors with credible timing positions and access to enterprise budgets rather than the broadest catalogue.
ethernet-backhaul-equipment-market-company-positioning-matrix-1788421748895

Competitive Moat and Risk Dimensions

ERICSSON

Moat: Radio and transport portfolio integration

Ericsson sells transport alongside radio access into operators who increasingly prefer fewer suppliers, which places its equipment inside decisions that specialists never reach. Its microwave portfolio is among the strongest anywhere, which matters in markets where roughly half of sites remain on radio backhaul. Operator relationships and managed service contracts give visibility into network plans ahead of procurement.
ERICSSON

Risk: Mobile capital spending dependence

Revenue is tied closely to operator mobile capital budgets that have been falling in real terms against flat service revenue for several years. Enterprise, wholesale and data centre budgets are where demand is expanding, and reaching them means selling to units the account structure is not built around. Specialist timing vendors also win evaluations that portfolio breadth no longer wins.
CIENA

Moat: Optical transport technology depth

Ciena holds genuine optical technology leadership in coherent transmission, which matters most in exactly the layer growing fastest as fronthaul and data centre interconnect requirements expand. Its position spans operator, enterprise and internet content provider customers, which spreads exposure across capital cycles that do not move together. Optical expertise is difficult to replicate and the customer relationships are long-lived.
CIENA

Risk: Narrow position in radio access

The company does not sell radio access, which excludes it from bundled decisions where operators procure transport alongside base stations from a single supplier. That leaves it competing on optical merit in evaluations sometimes decided before technical comparison. Its microwave presence is minimal, which removes it from the 48% of sites still backhauled by radio links entirely.

Players Tracked

Prominent Players

Huawei
Ericsson
Nokia
Cisco
Ciena

Other Key Players

ZTE
HPE Juniper Networking
Ceragon Networks
Aviat Networks
SIAE Microelettronica
NEC
Fujitsu
Adtran
Ribbon Communications
RAD
Samsung Electronics
Cambium Networks
Microchip Technology
Oscilloquartz
Ubiquiti

Recent Developments

JULY 2025

Regulators raise timing resilience expectations after interference incidents

Telecommunications regulators in several jurisdictions issued expectations on network timing resilience following documented satellite signal interference affecting mobile operations. The guidance addressed terrestrial time distribution and holdover capability rather than mandating specific equipment or vendor selections. Operators were expected to demonstrate their arrangements at the next review.
Signal: Timing has moved from an engineering assumption to a resilience requirement that regulators now examine directly.
MARCH 2025

Operators extend transport platforms to carry enterprise and data centre traffic

Several large operators consolidated enterprise connectivity, fixed wireless access and data centre interconnect onto transport networks previously dedicated to mobile backhaul. The consolidation used existing platform capability rather than requiring new procurement, and it was driven by asset utilisation rather than technology. Asset utilisation improved noticeably.
Signal: Transport demand is decoupling from mobile capital plans, which is the only growth mechanism this market currently has.
NOVEMBER 2025

Multi-gigabit microwave links reach capacity previously requiring fibre

Microwave and millimetre wave products from several vendors reached sustained capacities that had previously required fibre connections, extending the range of sites where radio backhaul remains economically preferable. The advances were organic product development rather than the result of any acquisition. Spectrum availability remains the limit.
Signal: Microwave keeps outliving the forecasts that write it off, because the civil economics behind it never actually change.

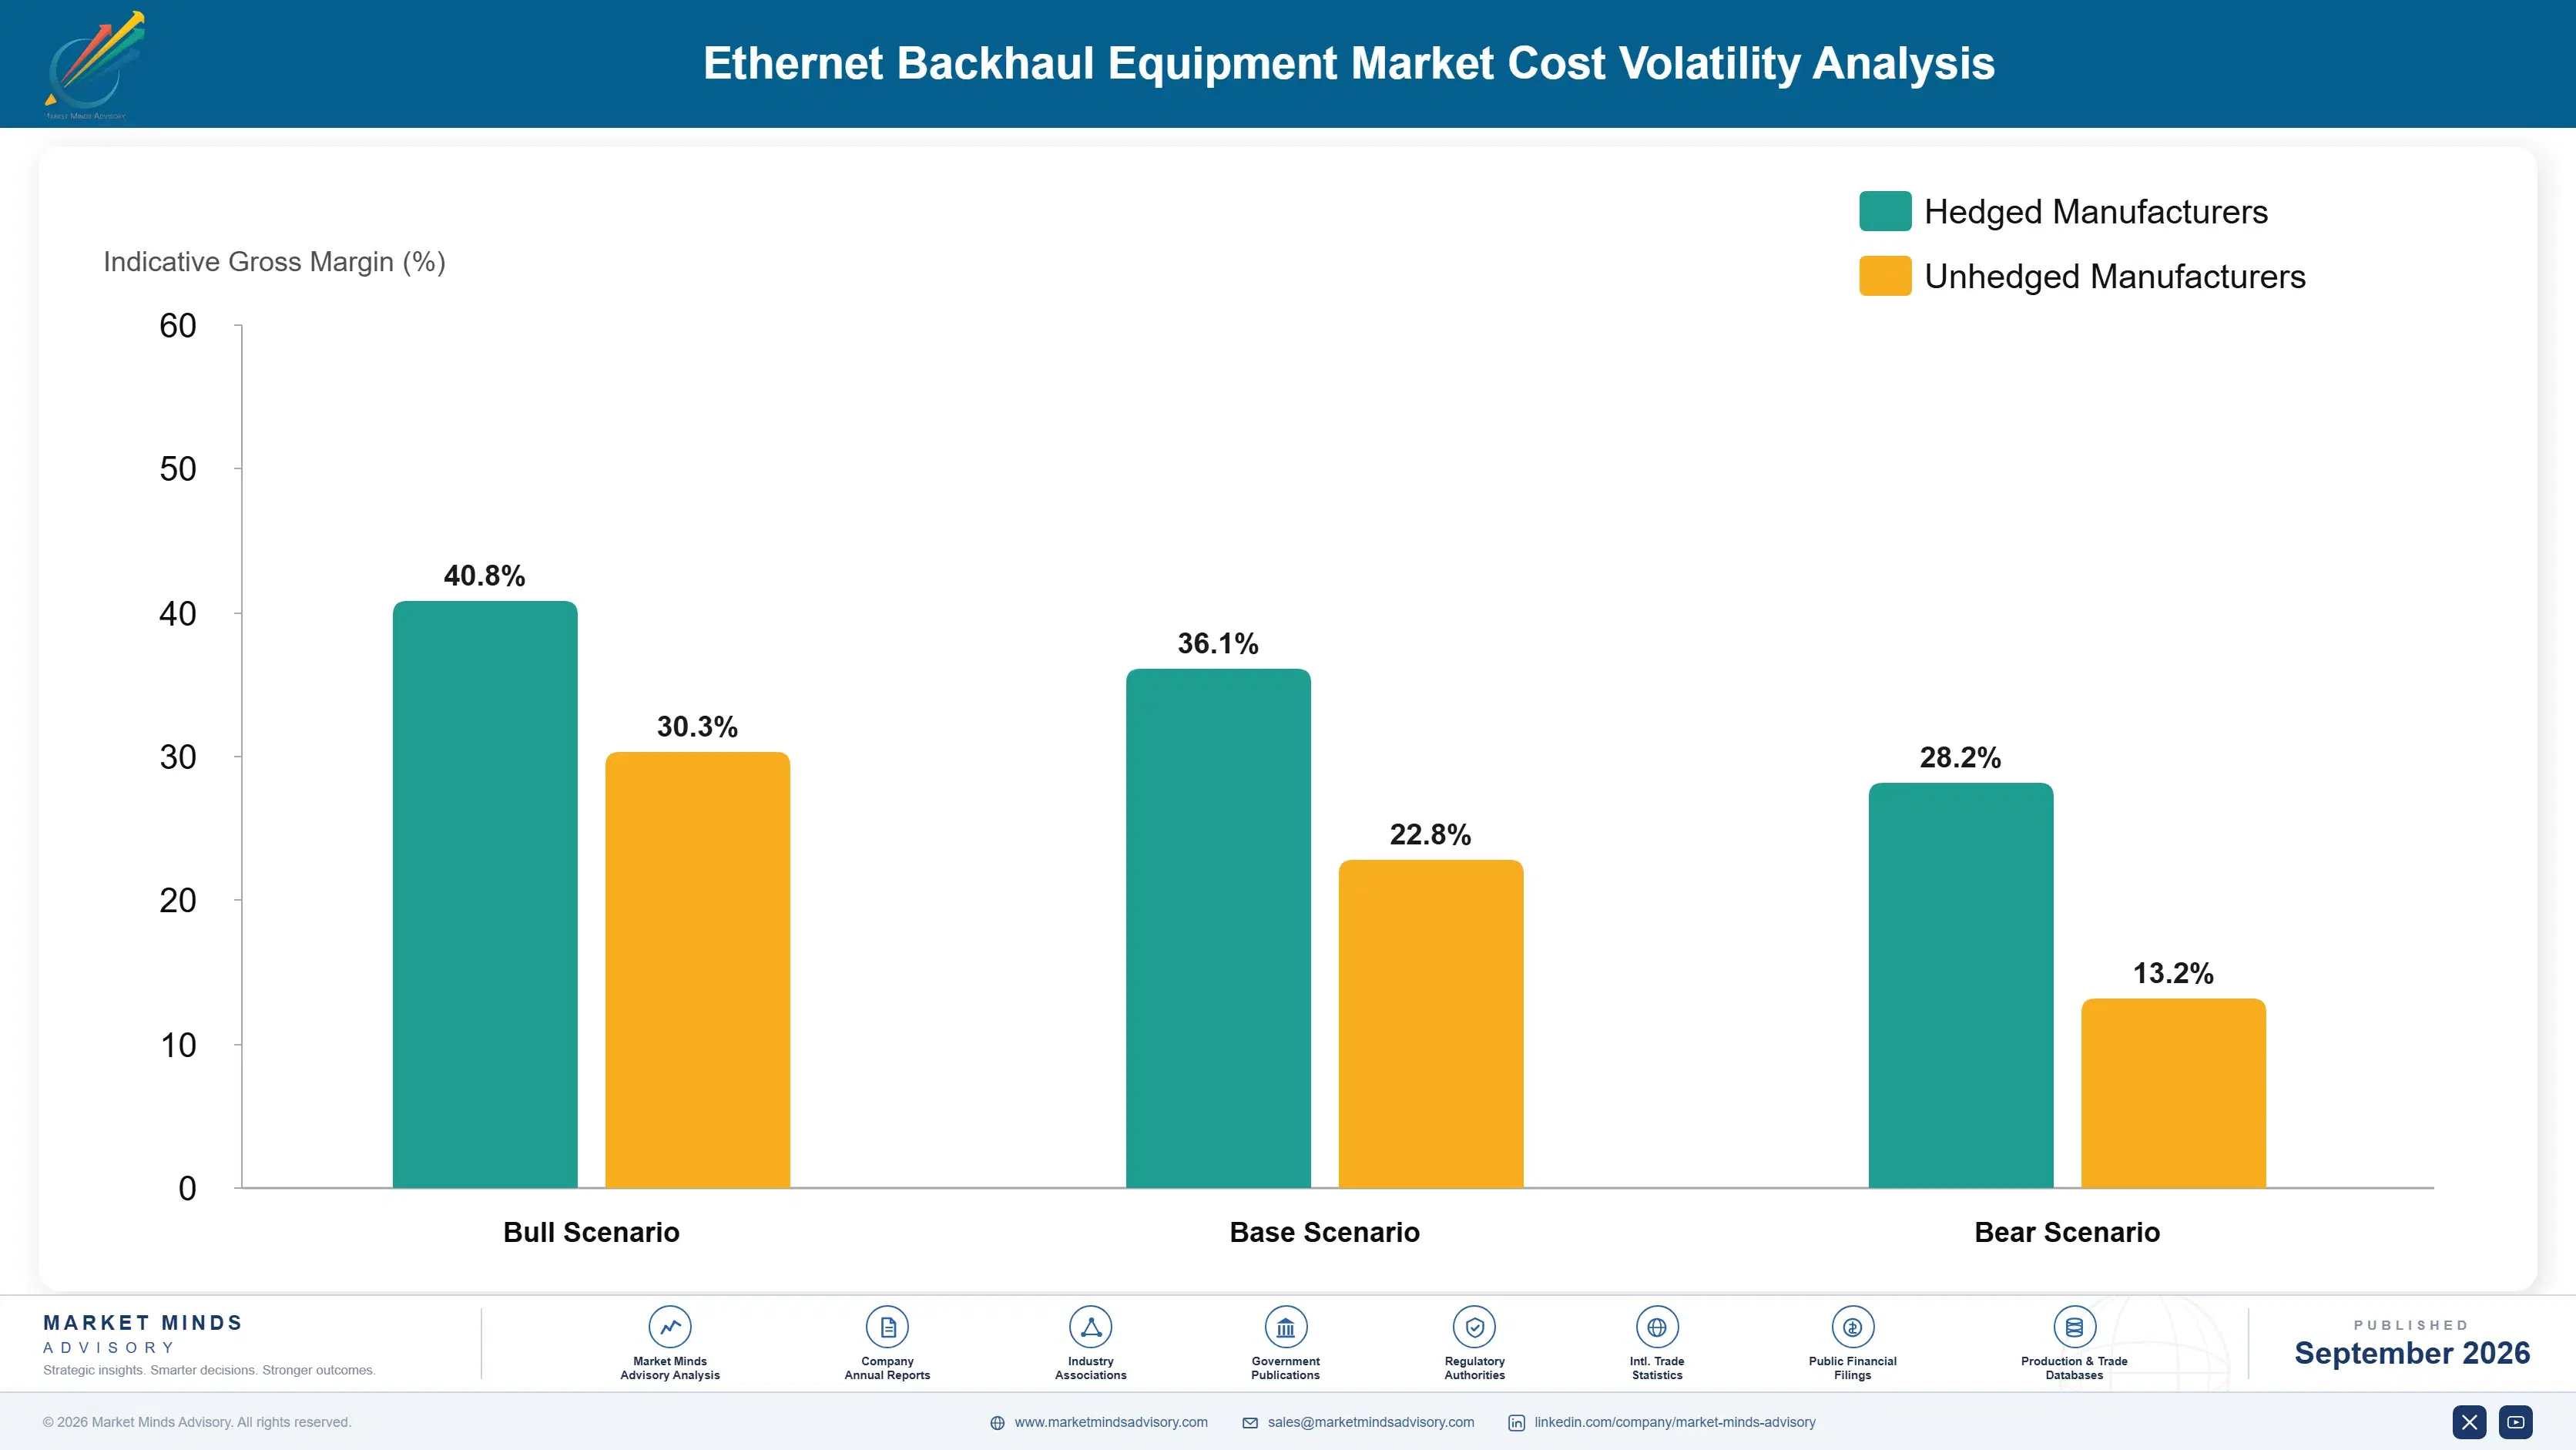
What Transport Equipment Costs to Build

Silicon and optics dominate the bill of materials. Switching and network processor silicon runs between 24% and 33% of cost of goods depending on whether the vendor designs its own or buys merchant devices. Optical modules add roughly 26% in optical products, radio frequency components 18% in microwave equipment, and enclosure, power and assembly the balance. Product mix changes cost structure more than volume does.
Optical component supply has been the sharpest pressure and it came from outside this industry. Data centre demand for high-speed optical modules absorbed manufacturing capacity through 2024 and 2025, and telecom transport vendors competing for the same parts faced extended lead times and higher prices. Ciena and Nokia both referenced component supply and cost conditions in recent annual reporting. Microwave product lines were largely unaffected.

Exposure varies by product mix rather than by scale. Optical-weighted vendors carry the full component pressure while serving the fastest growing layer, an uncomfortable combination when supply is tight. Microwave-weighted vendors avoid it entirely and compete in a slower segment. Those designing their own silicon hold cost advantage at volume and carry development commitments only large shipments justify. Smaller specialists buy at the worst terms available.
ethernet-backhaul-equipment-market-cost-volatility-analysis-1788421749091

Qualify optical modules from more than one supplier

Data centre demand for optical components does not respond to telecom purchasing volumes, which leaves transport vendors as secondary customers during any shortage. Qualifying modules from multiple suppliers at design stage costs additional validation effort and removes the single largest supply exposure in optical products. Vendors that skipped this during comfortable conditions ended up rationing shipments.

Weight product mix toward microwave during optical shortages

Microwave and optical products draw on almost entirely separate component supply chains, which makes mix a genuine lever when one is constrained. Vendors holding credible positions in both can shift emphasis toward whichever is deliverable without losing the customer relationship. It works only for vendors who kept investing in microwave, a decision made years before any shortage.

Design common hardware across timing and transport products

Timing equipment is being evaluated separately from routers, which tempts vendors into a distinct product line with its own development and manufacturing overhead. A common hardware platform carrying different software and clock modules serves both without duplicating cost. It also lets timing be added to installed routers rather than requiring new hardware, which operators prefer.

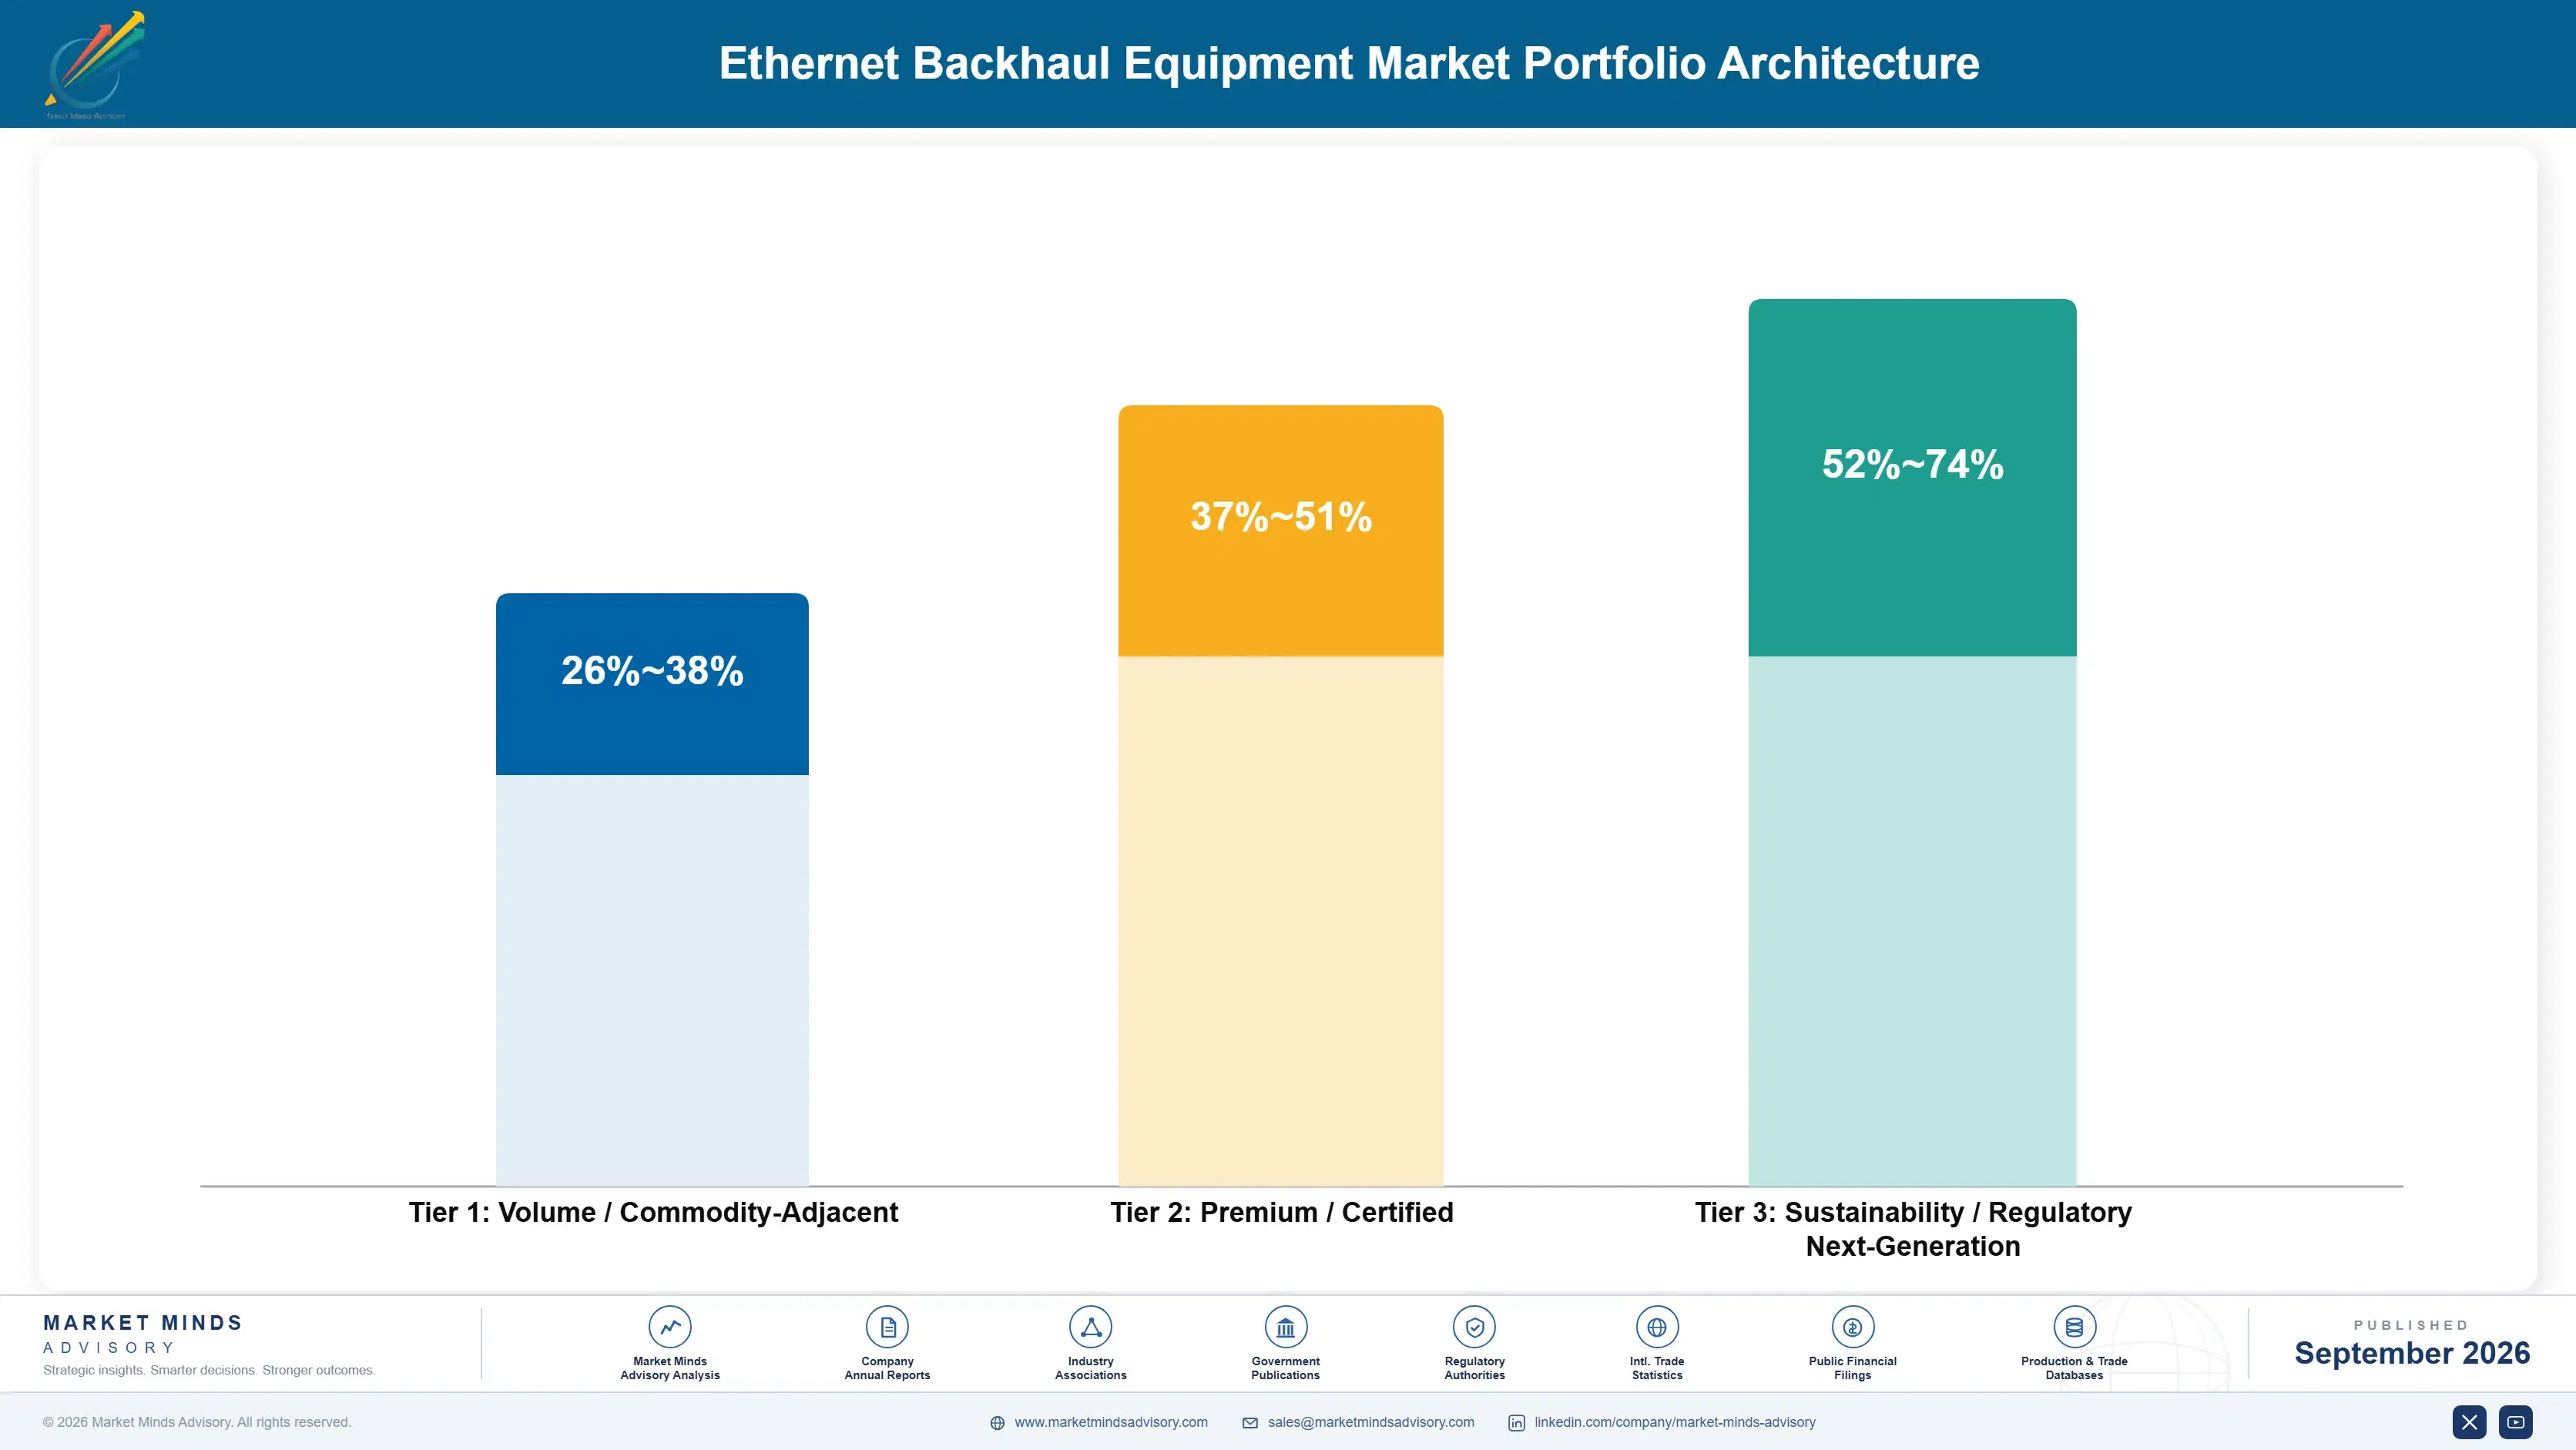
Portfolio Architecture for Margin Defence

Margin architecture separates on how much software and specialist capability accompanies the hardware. Cell site and aggregation routers earn thin margins in a converged product category where operators compare throughput figures that stopped constraining anything years ago. Optical transport earns better on genuine technology differentiation, and timing and transport software better still, because both address requirements operators cannot design around or negotiate away.
The volume tension is between mobile capital plans and everything else. Mobile transport is the largest single demand pool, it fills manufacturing volume, and it is funded from budgets that have been shrinking in real terms for years. Enterprise, wholesale and data centre interconnect budgets are smaller individually, growing, and reached through business units most transport sales organisations do not call. Vendors organised around mobile network accounts are optimised for the part not expanding.

High-value revenue concentrates in timing and synchronisation and in transport software supporting differentiated services. Both share the property that the operator is buying something a competitor's revenue depends upon rather than capacity it could defer. Routing hardware occupies the volume position, provides the installed presence software is sold through, and competes where technical differentiation is essentially exhausted.

Volume / Commodity-Adjacent

Cell site routers, aggregation platforms and standard microwave links sold on throughput and price. The wide range separates vendors designing their own silicon from those integrating merchant devices. Product convergence has removed most of the differentiation buyers are able to evaluate.
Gross Margin: 26-38%

Premium / Certified

Optical transport and high-capacity microwave carrying fronthaul, data centre interconnect and enterprise traffic. Margin holds on genuine technology differentiation in coherent optics and high-capacity radio. Component supply conditions affect this tier more than any other.
Gross Margin: 37-51%

Sustainability / Regulatory / Next-Generation

Timing and synchronisation systems, segment routing, slicing and assurance software. The widest range in the portfolio, reflecting how much is software against dedicated hardware. Highest margin and the only part addressing requirements operators genuinely cannot negotiate away.
Gross Margin: 52-74%
ethernet-backhaul-equipment-market-portfolio-architecture-1788421749594

High-value Sub-segments and Strategic Watch-out

Timing and Synchronisation Systems

High value and high growth together, since time division duplex operation requires accuracy near 1.5 microseconds that satellite reception alone has failed to deliver reliably. The range reflects software against dedicated hardware content. Regulatory attention to resilience has turned this into a documented requirement rather than an engineering preference.
Gross Margin: 56-74%

Transport Software and Slicing

High value with steady growth, funded because operator enterprise revenue depends on differentiated transport services rather than because the network requires it. The range reflects assurance and orchestration content. It is bought by business units rather than by network planning, which places it outside falling mobile capital plans.
Gross Margin: 58-72%

Cell Site and Aggregation Routers

The volume core of the market and the most converged part of it, where operators compare throughput figures that ceased constraining anything years ago. It carries the installed presence through which software and timing are sold. Vendors cannot exit it and struggle to differentiate within it at all.
Gross Margin: 25-37%

Domestic Vendor Substitution Capacity

The strategic watch-out, carried at zero because it represents demand served outside the international vendor set rather than addressable revenue. Domestic suppliers serve most Chinese and increasing Indian volume. International vendors treating those markets as addressable are counting demand they will not reach. That distinction matters for forecasting.
Gross Margin: 0-0%

How Transport Demand Repeats

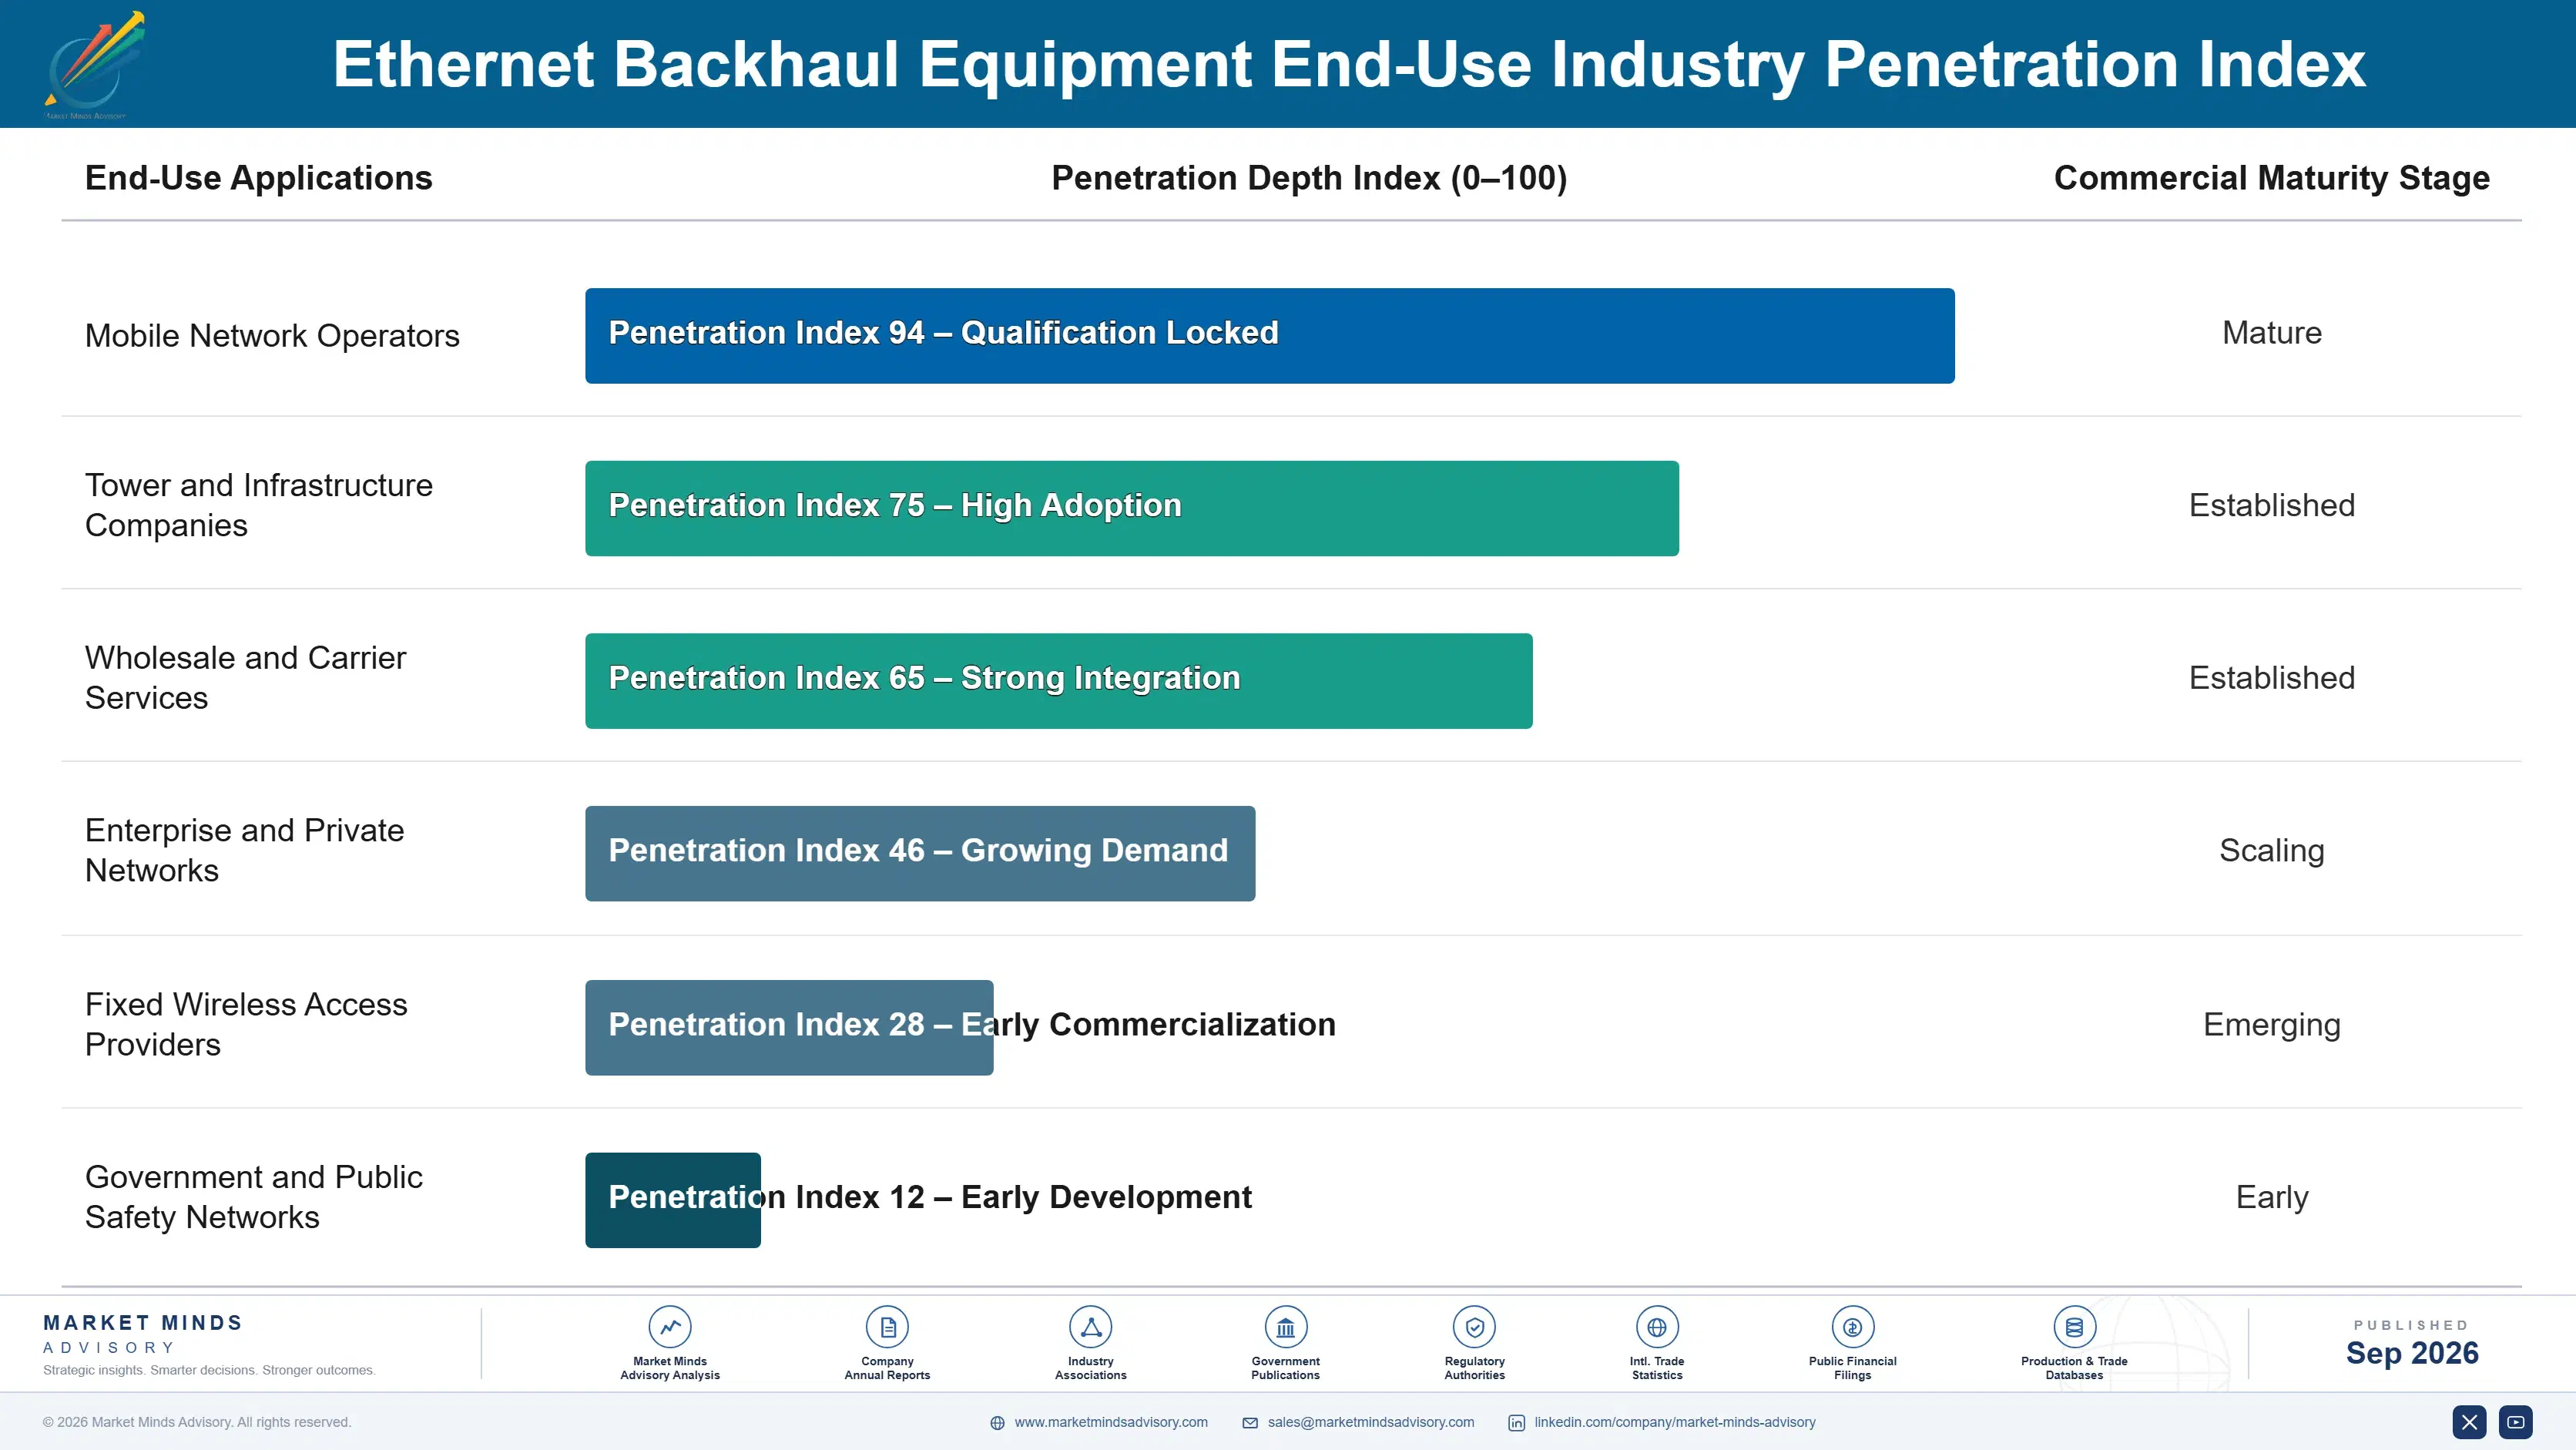
Demand repeats on an eight year hardware refresh punctuated by spectrum deployment events, and the two rarely coincide. A site refreshed for capacity is not touched again for most of a decade, which makes forward revenue a function of installed base age rather than traffic growth. Software and support contracts run continuously underneath and represent the more reliable revenue, though vendors organised around shipments treat them as an afterthought.
Adoption depth varies sharply by operator type. Dense urban operators use fronthaul, timing and slicing fully, since interference and service differentiation both matter. Rural and emerging market operators use microwave heavily, buying on price and power consumption. Tower companies buy transport as infrastructure and specify reliability above capability. Enterprise and wholesale units use slicing and assurance most intensively, since their revenue depends on it.

The buyer has broadened rather than moved. Mobile network planning still specifies backhaul for radio deployments, and its budget is not growing. Enterprise and wholesale business units now specify transport for services they sell, funded separately and growing. Timing is increasingly specified by a resilience function responding to regulatory attention. Vendors calling only on mobile network planning address the one buyer whose budget is reliably shrinking.
ethernet-backhaul-equipment-market-end-use-penetration-index-1788421750085

Where This Market Still Rewards

These are among the four positions where our research anticipates prominent divergence between winners and laggards over the coming forecast period. Each is grounded in the demand model, the regulatory perimeter, and the announced capacity pipeline.
01 / TIMING PRODUCT POSITIONING

Sell synchronisation as a product with its own evidence

Time division duplex operation requires cell sites held within roughly 1.5 microseconds of each other, and satellite timing at individual sites has failed often enough that regulators are now examining resilience directly. Vendors presenting timing with its own specification, test evidence and holdover story command roughly 3 times the attach value of clocks buried inside a router datasheet. Specialists have repeatedly beaten far larger portfolio competitors on exactly this basis, and operators are now procuring it as a separate line.
02 / NON-MOBILE BUDGET ACCESS

Sell to business units that mobile planning does not control

Mobile capital intensity sits near 16% of service revenue and has been falling in real terms for years, so transport competes inside a shrinking pool against radio and core spending with stronger internal advocates. Enterprise connectivity, wholesale, fixed wireless access and data centre interconnect ride the same platforms and draw on entirely separate budgets. Vendors selling there achieve roughly 2 times the growth available from mobile capital plans, though it requires calling on accounts most transport sales organisations have never approached.
03 / MICROWAVE POSITION RETENTION

Keep investing in radio backhaul competitors keep abandoning

Roughly 48% of cell sites still run on microwave because trenching cost and permitting time have not improved and will not improve because of anything an equipment vendor builds. Multi-gigabit radio links now carry capacity that once genuinely demanded fibre, and the volume concentrates in exactly the high site count markets where growth remains available. Writing microwave off on a fibre forecast that has failed to arrive for fifteen years has been a recurring and genuinely expensive error across this industry.
04 / SOFTWARE MARGIN CAPTURE

Compete on transport software, not on throughput figures

Routing hardware has converged to the point where operators compare capacity numbers that stopped constraining networks years ago, and margins in that layer reflect it. Segment routing, network slicing and assurance software determine whether an operator can sell differentiated enterprise services at all, and they carry gross margins roughly 26 percentage points above hardware. Operators fund them because their own enterprise revenue depends on the capability, which is a considerably stronger purchase argument than any datasheet comparison has ever provided.

Engagement Snapshot From the Field

A live engagement with an industry participant carrying material or product regulatory and market exposure ahead of a defining policy shift, showing how our research translates into a defensible multi-year portfolio strategy.
MARKET MINDS ADVISORY · CLIENT ENGAGEMENT SUMMARY
Ethernet Backhaul Equipment Producer Strategic Portfolio Review and Transition Roadmap 2026·Investment Scenario on Ethernet Backhaul Equipment Exposure Evaluation 2025-26
CLIENT PROFILE
A tier one mobile operator running roughly 27,000 cell sites across two countries, of which about 11,600 were backhauled by microwave (client-reported, unverified by MMA). Its transport network dated from a modernisation completed in 2016, and a timing incident affecting one metropolitan cluster had prompted board-level questions that the network team could not answer at all clearly.
STRATEGIC CHALLENGE
The proposed modernisation programme assumed fibre extension to a further 6,000 microwave sites at an estimated USD 340 million in civil works alone (client-reported, unverified by MMA). Capital allocation had already been reduced, transport was competing against radio spectrum deployment, and no assessment had been made of whether current microwave capability could serve those sites adequately.
MMA APPROACH
MMA assessed each microwave site against actual and forecast capacity requirements rather than against a general fibre policy, which the operator had never done at site level. We interviewed 17 internal stakeholders, six vendors and two civil contractors, and modelled timing architecture options separately. Vendor evaluation weighted synchronisation resilience and microwave capacity ahead of router throughput comparison entirely.
KEY FINDINGS
  1. Only 1,900 of the 6,000 sites proposed for fibre extension had forecast capacity requirements that current multi-gigabit microwave could not serve adequately.
  2. The timing incident originated from satellite signal interference in a single urban area, and terrestrial distribution across the transport network would have contained it entirely.
  3. Civil works for fibre extension averaged roughly 71% of total per-site cost, and that proportion had not improved across the preceding decade of similar programmes.
  4. Enterprise and fixed wireless traffic already represented 22% of transport load, funded from a business unit that had not been consulted on the modernisation plan at all.
CLIENT PROFILE
A tier one mobile operator running roughly 27,000 cell sites across two countries, of which about 11,600 were backhauled by microwave (client-reported, unverified by MMA). Its transport network dated from a modernisation completed in 2016, and a timing incident affecting one metropolitan cluster had prompted board-level questions that the network team could not answer at all clearly.
STRATEGIC CHALLENGE
The proposed modernisation programme assumed fibre extension to a further 6,000 microwave sites at an estimated USD 340 million in civil works alone (client-reported, unverified by MMA). Capital allocation had already been reduced, transport was competing against radio spectrum deployment, and no assessment had been made of whether current microwave capability could serve those sites adequately.
MMA APPROACH
MMA assessed each microwave site against actual and forecast capacity requirements rather than against a general fibre policy, which the operator had never done at site level. We interviewed 17 internal stakeholders, six vendors and two civil contractors, and modelled timing architecture options separately. Vendor evaluation weighted synchronisation resilience and microwave capacity ahead of router throughput comparison entirely.
KEY FINDINGS
  1. Only 1,900 of the 6,000 sites proposed for fibre extension had forecast capacity requirements that current multi-gigabit microwave could not serve adequately.
  2. The timing incident originated from satellite signal interference in a single urban area, and terrestrial distribution across the transport network would have contained it entirely.
  3. Civil works for fibre extension averaged roughly 71% of total per-site cost, and that proportion had not improved across the preceding decade of similar programmes.
  4. Enterprise and fixed wireless traffic already represented 22% of transport load, funded from a business unit that had not been consulted on the modernisation plan at all.
RECOMMENDED STRATEGY
Phase 1: Extend fibre only to the 1,900 sites where capacity genuinely requires it, and upgrade the remainder to multi-gigabit microwave at a fraction of the civil cost. Phase 2: Build terrestrial timing distribution with boundary clocks and holdover across aggregation points, rather than relying on satellite reception at individual sites. Phase 3: Bring the enterprise business unit into transport planning and funding, since it already accounts for a fifth of the load carried on the network.
OUTCOME
The programme was rescoped to roughly USD 155 million against the USD 340 million originally proposed, with the timing architecture rebuilt in the first phase (client-reported, unverified by MMA). No further synchronisation incidents occurred during the period, and the enterprise business unit contributed directly to the second phase budget.

Frequently Asked Questions

Foundational context covering the market sizes, CAGR, scope, country, region and competition that inform every finding below. This section is provided to cover basics and most often pre-purchase conversations, answered from the MMA Primary Research Dataset.

What is the current size of the Ethernet Backhaul Equipment Market?

The market was worth USD 8.4 billion in 2025 and reaches USD 8.84 billion in 2026. Optical transport and timing equipment account for most of the growth.

How large will the Ethernet Backhaul Equipment Market be by 2036?

MMA forecasts USD 14.68 billion by 2036, an expansion of 1.66 times over the forecast period. That represents USD 5.84 billion of incremental annual revenue against 2026.

What is the CAGR for the Ethernet Backhaul Equipment Market 2026 to 2036?

The base case is 5.2% compound annual growth, with a bull case at 6.4% and a bear case at 4.0%. The direction of operator capital intensity separates the scenarios.

Which segment is growing fastest?

Optical transport for mobile fronthaul and backhaul grows at 7.8%, half again the market rate of 5.2%. Fronthaul capacity and latency requirements rule out microwave entirely.

Who are the major companies in the Ethernet Backhaul Equipment Market?

Huawei, Ericsson, Nokia, Cisco and Ciena lead on measured equipment shipment revenue. Together they hold roughly 66%, a share that keeps rising through consolidation rather than competition.

Which country is growing fastest?

India grows fastest at 9.8%, on network expansion continuing long after other markets completed theirs, with enormous site counts and low fibre penetration to those sites.

Report Segmentation Architecture

The full report scope spans multiple orthogonal segmentation dimensions, with cross-tabulated demand data provided for each dimension pair. Coverage extends further to regional breakdowns, trend trajectories, and the competitive detail needed to support segment-level decision-making.

By Primary Market Dimension

  • Microwave and Millimetre Wave Radio Links
  • Cell Site and Access Routers
  • Aggregation and Pre-Aggregation Routers
  • Optical Transport for Fronthaul and Backhaul
  • Timing and Synchronisation Equipment
  • Fixed Wireless and Satellite Backhaul Terminals

By End-Use Industry

  • Mobile Network Operators
  • Tower and Infrastructure Companies
  • Wholesale and Carrier Services
  • Enterprise and Private Networks
  • Fixed Wireless Access Providers
  • Government and Public Safety Networks

By Commercial Dimension

  • Direct Operator Procurement
  • Managed Service Contracts
  • Systems Integrator Delivery
  • Tower Company Purchasing
  • Distributor and Reseller Channels
  • Framework and Multi-Year Agreements

By Region

  • East Asia
  • North America
  • Western Europe
  • South Asia and Pacific
  • Latin America
  • Middle East and Africa
  • Eastern Europe

Scope, Methodology, and Coverage

Every figure in this report is reproducible from documented input assumptions. The scope below maps the historical period, the forecast horizon, the segmentation dimensions, and the countries covered, alongside the underlying primary and qualitative methodology.
Historical Period
2020 to 2025
Forecast Period
2026 to 2036
Base Year
2025 (USD billions; MMA Primary Research Dataset, September 2026)
Market Definition
This market covers packet transport equipment carrying traffic between radio access sites and the mobile core network, spanning microwave and millimetre wave radio links, cell site and access routers, aggregation and pre-aggregation routers, optical transport for mobile fronthaul and backhaul, timing and synchronisation equipment, and fixed wireless and satellite backhaul terminals. Revenue is measured as equipment shipment value at vendor level, including attributable transport software licensed with the hardware. Radio access base stations, mobile core network elements, passive fibre and duct infrastructure, civil construction, standalone network management software and enterprise campus switching are excluded.
Quantitative Units
USD billions, equipment shipment and attributable software revenue
Segmentation Dimensions
Transport layer, operator type, commercial model, region
Regions Covered
East Asia, North America, Western Europe, South Asia and Pacific, Latin America, Middle East and Africa, Eastern Europe
Countries Covered
United States, Canada, Mexico, Brazil, Colombia, Chile, Argentina, United Kingdom, Germany, France, Italy, Spain, Netherlands, Sweden, Poland, Czechia, Romania, China, Japan, South Korea, Taiwan, India, Indonesia, Vietnam, Philippines, Australia, Saudi Arabia, United Arab Emirates, Nigeria, Kenya, South Africa
Key Companies Profiled
Huawei, Ericsson, Nokia, Cisco, Ciena, ZTE, HPE Juniper Networking, Ceragon Networks, Aviat Networks, SIAE Microelettronica, NEC, Fujitsu, Adtran, Ribbon Communications, RAD, Samsung Electronics, Cambium Networks, Microchip Technology, Oscilloquartz, Ubiquiti
Quantitative Methodology
Primary survey, n=3,800 respondents, Q4 2025, six countries; demand-side model with trade association cross-validation
Qualitative Methodology
47 expert interviews, Q4 2025; applied to validate demand model assumptions, identify emerging dynamics, and assess competitive positioning
Report Format
PDF and XLSX data workbook (Word format preview document)
Publisher
Market Minds Advisory
Report Code
MMA-2026-TEC-861
Published
September 2026
Contact
sales@marketmindsadvisory.com | www.marketmindsadvisory.com

Purchase the full Ethernet Backhaul Equipment Market Report (2026 to 2036).

The full MMA report explains why fibre has failed to displace microwave at the cell site for fifteen years, and where transport equipment value has moved instead. It sizes the market to 2036 across six transport layers, seven regions and 31 countries, with layer growth rates and regional demand mechanisms set out in full. Competitive analysis covers 20 vendors assessed on measured equipment shipment revenue, including moat and risk assessment for the two leaders. The report quantifies bill of materials structure, optical component exposure and margin architecture across three portfolio tiers. It closes with four strategic verdicts and an anonymised tier one operator engagement.
Six transport layers sized to 2036
Seven regions with demand mechanism analysis
Twenty vendors on consistent shipment revenue basis
Component cost and timing requirement benchmarks
Margin architecture across three portfolio tiers
Anonymised operator transport modernisation strategy engagement

Built For The People Who Decide

From boardroom strategy to bench-side execution, this report is read cover-to-cover by leaders shaping the next decade of their industry, turning demand scenarios, market dynamics and valuation benchmarks into decisions.
CXOs/ Presidents/ VPs/ Managers
M&A and Corporate Development
Strategy Teams and R&D Heads
Procurement and Product Directors
Regulatory and Compliance Leaders
Investor Relations and Equity Analysts