Market Minds Advisory
Esterified Vitamins Market

Esterified Vitamins Market: Esterified Vitamins Market. Cosmetic Vitamin C Demand, Stability Requirements, and Concentrated Intermediate Supply Shape Global Trade.

Global esterified vitamin demand spans animal feed premixes, food fortification, supplements, and cosmetics, where cosmetic vitamin C growth, stability requirements, retinoid limits, and concentrated Chinese and German intermediate supply decide which producers win contracts with

Lead Analyst

Published

September 2026

Make Smarter Decisions with Customized Research Insights

Request a free sample report and evaluate market opportunities, growth trends, and competitive dynamics relevant to your business needs.

2025 MARKET VALUE$3.4BMarket Size 2025
2036 FORECAST VALUE$6.3BBase Case , 2026 to 2036
CAGR 2026 TO 20365.8 %Bull 7.2% / Bear 4.5%
INCREMENTAL OPPORTUNITY$2.7BNet 10- year value creation
EXPANSION MULTIPLE1.76x2036 value over 2026 base
Strategic Levers
M&A Pipeline
Regional Outlook
Country Rankings
Competitive Intelligence
Segmental Deep-dive
Call-Us : 91 93563 13602

Executive Snapshot and Market Trajectory.

Esterified vitamins are vitamins A, E, C, and others bonded to acids, such as acetates, palmitates, and phosphates, that make them more stable and easier to blend in feed, food, supplements, and cosmetics. Feed volumes and cosmetic vitamin C lift demand, while concentrated supply and retinoid limits restrain margins.
Vitamin C Esters for Cosmetics and Food grow fastest as skin care brands seek stable brightening and anti-ageing actives. East Asia holds the largest share through Chinese vitamin plants, while Western Europe and North America follow through German and Dutch producers and large nutrition and personal care demand. Intermediates set cost. Stability sets premiums. Buyers audit yearly. Buyers review suppliers every season. Supply contracts decide renewal.
Competition is highly concentrated, with a Dutch-Swiss nutrition group, a German chemicals group, two Chinese vitamin producers, and a French-Chinese feed additive group leading on intermediate integration, scale, and quality documentation, while cosmetic ingredient houses and blenders serve niche demand. Feed, food, and cosmetic rules govern use. Supply security wins accounts. Delivery reliability decides supplier rankings. Margins follow sourcing discipline. Batch records protect future sales. Cost control separates leaders from followers. Audits repeat every year.
Market Definition
The market covers global sales of esterified vitamins, valued at producer level, including vitamin A esters such as acetate and palmitate, vitamin E esters such as tocopheryl acetate and succinate, vitamin C esters such as ascorbyl palmitate, phosphate, and glucoside, other vitamin and specialty esters, and encapsulated and stabilised ester formulations. The scope excludes non-esterified vitamins sold on their own, provitamins such as beta-carotene, and finished supplements, feeds, or cosmetics.
Base Year Value
$3.4B in 2025 (MMA Primary Research Dataset, September 2026)
Forecast Period
2026 to 2036, eleven discrete annual values
CAGR
5.8% base case. Bull 7.2%. Bear 4.5%.
Fastest Growth Segment
Vitamin C Esters for Cosmetics and Food: 9.4% CAGR
Fastest Growth Country
India: 8.4% CAGR
Fastest Growth Region
South Asia and Pacific: 7.8% CAGR
Largest Region
East Asia: 34% of 2025 global value
Market Leaders
DSM-Firmenich, BASF, Zhejiang NHU, Zhejiang Medicine, Adisseo. Source: MMA Analysis, company annual reports.
Primary Survey
n=3,800 procurement and R&D decision-makers, Q4 2025, six countries
Methodology
Demand-side build-up, cross-validated against public data, 47 expert interviews

Esterified Vitamins Market Forecast Scenarios

esterified-vitamins-market-size-forecast-scenario-1789869889570
Between 2020 and 2025, esterified vitamin demand grew as feed output recovered, supplement sales rose, and cosmetic brands widened vitamin C and E actives. Vitamin prices swung with Chinese supply and intermediate outages, energy costs rose in 2022, and producers passed on price changes unevenly to feed, food, and cosmetic buyers. Buyers review suppliers every season. Supply contracts decide renewal.
The base case rests on three commercial mechanisms. First, feed and premix volumes keep using vitamin A and E esters for stability and cost. Second, cosmetic and skin care brands adopt vitamin C and E esters for brightening and antioxidant claims. Third, food fortification and supplement makers use stabilised and encapsulated esters. Producers plan intermediate supply, encapsulation capacity, and quality systems around all three. Delivery reliability decides supplier rankings. Margins follow sourcing discipline.
The bull case needs faster cosmetic adoption of vitamin C esters and steadier intermediate supply, which would lift volumes and prices. The bear case is wider retinoid limits combined with a vitamin price collapse, which would squeeze margins and slow investment. Batch records protect future sales. Cost control separates leaders from followers. Clear specifications build buyer trust.

Cosmetic Vitamin C Growth, Stability Needs, and Intermediate Supply Set Ester Outcomes

Esterified vitamin supply starts with petrochemical and fermentation intermediates: citral and isophytol for vitamins A and E, trimethylhydroquinone, and glucose-derived ascorbic acid for vitamin C. Producers esterify the vitamin with acetic, palmitic, succinic, or phosphoric acid, then purify, crystallise, and stabilise it with antioxidants. Spray-dried or beadlet forms are made for feed and food, and oil solutions for cosmetics. Small buyers feel every input swing.
MARKET CONCENTRATION68% CR5Leading five producers hold a very high combined share
CHINESE OUTPUT SHARE62%Portion of global vitamin ester output made in China
INTERMEDIATE COST SHARE44%Portion of goods cost taken by citral, isophytol, and acids
FEED USE SHARE58%Portion of global value sold into animal feed and premixes
TYPICAL PREMIX DOSE10-200 mg/kgUsual vitamin ester dose range in compound feed
STABILISED GRADE PREMIUM40-130%Typical price gap between stabilised and plain ester grades
Potency, stability, purity, particle size, and traceability decide value. Buyers set tight specifications, and stabilised and encapsulated grades earn premiums of 40% to 130% over plain ester grades. Large producers win on intermediate integration and audits, while smaller producers win on niche esters and service. Suppliers with clean documentation win, since feed, food, and cosmetic buyers inspect closely. Audits repeat yearly.
Buyers judge esterified vitamins on potency retention, oxidation stability, dispersion, label status, and price stability. Feed makers want low-cost stable premixes, food makers want fortification without taste change, supplement brands want clean labels, and cosmetic makers want mild stable actives. Price sensitivity is high in feed and low in cosmetics. Stability tests decide shortlists. Technical reach compounds over time. Audits repeat every year.
"An ester is a vitamin that has been taught to survive a premix. That sounds mundane until one factory fire or one Chinese environmental inspection takes out the citral supply. Then buyers discover that stability was never the scarce thing. Intermediates were."
Senior Analyst, Vitamins and Nutritional Ingredients Practice · MMA Esterified Vitamins Practice · September 2026

Market Trends

Brightening and Anti-Ageing Skin Care Lifts Vitamin C Ester Demand

Skin care brands seek stable vitamin C derivatives such as ascorbyl glucoside, magnesium ascorbyl phosphate, and ascorbyl palmitate for brightening, antioxidant, and collagen claims because plain ascorbic acid oxidises in formulations. Vitamin C Esters for Cosmetics and Food grow about 9.4% a year, and gross margins run 32% to 50% against 14% to 24% for feed grade esters. The trend needs stability data and safety files, and it rewards producers with cosmetic laboratories. Buyers review suppliers every season. Supply contracts decide renewal. Delivery reliability decides supplier rankings. Margins follow sourcing discipline. Batch records protect future sales.
Market Impact: feed output exceeds 1.2 billion tonnes

Stability Needs Push Formulators Toward Encapsulated and Stabilised Ester Formulations

Feed, food, and supplement makers face heat, moisture, and mineral interactions that degrade vitamins during processing and storage, so they buy beadlets, coated forms, and antioxidant-stabilised esters. Encapsulated and Stabilised Ester Formulations grow about 7.6% a year. The trend needs coating and spray-drying capacity, and it rewards producers with application laboratories, stability studies under customer conditions, and consistent particle size that fits automated dosing lines. Cost control separates leaders from followers. Clear specifications build buyer trust. Small buyers feel every input swing. Technical reach compounds over time. Audits repeat every year. Buyers review suppliers every season.
Market Impact: fortification programmes cover 100+ countries

Market Opportunities and Growth Drivers

Feed Volumes Sustain Steady Vitamin A and E Ester Demand

Poultry, swine, cattle, and aquaculture feed use vitamin A and E esters for growth, immunity, and product quality, and global feed output keeps rising with protein demand. Feed output exceeds 1.2 billion tonnes a year. The driver sustains steady demand for feed grade esters and rewards producers with consistent potency, dependable delivery to premix plants, and traceable intermediate sourcing that supports feed safety audits. Supply contracts decide renewal. Delivery reliability decides supplier rankings. Margins follow sourcing discipline. Batch records protect future sales. Cost control separates leaders from followers. Clear specifications build buyer trust.
Market Impact: vitamin prices moved 40-150%

Food Fortification Rules and Supplement Growth Sustain Ester Demand

Governments mandate or encourage fortification of oils, flour, and dairy with vitamins A and D and others, and supplement and functional food sales grow, all using esters for stability. Fortification programmes cover more than 100 countries. The driver sustains steady demand for food grade esters and rewards producers with approved specifications, batch traceability, and technical support for fortification programmes and premix makers. Small buyers feel every input swing. Technical reach compounds over time. Audits repeat every year. Buyers review suppliers every season. Supply contracts decide renewal. Delivery reliability decides supplier rankings. Margins follow sourcing discipline.
Market Impact: EU retinoid limits reach 0.05-0.3%

Market Restraints and Challenges

Concentrated Chinese and German Production Raises Price and Supply Risk

A few producers make most vitamin A and E intermediates, and plant fires, environmental inspections, and export rules disrupt supply, causing sharp price spikes. The root cause is concentrated capacity in a few sites. Buyers respond with second sources and stock, though vitamin prices moved 40% to 150% in disruption years and forced feed makers to reformulate or delay orders. Batch records protect future sales. Cost control separates leaders from followers. Clear specifications build buyer trust. Small buyers feel every input swing. Technical reach compounds over time. Audits repeat every year. Buyers review suppliers every season.
Market Impact: vitamin C esters grow 9.4% yearly

Cosmetic Retinoid Limits and Oxidation Instability Restrict Ester Formulations

Regulators in Europe restrict retinol and retinyl esters in cosmetics, and vitamin esters can oxidise or irritate in poorly designed formulations, which limits dose and use. The root cause is safety review and formulation chemistry. Producers respond with safety data, stabilisation, and lower-dose systems, though European retinoid limits reach 0.05% to 0.3% and slow product launches. Supply contracts decide renewal. Delivery reliability decides supplier rankings. Margins follow sourcing discipline. Batch records protect future sales. Cost control separates leaders from followers. Clear specifications build buyer trust. Small buyers feel every input swing. Technical reach compounds over time.
Market Impact: stabilised esters grow 7.6% yearly
3 additional market trends, 2 additional growth drivers, and 4 additional restraints and challenges are covered in the full report. Contact sales@marketmindsadvisory.com to access the complete intelligence.

Segment CAGR and Growth Architecture

The global esterified vitamin market is segmented by vitamin family and formulation type, which shows where stability and cosmetic safety evidence create pricing power in a concentrated market. Five segments cover vitamin A esters, vitamin E esters, vitamin C esters, other specialty esters, and encapsulated and stabilised formulations. Vitamin C esters and stabilised formulations grow fastest as cosmetic
esterified-vitamins-market-market-share-analysis-1789869889857

Vitamin C Esters for Cosmetics and Food

Vitamin C Esters for Cosmetics and Food is the fastest-growing segment at 9.4% a year, about 1.62 times the overall market rate. Skin care brands seek stable brightening and antioxidant actives because plain ascorbic acid oxidises, so gross margins of 32% to 50% against 14% to 24% for feed grade esters support investment. Cost per active and irritation concerns in some formulations are the main constraints. Producers with cosmetic laboratories win. Audits repeat every year. Buyers review suppliers every season. Supply contracts decide renewal. Delivery reliability decides supplier rankings. Margins follow sourcing discipline. Batch records protect future sales. Cost control separates leaders from followers. Clear specifications build buyer trust. Small buyers feel every input swing.
CAGR 9.4%

Encapsulated and Stabilised Ester Formulations

Encapsulated and Stabilised Ester Formulations grows at 7.6% a year, because feed, food, and supplement makers face heat, moisture, and mineral interactions that degrade vitamins and buy beadlets and coated forms, and buyers accept gross margins of 26% to 40% for potency retention and dosing consistency. Capital for coating and drying lines is the main constraint, since capacity must match demand. Producers with application laboratories hold price better than followers. Technical reach compounds over time. Audits repeat every year. Buyers review suppliers every season. Supply contracts decide renewal. Delivery reliability decides supplier rankings. Margins follow sourcing discipline. Batch records protect future sales. Cost control separates leaders from followers. Clear specifications build buyer trust.
CAGR 7.6%
Full segment breakdown across 5 segments available in the complete report.

Regional Architecture and Country Demand Map

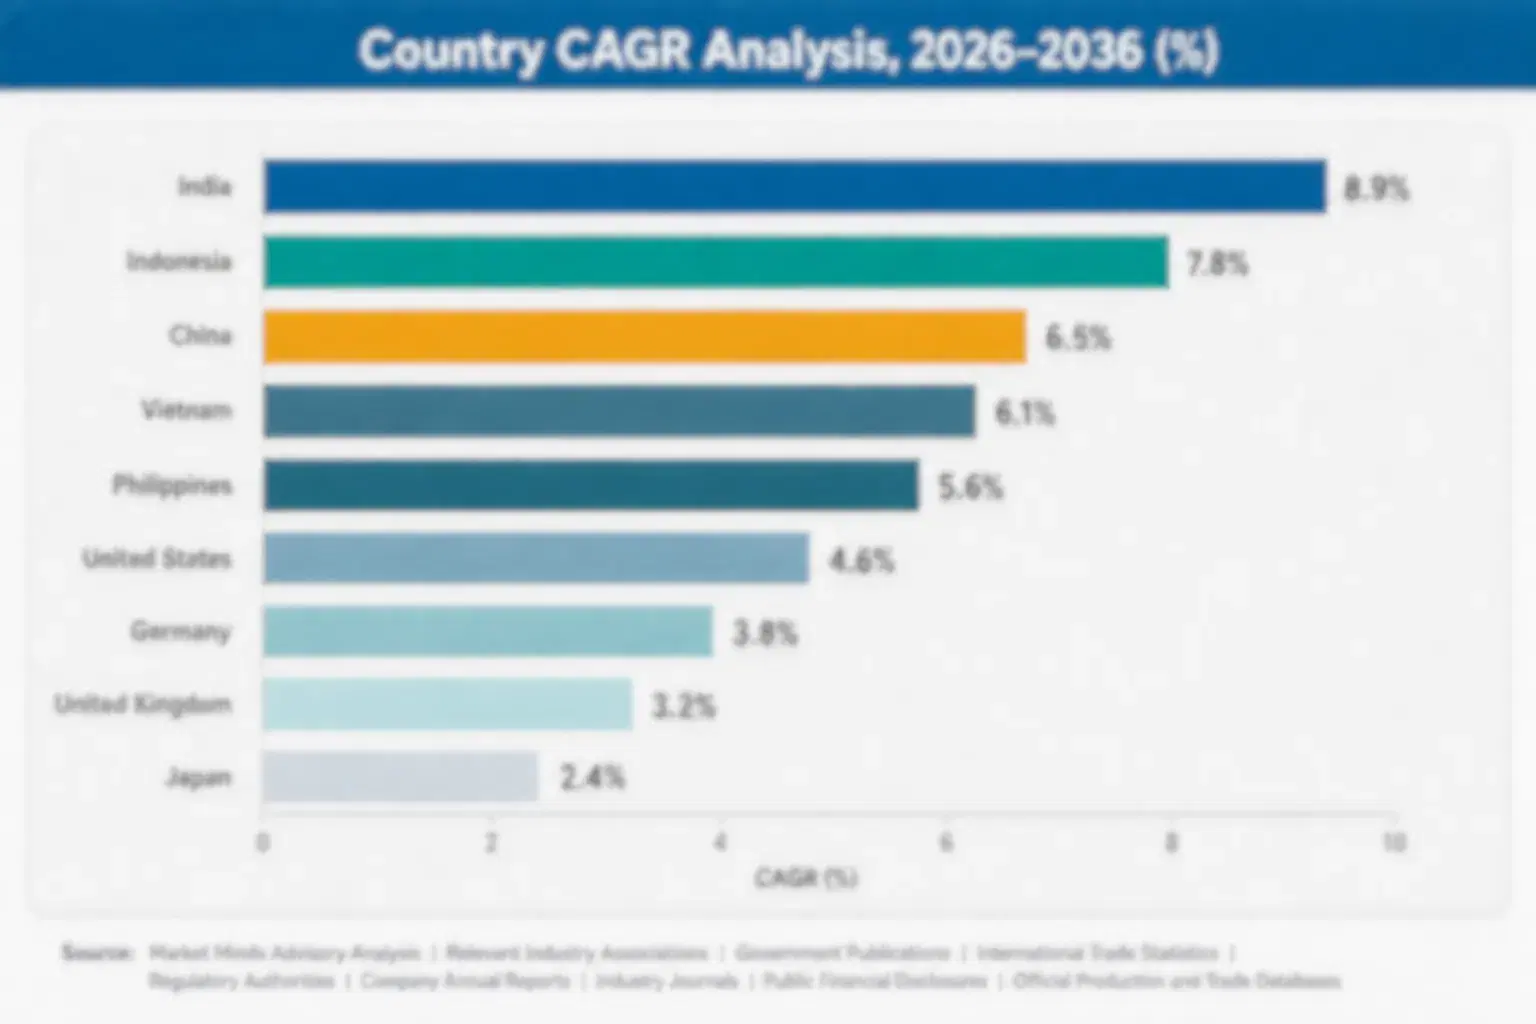
East Asia leads at 34% because Chinese plants concentrate vitamin intermediate and ester manufacturing, so its share sits above the usual band. Western Europe follows through German and Dutch producers, North America adds blending and demand, and South Asia and Pacific grows fastest as Indian feed and cosmetic markets

East Asia

East Asia holds 34% share, above its usual band, and leads because China makes most of the world's vitamin A, E, and C intermediates and esters through producers such as Zhejiang NHU, Zhejiang Medicine, Northeast Pharmaceutical Group, and CSPC Pharmaceutical, while Japan and Korea add cosmetic and supplement demand. This share reflects manufacturing concentration. Growth exceeds the global rate. Environmental rules, energy costs, and price cycles restrain margins. Small buyers feel every input swing. Technical reach compounds over time. Audits repeat every year. Buyers review suppliers every season. Supply contracts decide renewal. Delivery reliability decides supplier rankings. Margins follow sourcing discipline. Batch records protect future sales. Cost control separates leaders from followers.
Share: 34% | CAGR: 6.8% (2026 to 2036)

Western Europe

Western Europe holds 22% share, inside its band, and value comes from Germany, the Netherlands, France, and Switzerland, where BASF, DSM-Firmenich, Adisseo, Evonik, and Symrise produce and formulate esters for feed, food, and personal care under strict safety and traceability rules. Growth trails the global rate. Energy costs, mature volumes, and competition from Chinese suppliers restrain margins. Clear specifications build buyer trust. Small buyers feel every input swing. Technical reach compounds over time. Audits repeat every year. Buyers review suppliers every season. Supply contracts decide renewal. Delivery reliability decides supplier rankings. Margins follow sourcing discipline. Batch records protect future sales. Cost control separates leaders from followers. Clear specifications build buyer trust. Small buyers feel every input swing.
Share: 22% | CAGR: 4.4% (2026 to 2036)
Regional intelligence for 5 additional markets available in the complete report: North America, South Asia and Pacific, Latin America, Middle East and Africa, Eastern Europe. Contact sales@marketmindsadvisory.com.
esterified-vitamins-market-country-cagr-analysis-1789869890146

Four Margin Routes for Esterified Vitamin Producers

Margin in esterified vitamins comes from stabilised and encapsulated grades, cosmetic programmes, intermediate supply security, and regional production rather than feed grade volume. The routes below apply to vitamin producers, blenders, and cosmetic ingredient houses, and each can start inside one planning cycle, with clear measures in gross margin points, cost per kilogram, and customer programmes served.

Shifting Volume From Plain Esters Into Stabilised and Encapsulated Formulations

Stabilised and encapsulated formulations earn gross margins of 26% to 40% against 14% to 24% for plain esters, so producers that add coating, spray-drying, and antioxidant systems to shift 10% of volume into stabilised grades report gross margin gains of 4 to 7 points on the mix. Lines cost $5 million to $20 million. Pilots with five premix makers confirm demand. Margins follow sourcing discipline. Batch records protect future sales. Cost control separates leaders from followers. Clear specifications build buyer trust. Small buyers feel every input swing. Technical reach compounds over time.
Market Impact: stabilised ester mix shift lifts gross margin by 4-7 points

Building Cosmetic Vitamin C Programmes With Stability and Safety Dossiers

Skin care brands need stable actives with safety files, so producers that offer stability data, irritation studies, and formulation support win multi-year programmes and lift sales per customer by 10% to 18%. Cosmetic laboratories cost $0.5 million to $2 million. Producers should target brightening and anti-ageing brands first and publish stability results in common bases such as emulsions and serums. Audits repeat every year. Buyers review suppliers every season. Supply contracts decide renewal. Delivery reliability decides supplier rankings. Margins follow sourcing discipline. Batch records protect future sales. Cost control separates leaders from followers.
Market Impact: cosmetic programmes lift sales per customer by 10-18%

Contracting Multi-Source Intermediates Across Citral, Isophytol, and Acid Suppliers

Intermediates take about 44% of cost and vitamin prices moved 40% to 150% in disruption years, so producers that contract citral, isophytol, and ascorbic acid from several sources, index prices, and hold stock cut margin swings. Contracts cut spot purchases by 30% to 50%. Producers should share specifications with suppliers, audit sites, and hold safety stock for priority premix accounts. Clear specifications build buyer trust. Small buyers feel every input swing. Technical reach compounds over time. Audits repeat every year. Buyers review suppliers every season. Supply contracts decide renewal. Delivery reliability decides supplier rankings.
Market Impact: multi-source contracts cut intermediate cost swings by 20-30%

Building Dual-Region Production to Protect Customers From Single-Site Disruption

Fires and inspections at one site can remove global supply, so producers that operate plants in two regions, share process control, and hold buffer stock give customers continuity and earn premiums. New capacity costs $30 million to $120 million. Producers should stage investment, qualify sites to one standard, and aim to cut customer supply disruption risk by 40% to 60%. Margins follow sourcing discipline. Batch records protect future sales. Cost control separates leaders from followers. Clear specifications build buyer trust. Small buyers feel every input swing. Technical reach compounds over time. Audits repeat every year.
Market Impact: dual-region plants cut customer supply disruption risk by 40-60%

Who Controls the Margin Pool

The global esterified vitamin market is highly concentrated, with a CR5 of 68%, and Chinese regional producers, cosmetic ingredient houses, and blenders sit outside the leading five. This assessment measures participants on estimated esterified vitamin volume supplied in tonnes, held constant across all players. DSM-Firmenich leads through intermediate integration and customer reach, while BASF, Zhejiang NHU, Zhejiang Medicine, and Adisseo follow, with a clear gap between the leader and the
Competition runs on four dimensions today: intermediate integration and cost, formulation and stabilisation, quality and traceability, and delivery reliability. Large producers win on integration and audits, while smaller producers win on niche esters and service. Imitators copy plain feed esters quickly, so premiums outside stabilised and cosmetic grades erode within a season, and price competition appears in vitamin E and A feed grades. Buyers review suppliers every season.

Emerging pressure comes from Chinese producers moving into cosmetic and stabilised grades, environmental rules on chemical plants, and cosmetic retinoid limits. Rankings shift where a producer secures cheaper intermediates, adds stabilisation, or wins a cosmetic programme. Regional producers can move up quickly when they secure quality certificates, since audits can outweigh scale. Supply contracts decide renewal.
esterified-vitamins-market-company-positioning-matrix-1789869890446

Competitive Moat and Risk Dimensions

DSM-FIRMENICH

Moat: Integrated Vitamin Production and Reach

DSM-Firmenich, a Dutch-Swiss nutrition, health, and flavour group, produces vitamins, esters, and premixes and supplies feed, food, supplement, and personal care customers worldwide with formulation and regulatory support. Its intermediate integration, plant network, and application laboratories give it credibility with multinational buyers, and its position supports bundled supply of vitamins and premixes with quality documentation across regions.
DSM-FIRMENICH

Risk: Chinese Price Competition Exposure

DSM-Firmenich competes with lower-cost Chinese producers in feed grade esters, so price cycles hit margin. Focused rivals can win volume accounts. Delivery reliability decides supplier rankings. Margins follow sourcing discipline. Batch records protect future sales. Cost control separates leaders from followers. Clear specifications build buyer trust. Small buyers feel every input swing.
BASF

Moat: Chemical Integration and Formulation Depth

BASF, a German chemicals group, produces vitamin A and E intermediates and esters, alongside carotenoids and personal care ingredients, and supplies feed, food, and cosmetic customers worldwide. Its chemical integration, technical service, and customer relationships give it credibility with multinational buyers, and its position supports tailored esters and stabilised forms with regulatory support.
BASF

Risk: Single-Site Concentration Risk

BASF concentrates key intermediate production in a few sites, so outages hit supply and reputation. Rivals with dual-region plants can win continuity-driven accounts. Technical reach compounds over time. Audits repeat every year. Buyers review suppliers every season. Supply contracts decide renewal. Delivery reliability decides supplier rankings. Margins follow sourcing discipline.

Players Tracked

Prominent Players

DSM-Firmenich
BASF
Zhejiang NHU
Zhejiang Medicine
Adisseo

Other Key Players

Northeast Pharmaceutical Group
CSPC Pharmaceutical
Xinfa Pharmaceutical
Prinova Group
Balchem
Kemin Industries
Evonik
Croda
Symrise
Ashland
Resonac
Sabinsa
Brenntag
IMCD
Univar Solutions

Recent Developments

JANUARY 2026

DSM-Firmenich Expands Stabilised Vitamin Ester Capacity for Premix and Food Customers

DSM-Firmenich expanded stabilised vitamin ester capacity for premix and food customers, according to company communications. It is an organic capacity expansion, not an acquisition, and it tests whether stability demand supports investment. Capacity figures were not disclosed. Batch records protect future sales. Cost control separates leaders from followers.
Signal: Suggests leading producers are adding stabilised ester capacity to serve customers facing heat and moisture losses in processing.
FEBRUARY 2026

Zhejiang NHU Announces Cosmetic Grade Vitamin Ester Range for International Skin Care Brands

Zhejiang NHU announced a cosmetic grade vitamin ester range for international skin care brands, according to company communications. It is a product launch, not an acquisition, and it tests whether Chinese producers can win cosmetic accounts. Sales volumes were not disclosed. Clear specifications build buyer trust.
Signal: Indicates Chinese vitamin producers are moving into cosmetic grades where margins exceed those in feed and commodity fortification.
MARCH 2026

BASF Reports Improved Vitamin Intermediate Availability After Plant Optimisation

BASF reported improved vitamin intermediate availability after plant optimisation, according to company communications. It is an operational update, not a capacity expansion, and it tests supply reliability. Output figures were not disclosed. Small buyers feel every input swing. Technical reach compounds over time. Audits repeat every year.
Signal: Confirms producers are investing in plant reliability to protect customer confidence after past disruptions and price spikes.

What Drives Global Esterified Vitamin Costs

Intermediates, including citral, isophytol, trimethylhydroquinone, and ascorbic acid, account for roughly 44% of cost of goods, esterifying acids and antioxidants about 10%, energy and solvents about 14%, and purification, testing, packaging, and logistics about 32%. Intermediates come mainly from Germany and China, and plants operate in China, Germany, the Netherlands, and Switzerland. Margins follow sourcing discipline. Batch records protect future sales.
The clearest recent shock came from plant disruptions and energy prices. Outages and environmental inspections at major intermediate plants cut vitamin supply in recent years and pushed prices sharply higher, as company reports noted, energy prices surged, as the IEA reported, and BASF noted in its Integrated Report 2023 that raw material and energy costs affected its nutrition and care segments. Producers raised prices by 10% to 40% in affected grades.

The competitive disadvantage falls on small blenders without intermediate access and on feed makers with fixed-price contracts, which cannot pass costs on quickly. Large producers own intermediates, hold multi-source contracts, and spread cost across vitamins. Exposure also varies by segment, since cosmetic and stabilised grades carry higher margins that absorb cost swings better than feed grade esters. Cost control separates leaders from followers.
esterified-vitamins-market-cost-volatility-analysis-1789869890766

Multi-Source Intermediate Contracts With Price Indexation

Producers sign multi-season contracts with intermediate suppliers in several countries and index selling prices to intermediate and energy costs. Contracts cut spot purchases by roughly half and reduce margin swings by 10% to 20% in volatile years. The main challenge is buyer resistance, so producers offer transparent formulas and quarterly resets. Clear specifications build buyer trust.

Mix Shift Toward Stabilised and Cosmetic Grades

Producers shift capacity toward stabilised and cosmetic grades that carry higher margins and absorb cost swings. A shift of 10% of volume lifts gross margin by 4 to 7 points. The main challenge is qualification time, so producers run stability and safety programmes early and keep feed lines for core customers. Small buyers feel every input swing.

Dual-Region Plants and Buffer Stock

Producers operate plants in two regions and hold buffer stock so outages at one site do not stop supply. Buffer stock covers six to ten weeks of demand. The main challenge is capital and working capital, so producers prioritise high-margin accounts and stage new capacity carefully. Technical reach compounds over time. Audits repeat every year.

Portfolio Architecture for Margin Defence

Margins run from thin returns on feed grade vitamin A and E esters sold under annual contracts to strong returns on stabilised, encapsulated, and cosmetic grades sold with stability data and application support. Three tiers separate volume products, certified premium lines, and next-generation formats, and each tier draws on different customer groups, intermediate positions, and formulation platforms in a highly concentrated market.
The tension between volume and premium is sharp. Feed grade esters fill plants and protect intermediate contracts but face Chinese price competition and supply shocks, while stabilised and cosmetic grades earn higher margins on smaller volumes and depend on stability studies, safety files, and buyer trust. Producers that run only feed grades struggle when prices fall, while producers that run only premium lose scale. Supply contracts decide renewal. Delivery reliability decides supplier rankings.

High-value pools concentrate in vitamin C esters sold to cosmetic brands and in stabilised and encapsulated forms sold to premix, food, and supplement makers. They gather where buyers pay for stability, safety evidence, and dependable supply rather than kilograms. Specialty esters add a steady pool in clinical and infant nutrition. Margins follow sourcing discipline. Batch records protect future sales.

Volume / Commodity-Adjacent Tier

Feed grade vitamin A and E esters sold in bulk to premix and feed makers under annual contracts at thin margins, with intermediate cost pass-through and Chinese price competition. Cost control separates leaders from followers.
Gross Margin: 14%-24%

Premium / Certified Tier

Food-grade and supplement-grade esters with potency specifications, allergen controls, and audit certificates, sold to food and supplement makers that require consistent quality and traceability. Clear specifications build buyer trust. Small buyers feel every input swing.
Gross Margin: 20%-34%

Sustainability / Regulatory / Next-Generation Tier

Stabilised, encapsulated, and cosmetic grade esters with stability studies, safety files, and technical service, sold to premix and skin care brands that pay for performance and evidence. Technical reach compounds over time. Audits repeat every year.
Gross Margin: 26%-50%
esterified-vitamins-market-portfolio-architecture-1789869891090

High-value Sub-segments and Strategic Watch-out

Vitamin C Esters for Cosmetics and Food

Vitamin C esters for cosmetics and food combine the fastest growth with strong pricing, since skin care brands pay for stable brightening and antioxidant actives at gross margins of 32% to 50%. Cost per active and irritation concerns limit competition, and producers with cosmetic laboratories win.
Gross Margin: 32%-50%

Encapsulated and Stabilised Ester Formulations

Encapsulated and stabilised ester formulations deliver firm growth and pricing, since feed, food, and supplement makers pay for potency retention through heat and moisture. Coating capital and capacity matching form the entry barrier, and producers with application laboratories win. Repeat supply builds through long programmes with premix makers.
Gross Margin: 26%-40%

Vitamin E Esters

Vitamin E esters are the volume core, sold to feed, food, and cosmetic makers at moderate margins under annual contracts. Value grows about 5.2% a year, and intermediate access, purity, and delivery reliability decide profit. Producers anchor sales on long relationships with premix makers and cosmetic brands.
Gross Margin: 16%-28%

Vitamin A Esters

Vitamin A esters are the strategic watch-out, since growth of about 4.8% a year trails the market, European retinoid limits pressure cosmetics, and supply concentration causes price spikes. Producers should manage this line for margin and steer capacity toward vitamin C, stabilised, and encapsulated grades where evidence protects prices.
Gross Margin: 14%-26%

Why Formulators Keep Reordering Vitamin Esters

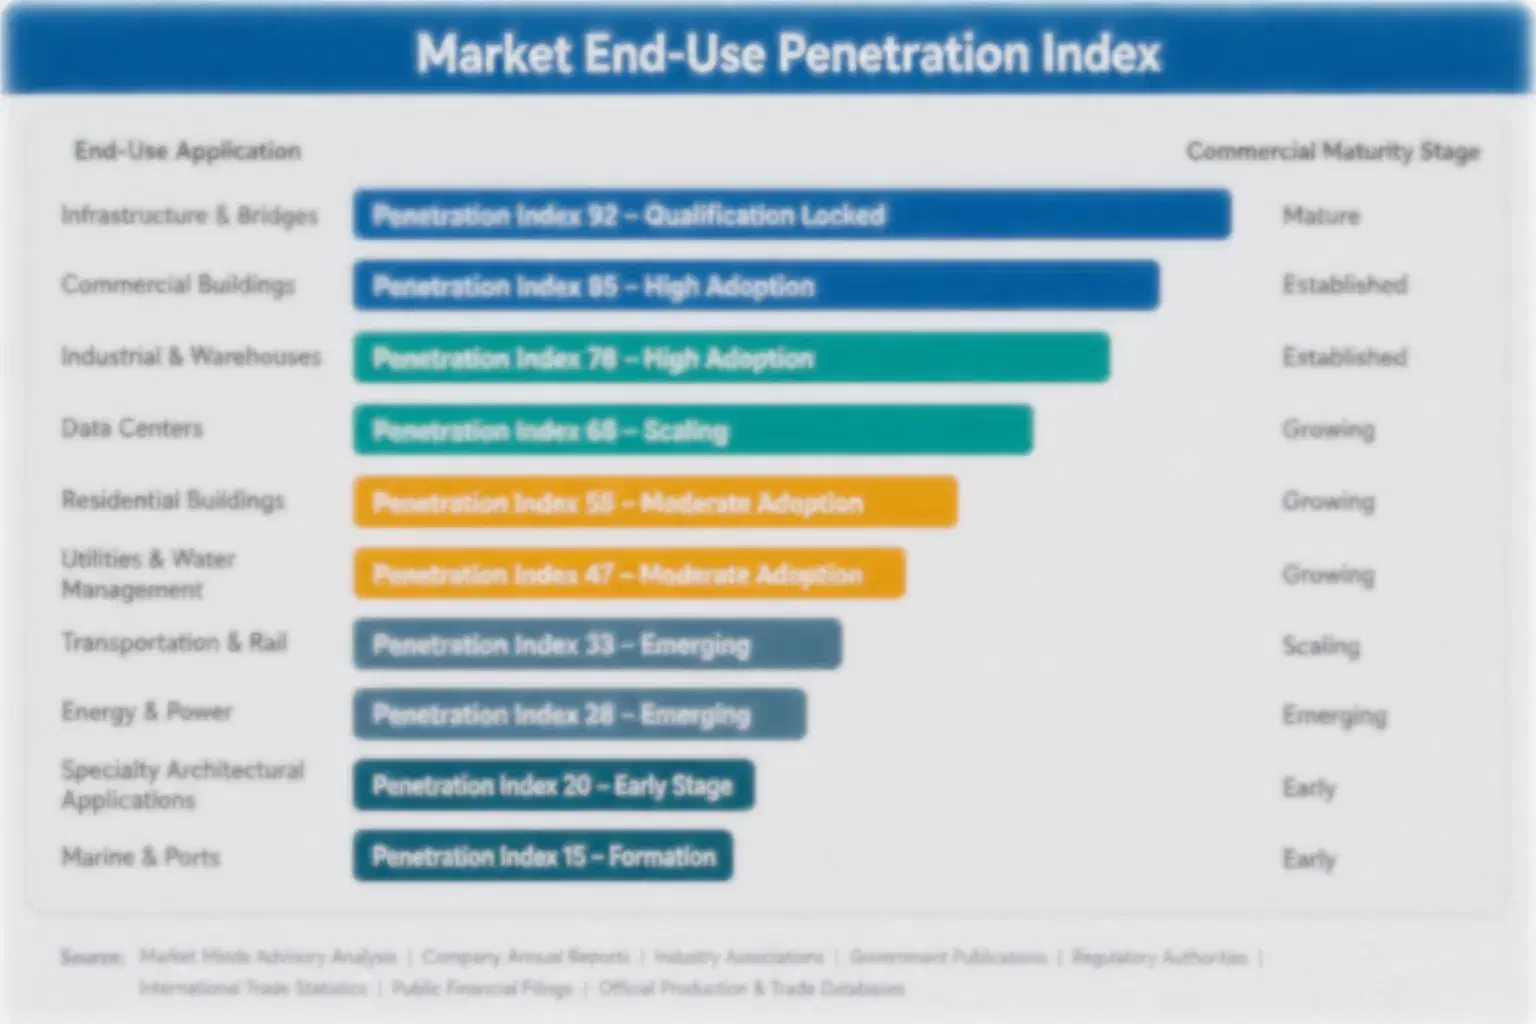
Esterified vitamin demand behaves like an annuity attached to approved premix formulas and product registrations. Once a maker qualifies an ester whose potency, stability, and documentation it trusts, it repeats the order every month or quarter, and switching means new stability tests, regulatory updates, and possible label changes. Buyers use last year's batch consistency and audit record to fix renewals, so producers with clean records earn steadier volume
Adoption stickiness differs by end-use vertical. Infant and clinical nutrition makers are the deepest, since the ester is written into registered formulas and changes only when quality or supply fails. Cosmetic brands follow registered formulas. Feed makers are moderate and switch on cost, while small supplement resellers are shallow and buy through distributors. Buyers review suppliers every season. Supply contracts decide renewal. Margins follow sourcing discipline.

Buyer profiles are shifting between generations. Older buyers bought vitamins on price and long supplier relationships, while younger teams ask for stability data, clean labels, supply resilience, and sustainability proof. Retailers and regulators add a third group that sets safety and claim rules. Producers that publish stability data and offer dual-region supply win younger buyers and keep them as disruptions recur.
esterified-vitamins-market-end-use-penetration-index-1789869891423

MMA Verdict on Esterified Vitamin Strategy

These are among the four positions where our research anticipates prominent divergence between winners and laggards over the coming forecast period. Each is grounded in the demand model, the regulatory perimeter, and the announced capacity pipeline.
01 / STABILISED FORMULATION STRATEGY

Shift Volume Into Stabilised Formulations Before Premix Makers Choose Rival Vitamin Suppliers

Encapsulated and Stabilised Ester Formulations grows at 7.6% a year, about 1.31 times the overall market rate, and gross margins of 26% to 40% compare with 14% to 24% for plain esters. Producers should invest $5 million to $20 million in coating, spray-drying, and antioxidant systems, shift 10% of volume into stabilised grades, and lift gross margin by 4 to 7 points. Those that stay in plain esters will lose margin as Chinese prices fall, while producers with stabilised grades keep premium accounts.
02 / COSMETIC PROGRAMME STRATEGY

Build Cosmetic Vitamin C Ester Programmes Before Rivals Lock Skin Care Formulations

Vitamin C Esters for Cosmetics and Food grows at 9.4% a year, about 1.62 times the overall market rate, and gross margins of 32% to 50% reflect brand demand for stable brightening and antioxidant actives. Producers should invest $0.5 million to $2 million in cosmetic laboratories, stability data, and irritation studies, target brightening and anti-ageing brands first, and publish results in common bases, lifting sales per customer by 10% to 18%. Those without dossiers will lose accounts, and producers with evidence hold premiums for years.
03 / INTERMEDIATE SUPPLY STRATEGY

Contract Multi-Source Intermediates Before Plant Outages Erase Vitamin Ester Margins Again

Intermediates take about 44% of cost, vitamin prices moved 40% to 150% in disruption years, and lagged pass-through cut margins across feed grade esters. Producers should contract citral, isophytol, and ascorbic acid from several sources, index selling prices, hold safety stock, and recover 60% to 80% of cost moves within a quarter. Those that stay on spot purchases will absorb every swing, and producers with contracted supply will hold margin, volume, and buyer confidence through the next full cycle of plant and energy shocks.
04 / SUPPLY RESILIENCE STRATEGY

Build Dual-Region Production Before Single-Site Disruptions Push Customers to Rival Suppliers

Fires and inspections at one site can remove global supply, and customers now value continuity as much as price. Producers should invest $30 million to $120 million in plants in a second region, share process control across sites, hold buffer stock of six to ten weeks, and qualify sites to one standard, cutting customer supply disruption risk by 40% to 60%. Those that stay concentrated will lose accounts after each outage, and producers with resilient supply will hold premium relationships for many years.

Engagement Snapshot From the Field

A live engagement with an industry participant carrying material or product regulatory and market exposure ahead of a defining policy shift, showing how our research translates into a defensible multi-year portfolio strategy.
MARKET MINDS ADVISORY · CLIENT ENGAGEMENT SUMMARY
Esterified Vitamins Producer Strategic Portfolio Review and Transition Roadmap 2026·Investment Scenario on Esterified Vitamins Exposure Evaluation 2025-26
CLIENT PROFILE
The client is a mid-sized European cosmetic and skin care brand with annual sales near $330 million (client-reported, unverified by MMA), selling serums, creams, and sun care through pharmacies, perfumeries, and online channels in nine countries. It used ascorbic acid and tocopherol in 12 products, faced oxidation complaints, and had trialled vitamin C esters in one serum.
STRATEGIC CHALLENGE
Serums oxidised and yellowed on shelf, consumer complaints rose, and one vitamin supplier had delayed shipments after a plant outage. Management needed to decide whether to adopt stabilised vitamin C esters across the range, add a second supplier, or reformulate with lower doses, with limited capital and a product refresh cycle approaching.
MMA APPROACH
MMA analysed cost, stability, and complaint data across 18 products, interviewed nine cosmetic formulation, procurement, and regulatory experts and four suppliers, and ran stability tests and a consumer survey on brightening claims across three countries. It modelled cost by formulation scenario, tested supply and price cases, and ranked options by payback and execution risk.
KEY FINDINGS
  1. Vitamin C esters would add about 15% to active cost but cut oxidation complaints by more than half (client-reported, unverified by MMA). Batch records protect future sales.
  2. Stability tests showed ester grades held colour and potency in serum bases for two years. Cost control separates leaders from followers. Clear specifications build buyer trust.
  3. Products with stable brightening claims could earn a price premium of about 10% in pharmacy and online channels. Small buyers feel every input swing.
  4. Two qualified suppliers in different regions would add about 3% to cost but cut supply risk by about half. Technical reach compounds over time.
CLIENT PROFILE
The client is a mid-sized European cosmetic and skin care brand with annual sales near $330 million (client-reported, unverified by MMA), selling serums, creams, and sun care through pharmacies, perfumeries, and online channels in nine countries. It used ascorbic acid and tocopherol in 12 products, faced oxidation complaints, and had trialled vitamin C esters in one serum.
STRATEGIC CHALLENGE
Serums oxidised and yellowed on shelf, consumer complaints rose, and one vitamin supplier had delayed shipments after a plant outage. Management needed to decide whether to adopt stabilised vitamin C esters across the range, add a second supplier, or reformulate with lower doses, with limited capital and a product refresh cycle approaching.
MMA APPROACH
MMA analysed cost, stability, and complaint data across 18 products, interviewed nine cosmetic formulation, procurement, and regulatory experts and four suppliers, and ran stability tests and a consumer survey on brightening claims across three countries. It modelled cost by formulation scenario, tested supply and price cases, and ranked options by payback and execution risk.
KEY FINDINGS
  1. Vitamin C esters would add about 15% to active cost but cut oxidation complaints by more than half (client-reported, unverified by MMA). Batch records protect future sales.
  2. Stability tests showed ester grades held colour and potency in serum bases for two years. Cost control separates leaders from followers. Clear specifications build buyer trust.
  3. Products with stable brightening claims could earn a price premium of about 10% in pharmacy and online channels. Small buyers feel every input swing.
  4. Two qualified suppliers in different regions would add about 3% to cost but cut supply risk by about half. Technical reach compounds over time.
RECOMMENDED STRATEGY
Phase 1: Phase 1 (Months 1-6): Qualify two ester suppliers in different regions, finalise stability tests, and confirm claims. Audits repeat every year. Phase 2: Phase 2 (Months 7-24): Reformulate serums and creams with stabilised esters and sign multi-year supply agreements. Buyers review suppliers every season. Phase 3: Phase 3 (Months 25-42): Extend esters to sun care, audit suppliers yearly, and review stability and cost quarterly. Supply contracts decide renewal.
OUTCOME
Within 42 months, stabilised esters featured in 14 products, oxidation complaints fell by 60%, and gross margin on affected lines rose by 2.0 points (client-reported, unverified by MMA). The client held potency performance, raised repurchase by 5%, and held stockouts below 3%. Delivery reliability decides supplier rankings. Margins follow sourcing discipline.

Frequently Asked Questions

Foundational context covering the market sizes, CAGR, scope, country, region and competition that inform every finding below. This section is provided to cover basics and most often pre-purchase conversations, answered from the MMA Primary Research Dataset.

What is the current size of the Esterified Vitamins Market?

The global esterified vitamins market was valued at $3.40 billion in 2025 on a producer-value basis. Growth is supported by feed volumes and cosmetic vitamin C, offset by supply concentration and retinoid limits.

How large will the Esterified Vitamins Market be by 2036?

The market is projected to reach $6.32 billion by 2036, up from $3.60 billion in 2026. The increase of $2.72 billion reflects vitamin C esters, stabilised formulations, and steady feed demand.

What is the CAGR for the Esterified Vitamins Market 2026 to 2036?

The market is forecast to grow at a 5.8% CAGR from 2026 to 2036. The bull case reaches 7.2% and the bear case 4.5%, depending on cosmetic adoption, intermediate supply, and retinoid rules.

Which segment is growing fastest?

Vitamin C Esters for Cosmetics and Food is the fastest-growing segment at 9.4% CAGR, roughly 1.62 times the overall market rate. Encapsulated and Stabilised Ester Formulations follows at 7.6% CAGR each year.

Who are the major companies in the Esterified Vitamins Market?

Major companies include DSM-Firmenich, BASF, Zhejiang NHU, Zhejiang Medicine, and Adisseo. Northeast Pharmaceutical Group, CSPC Pharmaceutical, Prinova Group, Balchem, and Evonik also hold meaningful positions.

Which country is growing fastest?

India is growing fastest at about 8.4% CAGR, because feed, supplement, and cosmetic demand is expanding and local producers are adding capacity. China follows through production and domestic demand.

Report Segmentation Architecture

The full report scope spans multiple orthogonal segmentation dimensions, with cross-tabulated demand data provided for each dimension pair. Coverage extends further to regional breakdowns, trend trajectories, and the competitive detail needed to support segment-level decision-making.

By Primary Market Dimension

  • Vitamin A Esters
  • Vitamin E Esters
  • Vitamin C Esters for Cosmetics and Food
  • Other Vitamin and Specialty Esters
  • Encapsulated and Stabilised Ester Formulations

By End-Use Industry

  • Animal Feed and Premixes
  • Food Fortification
  • Dietary Supplements
  • Cosmetics and Personal Care
  • Pharmaceuticals and Clinical Nutrition

By Commercial Dimension

  • Direct Supply Contracts
  • Premix Blenders
  • Ingredient Distributors
  • Co-Development Agreements
  • Private Label Supply

By Region

  • East Asia
  • Western Europe
  • North America
  • South Asia and Pacific
  • Latin America
  • Middle East and Africa
  • Eastern Europe

Scope, Methodology, and Coverage

Every figure in this report is reproducible from documented input assumptions. The scope below maps the historical period, the forecast horizon, the segmentation dimensions, and the countries covered, alongside the underlying primary and qualitative methodology.
Historical Period
2020 to 2025
Forecast Period
2026 to 2036
Base Year
2025 (USD billions; MMA Primary Research Dataset, September 2026)
Market Definition
The market covers global sales of esterified vitamins, valued at producer level, including vitamin A esters such as acetate and palmitate, vitamin E esters such as tocopheryl acetate and succinate, vitamin C esters such as ascorbyl palmitate, phosphate, and glucoside, other vitamin and specialty esters, and encapsulated and stabilised ester formulations. The scope excludes non-esterified vitamins sold on their own, provitamins such as beta-carotene, and finished supplements, feeds, or cosmetics.
Quantitative Units
USD billions (producer value); tonnes of vitamin ester for volume references
Segmentation Dimensions
By Vitamin Family and Formulation; By End-Use Industry; By Commercial Dimension; By Region
Regions Covered
East Asia, Western Europe, North America, South Asia and Pacific, Latin America, Middle East and Africa, Eastern Europe
Countries Covered
China, Japan, South Korea, India, Indonesia, Vietnam, Australia, Germany, Netherlands, France, Switzerland, United Kingdom, United States, Canada, Brazil, Mexico, Argentina, Egypt, Turkey, South Africa, Poland, and additional markets relevant to this sector
Key Companies Profiled
DSM-Firmenich, BASF, Zhejiang NHU, Zhejiang Medicine, Adisseo, Northeast Pharmaceutical Group, CSPC Pharmaceutical, Xinfa Pharmaceutical, Prinova Group, Balchem, Kemin Industries, Evonik, Croda, Symrise, Ashland, Resonac, Sabinsa, Brenntag, IMCD, Univar Solutions
Quantitative Methodology
Primary survey, n=3,800 respondents, Q4 2025, six countries; demand-side model with trade association cross-validation
Qualitative Methodology
47 expert interviews, Q4 2025; applied to validate demand model assumptions, identify emerging dynamics, and assess competitive positioning
Report Format
PDF and XLSX data workbook (Word format preview document)
Publisher
Market Minds Advisory
Report Code
MMA-2026-HLT-699
Published
September 2026
Contact
sales@marketmindsadvisory.com | www.marketmindsadvisory.com

Purchase the full Esterified Vitamins Market Report (2026 to 2036).

The full report delivers a detailed assessment of the global esterified vitamin market through 2036, covering vitamin family, end-use, and regional forecasts, competitive benchmarking of leading producers, and input cost analysis. It combines MMA primary research, including a six-country survey of 3,800 respondents and 47 expert interviews, with public statistical and company data. Analysts also model intermediate supply scenarios, cosmetic adoption paths, and retinoid rule changes. Clients receive segment margin ranges, plant location maps, and a case study on cosmetic vitamin sourcing strategy. Producer programme and contract frameworks are also included for planning.
Ten-year vitamin family and end-use demand forecasts
Intermediate, energy, and freight cost tracking
Competitive benchmarking of top twenty producers
Cosmetic and feed rule tracker updates
Regional supply and trade flow analysis included
Quarterly primary survey data update access

Built For The People Who Decide

From boardroom strategy to bench-side execution, this report is read cover-to-cover by leaders shaping the next decade of their industry, turning demand scenarios, market dynamics and valuation benchmarks into decisions.
CXOs/ Presidents/ VPs/ Managers
M&A and Corporate Development
Strategy Teams and R&D Heads
Procurement and Product Directors
Regulatory and Compliance Leaders
Investor Relations and Equity Analysts