Market Minds Advisory
Epoxy Paint Thinner Market

Epoxy Paint Thinner Market: Warranty-Linked Branding, Exempt Solvent Substitution, and a Shrinking Dilution Requirement

Using the wrong thinner voids the coating warranty, which is why more than half of all volume carries the coating manufacturer's own label on a product that is essentially blended solvent.

Lead Analyst

Bilal Shaikh

Published

September 2026

Make Smarter Decisions with Customized Research Insights

Request a free sample report and evaluate market opportunities, growth trends, and competitive dynamics relevant to your business needs.

2025 MARKET VALUE$1.4BMarket Size 2025
2036 FORECAST VALUE$2.2BBase Case , 2026 to 2036
CAGR 2026 TO 20364.3 %Bull 5.4% / Bear 3.1%
INCREMENTAL OPPORTUNITY$0.8BNet 10- year value creation
EXPANSION MULTIPLE1.52x2036 value over 2026 base
Strategic Levers
M&A Pipeline
Regional Outlook
Country Rankings
Competitive Intelligence
Segmental Deep-dive
Call-Us : 91 93563 13602

Executive Snapshot and Market Trajectory

A thinner is blended solvent that costs very little to make and carries an outsized commercial position, because applying the wrong one to an epoxy coating voids the warranty. That single fact explains why coating manufacturers brand their own and why applicators buy them. Chemistry barely matters. Liability does.
Commercial power sits with coating manufacturers who tie thinner selection to warranty terms rather than with the blenders producing the solvent mixtures. Exempt and low emission blends grow fastest at 9.8%, roughly 2.28 times the market, wherever regulation restricts conventional solvent content. East Asia holds 30% of global value, carried by Chinese shipbuilding, infrastructure maintenance, and industrial coating application across the region.
Concentration is very low at roughly 23% for the top five, because blending is simple and freight economics keep it local everywhere. Base solvent is 71% of cost, which leaves blenders competing on a thin sliver of value. High solids coatings requiring less dilution are the persistent headwind beneath everything. Every reformulation toward higher solids removes thinner volume permanently rather than shifting it somewhere else in the market. Marine and tank lining hold the remainder.
Market Definition
The market comprises solvent blends formulated for diluting, cleaning, and adjusting the application properties of epoxy coatings, covering aromatic hydrocarbon blends, ketone-based blends, glycol ether blends, ester and alcohol blends, and exempt and low emission solvent blends. Value is measured at supplier level across branded coating manufacturer thinners and independent blended products. Base solvents sold as commodities, coating resins and hardeners, general purpose degreasers, waterborne coating additives, and application equipment fall outside scope.
Base Year Value
$1.4B in 2025 (MMA Primary Research Dataset, August 2026)
Forecast Period
2026 to 2036, eleven discrete annual values
CAGR
4.3% base case. Bull 5.4%. Bear 3.1%.
Fastest Growth Segment
Exempt and Low-VOC Solvent Blends: 9.8% CAGR
Fastest Growth Country
India: 7.2% CAGR
Fastest Growth Region
South Asia and Pacific: 6.3% CAGR
Largest Region
East Asia: 30% of 2025 global value
Market Leaders
Eastman Chemical, Dow, Shell Chemicals, AkzoNobel, and PPG Industries lead on epoxy thinner and base solvent supply. Source: company annual reports and MMA Analysis, July 2026.
Primary Survey
n=3,800 procurement and R&D decision-makers, Q4 2025, six countries
Methodology
Demand-side build-up, cross-validated against public data, 47 expert interviews

Epoxy Paint Thinner Market Forecast Scenarios

epoxy-paint-thinner-market-trends-size-forecast-scenario-1787549506343
Between 2020 and 2025 regulation squeezed volume while price carried value. Volatile organic compound limits pushed coating manufacturers toward higher solids formulations needing less dilution, which reduced thinner litres per litre of coating applied across most markets. Solvent feedstock prices moved sharply through 2021 and 2022 and were passed through directly. The 3.3% historical growth reflects declining dilution requirements largely offset by higher prices per litre.
The 4.3% base case rests on three mechanisms. Marine, tank lining, and heavy protective applications continue requiring solvent-borne epoxy for film build and cure behaviour that waterborne alternatives cannot match, which sustains the dilution demand behind them. Exempt solvent blends command higher prices where regulation restricts conventional chemistry. And infrastructure maintenance across Asia and the Middle East keeps expanding the coated surface area requiring periodic recoating. Only the third of those three adds genuinely new coated area.
The 5.4% bull case assumes infrastructure maintenance spending holds and exempt solvent pricing sustains as adoption broadens. The 3.1% bear case reflects further high solids conversion reducing dilution requirements, waterborne epoxy taking protective applications previously considered unreachable, and generic thinner substitution eroding branded volumes in price-sensitive markets. Coating reformulation decides more than any regulatory decision here.

Selling Solvent Attached to a Warranty

Three things set the commercial shape of this market. Warranty linkage comes first, because a coating manufacturer specifies its own thinner and disclaims liability if another is used, which converts a commodity into a branded product without changing the chemistry at all. Regulation comes second and is steadily reducing how much dilution any coating needs. Solvent cost comes third at 71% of value.
TOP-FIVE CONCENTRATION23%Share of global thinner supply held by leading producers
AVERAGE SELLING PRICEUSD 2.30 per litreBlended pricing across conventional and low emission formulations
BRANDED THINNER SHARE56%Portion sold under the coating manufacturer's own label
SOLVENT COST SHARE71%Base solvent input within total blended thinner cost
MARINE AND PROTECTIVE SHARE38%Portion of demand from marine and protective coating application
DILUTION RATIO RANGE12%Typical thinner addition by volume during coating application
The branded position is worth examining. A thinner sold under a coating brand costs the applicator considerably more than a chemically equivalent generic, and applicators buy it anyway because a coating failure on a bridge, tank, or hull becomes an argument nobody wants to have with a warranty clause in the way. That is a genuinely durable commercial position resting on liability rather than performance.
The pressure runs the other way. High solids and solvent-free epoxy formulations require less dilution or none at all, and every reformulation toward them removes thinner volume permanently. Marine, tank lining, and heavy maintenance applications still need solvent-borne systems for film build and low temperature cure, which is where the remaining demand concentrates and why it holds.
"This is the only chemicals market I know where a company sells a competitor's molecules at a premium purely because its own warranty says so. The generic in the next drum is identical and applicators still pay, because arguing about a failed tank lining is far more expensive than the thinner ever was."
Practice Director, Coatings and Industrial Solvents · MMA Chemicals and Materials Practice · August 2026

Market Trends

Exempt Solvent Blends Command Premiums Where Limits Bite

Regulations counting volatile organic compound content exclude certain solvents deemed to have negligible photochemical reactivity, and blends built around those exempt materials let applicators meet limits without abandoning solvent-borne coatings entirely. Acetone, tert-butyl acetate, and parachlorobenzotrifluoride all appear in such formulations. Cost per litre runs well above conventional aromatic and ketone blends, and applicators pay because the alternative is reformulating to a coating system they do not want. Exempt blends grow at 9.8% against a market growing 4.3%, and the premium reflects regulatory necessity rather than any performance advantage delivered.
Market Impact: Marine and protective take 38%
Generic Substitution Threatens Branded Volumes in Emerging Markets

A branded thinner and a competent generic are chemically indistinguishable, and in markets where warranty enforcement is weak, applicators substitute freely to save money on a consumable representing a small fraction of project cost. The consequence appears later as coating failures attributed to the coating rather than to the thinner, which damages the coating manufacturer's reputation without any recourse available. Branded share sits at 56% globally and considerably lower in price-sensitive markets. Manufacturers respond with authentication features, applicator training, and warranty enforcement that varies enormously in effectiveness by region. Enforcement varies enormously by market.
Market Impact: Recoating cycles run 8 years

Market Opportunities and Growth Drivers

Marine and Protective Applications Sustain Solvent-Borne Demand

Ship hulls, ballast tanks, storage tank linings, and heavy structural steel all require film builds, cure behaviour at low temperature, and chemical resistance that waterborne epoxy systems have not matched despite decades of development effort. Those applications take 38% of thinner demand and are the least likely to convert away from solvent-borne chemistry within the forecast period. Shipyard and maintenance contractors applying in cold or humid conditions depend on thinner selection to control flow, sag, and cure timing. That technical dependence is what keeps the demand attached to specific formulations.
Market Impact: Dilution now averages 12%

Infrastructure Maintenance Expands the Coated Surface Requiring Recoating

Bridges, pipelines, storage tanks, water infrastructure, and industrial plant across Asia, the Middle East, and Latin America have been built at pace over recent decades and now require periodic recoating on cycles measured in years. Each maintenance campaign consumes coating and the thinner needed to apply it under whatever conditions prevail on site. This demand grows with the installed asset base rather than with new construction, which makes it steadier than any project-driven volume. Application conditions on maintenance work are frequently worse than in a shop, raising thinner requirements further.
Market Impact: Solvent is 71% of cost

Market Restraints and Challenges

High Solids Coatings Reduce Dilution Volume Permanently

Coating manufacturers have reformulated steadily toward higher solids content to meet emission limits, and each step reduces the thinner required per litre applied or eliminates it entirely. The root cause is regulatory rather than technical preference, since applicators generally find lower solids coatings easier to apply. Every conversion removes volume that never returns. Blenders and coating manufacturers mitigate by concentrating on applications where high solids cannot yet deliver required film properties, and by capturing value through exempt solvent formulations where regulation permits solvent use at all. Marine and tank lining remain the exceptions.
Market Impact: Exempt blends grow at 9.8%

Base Solvent Cost Leaves Blenders With Very Little Margin

Base solvent purchased from petrochemical producers represents 71% of blended thinner cost, and the blending operation itself adds mixing, filling, and packaging rather than any chemical transformation. The root cause is that thinner formulation, while genuinely requiring knowledge of evaporation rates and solvency parameters, does not create molecules. Independent blenders therefore compete on a thin sliver of value against coating manufacturers who capture warranty-linked pricing. Mitigation runs through formulation service, private label supply to coating brands, and regional distribution reach rather than any manufacturing advantage. Regional reach is the only real defence available.
Market Impact: Branded share sits at 56%
4 additional market trends, 3 additional growth drivers, and 2 additional restraints and challenges are covered in the full report. Contact sales@marketmindsadvisory.com to access the complete intelligence.

Segment CAGR and Growth Architecture

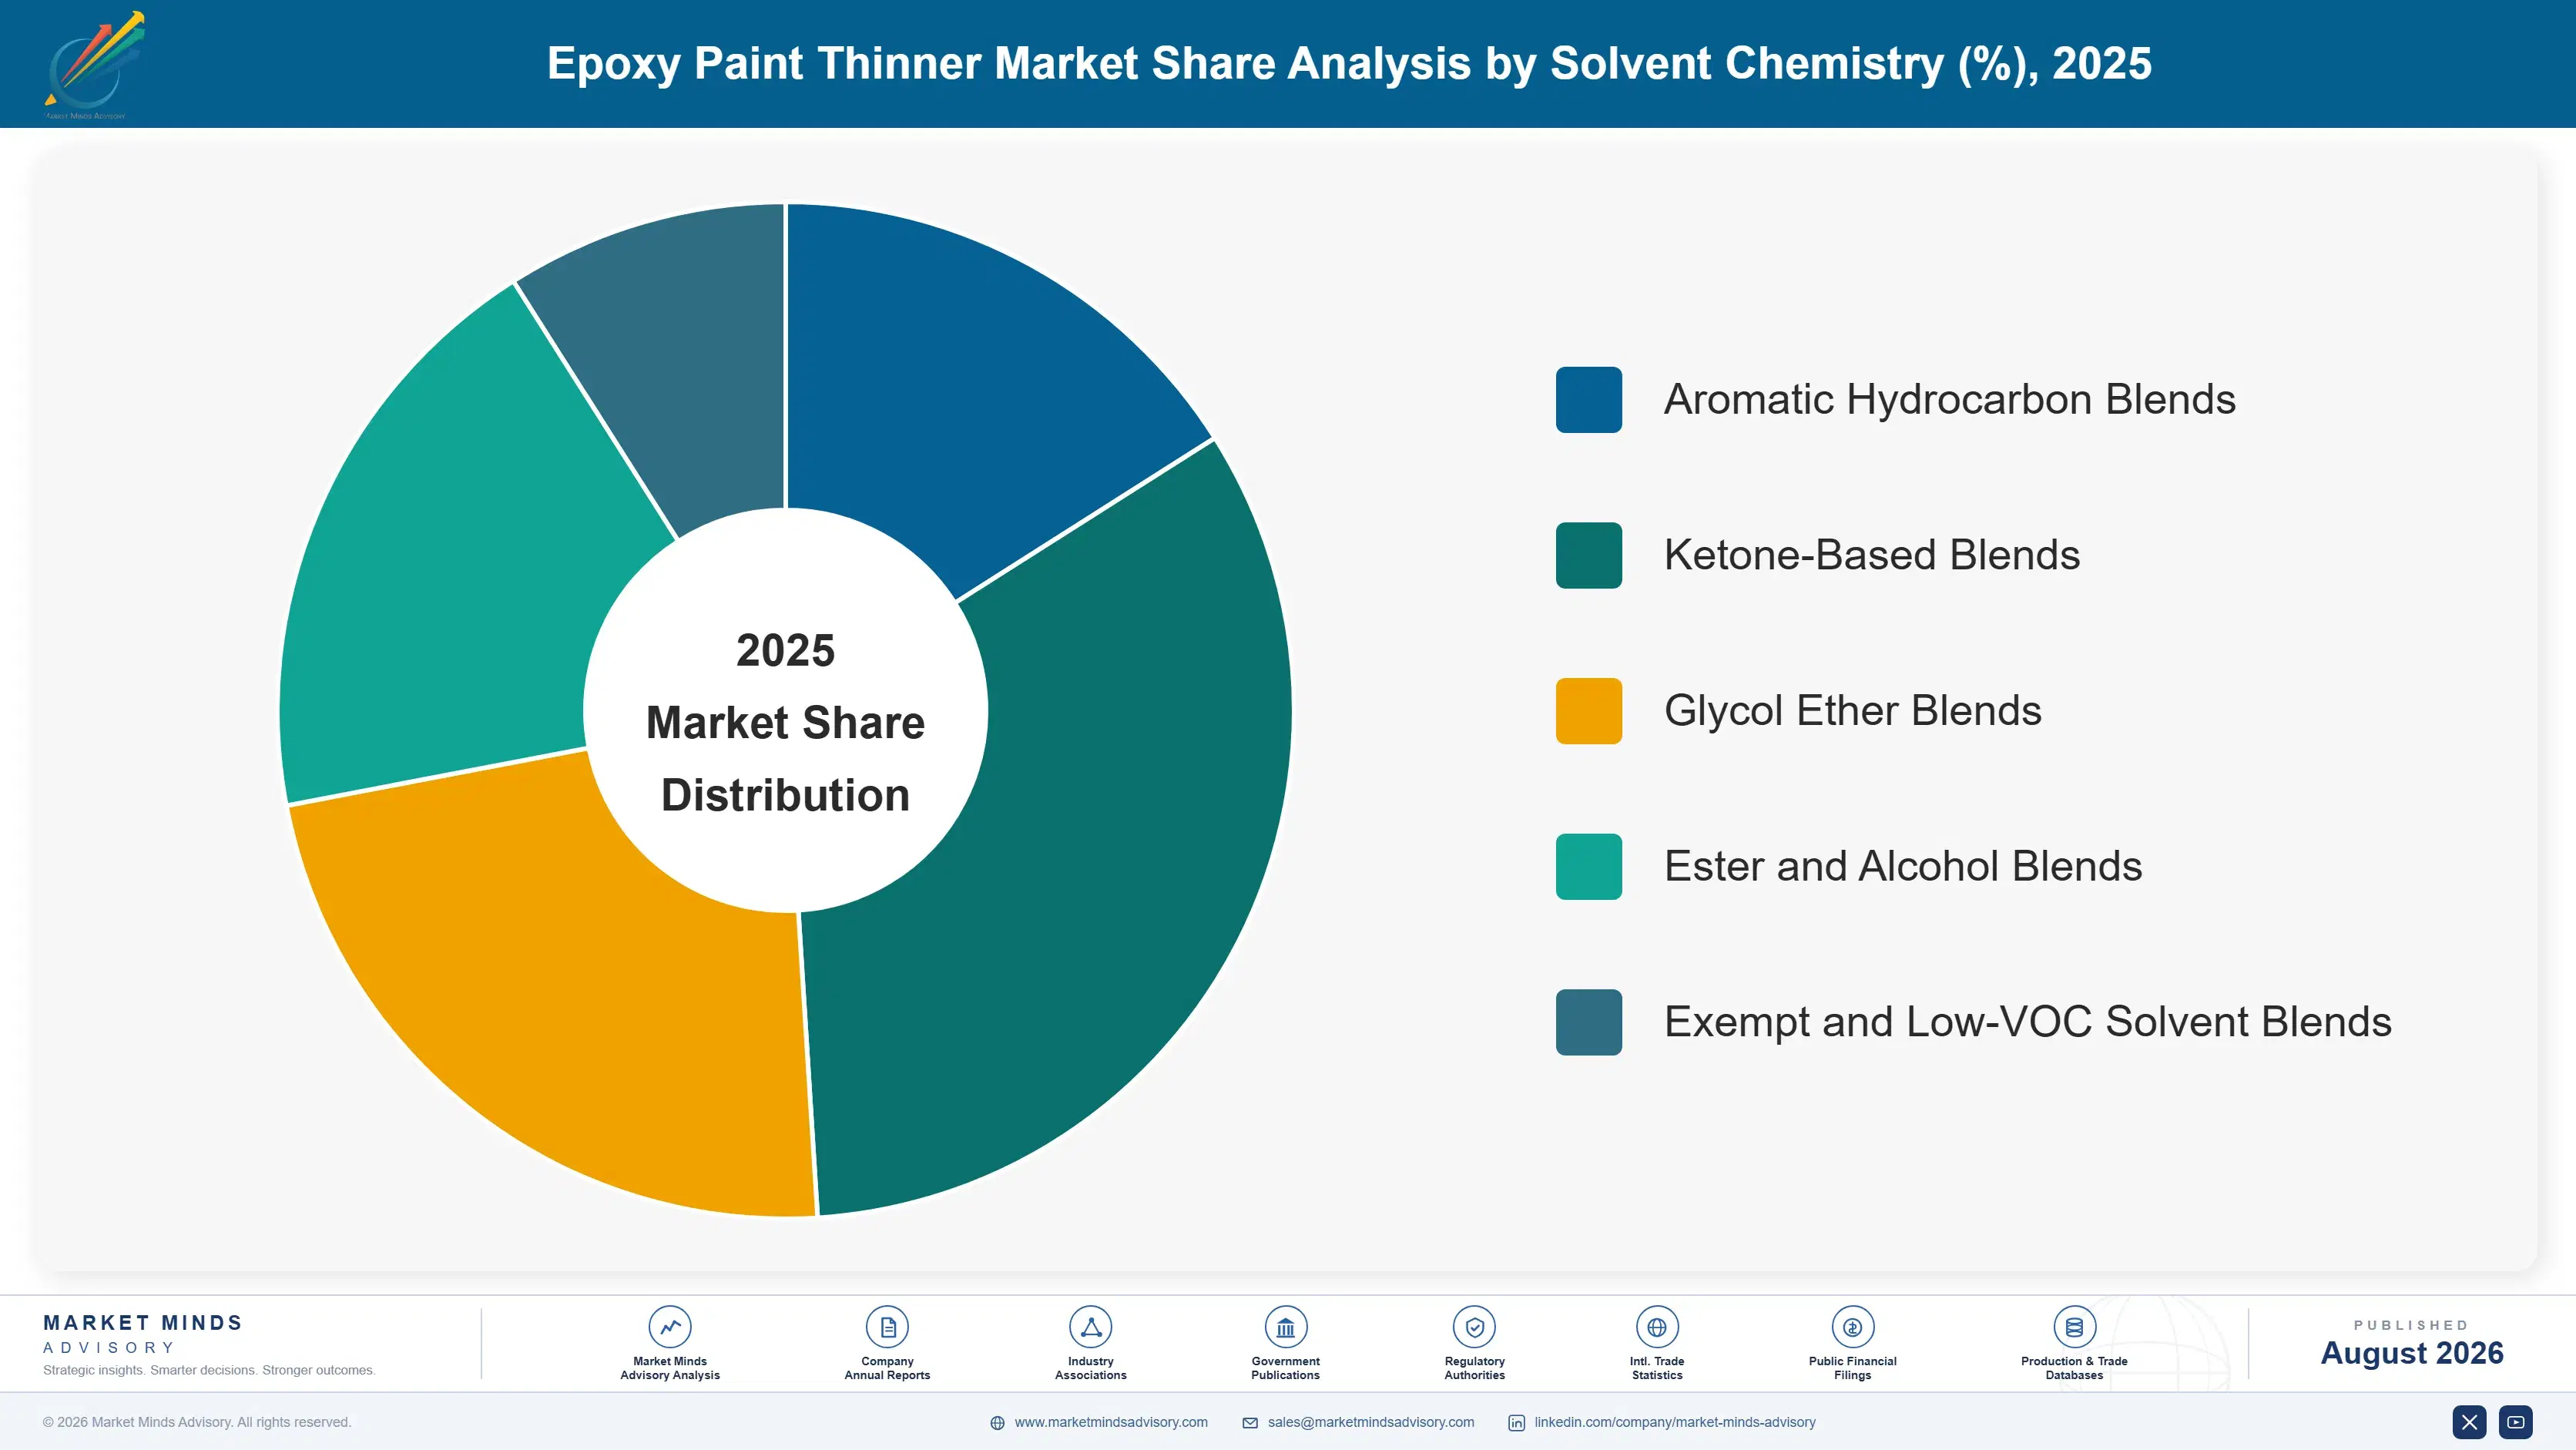
Segmentation follows solvent chemistry, because the blend determines evaporation rate, solvency for epoxy resins, regulatory classification, and behaviour at the temperatures where a coating is actually applied. Five chemistry families cover commercial supply, and blends combine them, which means share shifts happen through reformulation driven by regulation rather than through applicator preference. Application temperature matters as much as chemistry.
epoxy-paint-thinner-market-trends-market-share-analysis-1787549506917

Exempt and Low-VOC Solvent Blends

The fastest-growing family at 9.8%, roughly 2.28 times the market, and growing purely on regulatory arithmetic. Blends built around solvents excluded from volatile organic compound counting let applicators meet limits while continuing to use solvent-borne epoxy systems that perform in ways waterborne alternatives still cannot match. Cost per litre runs well above conventional blends and applicators accept it because the alternative is changing the coating entirely. Evaporation behaviour differs from the aromatic and ketone blends applicators are used to, which requires retraining and occasionally causes application problems that get blamed on the material rather than the technique. Suppliers arriving with training as well as product own the resulting relationship. Training is the differentiator.
CAGR 9.8%

Ester and Alcohol Blends

Second fastest at 5.6%, offering lower toxicity profiles and often better regulatory positioning than aromatic hydrocarbons without the cost of fully exempt formulations. Esters provide good epoxy solvency with moderate evaporation rates suited to a wide temperature range, and alcohols adjust flow and levelling. Occupational exposure concerns around aromatic solvents in confined spaces such as ballast tanks and vessel interiors have driven substitution independently of emission regulation. The trade-off is cost and, for some ester chemistries, moisture sensitivity that matters in humid application conditions. Marine contractors have adopted them faster than general industrial applicators have. Confined space exposure limits have driven substitution independently of any emission regulation, particularly across ballast tank and vessel interior work.
CAGR 5.6%
Full segment breakdown across 5 segments available in the complete report.

Regional Architecture and Country Demand Map

Regional shares follow protective and marine coating application rather than coating consumption generally, since decorative paints require little thinning. Regulatory stringency then determines which chemistries can be used and how much dilution is permitted at all. Application temperature then requires formulations that temperate market products do not provide.

North America

Volatile organic compound rules vary by state and by air quality district, which produces a genuinely complicated compliance picture where a formulation legal in one county is not in the next. Californian rules are the strictest and have driven exempt solvent adoption further here than anywhere. Industrial maintenance across refining, petrochemicals, and pipelines generates substantial recoating demand on ageing infrastructure. Warranty enforcement is strong and litigation risk real, which sustains branded thinner share well above the global average. Coating manufacturers rather than independent blenders capture most value. Growth of 4.7% blends declining dilution volumes with exempt solvent pricing and steady maintenance activity. District-level rules complicate compliance considerably. Litigation risk sustains branded discipline.
Share: 24% | CAGR: 4.7% (2026 to 2036)

Western Europe

Emission regulation is comprehensive and long-established, which drove high solids and waterborne conversion earlier and further than any other region and correspondingly reduced thinner volumes. What remains concentrates in marine, offshore, and heavy protective work where solvent-borne systems are still required for film build and cure performance. Occupational exposure rules in confined spaces have pushed substitution away from aromatic solvents independently of emission limits. Shipyards and offshore maintenance contractors are the principal buyers. Growth of 2.9% is the slowest in the report, reflecting a market where regulation has already removed most of the volume that could be removed. Occupational limits drove substitution independently. Marine work carries most remaining volume. Volumes have already been largely removed.
Share: 19% | CAGR: 2.9% (2026 to 2036)
Regional intelligence for 5 additional markets available in the complete report: East Asia, South Asia and Pacific, Latin America, Middle East and Africa, Eastern Europe. Contact sales@marketmindsadvisory.com.
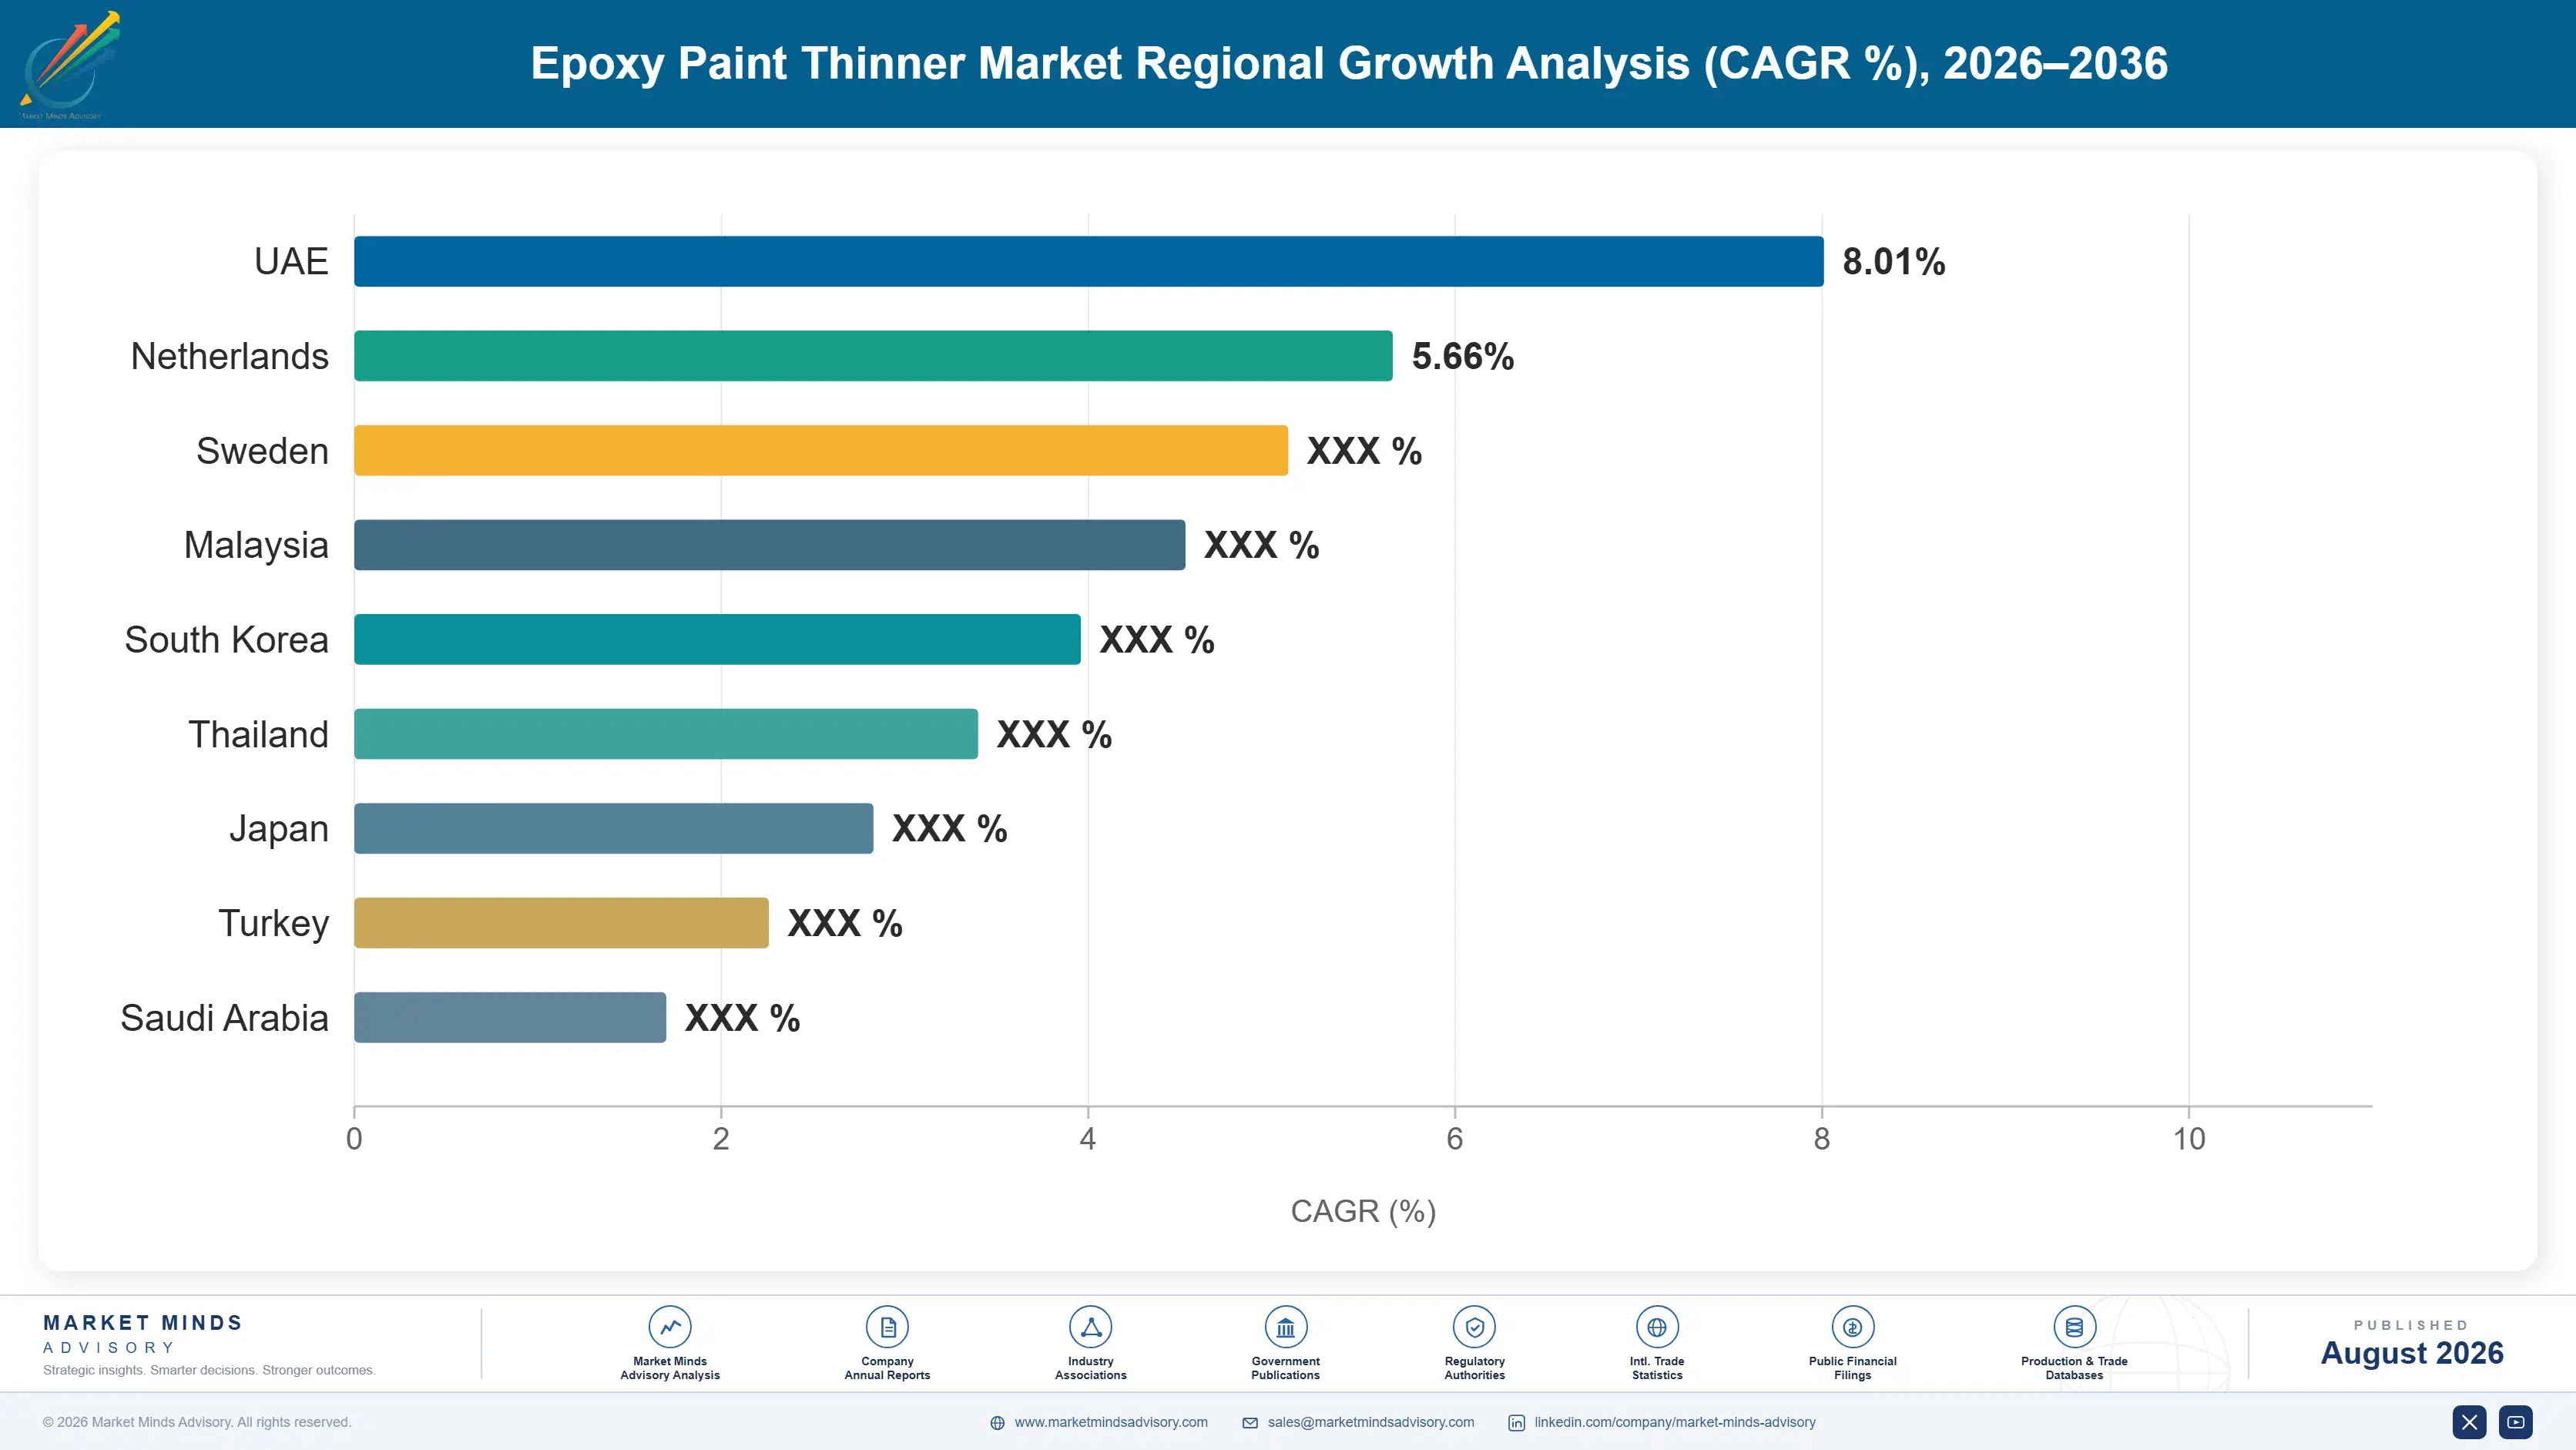
epoxy-paint-thinner-market-trends-country-cagr-analysis-1787549507434

Four Moves That Change the Economics

Advantage here comes from warranty linkage, exempt formulation capability, and regional application knowledge rather than from blending, which requires very little that competitors lack. Four moves are worth capital and management attention across the forecast period, and the first is available only to coating manufacturers. The other three are open to independent blenders as well.

Enforce warranty linkage where substitution is eroding share

A branded thinner and a competent generic are chemically indistinguishable, and branded share sits at 56% globally and far lower where warranty terms go unenforced. Authentication features, applicator training, and consistent warranty position recover volume that costs nothing to produce beyond what is already being made. Recovering branded share in a weakly enforced market typically lifts thinner revenue 20 to 35% with no change to the product at all. It requires commercial discipline and applicator communication rather than any reformulation work. No reformulation or manufacturing change is required at all.
Market Impact: Lifts thinner revenue by 20 to 35% overall

Formulate exempt blends before limits force the issue

Blends built around solvents excluded from emission counting let applicators keep using solvent-borne epoxy systems where limits would otherwise force a coating change they do not want. Those blends command prices well above conventional formulations and grow at 9.8% while the market grows 4.3%. Evaporation behaviour differs enough to require applicator retraining, which suppliers arriving early can provide and thereby own the relationship. Development is formulation work rather than capital investment, and regulatory timetables make the timing entirely predictable in most jurisdictions. Regulatory timetables make the timing entirely predictable. Applicators pay for continued system compatibility.
Market Impact: Grows at 9.8% against a 4.3% wider market

Formulate regionally for actual application temperature

A blend that works on temperate steel dry sprays on Gulf steel at fifty degrees and refuses to cure properly on a Scandinavian winter morning, yet suppliers routinely ship one formulation everywhere. Regional blends matched to real application conditions reduce defect rates measurably and command 10 to 18% premiums from contractors who have experienced the alternative. Blending is local anyway, which makes regional formulation a matter of technical service and specification rather than any additional plant or manufacturing investment being required. Contractors remember which supplier caused the defects. Local blending makes this straightforward to deliver.
Market Impact: Commands 10 to 18% higher price premiums overall

Supply private label to coating brands rather than competing

Independent blenders compete on the small share of value left after base solvent takes 71% of cost, and against coating manufacturers holding warranty-linked pricing they cannot access. Supplying those manufacturers under private label converts a competitor into a customer and secures volume at predictable margin. It forfeits any brand position of the blender's own, which most independents never realistically had. Formulation capability and regional filling reach are what make a blender worth using rather than the coating manufacturer blending internally. Formulation capability is what makes a blender worth using. Predictable volume replaces contested brand competition.
Market Impact: Base solvent takes 71% of the total cost

Who Controls the Margin Pool

Concentration is very low at roughly 23% for the top five, and the reason is that blending requires little and freight economics keep production local. Eastman, Dow, and Shell appear among the leaders as base solvent producers rather than as thinner blenders, supplying the molecules that everybody else formulates with. AkzoNobel and PPG hold positions through branded thinners sold alongside their coating systems, which is a fundamentally different business model.
Competitive activity runs on three fronts. Warranty linkage is the first and is available only to coating manufacturers, who use it to convert commodity solvent into branded product. Exempt formulation capability is the second and determines who serves regulated markets. Regional application knowledge is the third and matters far more than most suppliers acknowledge. Manufacturing capability confers essentially nothing here, since blending equipment is simple and widely available.

Pressure is building from two directions. High solids coating reformulation removes dilution volume permanently with every conversion. And generic blenders take branded share wherever warranty enforcement is weak, which is most of the emerging market world. The first is permanent and the second is reversible with commercial effort, which tells any supplier where to concentrate its attention first.
epoxy-paint-thinner-market-trends-company-positioning-matrix-1787549507961

Competitive Moat and Risk Dimensions

AKZONOBEL

Moat: Warranty linkage to coating systems

Specifying its own thinner within coating system warranties converts a commodity solvent blend into a branded product applicators buy at a premium rather than risk a failure argument on a bridge or a hull. That position rests on liability rather than chemistry, which makes it durable in exactly the applications where coating failure costs most to resolve.
AKZONOBEL

Risk: High solids reducing dilution demand

The company's own coating reformulation toward higher solids content removes thinner volume from its own business with every conversion, which is a genuinely awkward internal tension. Emission regulation makes that reformulation unavoidable, so the branded thinner business shrinks structurally regardless of how effectively the warranty position is enforced.
EASTMAN CHEMICAL

Moat: Base solvent production breadth

Producing the ester, ketone, and glycol ether solvents that thinner blenders and coating manufacturers formulate with places Eastman upstream of the whole market, earning from every blend regardless of whose label appears on the drum. That position is insulated from the branding contest happening downstream between coating manufacturers and generic blenders.
EASTMAN CHEMICAL

Risk: Demand shrinking with dilution volumes

Upstream position provides no protection against total solvent volume falling as coatings move toward higher solids and waterborne systems, which removes demand rather than redistributing it. Exempt solvent chemistries growing fastest are also not all within the company's production portfolio, which limits participation in the one expanding part.

Players Tracked

Prominent Players

Eastman Chemical
Dow
Shell Chemicals
AkzoNobel
PPG Industries

Other Key Players

ExxonMobil Chemical
INEOS
LyondellBasell
Solvay
Arkema
BASF
Hempel
Jotun
Sherwin-Williams
Kansai Paint
Nippon Paint Holdings
Chevron Phillips Chemical
Sasol
KH Neochem
Recochem

Recent Developments

MARCH 2025

Coating manufacturer introduces thinner authentication features

Tamper-evident packaging and batch verification were added to branded thinner supply in markets where generic substitution had been eroding volumes and causing coating failures attributed to the coating itself. Warranty terms were restated to make the substitution consequence explicit for applicators and specifiers alike. Distributors were briefed.
Signal: Substitution is now being fought with authentication and warranty clarity rather than with any product change
JULY 2025

Exempt solvent blend launched for regulated districts

A thinner built around solvents excluded from volatile organic compound counting was introduced for air quality districts where conventional blends had become non-compliant. Applicator training accompanied the launch, since evaporation behaviour differs enough from familiar blends to cause application defects without it. Adoption followed quickly.
Signal: Exempt blends need applicator training alongside supply, because unfamiliar evaporation causes defects wrongly blamed on material
OCTOBER 2025

Contractor reports dry spray failures on hot steel

Application defects on Gulf infrastructure were traced to thinner formulated for temperate conditions evaporating too quickly on steel at high ambient temperature. A slower regional blend resolved the problem, having not previously been offered in that market by the supplier concerned. The complaint had been logged as product quality.
Signal: Shipping one single formulation everywhere keeps producing defects that proper regional blending would have prevented entirely

What Sets the Cost Base

Base solvent dominates at roughly 71% of blended thinner cost, purchased from petrochemical producers who set prices against feedstock and capacity conditions no blender influences. Exempt solvents cost considerably more than conventional aromatics and ketones, which is why blends using them price higher. Packaging is significant at 11% because thinners ship in metal or lined containers meeting hazardous goods requirements. Blending, filling, and hazardous freight absorb the remainder.
Aromatic and ketone solvent prices moved sharply through 2021 and 2022 as refinery and petrochemical operating rates fluctuated and freight costs rose, and blenders passed increases through with a lag that compressed margin on a product with very little to compress. Eastman and Dow both referenced feedstock and energy cost pressure across their reporting for those years. Exempt solvent supply also tightened as demand outran a narrow producer base.

Exposure divides on contract structure and chemistry mix rather than on scale. Blenders with indexed customer pricing passed movement through quickly while those on fixed terms carried it. Exempt solvent users face a narrower supplier base with less price transparency and periodic allocation, which is an unfamiliar risk for an industry accustomed to buying commodity aromatics from many sources at published prices.
epoxy-paint-thinner-market-trends-cost-volatility-analysis-1787549508156

Index customer pricing to published solvent benchmarks

Base solvent is 71% of cost and moves with petrochemical cycles far faster than annual pricing cycles allow any response. Indexing to published benchmarks passes movement through within weeks rather than at renewal. Contractors and coating manufacturers resist during negotiation, and resistance eases considerably after any period in which a supplier struggled to hold quoted pricing.

Qualify multiple exempt solvent sources before demand rises

Exempt solvents come from a narrower producer base than commodity aromatics, with less price transparency and periodic allocation when demand moves. Qualifying alternatives within a blend requires evaporation and solvency testing before any shortage develops. Blenders who deferred that work found themselves unable to supply regulated districts while competitors with broader qualification continued. Broader qualification is the practical hedge.

Blend regionally to eliminate hazardous freight distance

Thinners ship as hazardous goods in lined containers, which makes freight a meaningful cost on a low value product and caps sensible delivery distance sharply. Regional blending close to demand removes most of that cost and allows formulation for local application temperatures at the same time. Capital requirements are modest, since blending needs tanks and filling rather than process plant.

Portfolio Architecture for Margin Defence

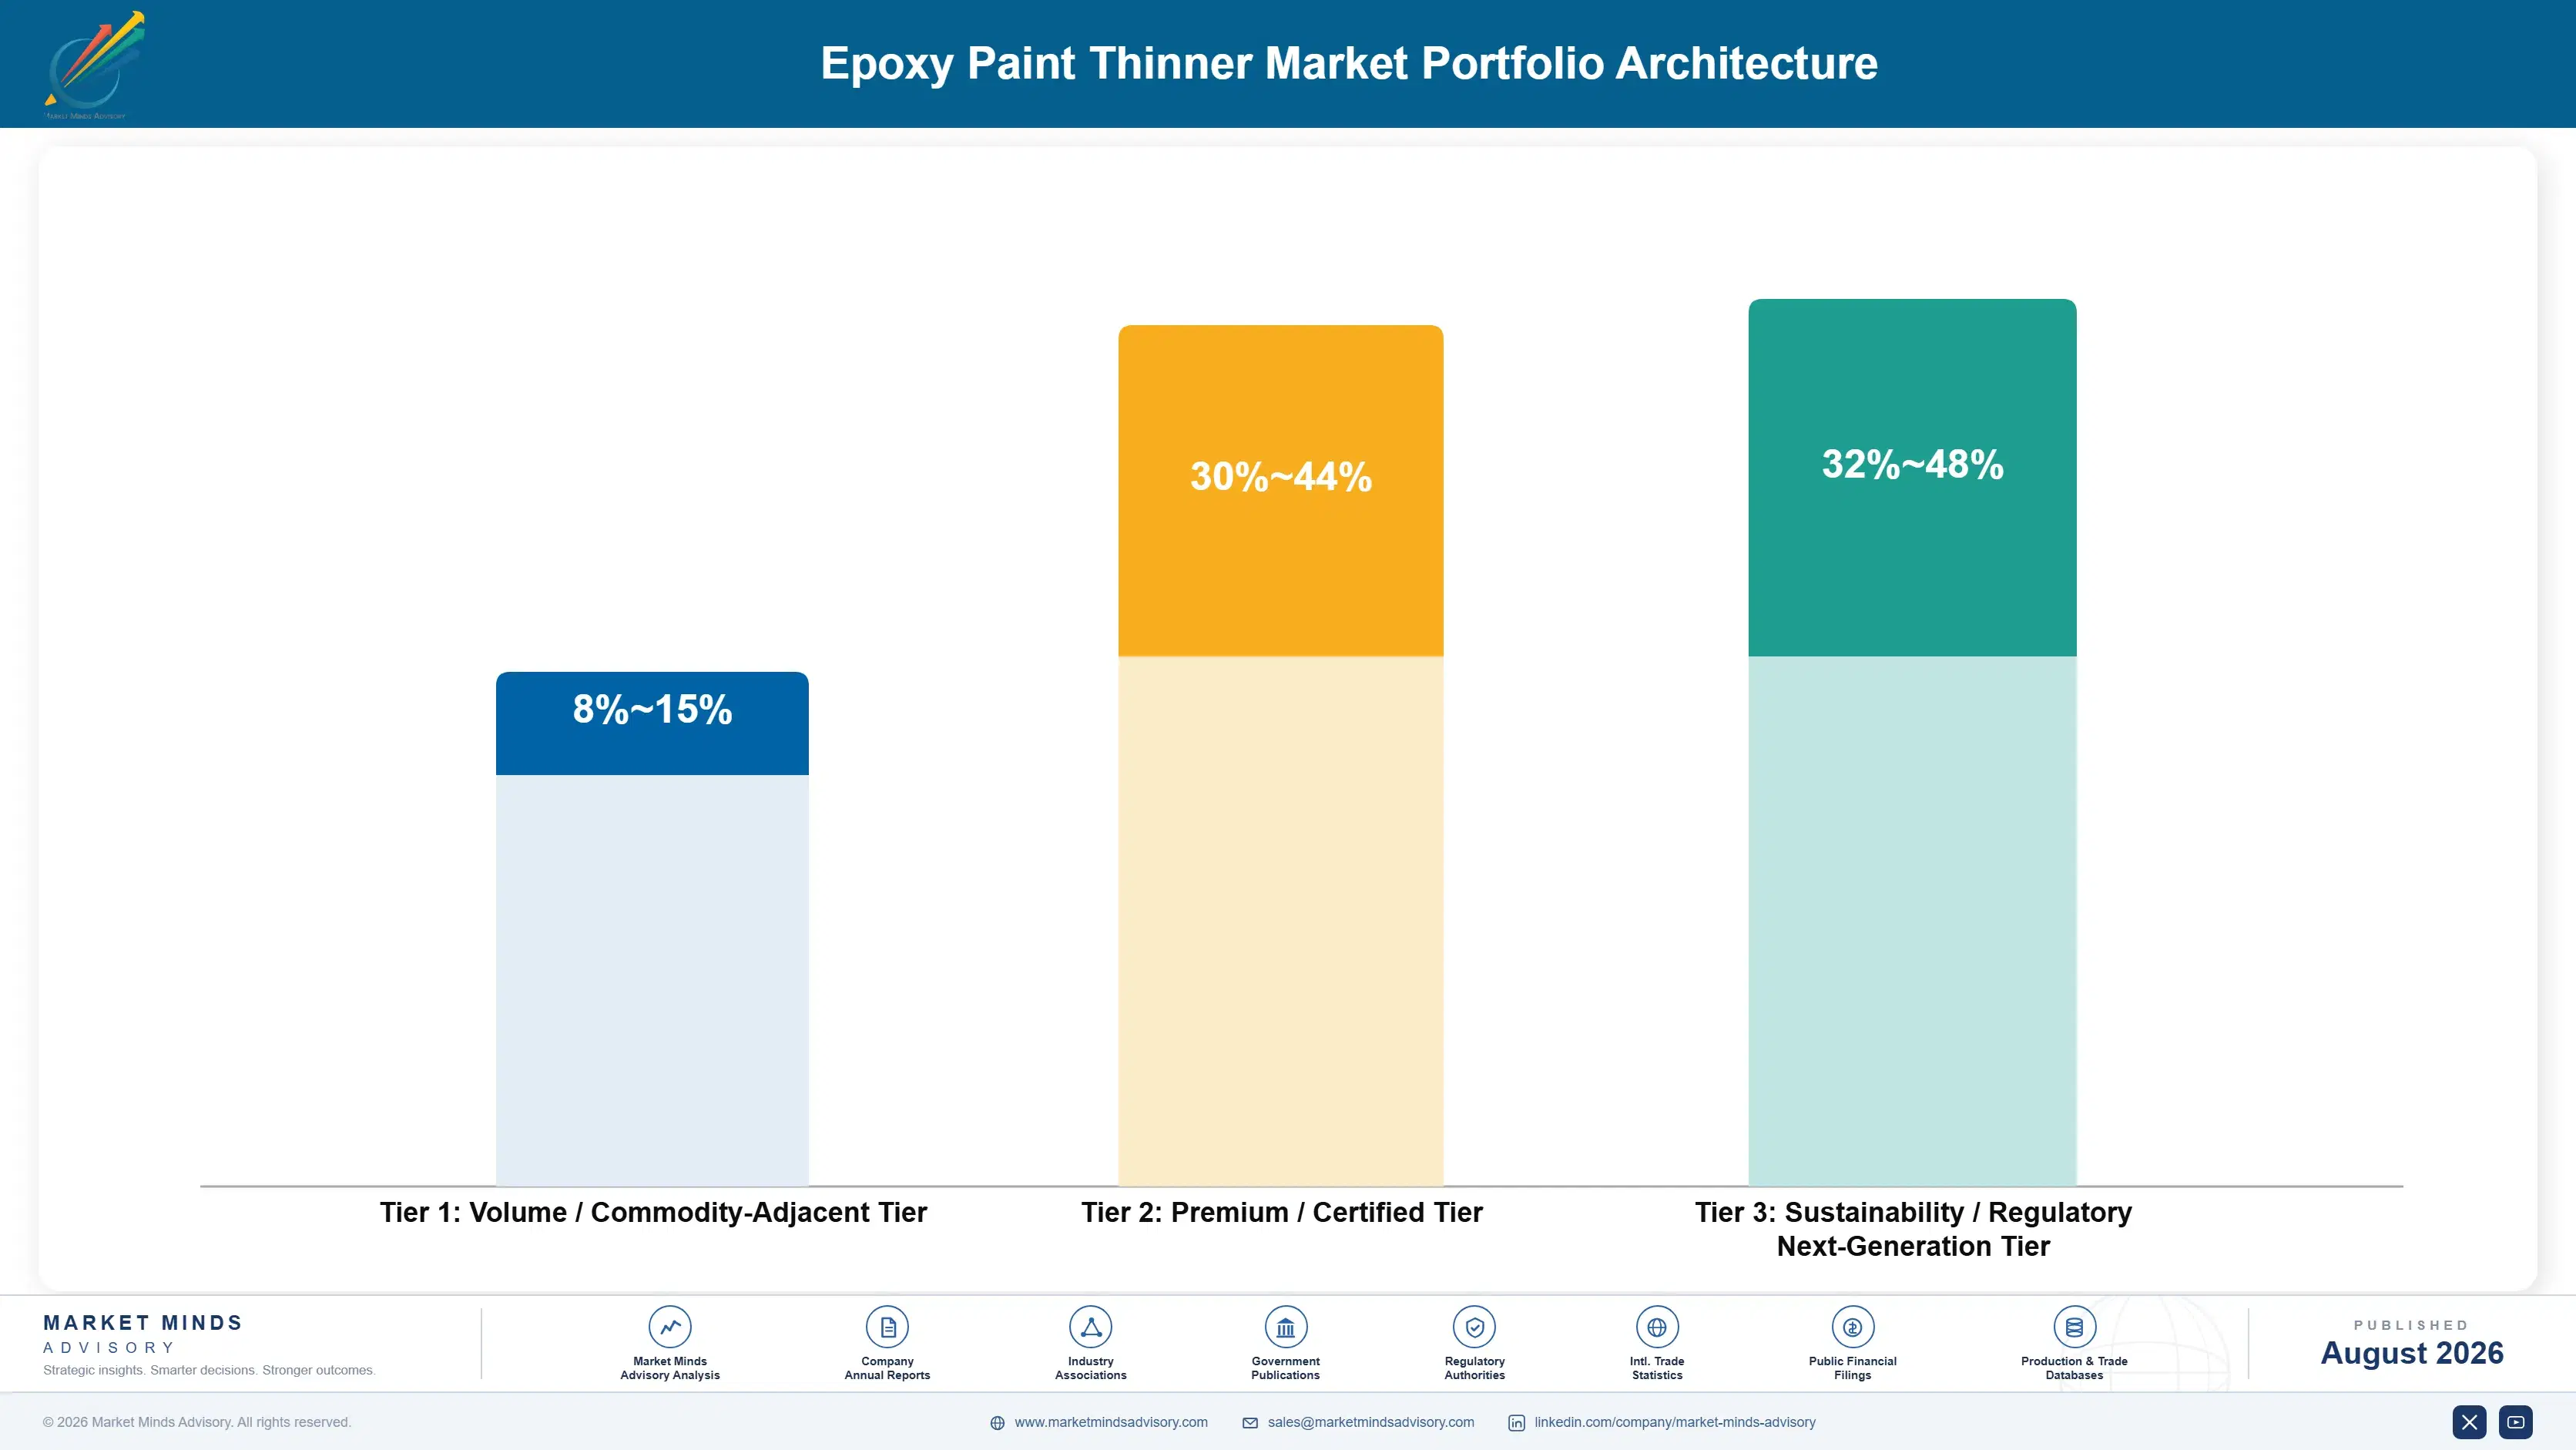
Margin follows branding and regulatory position rather than volume, on a product where the chemistry is essentially identical across suppliers. Generic thinners sold to price-sensitive applicators earn very little, because base solvent is 71% of cost and nothing differentiates one competent blend from another. Branded thinners tied to coating warranties and exempt blends serving regulated districts earn several times that, since neither can be substituted without consequence.
The volume and premium tension shows in channel conflict rather than in plant loading. A coating manufacturer selling branded thinner competes against the independent blenders it may also buy private label from, and an independent blender supplying private label forfeits any brand position of its own. Most participants sit on one side or the other rather than attempting both, which is generally the right call.

High-value pools concentrate in three places: branded thinner tied to warranty terms, exempt blends serving regulated districts, and regionally formulated products matched to actual application temperature. Each is defended by liability, regulation, or technical service rather than by manufacturing cost. Price competition arrives in each only when a competitor secures the specification, develops exempt capability, or builds regional technical service, and none of those is available to purchase.

Volume / Commodity-Adjacent Tier

Generic conventional thinners sold to price-sensitive applicators through distribution. Competes on delivered cost against any local blender. The wide range reflects large differences in solvent buying position and freight distance.
Gross Margin: 8%-15%

Premium / Certified Tier

Branded thinners specified within coating system warranties and sold alongside the coating. The applicator purchases warranty protection rather than solvent, and substitution transfers liability to them entirely. Owners increasingly name the product.
Gross Margin: 30%-44%

Sustainability / Regulatory / Next-Generation Tier

Exempt solvent blends meeting emission limits and low toxicity formulations for confined space application. Regulation rather than performance drives adoption. The range is wide because exempt solvent costs vary considerably by chemistry.
Gross Margin: 32%-48%
epoxy-paint-thinner-market-trends-portfolio-architecture-1787549508657

High-value Sub-segments and Strategic Watch-out

Warranty-Linked Branded Thinners

A chemically ordinary product carrying premium pricing purely because the coating warranty specifies it, which is a genuinely durable position resting on liability. Branded share sits at 56% and falls where enforcement is weak. Defend it commercially. Authentication supports the position materially. Enforce it consistently.
Gross Margin: 32%-46%

Exempt Solvent Compliant Blends

Regulation rather than performance drives adoption, and applicators pay because the alternative is changing the coating system entirely. Growing at 9.8% against a 4.3% market. Applicator training must accompany supply or defects follow. Regulatory timetables make timing predictable. Move ahead of the limits. Move early.
Gross Margin: 34%-48%

Regionally Formulated Application Blends

One formulation shipped everywhere causes dry spray on hot steel and poor cure in cold conditions, which contractors experience and remember. Local blending makes regional formulation a service question rather than a plant investment. Technical service rather than plant investment. Formulate for each market. Do it.
Gross Margin: 28%-40%

Generic Conventional Thinner Supply

The strategic watch-out. Chemically identical to everything else, competing on delivered cost with base solvent at 71% of that cost. It fills tanks and holds distribution presence, and earns almost nothing beyond that. Price it for distribution presence only. Expect nothing more from it. Nothing else.
Gross Margin: 8%-14%

How Demand Actually Reaches Suppliers

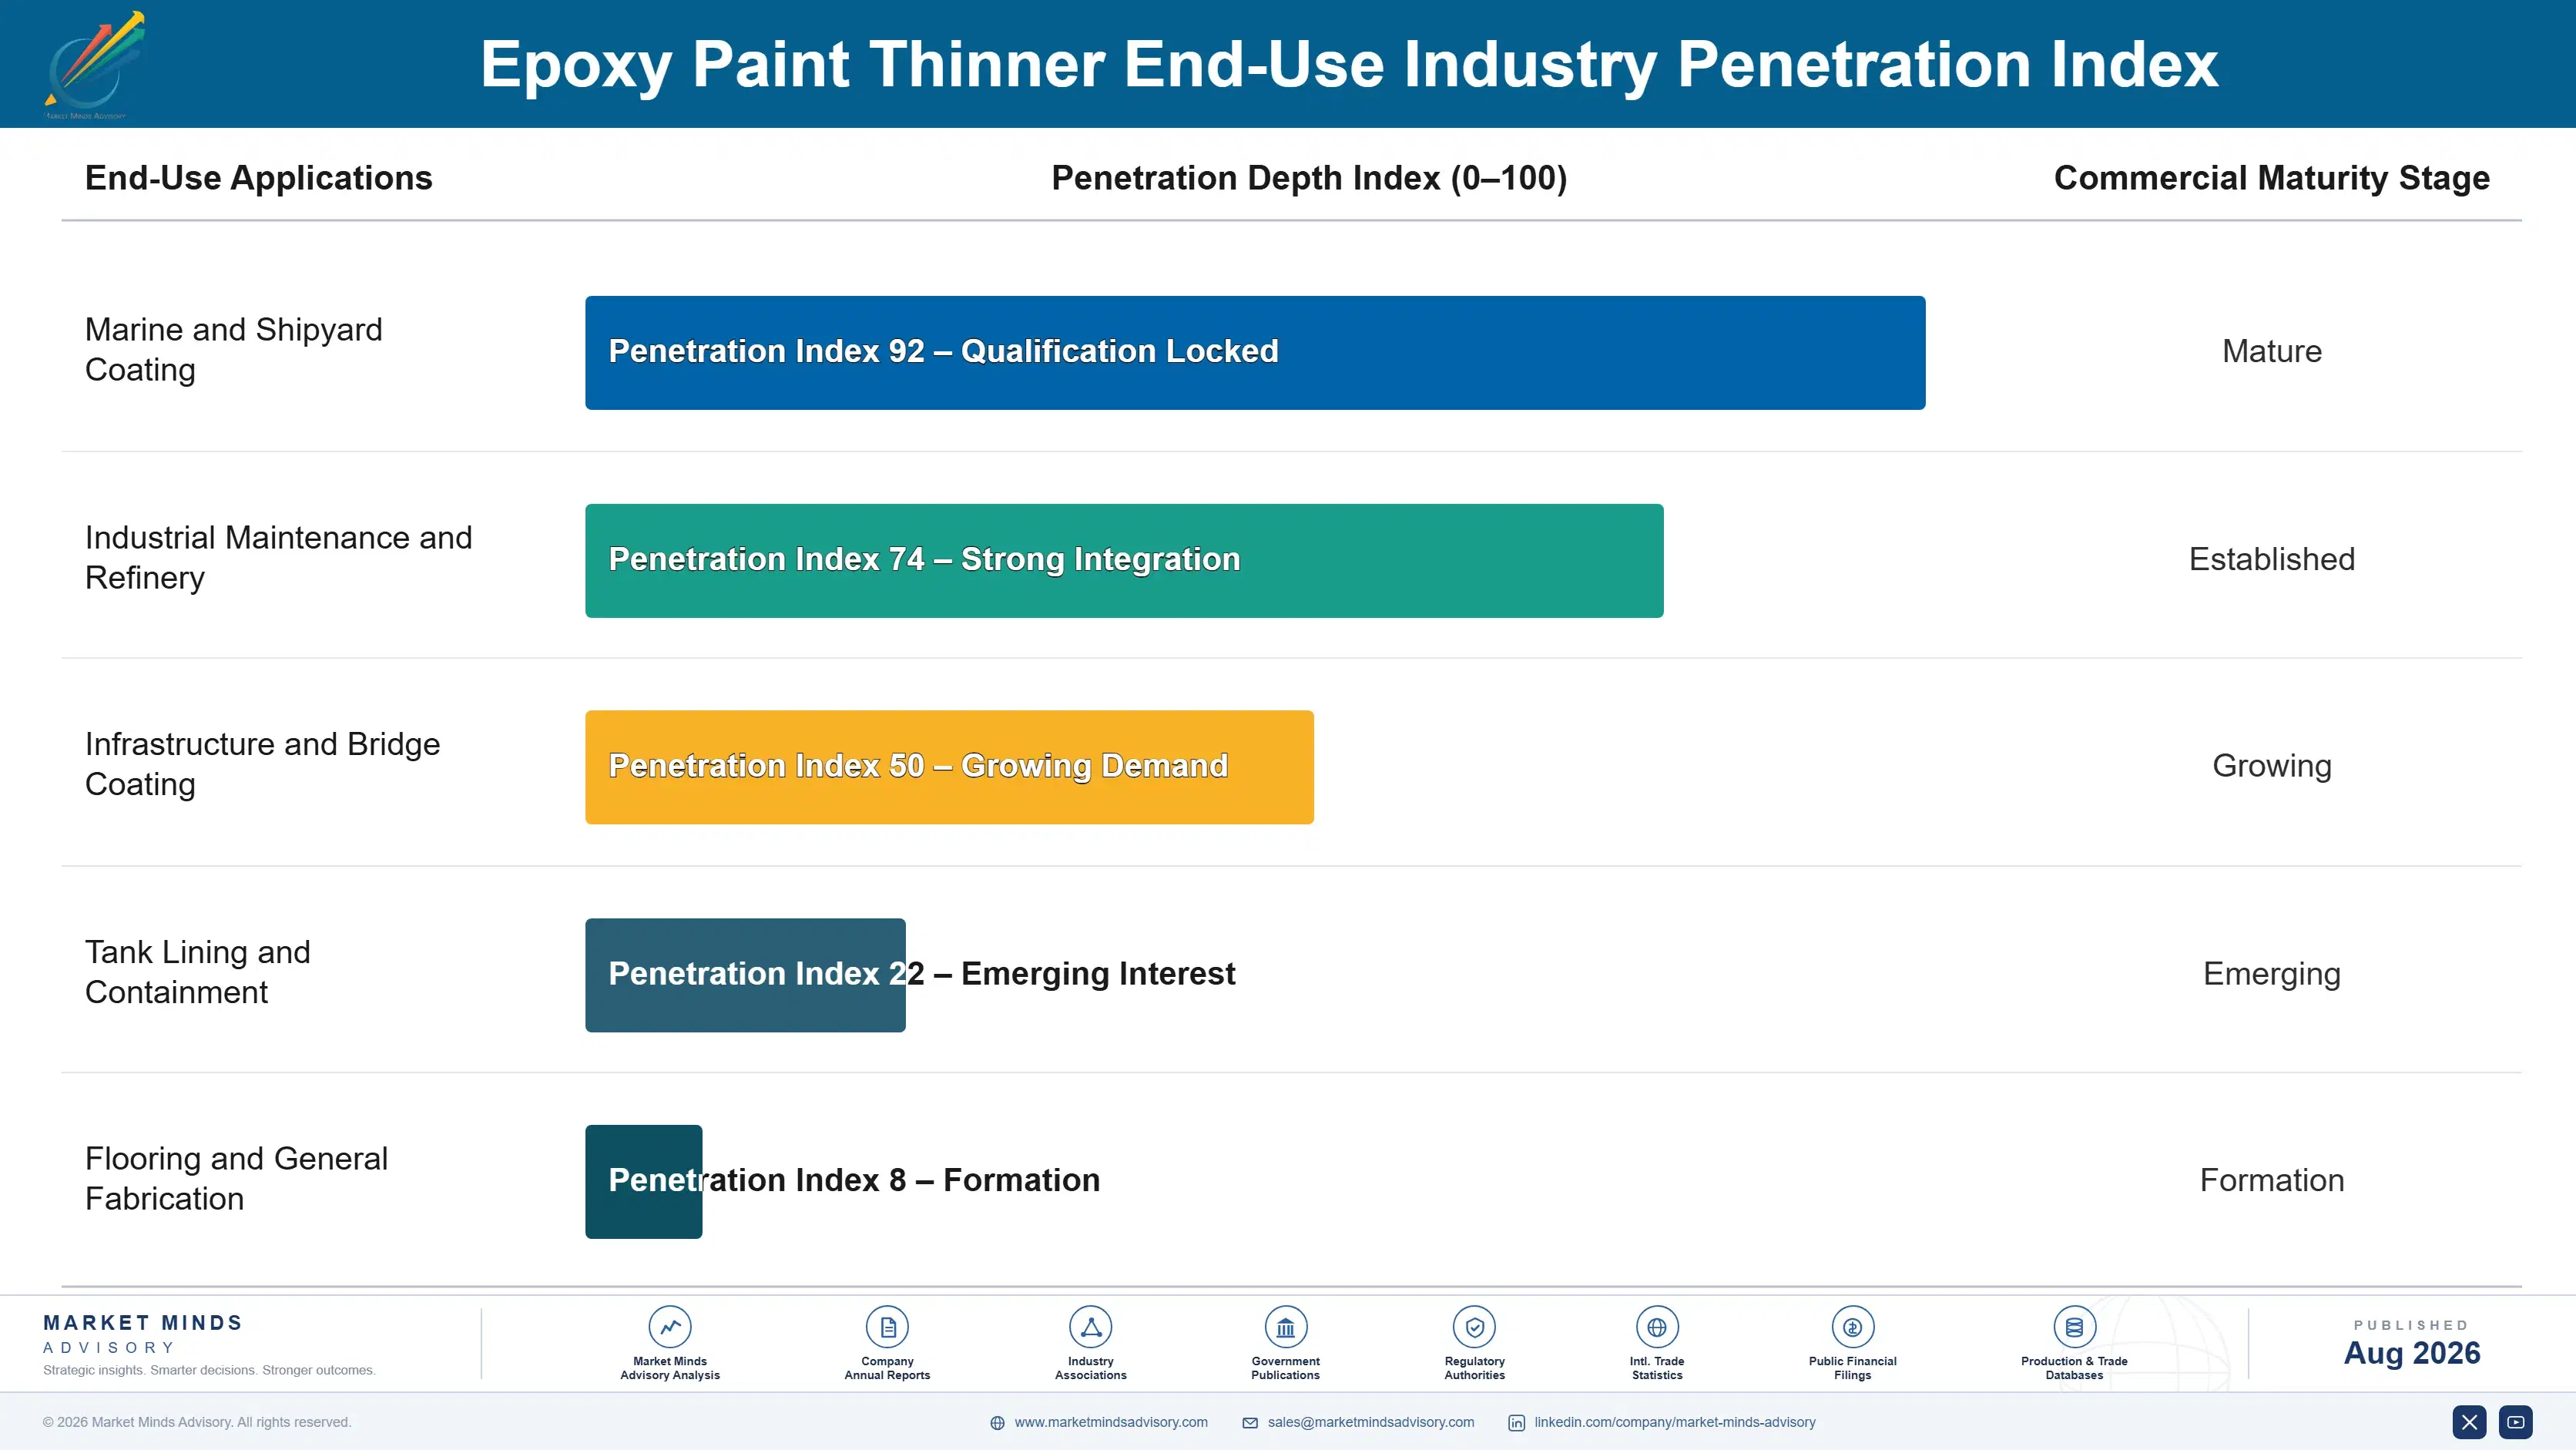
The annuity here is the coating specification rather than any repeat purchase decision. A protective coating system specified for a bridge, tank, or vessel names its compatible thinner, and every application and maintenance recoat over the asset's life consumes it, which ties thinner demand to coating specification decisions made years earlier. Recoating cycles running around eight years then generate recurring demand from the installed coated surface area rather than from new construction, which makes the underlying volume far steadier than project activity suggests.
Adoption depth varies sharply by applicator type. Marine and offshore contractors follow specifications precisely because warranty and inspection regimes leave them no discretion. Industrial maintenance contractors mostly comply, with variation by client sophistication. General fabrication shops substitute more freely. Small contractors in emerging markets buy whatever is cheapest and available locally. That variation makes channel selection more consequential than pricing in most territories.

The buyer has shifted toward asset owner specification rather than applicator choice. Owners writing coating specifications increasingly name thinners explicitly to close the substitution loophole. Closing that loophole at specification stage is worth more to a coating manufacturer than any amount of enforcement effort applied afterwards on site.
epoxy-paint-thinner-market-trends-end-use-penetration-index-1787549509150

Where the Money Sits

These are among the four positions where our research anticipates prominent divergence between winners and laggards over the coming forecast period. Each is grounded in the demand model, the regulatory perimeter, and the announced capacity pipeline.
01 / WARRANTY POSITION ENFORCEMENT

Enforce the specification, because the product cannot differentiate itself

A branded thinner and a competent generic are chemically indistinguishable, so the entire premium rests on a warranty clause and whether anybody enforces it. Branded share sits at 56% globally and falls considerably in markets where enforcement is weak and applicators substitute freely on a consumable representing very little of project cost. Recovering share through authentication, applicator communication, and consistent warranty position lifts thinner revenue 20 to 35% without changing the formulation, the packaging, or the manufacturing in any way at all.
02 / EXEMPT BLEND DEVELOPMENT

Formulate exempt blends ahead of the limits arriving

Blends built around solvents excluded from emission counting let applicators keep using solvent-borne epoxy where limits would otherwise force a coating change they actively do not want. Those blends grow at 9.8% against a market growing 4.3% and command prices well above conventional formulations for no performance benefit whatsoever. Regulatory timetables make the timing predictable, and suppliers arriving with applicator training as well as product own the relationship because unfamiliar evaporation behaviour otherwise causes defects that get blamed on the material.
03 / REGIONAL FORMULATION DISCIPLINE

Blend for the actual temperature, not the temperate default

A formulation that behaves properly on temperate steel dry sprays on Gulf steel at fifty degrees and refuses to cure on a Scandinavian winter morning, yet suppliers routinely ship one product into every market they serve. Regional blends matched to real conditions cut defect rates measurably and command 10 to 18% premiums from contractors who have experienced the alternative firsthand. Blending happens locally anyway, so this is a technical service and specification question rather than any additional plant or manufacturing investment being required at all.
04 / PRIVATE LABEL POSITIONING

Supply the coating brands rather than fighting their warranties

Independent blenders compete for the small share of value remaining after base solvent takes 71% of cost, and they do so against coating manufacturers holding warranty-linked pricing that no independent can access at any price. Supplying those manufacturers under private label converts a competitor into a customer and secures predictable volume at workable margin. It forfeits a brand position that most independent blenders never realistically possessed, which is what makes the trade considerably less painful than it initially sounds to most owners.

Engagement Snapshot From the Field

A live engagement with an industry participant carrying material or product regulatory and market exposure ahead of a defining policy shift, showing how our research translates into a defensible multi-year portfolio strategy.
MARKET MINDS ADVISORY · CLIENT ENGAGEMENT SUMMARY
Epoxy Paint Thinner Producer Strategic Portfolio Review and Transition Roadmap 2026·Investment Scenario on Epoxy Paint Thinner Exposure Evaluation 2025-26
CLIENT PROFILE
A regional blender of industrial thinners supplying protective coating applicators and fabricators across three countries, with revenue near USD 44 million (client-reported, unverified by MMA). Products were sold under the client's own brand against coating manufacturer thinners, one formulation was shipped across all markets, and no exempt solvent blends existed in the range. Margin had compressed steadily.
STRATEGIC CHALLENGE
Branded coating manufacturer thinners were taking share wherever asset owners specified them explicitly, while generic competitors undercut the client at the price-sensitive end. Regulated districts in one market had become inaccessible without exempt formulations. Margin had compressed to a point where management questioned the business model itself. Nothing was working commercially.
MMA APPROACH
MMA analysed share losses by account type and specification practice, assessed exempt blend development requirements against regulatory timetables, and modelled private label supply economics against continued branded competition. Forty-seven expert interviews with applicators, coating manufacturers, and asset owners established how thinner selection is actually determined on real projects. Specification practice mattered most.
KEY FINDINGS
  1. Every account lost to a coating manufacturer thinner had involved an asset owner specification naming the product explicitly, and the client had no route to influence those specifications at all.
  2. Two coating manufacturers in the region blended thinner internally at higher cost than the client could supply it, and neither had been approached about private label arrangements.
  3. Exempt solvent blends were unavailable from any regional supplier, and applicators in regulated districts were importing at considerable cost and delay from other markets.
  4. One formulation shipped across three countries was causing dry spray complaints in the hottest market and slow cure complaints in the coldest, with both blamed on product quality.
CLIENT PROFILE
A regional blender of industrial thinners supplying protective coating applicators and fabricators across three countries, with revenue near USD 44 million (client-reported, unverified by MMA). Products were sold under the client's own brand against coating manufacturer thinners, one formulation was shipped across all markets, and no exempt solvent blends existed in the range. Margin had compressed steadily.
STRATEGIC CHALLENGE
Branded coating manufacturer thinners were taking share wherever asset owners specified them explicitly, while generic competitors undercut the client at the price-sensitive end. Regulated districts in one market had become inaccessible without exempt formulations. Margin had compressed to a point where management questioned the business model itself. Nothing was working commercially.
MMA APPROACH
MMA analysed share losses by account type and specification practice, assessed exempt blend development requirements against regulatory timetables, and modelled private label supply economics against continued branded competition. Forty-seven expert interviews with applicators, coating manufacturers, and asset owners established how thinner selection is actually determined on real projects. Specification practice mattered most.
KEY FINDINGS
  1. Every account lost to a coating manufacturer thinner had involved an asset owner specification naming the product explicitly, and the client had no route to influence those specifications at all.
  2. Two coating manufacturers in the region blended thinner internally at higher cost than the client could supply it, and neither had been approached about private label arrangements.
  3. Exempt solvent blends were unavailable from any regional supplier, and applicators in regulated districts were importing at considerable cost and delay from other markets.
  4. One formulation shipped across three countries was causing dry spray complaints in the hottest market and slow cure complaints in the coldest, with both blamed on product quality.
RECOMMENDED STRATEGY
Phase 1: Phase one: approach regional coating manufacturers with private label supply, converting warranty-linked competitors into customers at predictable volume and margin. Phase 2: Phase two: develop exempt solvent blends for the regulated districts currently importing them, since no regional supplier offers any alternative locally. Phase 3: Phase three: formulate separately for hot and cold market conditions rather than shipping one product everywhere and absorbing the complaints that follow.
OUTCOME
The client secured private label supply with two coating manufacturers within a year and launched exempt blends in the regulated districts. Private label reached 31% of volume at predictable margin, complaint rates fell sharply after regional formulation, and blended gross margin improved 6.9 percentage points (client-reported, unverified by MMA).

Frequently Asked Questions

Foundational context covering the market sizes, CAGR, scope, country, region and competition that inform every finding below. This section is provided to cover basics and most often pre-purchase conversations, answered from the MMA Primary Research Dataset.

What is the current size of the Epoxy Paint Thinner Market?

The market was valued at USD 1.4 billion in 2025, rising to an estimated USD 1.46 billion in 2026. East Asia holds the largest regional share at 30% of global value.

How large will the Epoxy Paint Thinner Market be by 2036?

MMA forecasts USD 2.22 billion by 2036 under the base case, an expansion multiple of 1.52 times the 2026 value. That represents USD 0.76 billion of incremental value across the forecast period.

What is the CAGR for the Epoxy Paint Thinner Market 2026 to 2036?

The base case CAGR is 4.3%, with a bull case of 5.4% and a bear case of 3.1%. The spread reflects uncertainty over high solids conversion and generic substitution.

Which segment is growing fastest?

Exempt and low emission solvent blends grow fastest at 9.8%, roughly 2.28 times the market rate. Ester and alcohol blends follow at 5.6% on occupational exposure concerns.

Who are the major companies in the Epoxy Paint Thinner Market?

Eastman Chemical, Dow, Shell Chemicals, AkzoNobel, and PPG Industries lead on thinner and base solvent supply. The top five hold only 23%, since blending stays local everywhere.

Which country is growing fastest?

India grows fastest at 7.2%, driven by infrastructure construction creating coated steel surface area and maintenance recoating beginning on earlier work. Enforcement variation keeps conventional blends dominant.

Report Segmentation Architecture

The full report scope spans multiple orthogonal segmentation dimensions, with cross-tabulated demand data provided for each dimension pair. Coverage extends further to regional breakdowns, trend trajectories, and the competitive detail needed to support segment-level decision-making.

By Solvent Chemistry

  • Aromatic Hydrocarbon Blends
  • Ketone-Based Blends
  • Glycol Ether Blends
  • Ester and Alcohol Blends
  • Exempt and Low-VOC Solvent Blends

By End-Use Industry

  • Marine and Shipyard Coating
  • Industrial Maintenance and Refinery
  • Infrastructure and Bridge Coating
  • Tank Lining and Containment
  • Flooring and General Fabrication

By Sales Model

  • Coating Manufacturer Branded Supply
  • Private Label Blending Supply
  • Independent Brand Distribution
  • Direct Contractor Bulk Supply
  • Industrial Distributor Channel

By Region

  • North America
  • Western Europe
  • East Asia
  • South Asia and Pacific
  • Latin America
  • Middle East and Africa
  • Eastern Europe

Scope, Methodology, and Coverage

Every figure in this report is reproducible from documented input assumptions. The scope below maps the historical period, the forecast horizon, the segmentation dimensions, and the countries covered, alongside the underlying primary and qualitative methodology.
Historical Period
2020 to 2025
Forecast Period
2026 to 2036
Base Year
2025 (USD billions; MMA Primary Research Dataset, August 2026)
Market Definition
The market comprises solvent blends formulated for diluting, cleaning, and adjusting the application properties of epoxy coatings, covering aromatic hydrocarbon blends, ketone-based blends, glycol ether blends, ester and alcohol blends, and exempt and low emission solvent blends. Value is measured at supplier level across coating manufacturer branded thinners, private label supply, and independent blended products for marine, industrial maintenance, infrastructure, tank lining, and fabrication applications. Base solvents sold as bulk commodities, coating resins and hardeners, general purpose degreasers and cleaners, waterborne coating additives, and application equipment fall outside scope.
Quantitative Units
USD billions (current prices); million litres of blended thinner supplied annually; USD per litre by chemistry and channel
Segmentation Dimensions
By Solvent Chemistry; By End-Use Industry; By Sales Model; By Region
Regions Covered
North America, Western Europe, East Asia, South Asia and Pacific, Latin America, Middle East and Africa, Eastern Europe
Countries Covered
United States, Canada, Mexico, Germany, Netherlands, Norway, United Kingdom, Italy, Spain, France, Poland, Croatia, Romania, China, Japan, South Korea, Singapore, India, Indonesia, Vietnam, Australia, Brazil, Chile, Peru, Argentina, Saudi Arabia, United Arab Emirates, Qatar, Nigeria, South Africa
Key Companies Profiled
Eastman Chemical, Dow, Shell Chemicals, AkzoNobel, PPG Industries, ExxonMobil Chemical, INEOS, LyondellBasell, Solvay, Arkema, BASF, Hempel, Jotun, Sherwin-Williams, Kansai Paint, Nippon Paint Holdings, Chevron Phillips Chemical, Sasol, KH Neochem, Recochem
Quantitative Methodology
Primary survey, n=3,800 respondents, Q4 2025, six countries; demand-side model with trade association cross-validation
Qualitative Methodology
47 expert interviews, Q4 2025; applied to validate demand model assumptions, identify emerging dynamics, and assess competitive positioning
Report Format
PDF and XLSX data workbook (Word format preview document)
Publisher
Market Minds Advisory
Report Code
MMA-2026-CHM-272
Published
August 2026
Contact
sales@marketmindsadvisory.com | www.marketmindsadvisory.com

Purchase the full Epoxy Paint Thinner Market Report (2026 to 2036).

The full report sizes epoxy thinner demand across five solvent chemistries, five end-use applications, and seven regions with 2026 to 2036 forecasts under base, bull, and bear cases. It separates warranty-linked branded volume from generic and private label supply, since the three earn entirely different margins on identical chemistry. Competitive profiles cover twenty suppliers assessed consistently on thinner and base solvent supply, exempt formulation capability, and regional blending reach. Cost analysis traces base solvent exposure against contract structure and chemistry mix. Commercial guidance addresses warranty enforcement, exempt blend development, regional formulation, and private label positioning.
Five solvent chemistries sized separately by region
Branded warranty-linked volume separated from generic supply
Exempt solvent adoption mapped against regulatory districts
High solids conversion modelled as a dilution headwind
Application temperature requirements assessed by region
Twenty suppliers compared on formulation and blending reach

Built For The People Who Decide

From boardroom strategy to bench-side execution, this report is read cover-to-cover by leaders shaping the next decade of their industry, turning demand scenarios, market dynamics and valuation benchmarks into decisions.
CXOs/ Presidents/ VPs/ Managers
M&A and Corporate Development
Strategy Teams and R&D Heads
Procurement and Product Directors
Regulatory and Compliance Leaders
Investor Relations and Equity Analysts