Market Minds Advisory
EPE Liner Market

EPE Liner Market: Expanded Polyethylene Foam Liner Solutions for Protective Packaging

Electronics OEMs keep tightening damage-in-transit tolerances just as recycled-content mandates spread across major packaging markets, pushing EPE liner converters toward closed-loop resin sourcing that conventional virgin foam producers cannot easily match.

Lead Analyst

Bilal Shaikh

Published

September 2026

Make Smarter Decisions with Customized Research Insights

Request a free sample report and evaluate market opportunities, growth trends, and competitive dynamics relevant to your business needs.

2025 MARKET VALUE$3.2BMarket Size 2025
2036 FORECAST VALUE$6.3BBase Case , 2026 to 2036
CAGR 2026 TO 20366.4 %Bull 7.6% / Bear 5.2%
INCREMENTAL OPPORTUNITY$2.9BNet 10- year value creation
EXPANSION MULTIPLE1.86x2036 value over 2026 base
Strategic Levers
M&A Pipeline
Regional Outlook
Country Rankings
Competitive Intelligence
Segmental Deep-dive
Call-Us : 91 93563 13602

Executive Snapshot and Market Trajectory

Electronics OEMs keep tightening damage-in-transit tolerances at the same time recycled-content mandates spread across major packaging markets, pushing converters toward closed-loop resin sourcing that older virgin foam lines cannot easily match without new capital investment, dedicated processing equipment, and updated quality documentation systems.
Sheet and roll liners still carry the largest share of shipped volume, but recycled-content EPE liners are expanding fastest as brand owners chase both regulatory compliance and packaging cost stability against volatile virgin resin pricing swings that complicate annual budgeting. Demand concentrates among electronics and appliance manufacturers shipping fragile products through long, multi-modal logistics chains, where damage claims and warranty exposure make liner quality a genuine cost driver rather than an afterthought in packaging design.
Competition splits between diversified protective packaging manufacturers bundling EPE liners with broader foam and cushioning portfolios and regional converters competing purely on price and delivery proximity to manufacturing hubs. Tightening sustainability procurement requirements, plus growing OEM interest in validated recycled-content supply chains, are pulling purchasing decisions toward converters that can document traceable closed-loop resin sourcing across their production network and every qualified facility within it, including third-party contract manufacturing sites.
Market Definition
The EPE liner market covers expanded polyethylene foam sheet, roll, die-cut, and molded liner products used for protective cushioning and surface protection inside shipping and retail packaging. It excludes expanded polystyrene and polyurethane foam packaging, corrugated inserts without foam components, and EPE foam sold for non-packaging applications such as flotation or construction insulation.
Base Year Value
$3.2B in 2025 (MMA Primary Research Dataset, August 2026)
Forecast Period
2026 to 2036, eleven discrete annual values
CAGR
6.4% base case. Bull 7.6%. Bear 5.2%.
Fastest Growth Segment
Recycled-Content EPE Liners: 10.5% CAGR
Fastest Growth Country
India: 9.4% CAGR
Fastest Growth Region
South Asia and Pacific: 8.5% CAGR
Largest Region
East Asia: 30% of 2025 global value
Market Leaders
Sealed Air Corporation, Pregis LLC, Storopack Hans Reichenecker GmbH, JSP Corporation, Sonoco Products Company. Source: MMA Analysis based on company annual reports.
Primary Survey
n=3,800 procurement and R&D decision-makers, Q4 2025, six countries
Methodology
Demand-side build-up, cross-validated against public data, 47 expert interviews

EPE Liner Market Forecast Scenarios

epe-liner-market-size-forecast-scenario-1787299004568
Growth from 2020 to 2025 compounded near 5.6%, accelerated early by pandemic-driven e-commerce shipping volume, then moderating as demand normalized while sustainability-linked packaging redesign initiatives began sustaining incremental replacement demand across major consumer electronics and appliance categories and their expanding distribution networks worldwide, gradually restoring pre-pandemic shipment reliability across most established trade corridors and manufacturing hubs.
Three mechanisms carry the base case to 6.4%. First, expanding e-commerce and electronics shipping volume requiring reliable cushioning across longer, more damage-prone multi-modal logistics routes. Second, recycled-content regulatory mandates spreading across major consumer markets, which push brand owners toward converters capable of documented closed-loop resin sourcing. Third, rising appliance and electronics manufacturing capacity across emerging markets, which extends packaging demand into previously underserved regional supply chains lacking established converter relationships.
The bull case at 7.6% assumes recycled-content adoption accelerates faster than current regulatory timelines suggest, pulling forward converter capacity investment considerably across major consumer electronics supply chains. The bear case at 5.2% assumes lightweighting and alternative cushioning materials substitute for EPE liners faster than expected in select packaging categories across price-sensitive commodity segments and their thinnest-margin customer accounts across the industry.

Recycled Content Mandates and the Push Toward Closed-Loop Sourcing

Three forces converge on EPE liner production this year. Electronics and appliance shipping volume keeps climbing as manufacturing capacity expands globally, recycled-content mandates keep spreading across major packaging markets, and virgin polyethylene resin pricing remains volatile enough to make cost stability a genuine competitive differentiator between converters competing for the same large brand owner accounts and their sustainability-linked supplier scorecards.
MARKET CONCENTRATIONCR5 28%top five converters hold a moderate combined share overall
AVERAGE LINER PRICE PREMIUM15-25% for recycled contentrecycled-content liners command a meaningful cost premium currently
TOP PRODUCING COUNTRY SHAREChina 27%leading share of global EPE liner manufacturing capacity today
CAPACITY UTILISATION74-82%foam extrusion facilities running near typical seasonal peak levels
TRADE INTENSITY48%share of finished liners crossing borders before final packaging assembly
RESIN COST SHARE52-60%polyethylene resin dominates total liner production cost structure
The market behaves less like a standard commodity foam category and more like a specification-driven engineering material wrapped around brand protection requirements. Converters compete on documented cushioning performance and recycled-content traceability rather than price alone, since a brand owner qualifying a new liner supplier faces genuine product testing and validation timelines that discourage frequent switching absent a genuine quality or capacity failure forcing the change, particularly across large multi-facility manufacturers.
Closed-loop recycled resin sourcing, anti-static engineered foam formulations, and automated die-cutting capability are reshaping converter selection criteria across the next decade, favoring manufacturers that can prove consistent cushioning performance against documented virgin foam baselines across comparable shipping conditions, multi-year customer contracts, and evolving regulatory expectations across major markets and their distinct compliance timelines and audit cycles.
"Brand owners used to treat foam liners as an afterthought in the packaging budget. Now they audit recycled-content documentation before signing, because a single damaged shipment recall costs more than years of liner spend combined."
Director, Protective and Industrial Packaging Practice · MMA Protective and Indu

Market Trends

Recycled-Content EPE Liners Gain Regulatory-Driven Momentum

Several major packaging markets have introduced or expanded recycled-content requirements applying directly to protective foam packaging, pushing brand owners to qualify converters capable of documented closed-loop resin sourcing rather than relying solely on virgin polyethylene feedstock. Converters investing early in post-consumer and post-industrial recycled resin processing capability are winning preferred supplier status ahead of competitors still building comparable traceability documentation systems. Early adopters report measurable share gains among large electronics OEMs subject to the strictest incoming regulatory deadlines tracked in this year's primary survey data and expert interviews across major packaging markets.
Market Impact: Adds 8% annual shipment volume

Electronics OEMs Tighten Damage-in-Transit Specification Requirements

Consumer electronics manufacturers have tightened internal damage-in-transit tolerance specifications following rising warranty claim costs tied to long-haul multi-modal shipping routes spanning ocean freight, rail, and last-mile delivery handoffs, requiring liner converters to demonstrate documented cushioning performance data rather than relying on general foam density specifications alone. Smaller regional converters increasingly struggle to meet the testing and certification burden these tightened specifications require, concentrating preferred supplier status among larger converters with dedicated testing laboratories and engineering support staff capable of rapid specification response across multiple product lines and shipping conditions simultaneously.
Market Impact: Raises recycled sourcing 20%

Market Opportunities and Growth Drivers

Expanding Electronics Manufacturing Capacity Lifts Liner Demand

Rising electronics and appliance manufacturing capacity across major producing regions keeps expanding the pool of shipments requiring reliable protective cushioning, since manufacturers cannot simply absorb higher damage-in-transit rates without material warranty and brand reputation cost. Original equipment manufacturers increasingly view liner quality as integral to total landed cost management rather than a discretionary packaging line item, particularly across product categories shipping through longer, more damage-prone international logistics chains spanning multiple freight handoffs and customs inspection points, each adding incremental handling risk that compounds across a typical multi-week international shipping timeline.
Market Impact: Swings input cost 22%

Sustainability Procurement Policy Favors Documented Recycled Content

Large brand owners increasingly embed recycled-content targets directly into supplier procurement scorecards, creating direct commercial incentive for packaging teams to favor converters that can document traceable closed-loop resin sourcing over competitors relying entirely on virgin feedstock. This shift favors converters that invested early in recycled resin processing infrastructure over those still relying on virgin polyethylene alone, while rewarding incumbent suppliers that built documented sourcing traceability systems ahead of formal regulatory deadlines taking effect across major consumer markets and their associated annual compliance reporting cycles, third-party audit requirements, and evolving certification standards.
Market Impact: Limits recycled output growth 15%

Market Restraints and Challenges

Volatile Polyethylene Resin Pricing Pressures Converter Margin

Polyethylene resin prices swing considerably with underlying naphtha and ethylene feedstock costs, and converters operating on thin, commodity-adjacent margins struggle to pass sudden cost increases through to buyers under existing fixed-price supply agreements. The root cause is the industry's continued dependence on petrochemical feedstock pricing that responds directly to crude oil and natural gas market volatility beyond any single converter's control. This creates genuine margin unpredictability for converters, and several larger players are now building resin hedging programmes and multi-year supply contracts specifically to smooth cost exposure across volatile pricing cycles.
Market Impact: Raises recycled-content share 25%

Recycled Resin Supply Quality Variability Limits Scaling

Post-consumer recycled polyethylene resin supply varies considerably in purity and mechanical property consistency compared with virgin feedstock, complicating converters' ability to guarantee uniform cushioning performance across every production batch. The root cause traces to fragmented collection and sorting infrastructure that has not scaled proportionally with rising recycled-content demand from packaging buyers. This constrains how quickly converters can expand recycled-content product lines, and some are now investing directly in dedicated recycling and purification infrastructure to secure consistent, qualified feedstock supply across their entire recycled-content product line and its full range of customer specification requirements.
Market Impact: Cuts damage claim rates 18%
3 additional market trends, 4 additional growth drivers, and 2 additional restraints and challenges are covered in the full report. Contact sales@marketmindsadvisory.com to access the complete intelligence.

Segment CAGR and Growth Architecture

Segmentation follows product form and functional specification because manufacturing process, converter capital investment, and buyer qualification requirements differ substantially between sheet, die-cut, laminated, anti-static, and recycled-content liner categories, each carrying its own distinct cost structure, customer base, and regulatory compliance requirement across major markets and their evolving procurement standards, certification programmes, and buyer qualification processes.
epe-liner-market-market-share-analysis-1787299005106

Recycled-Content EPE Liners

This segment grows fastest at 10.5% as brand owners move recycled-content sourcing from pilot programmes into standard procurement requirements across major consumer electronics and appliance categories. Converters differentiate on documented traceability and consistent mechanical performance against virgin foam baselines rather than price alone, since buyers still require validated cushioning data before shifting primary specifications away from familiar virgin material. Demand concentrates among large brand owners with public sustainability commitments and formal supplier scorecards, where recycled-content compliance clears procurement thresholds fastest. Smaller regional converters typically delay recycled-content investment until feedstock quality stabilizes and premium pricing justifies the capital outlay required, often waiting for larger competitors to prove the economics first across comparable production volumes before committing their own capital.
CAGR 10.5%

Anti-Static and ESD-Safe EPE Liners

Anti-static and ESD-safe EPE liners grow at 8.8% as expanding semiconductor and precision electronics manufacturing volume drives demand for liners engineered to prevent electrostatic discharge damage during shipping and storage. This segment carries the highest technical specification requirement in the portfolio, since electronics manufacturers demand documented surface resistivity testing that generalist converters without dedicated ESD engineering expertise rarely maintain independently. Converters with established semiconductor industry qualifications hold a genuine advantage over newer entrants still building the specialized testing infrastructure and clean manufacturing environments this category requires, since surface resistivity consistency depends heavily on tightly controlled production conditions that generalist foam converters rarely maintain across every production run and shift pattern without dedicated quality assurance staff.
CAGR 8.8%
Full segment breakdown across 6 segments available in the complete report.

Regional Architecture and Country Demand Map

East Asia leads on China's concentrated electronics and appliance manufacturing base and established foam converter infrastructure, while South Asia and Pacific grows fastest as India's electronics manufacturing incentive programmes expand this year and across the following forecast decade of coverage detailed fully in this report.

North America

The United States accounts for the largest share of regional demand as major electronics distribution and appliance manufacturing operations require consistent protective packaging supply across extensive domestic logistics networks. Established converters headquartered there, including Sealed Air and Sonoco, maintain deep domestic customer relationships and testing infrastructure that smaller international competitors struggle to replicate quickly. Canada contributes a smaller share tied to its integrated manufacturing supply chains with United States electronics and appliance producers. Growth trails the fastest-growing regions since domestic converter capacity already sits near mature utilization levels, leaving less incremental first-time conversion opportunity than emerging manufacturing regions elsewhere still building out their converter base from a smaller starting point and fewer established customer relationships.
Share: 24% | CAGR: 6.0% (2026 to 2036)

Western Europe

Germany and France anchor regional demand, with both countries maintaining substantial automotive and precision electronics manufacturing bases requiring reliable protective packaging supply chains. The European Union's expanding packaging waste and recycled-content regulation applies directly to foam packaging categories, pushing converters across the region toward documented closed-loop sourcing faster than most other markets globally. Public procurement sustainability requirements reinforce this shift across government-adjacent supply chains. Growth runs below the global average as the region's converter capacity expansion faces tighter regulatory compliance costs than emerging Asian producing regions building capacity from a smaller existing base and correspondingly lighter regulatory burden today, though compliance costs there are expected to rise over time as local regulation matures.
Share: 20% | CAGR: 5.2% (2026 to 2036)
Regional intelligence for 5 additional markets available in the complete report: East Asia, South Asia and Pacific, Latin America, Middle East and Africa, Eastern Europe. Contact sales@marketmindsadvisory.com.
epe-liner-market-country-cagr-analysis-1787299005614

Where EPE Liner Converters Can Expand Margin Now

Converters selling standard virgin foam liners alone are leaving margin on the table. Four levers let established manufacturers expand revenue per customer contract without simply chasing sheet volume across an increasingly commoditised base foam tier facing mounting price pressure from regional competitors and their leaner cost structures across every established product category and market.

Build Documented Closed-Loop Recycled Resin Traceability

Converters selling standard virgin liners alone leave higher-margin recycled-content work to specialist competitors even when the underlying resin processing capability could be built internally with modest investment. Establishing documented closed-loop traceability systems raises average revenue per customer contract by an estimated 16 to 24% while positioning converters ahead of competitors still relying entirely on virgin feedstock as buyer scorecards increasingly weight recycled content heavily. Brand owners increasingly prefer suppliers who can document sourcing all the way back to collection, reducing audit burden across their own supply chain and simplifying annual sustainability reporting obligations.
Market Impact: Raises revenue per contract 16-24% within three years

Publish Validated Cushioning Performance Test Data

Converters with multi-year validated cushioning performance data against documented damage-in-transit baselines can charge premium rates over competitors offering unproven density specifications alone, since electronics OEMs weigh documented drop-test and vibration data heavily during supplier qualification reviews. Published performance studies covering multiple shipping conditions support pricing premiums of roughly 10 to 16% above standard liner rates across comparable product categories. This lever rewards converters that invested early in dedicated testing laboratories rather than those still relying on generic foam density claims to win new OEM contracts across comparable product categories and shipping conditions.
Market Impact: Supports a pricing premium of roughly 10-16% overall

Expand Automated Die-Cutting Capacity Ahead of Demand

Establishing automated die-cutting and molding capacity ahead of confirmed customer demand lets converters win time-sensitive contracts that competitors relying on manual fabrication cannot credibly fulfill at scale, since new automated tooling and equipment commissioning often takes several months to complete before a facility can accept high-volume custom orders. Early movers captured an estimated 18% larger share of new custom fabrication contracts awarded over the past two years compared with converters that waited for confirmed demand signals before committing capital to expanded automation and its associated engineering integration work across multiple production lines and shifts.
Market Impact: Captures roughly 18% more new fabrication contracts yearly

Build Resin Hedging Programmes to Stabilize Pricing

Offering multi-year fixed-price contracts backed by internal resin hedging programmes lets converters win business from buyers seeking budget certainty that competitors exposed entirely to spot resin pricing cannot credibly offer, since unpredictable input cost swings make annual packaging budgeting genuinely difficult for large brand owners. Converters offering hedged pricing capture incremental contract value estimated near 11% above standard spot-indexed agreements, since buyers otherwise must build their own internal cost contingency reserves against future resin price volatility that hedged converters can absorb more predictably on their behalf across every affected product category.
Market Impact: Adds roughly 11% incremental contract value each year

Who Controls the Margin Pool

CR5 sits near 28%, evaluated on disclosed protective packaging segment revenue across public filings and industry disclosures where available. The gap between the top five diversified packaging manufacturers and the next tier of regional converters is moderate, since several mid-size firms hold strong regional customer relationships and specialized technical qualifications that larger generalist competitors cannot easily replicate across every geography and product category served today and into
Current competitive activity centers on three dimensions: recycled resin sourcing investment, automated fabrication capacity expansion, and technical specification certification depth. Large diversified manufacturers bundle EPE liners into broader protective packaging contracts, while regional specialists compete purely on delivery proximity and price documented across comparable customer accounts and their recurring replacement order cycles.

Emerging pressure comes from Asian converters offering lower-cost standard liner products without comparable recycled-content or specification testing capability, forcing established Western manufacturers to defend premium pricing through demonstrated technical differentiation. Rankings could shift toward converters combining validated recycled-content traceability with broad automated fabrication capacity over the next several customer contract renewal cycles across major electronics supply chains and their evolving procurement requirements and sustainability commitments.
epe-liner-market-company-positioning-matrix-1787299006128

Competitive Moat and Risk Dimensions

SEALED AIR CORPORATION

Moat: Broad protective packaging portfolio depth

Sealed Air's combined foam, film, and protective packaging portfolio gives it deep logistics and e-commerce customer relationships that narrower specialist competitors cannot easily replicate across comparable customer networks. Its established global manufacturing footprint supports rapid capacity scaling that smaller regional converters typically cannot match on comparable timelines.
SEALED AIR CORPORATION

Risk: Exposure to volatile resin costs

Sealed Air's foam packaging segment carries meaningful exposure to polyethylene resin price volatility given thin margins on commodity-adjacent product lines, leaving profitability more sensitive to feedstock cost swings than competitors with more diversified packaging chemistry portfolios able to offset softness in any single material category.
JSP CORPORATION

Moat: Proprietary EPE bead foam technology

JSP's proprietary ARPRO bead foam technology and decades of automotive and electronics OEM engineering relationships give it specification depth that newer entrants cannot easily replicate across comparable product categories. Its established Japanese and Asian manufacturing base supports strong regional customer loyalty built over many years of qualified supply.
JSP CORPORATION

Risk: Concentration in cyclical end markets

JSP's revenue concentrates heavily in automotive and electronics end markets, both of which experience meaningful cyclical demand swings tied to broader consumer spending patterns, leaving it more exposed to downturn risk than competitors with broader diversification across less cyclical packaging categories and end-use industry types.

Players Tracked

Prominent Players

Sealed Air Corporation
Pregis LLC
Storopack Hans Reichenecker GmbH
JSP Corporation
Sonoco Products Company

Other Key Players

Zotefoams plc
Kaneka Corporation
BASF SE
Foam Fabricators, Inc.
Polyfoam Packers Corporation
UFP Technologies, Inc.
Cellofoam North America Inc.
Trinity Packaging Supply
Signode Industrial Group LLC
FXI Holdings, Inc.
Recticel NV
Toray Industries, Inc.
Yamamoto Co., Ltd.
Macropack (Thailand) Co., Ltd.
Sanwa Kako Co., Ltd.

Recent Developments

MARCH 2025

Sealed Air launches expanded recycled-content EPE liner line

Sealed Air launched an expanded recycled-content EPE liner product line at its North American facilities, an organic capacity expansion rather than an acquisition, adding documented closed-loop traceability capability for electronics and appliance customers across multiple product categories and shipping specifications this year and next fiscal cycle.
Signal: Confirms established converters are investing in recycled content to defend premium pricing structures against newer entrants.
SEPTEMBER 2024

JSP Corporation acquires regional foam converter in Southeast Asia

JSP Corporation completed an acquisition of a regional foam converter in Southeast Asia, adding local manufacturing capacity rather than building comparable infrastructure from scratch, extending its automotive and electronics customer relationships closer to expanding regional manufacturing clusters across multiple national markets and their local supply chains.
Signal: Signals large converters increasingly prefer acquiring regional capacity over slower organic greenfield expansion projects this cycle.
JANUARY 2025

Pregis forms Asian foam manufacturing joint venture

Pregis and a regional foam manufacturer formed a joint venture establishing shared production capacity across Southeast Asian markets, splitting investment in facility buildout rather than either party expanding independently, targeting electronics customers seeking geographically diversified liner supply closer to their own expanding manufacturing base and its evolving logistics requirements.
Signal: Shows regional capacity expansion increasingly happens through shared-risk partnerships rather than solo investment this cycle and beyond.

Polyethylene Resin Cost and Feedstock Exposure

Polyethylene resin represents roughly 52 to 60% of EPE liner production cost, sourced primarily from petrochemical producers concentrated across the United States, Middle East, and China, where naphtha and ethane feedstock economics both directly influence resin pricing available to downstream converters and their annual procurement contract negotiations with major suppliers across every producing region covered in this year's assessment.
Global polyethylene resin prices spiked significantly through 2022 as naphtha feedstock costs surged alongside broader energy market disruption, compressing converter margins across the industry, according to disclosures in Sealed Air's annual report covering that period. Converters with multi-year fixed-price customer contracts absorbed much of the cost increase rather than immediately repricing agreements, pressuring near-term margin significantly across affected product lines and their planned capacity expansion budgets.

Converters with resin sourcing concentrated among a small number of petrochemical suppliers carry substantially more feedstock disruption exposure than those with diversified sourcing relationships across multiple producing regions and delivery corridors. Smaller regional converters lacking sourcing diversification face a genuine competitive disadvantage against larger vertically integrated manufacturers able to shift procurement toward whichever supplier currently offers the most favorable cost position.
epe-liner-market-cost-volatility-analysis-1787299006324

Diversify Resin Suppliers Across Multiple Regions

Converters are qualifying polyethylene resin suppliers across multiple producing regions rather than concentrating sourcing with a single petrochemical producer, reducing single-supplier disruption exposure while maintaining flexibility to shift procurement toward whichever supplier currently offers the strongest capacity position and delivery reliability for a given production run and pricing cycle, without disrupting existing customer delivery schedules.

Build Internal Resin Hedging and Contract Programmes

Larger converters are building internal resin hedging programmes and multi-year supply agreements specifically to smooth input cost volatility, accepting modest hedging cost in exchange for pricing predictability that spot-market purchasing cannot guarantee during genuinely volatile feedstock pricing periods affecting the broader industry and its supply chain partners across every affected production line and shift schedule.

Index Multi-Year Contracts to Resin Price Benchmarks

Newer customer contracts increasingly include resin price indexing clauses tied to published petrochemical market benchmarks, passing a portion of input cost volatility through to buyers automatically rather than absorbing the full impact against fixed multi-year pricing agreed before resin markets shifted significantly against original cost assumptions and production budget forecasts set at contract signing.

Portfolio Architecture for Margin Defence

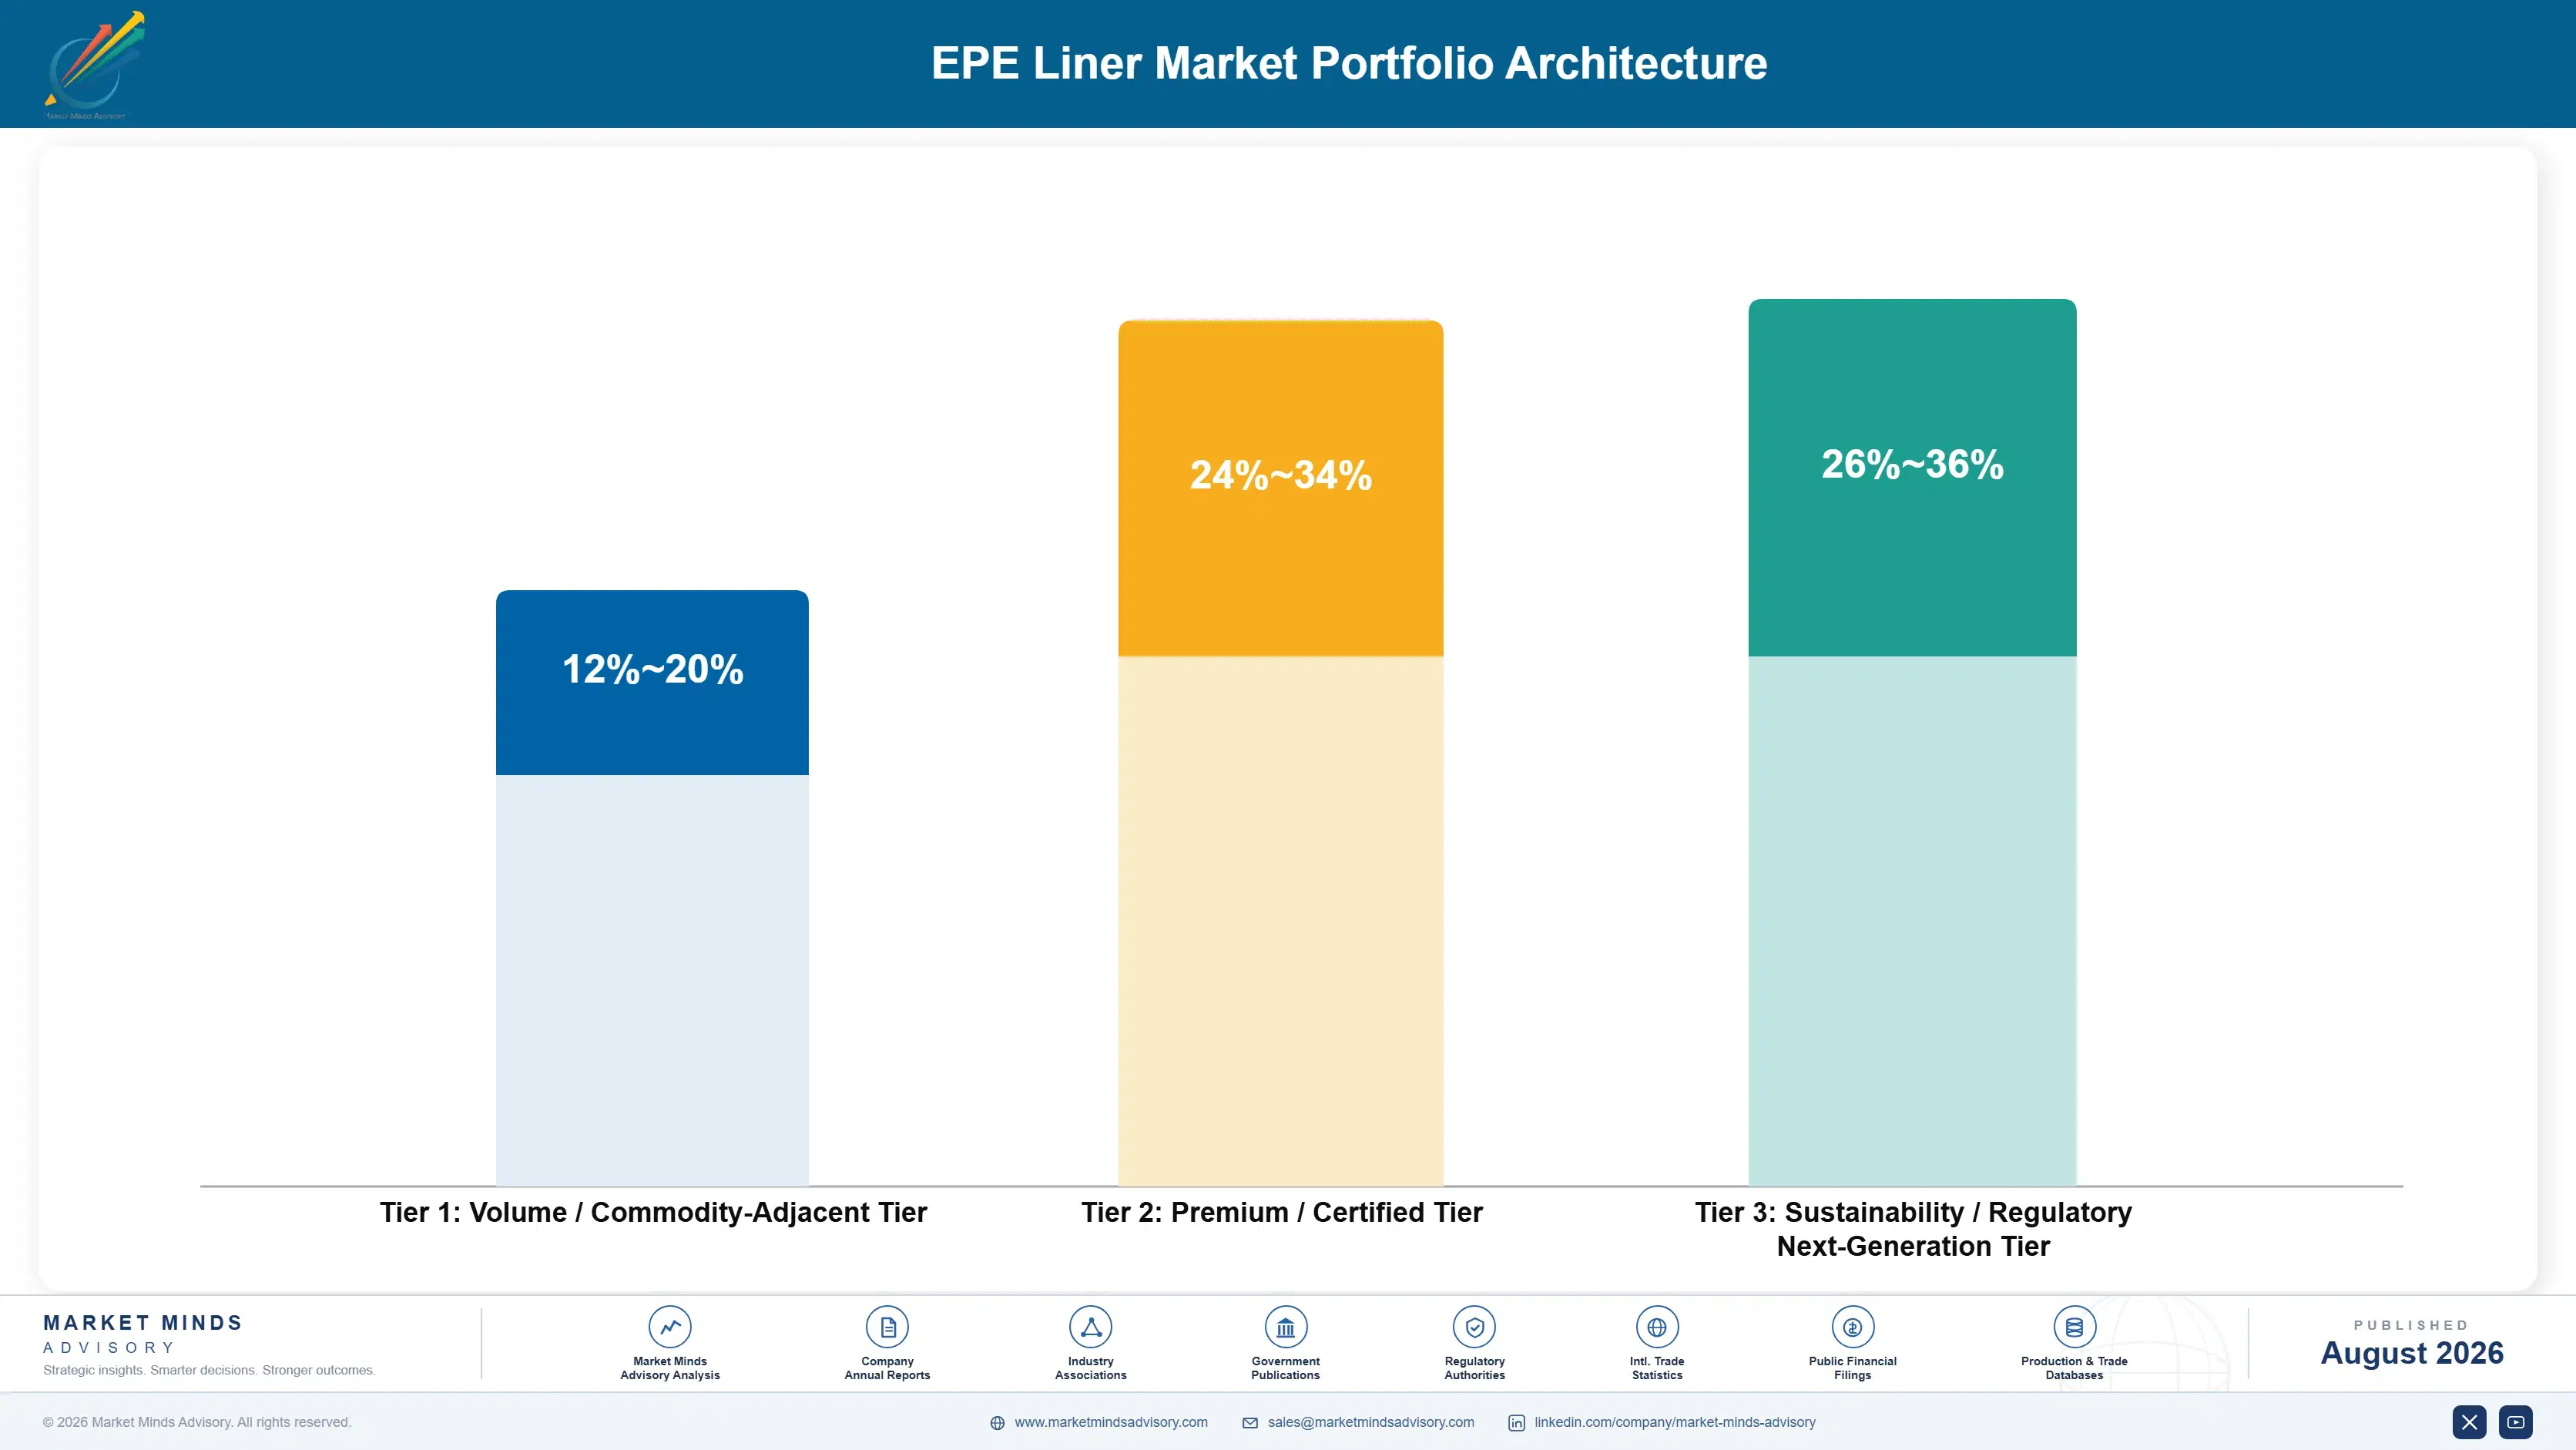
The portfolio splits across three tiers. Volume sheet and roll liners carry thin margin driven by resin cost competition and regional converter price pressure, premium anti-static and specification-tested liners command considerably stronger margin on technical differentiation and testing infrastructure investment, and emerging recycled-content liners command the strongest margin of all while volume remains comparatively small relative to the mature virgin foam base that still anchors most conve
Volume and premium work pull converters in different directions. Sheet and roll scale justifies continued production investment because it anchors customer relationships and funds fabrication infrastructure, but margin expansion increasingly depends on winning higher-value recycled-content and specification-tested contracts layered on top of that base relationship rather than sheet volume alone across a growing customer roster spanning multiple end-use categories, geographies, and sustainability commitment levels.

High-value margin pools concentrate around recycled-content liners for sustainability-committed brand owners and ESD-safe specialty formulations serving electronics manufacturers with case volumes large enough to justify premium testing investment above standard sheet rates in most established manufacturing markets with mature supplier qualification infrastructure already in place.

Volume / Commodity-Adjacent Tier

Standard sheet and roll EPE liners priced on resin-linked volume, competing mainly on delivery cost and regional proximity across large electronics and appliance manufacturer contracts, distribution agreements, and recurring replacement orders.
Gross Margin: 12-20%

Premium / Certified Tier

Anti-static, ESD-safe, and specification-tested liners requiring dedicated testing infrastructure commanding higher pricing across specialist semiconductor and precision electronics customer categories and their multi-year qualification programmes, renewal cycles, and audit requirements.
Gross Margin: 24-34%

Sustainability / Regulatory / Next-Generation Tier

Recycled-content liners with documented closed-loop traceability, priced on regulatory compliance value and brand sustainability positioning rather than raw volume across long-term supplier scorecard contracts, audit relationships, and multi-year renewal negotiations.
Gross Margin: 26-36%
epe-liner-market-portfolio-architecture-1787299006822

High-value Sub-segments and Strategic Watch-out

Recycled-Content EPE Liners

High value and high growth at 10.5%, the fastest category by a wide margin, as brand owners move recycled content from pilot into standard procurement requirements this year and its underlying survey data, expert interviews, and long-range forecasts through the full decade ahead and beyond.
Gross Margin: 26-36%

Anti-Static and ESD-Safe EPE Liners

High value with strong growth at 8.8%, driven by expanding semiconductor and precision electronics manufacturing volume lifting demand for engineered discharge-safe liner formulations across qualified converter networks, testing facilities, clean manufacturing environments, and certification programmes tracked closely worldwide this year and the past several cycles.
Gross Margin: 24-34%

Sheet and Roll EPE Liners

The volume core by shipped tonnage, growing near 4.8% as rising shipment volume sustains steady intake demand even as margin concentrates elsewhere across the broader portfolio, margin mix, and evolving customer specification structure over the coming decade and well beyond it across every producing region.
Gross Margin: 12-20%

Laminated and Multi-Layer EPE Liners

The strategic watch-out, growing slowest at roughly 5.0% and facing commoditisation as standard laminated constructions become a bundled entry-level offer rather than a genuinely differentiated purchase decision across most accounts reviewed carefully this year and the last two full forecast cycles quite closely and thoroughly.
Gross Margin: 16-24%

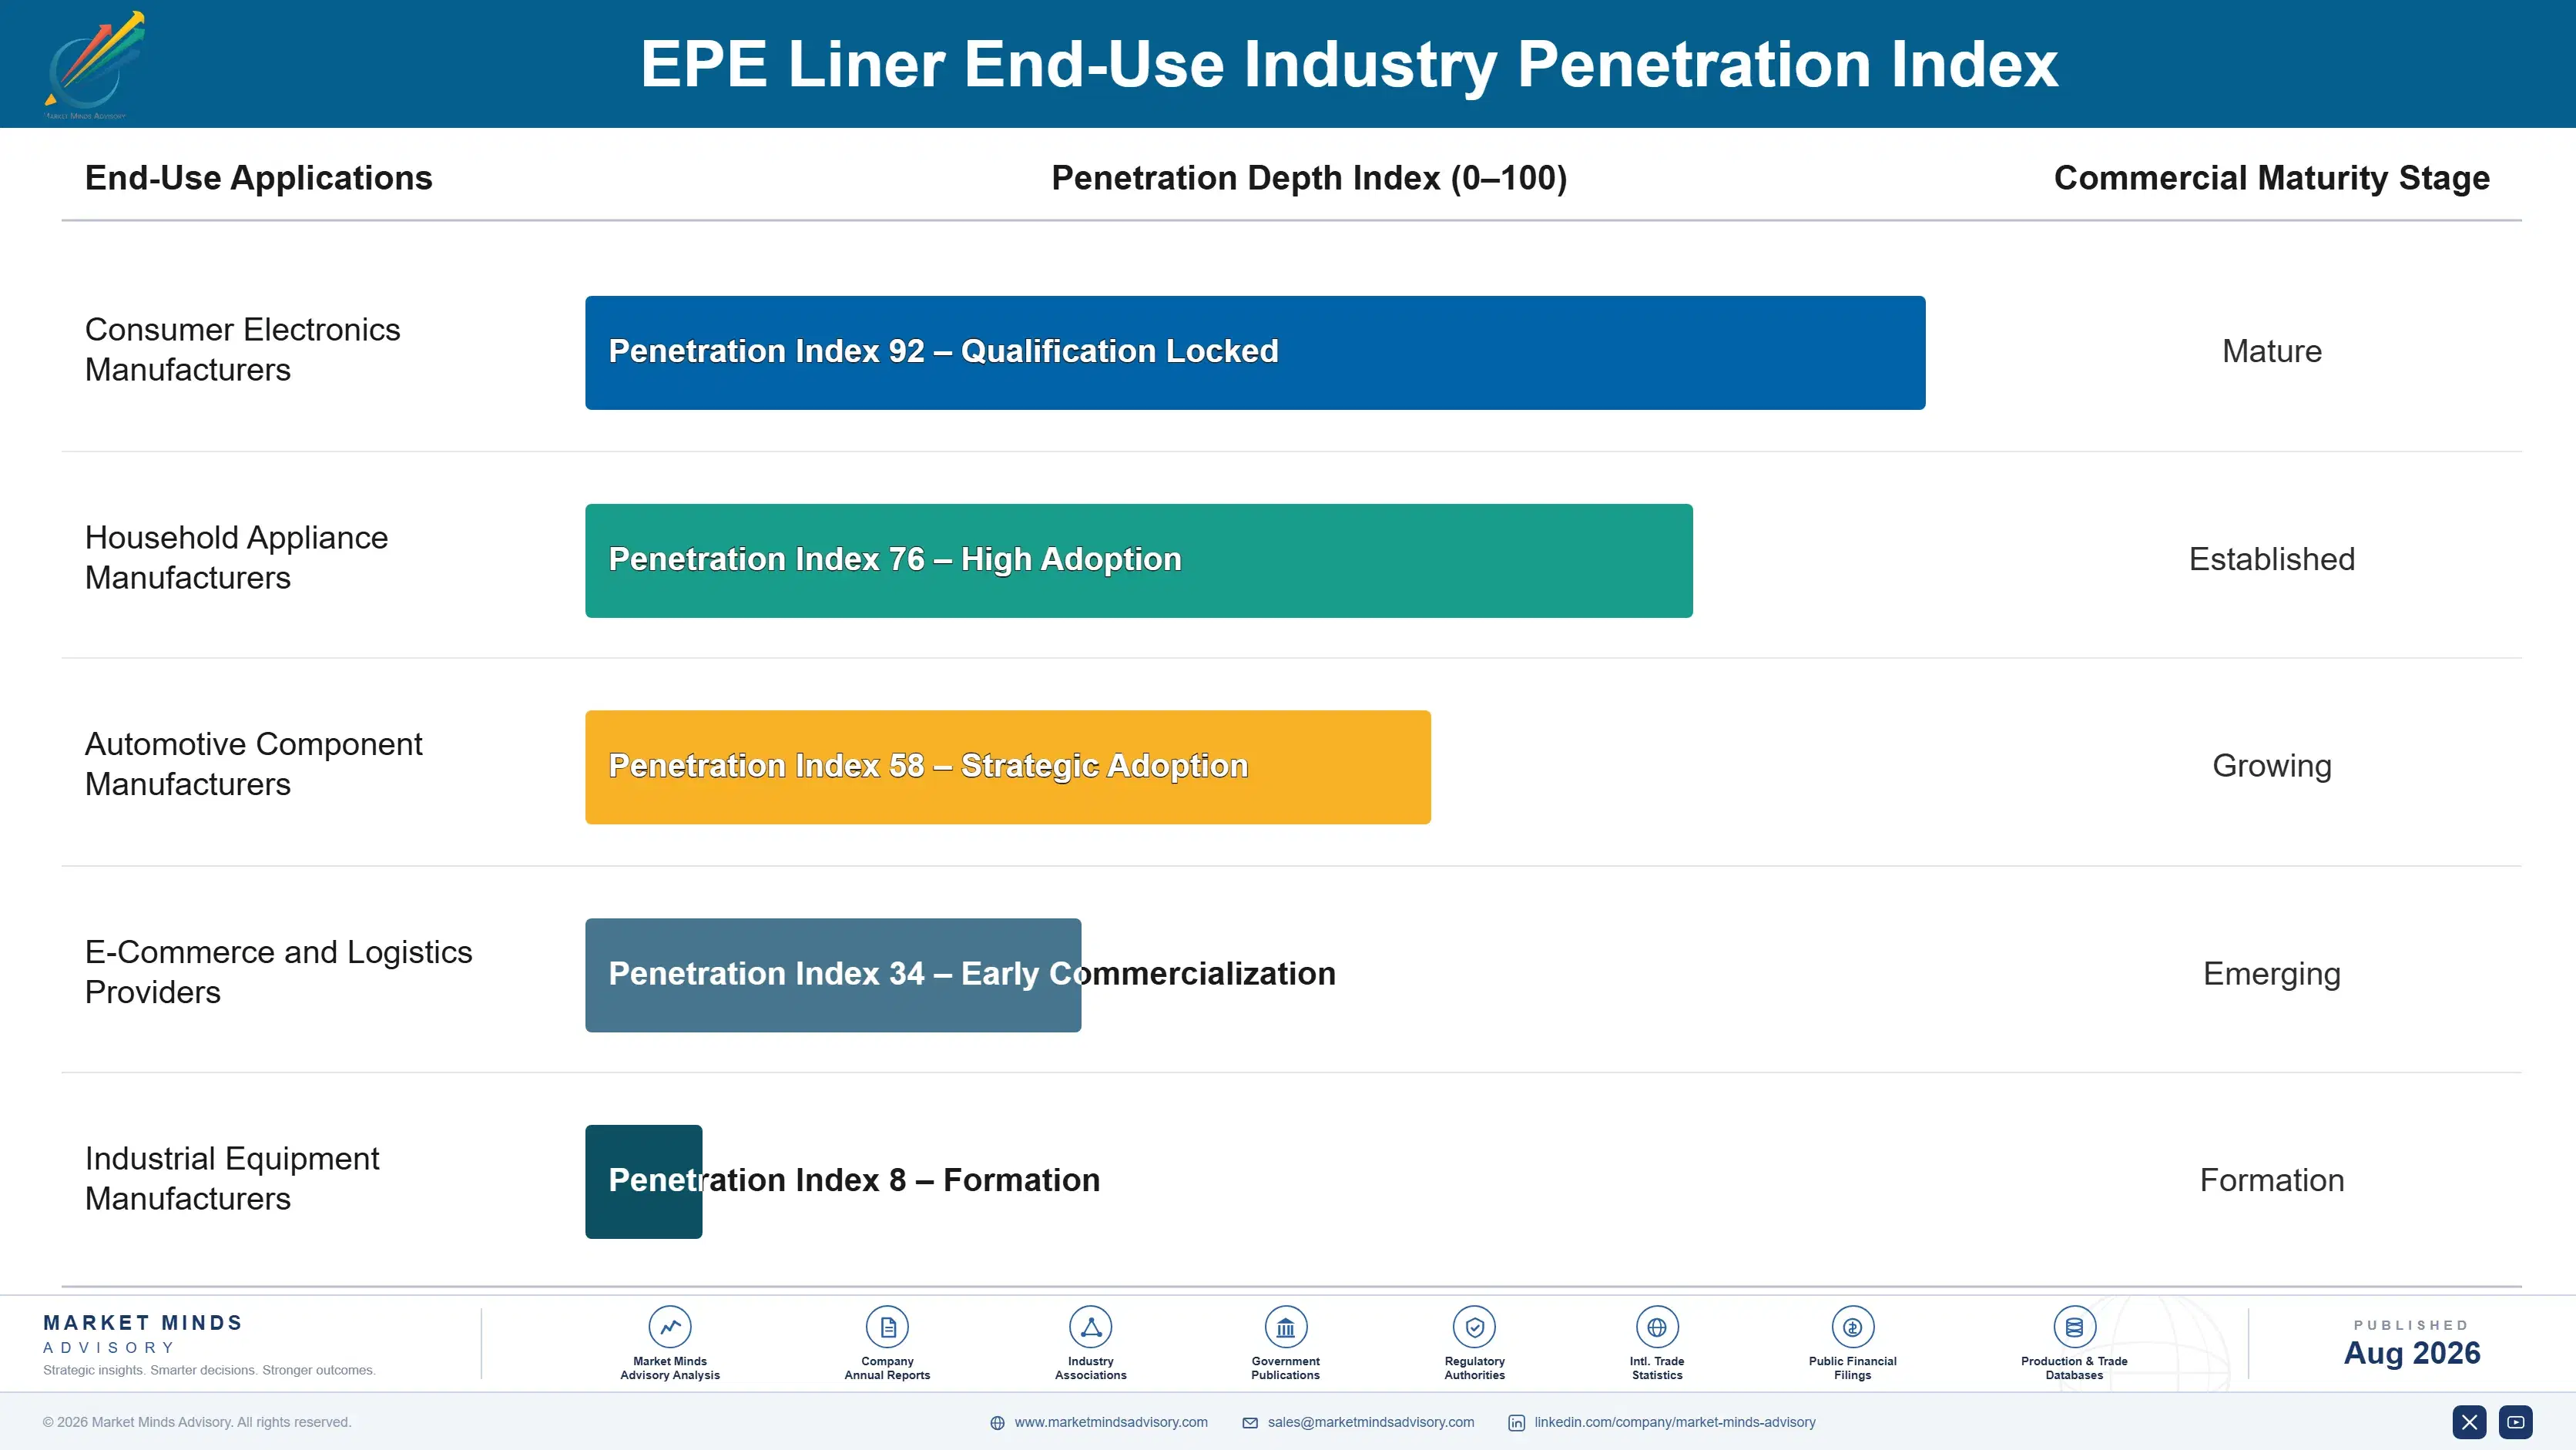
Long Supplier Qualifications Anchor Converter Relationships

EPE liner supply behaves like an annuity tied to each customer's product line entire commercial lifecycle rather than a one-time purchase order. Every new product launch, packaging redesign, and sustainability commitment extends the converter relationship, and switching suppliers mid-contract carries genuine requalification risk that keeps renewal rates high across established supply relationships built over many years of consistent performance and documented quality compliance records.
Adoption depth varies considerably by end-use vertical. Large electronics and appliance manufacturers maintain the deepest supplier diversification, often qualifying multiple converters across different liner categories simultaneously, while smaller manufacturers typically depend on a single established supplier relationship until a quality or capacity disruption forces diversification. This dynamic keeps switching costs asymmetric across customer size and packaging engineering sophistication, favoring converters that can demonstrate documented supply resilience upfront.

A generational shift is underway in packaging procurement leadership. Younger sustainability officers trained on lifecycle assessment methodology favor converters demonstrating documented recycled-content traceability over converters relying purely on established reputation, gradually reshaping which suppliers win new long-term packaging mandates across the industry and how existing contracts get renegotiated at each renewal point across multiple product lines.
epe-liner-market-end-use-penetration-index-1787299007308

Where EPE Converters Focus Next

These are among the four positions where our research anticipates prominent divergence between winners and laggards over the coming forecast period. Each is grounded in the demand model, the regulatory perimeter, and the announced capacity pipeline.
01 / RECYCLED CONTENT INVESTMENT

Fund closed-loop traceability before competitors close the gap

Converters without documented closed-loop recycled resin traceability will lose ground to competitors that invested early, since brand owners increasingly demand documented sourcing evidence before signing new supply contracts across sustainability-committed accounts. The window for differentiated positioning is narrowing as more converters reach comparable recycled-content maturity within the next several contract renewal cycles. Waiting another budget cycle risks permanent competitive disadvantage against early movers who already hold demonstrable traceability evidence in front of prospective brand owner clients evaluating comparable supplier shortlists this cycle.
02 / TECHNICAL TESTING INFRASTRUCTURE

Build dedicated cushioning performance testing capability now

Electronics OEMs increasingly demand documented drop-test and vibration performance data before qualifying a new liner supplier, making dedicated testing infrastructure a genuine competitive advantage rather than optional capital spending. Converters investing now secure premium contract positioning that competitors relying on generic density specifications will struggle to match once buyer requirements tighten further across the industry. This matters most for converters targeting semiconductor and precision electronics accounts carrying the strictest incoming specification demands and the least tolerance for unproven claims from unfamiliar suppliers.
03 / RESIN COST RISK MANAGEMENT

Build hedging programmes to protect margin against volatility

Converters without internal resin hedging programmes remain exposed to sudden feedstock cost swings that diversified competitors can better absorb through structured procurement contracts. Building hedging capability now protects margin during the next genuinely volatile pricing cycle rather than after damage is already done to profitability. This matters most for converters carrying thin, commodity-adjacent margins on standard sheet and roll product lines lacking premium differentiation to absorb cost shocks without passing them directly through to customers already sensitive to price increases.
04 / REGIONAL CAPACITY EXPANSION

Expand capacity in emerging manufacturing corridors early

India and Southeast Asia's expanding electronics manufacturing capacity represents substantial first-time packaging demand that converters lacking regional presence cannot fully capture given established customer preference for geographically proximate suppliers. Expanding capacity now captures share before competitors establish comparable regional footholds. Converters that delay this investment risk losing first-mover advantage entirely to regional competitors already building local manufacturing relationships, a gap that grows harder to close as brand loyalty solidifies among early-adopting manufacturers and their expanding purchasing organizations across multiple facilities.

Engagement Snapshot From the Field

A live engagement with an industry participant carrying material or product regulatory and market exposure ahead of a defining policy shift, showing how our research translates into a defensible multi-year portfolio strategy.
MARKET MINDS ADVISORY · CLIENT ENGAGEMENT SUMMARY
EPE Liner Producer Strategic Portfolio Review and Transition Roadmap 2026·Investment Scenario on EPE Liner Exposure Evaluation 2025-26
CLIENT PROFILE
A mid-size consumer electronics manufacturer shipping products through multiple regional distribution centers engaged MMA while evaluating whether to consolidate its fragmented liner supplier base ahead of a new corporate sustainability procurement policy requiring documented recycled content across all packaging categories. The client reported working with seven different regional liner suppliers across its facilities (client-reported, unverified by MMA).
STRATEGIC CHALLENGE
The client's fragmented supplier base made recycled-content compliance tracking genuinely difficult, yet full consolidation risked disrupting established regional delivery relationships that had performed reliably for years. Leadership needed a defensible consolidation plan before the new sustainability policy took effect at the start of the next fiscal year, with limited internal analytical resources available to build one independently.
MMA APPROACH
MMA benchmarked all seven existing suppliers against recycled-content capability, testing infrastructure, and regional delivery reliability, modeled three consolidation scenarios spanning full single-source, regional dual-source, and selective four-supplier structures, and evaluated pricing impact across each scenario using disclosed benchmarks from comparable manufacturer engagements across similar electronics supply chains and their sustainability procurement policies.
KEY FINDINGS
  1. Only two of seven existing suppliers offered documented recycled-content traceability meeting the new sustainability policy requirements without additional capital investment upfront right away.
  2. A regional dual-source structure retaining suppliers in the two highest-volume distribution regions matched the approach used by three comparable manufacturers reviewed closely here.
  3. Full single-source consolidation would have required a distant supplier to serve regions poorly, risking delivery reliability across the client's entire distribution network.
  4. Selective four-supplier consolidation reduced total supplier count by 43% while preserving regional delivery performance across every distribution center in the client's network.
CLIENT PROFILE
A mid-size consumer electronics manufacturer shipping products through multiple regional distribution centers engaged MMA while evaluating whether to consolidate its fragmented liner supplier base ahead of a new corporate sustainability procurement policy requiring documented recycled content across all packaging categories. The client reported working with seven different regional liner suppliers across its facilities (client-reported, unverified by MMA).
STRATEGIC CHALLENGE
The client's fragmented supplier base made recycled-content compliance tracking genuinely difficult, yet full consolidation risked disrupting established regional delivery relationships that had performed reliably for years. Leadership needed a defensible consolidation plan before the new sustainability policy took effect at the start of the next fiscal year, with limited internal analytical resources available to build one independently.
MMA APPROACH
MMA benchmarked all seven existing suppliers against recycled-content capability, testing infrastructure, and regional delivery reliability, modeled three consolidation scenarios spanning full single-source, regional dual-source, and selective four-supplier structures, and evaluated pricing impact across each scenario using disclosed benchmarks from comparable manufacturer engagements across similar electronics supply chains and their sustainability procurement policies.
KEY FINDINGS
  1. Only two of seven existing suppliers offered documented recycled-content traceability meeting the new sustainability policy requirements without additional capital investment upfront right away.
  2. A regional dual-source structure retaining suppliers in the two highest-volume distribution regions matched the approach used by three comparable manufacturers reviewed closely here.
  3. Full single-source consolidation would have required a distant supplier to serve regions poorly, risking delivery reliability across the client's entire distribution network.
  4. Selective four-supplier consolidation reduced total supplier count by 43% while preserving regional delivery performance across every distribution center in the client's network.
RECOMMENDED STRATEGY
Phase 1: Phase 1 (Months 1-3): Qualify two recycled-content suppliers to serve the client's two highest-volume distribution regions immediately and reliably each quarter. Phase 2: Phase 2 (Months 4-8): Transition remaining regions to the selected four-supplier structure while monitoring delivery performance closely throughout the entire process. Phase 3: Phase 3 (Months 9-14): Formalize supplier scorecards tracking recycled content and performance data across the fully consolidated supplier base going forward.
OUTCOME
The client completed the four-supplier consolidation and reported full recycled-content policy compliance ahead of the fiscal year deadline, along with an 11% reduction in total liner procurement cost through improved volume leverage per supplier, simplified compliance reporting, and stronger delivery reliability across every region (client-reported, unverified by MMA).

Frequently Asked Questions

Foundational context covering the market sizes, CAGR, scope, country, region and competition that inform every finding below. This section is provided to cover basics and most often pre-purchase conversations, answered from the MMA Primary Research Dataset.

What is the current size of the EPE Liner Market?

The global EPE liner market is valued at USD 3.2 billion in 2025, covering sheet, die-cut, laminated, anti-static, and recycled-content protective foam liner categories worldwide.

How large will the EPE Liner Market be by 2036?

The market is projected to reach USD 6.33 billion by 2036, roughly 1.86 times its 2026 value of USD 3.4 billion, driven by recycled-content adoption and electronics shipping growth.

What is the CAGR for the EPE Liner Market 2026 to 2036?

The base case CAGR is 6.4%, with a bull case of 7.6% if recycled-content adoption accelerates faster than expected, and a bear case of 5.2% under material substitution pressure.

Which segment is growing fastest?

Recycled-Content EPE Liners lead at a 10.5% CAGR, roughly 1.64 times the overall market rate, as brand owners move recycled content into standard procurement requirements.

Who are the major companies in the EPE Liner Market?

Sealed Air, Pregis, Storopack, JSP Corporation, and Sonoco lead the market, together holding roughly 28% of protective packaging segment revenue generated worldwide, per company filings.

Which country is growing fastest?

India leads at a 9.4% CAGR as Production Linked Incentive programmes accelerate domestic electronics manufacturing capacity across newly established industrial corridors and export zones nationwide.

Report Segmentation Architecture

The full report scope spans multiple orthogonal segmentation dimensions, with cross-tabulated demand data provided for each dimension pair. Coverage extends further to regional breakdowns, trend trajectories, and the competitive detail needed to support segment-level decision-making.

By Product Form

  • Sheet and Roll EPE Liners
  • Die-Cut and Molded EPE Liner Inserts
  • Laminated and Multi-Layer EPE Liners
  • Anti-Static and ESD-Safe EPE Liners
  • Recycled-Content EPE Liners
  • Custom Fabricated EPE Liner Solutions

By End-Use Industry

  • Consumer Electronics Manufacturers
  • Household Appliance Manufacturers
  • Automotive Component Manufacturers
  • E-Commerce and Logistics Providers
  • Industrial Equipment Manufacturers

By Commercial Dimension

  • Direct Manufacturer Supply Contracts
  • Distributor and Wholesale Channels
  • Custom Fabrication Service Agreements
  • Recycled-Content Supplier Scorecard Programmes

By Region

  • North America
  • Western Europe
  • East Asia
  • South Asia and Pacific
  • Latin America
  • Middle East and Africa
  • Eastern Europe

Scope, Methodology, and Coverage

Every figure in this report is reproducible from documented input assumptions. The scope below maps the historical period, the forecast horizon, the segmentation dimensions, and the countries covered, alongside the underlying primary and qualitative methodology.
Historical Period
2020 to 2025
Forecast Period
2026 to 2036
Base Year
2025 (USD billions; MMA Primary Research Dataset, August 2026)
Market Definition
The EPE liner market covers expanded polyethylene foam sheet, roll, die-cut, and molded liner products used for protective cushioning and surface protection inside shipping and retail packaging. It excludes expanded polystyrene and polyurethane foam packaging, corrugated inserts without foam components, and EPE foam sold for non-packaging applications.
Quantitative Units
USD billions (current prices); shipped tonnage where applicable
Segmentation Dimensions
By Product Form; By End-Use Industry; By Commercial Dimension; By Region
Regions Covered
North America, Western Europe, East Asia, South Asia and Pacific, Latin America, Middle East and Africa, Eastern Europe
Countries Covered
USA, China, Germany, France, UK, Japan, South Korea, India, Australia, Canada, Brazil, Mexico, Saudi Arabia, UAE, South Africa, Nigeria, Turkey, Poland, Hungary, Romania, Italy, Spain, Sweden, Switzerland, Netherlands, Singapore, and additional markets relevant to this sector
Key Companies Profiled
Sealed Air Corporation, Pregis LLC, Storopack Hans Reichenecker GmbH, JSP Corporation, Sonoco Products Company, Zotefoams plc, Kaneka Corporation, BASF SE, Foam Fabricators, Inc., Polyfoam Packers Corporation, UFP Technologies, Inc., Cellofoam North America Inc., Trinity Packaging Supply, Signode Industrial Group LLC, FXI Holdings, Inc., Recticel NV, Toray Industries, Inc., Yamamoto Co., Ltd., Macropack (Thailand) Co., Ltd., Sanwa Kako Co., Ltd.
Quantitative Methodology
Primary survey, n=3,800 respondents, Q4 2025, six countries; demand-side model with trade association cross-validation
Qualitative Methodology
47 expert interviews, Q4 2025; applied to validate demand model assumptions, identify emerging dynamics, and assess competitive positioning
Report Format
PDF and XLSX data workbook (Word format preview document)
Publisher
Market Minds Advisory
Report Code
MMA-2026-PAC-172
Published
August 2026
Contact
sales@marketmindsadvisory.com | www.marketmindsadvisory.com

Purchase the full EPE Liner Market Report (2026 to 2036).

The full report delivers granular sizing and forecasts across all six product form segments and seven global regions through 2036. It profiles twenty companies across diversified packaging manufacturers and specialist regional converters, benchmarking recycled-content capability, testing infrastructure, and automated fabrication capacity in considerable detail. Analysts detail polyethylene resin cost exposure, portfolio margin tiers, and demand architecture by end-use vertical across major global markets and their evolving sustainability procurement environments. Buyers receive both the standalone report and full access to underlying data tables supporting every figure and forecast presented throughout.
Six-segment product form sizing and full forecasts
Seven-region global market share breakdown detail
Twenty-company detailed competitive profile benchmarking analysis
Polyethylene resin cost exposure and mitigation pathway analysis
Portfolio margin tier benchmarking economics framework
Anonymised client engagement outcome case study

Built For The People Who Decide

From boardroom strategy to bench-side execution, this report is read cover-to-cover by leaders shaping the next decade of their industry, turning demand scenarios, market dynamics and valuation benchmarks into decisions.
CXOs/ Presidents/ VPs/ Managers
M&A and Corporate Development
Strategy Teams and R&D Heads
Procurement and Product Directors
Regulatory and Compliance Leaders
Investor Relations and Equity Analysts