Market Minds Advisory
Enterprise VSAT Systems Market

Enterprise VSAT Systems Market: Enterprise VSAT Systems Market: Orbital Architectures, Terminal Economics and Contract Repricing 2026 to 2036

Demand for this market runs inversely to the quality of terrestrial infrastructure, which makes it the one enterprise connectivity category where the worst served regions are also the largest customers.

Lead Analyst

Published

September 2026

Make Smarter Decisions with Customized Research Insights

Request a free sample report and evaluate market opportunities, growth trends, and competitive dynamics relevant to your business needs.

2025 MARKET VALUE$4.8BMarket Size 2025
2036 FORECAST VALUE$14.5BBase Case , 2026 to 2036
CAGR 2026 TO 203610.6 %Bull 11.9% / Bear 9.3%
INCREMENTAL OPPORTUNITY$9.2BNet 10- year value creation
EXPANSION MULTIPLE2.74x2036 value over 2026 base
Strategic Levers
M&A Pipeline
Regional Outlook
Country Rankings
Competitive Intelligence
Segmental Deep-dive
Call-Us : 91 93563 13602

Executive Snapshot and Market Trajectory.

Every conventional market sizing heuristic gets this category wrong. Demand runs inversely to terrestrial network quality, so the largest enterprise markets are the places with the worst fixed line coverage rather than the richest ones. Around 31% of enterprise sites have no viable terrestrial option.
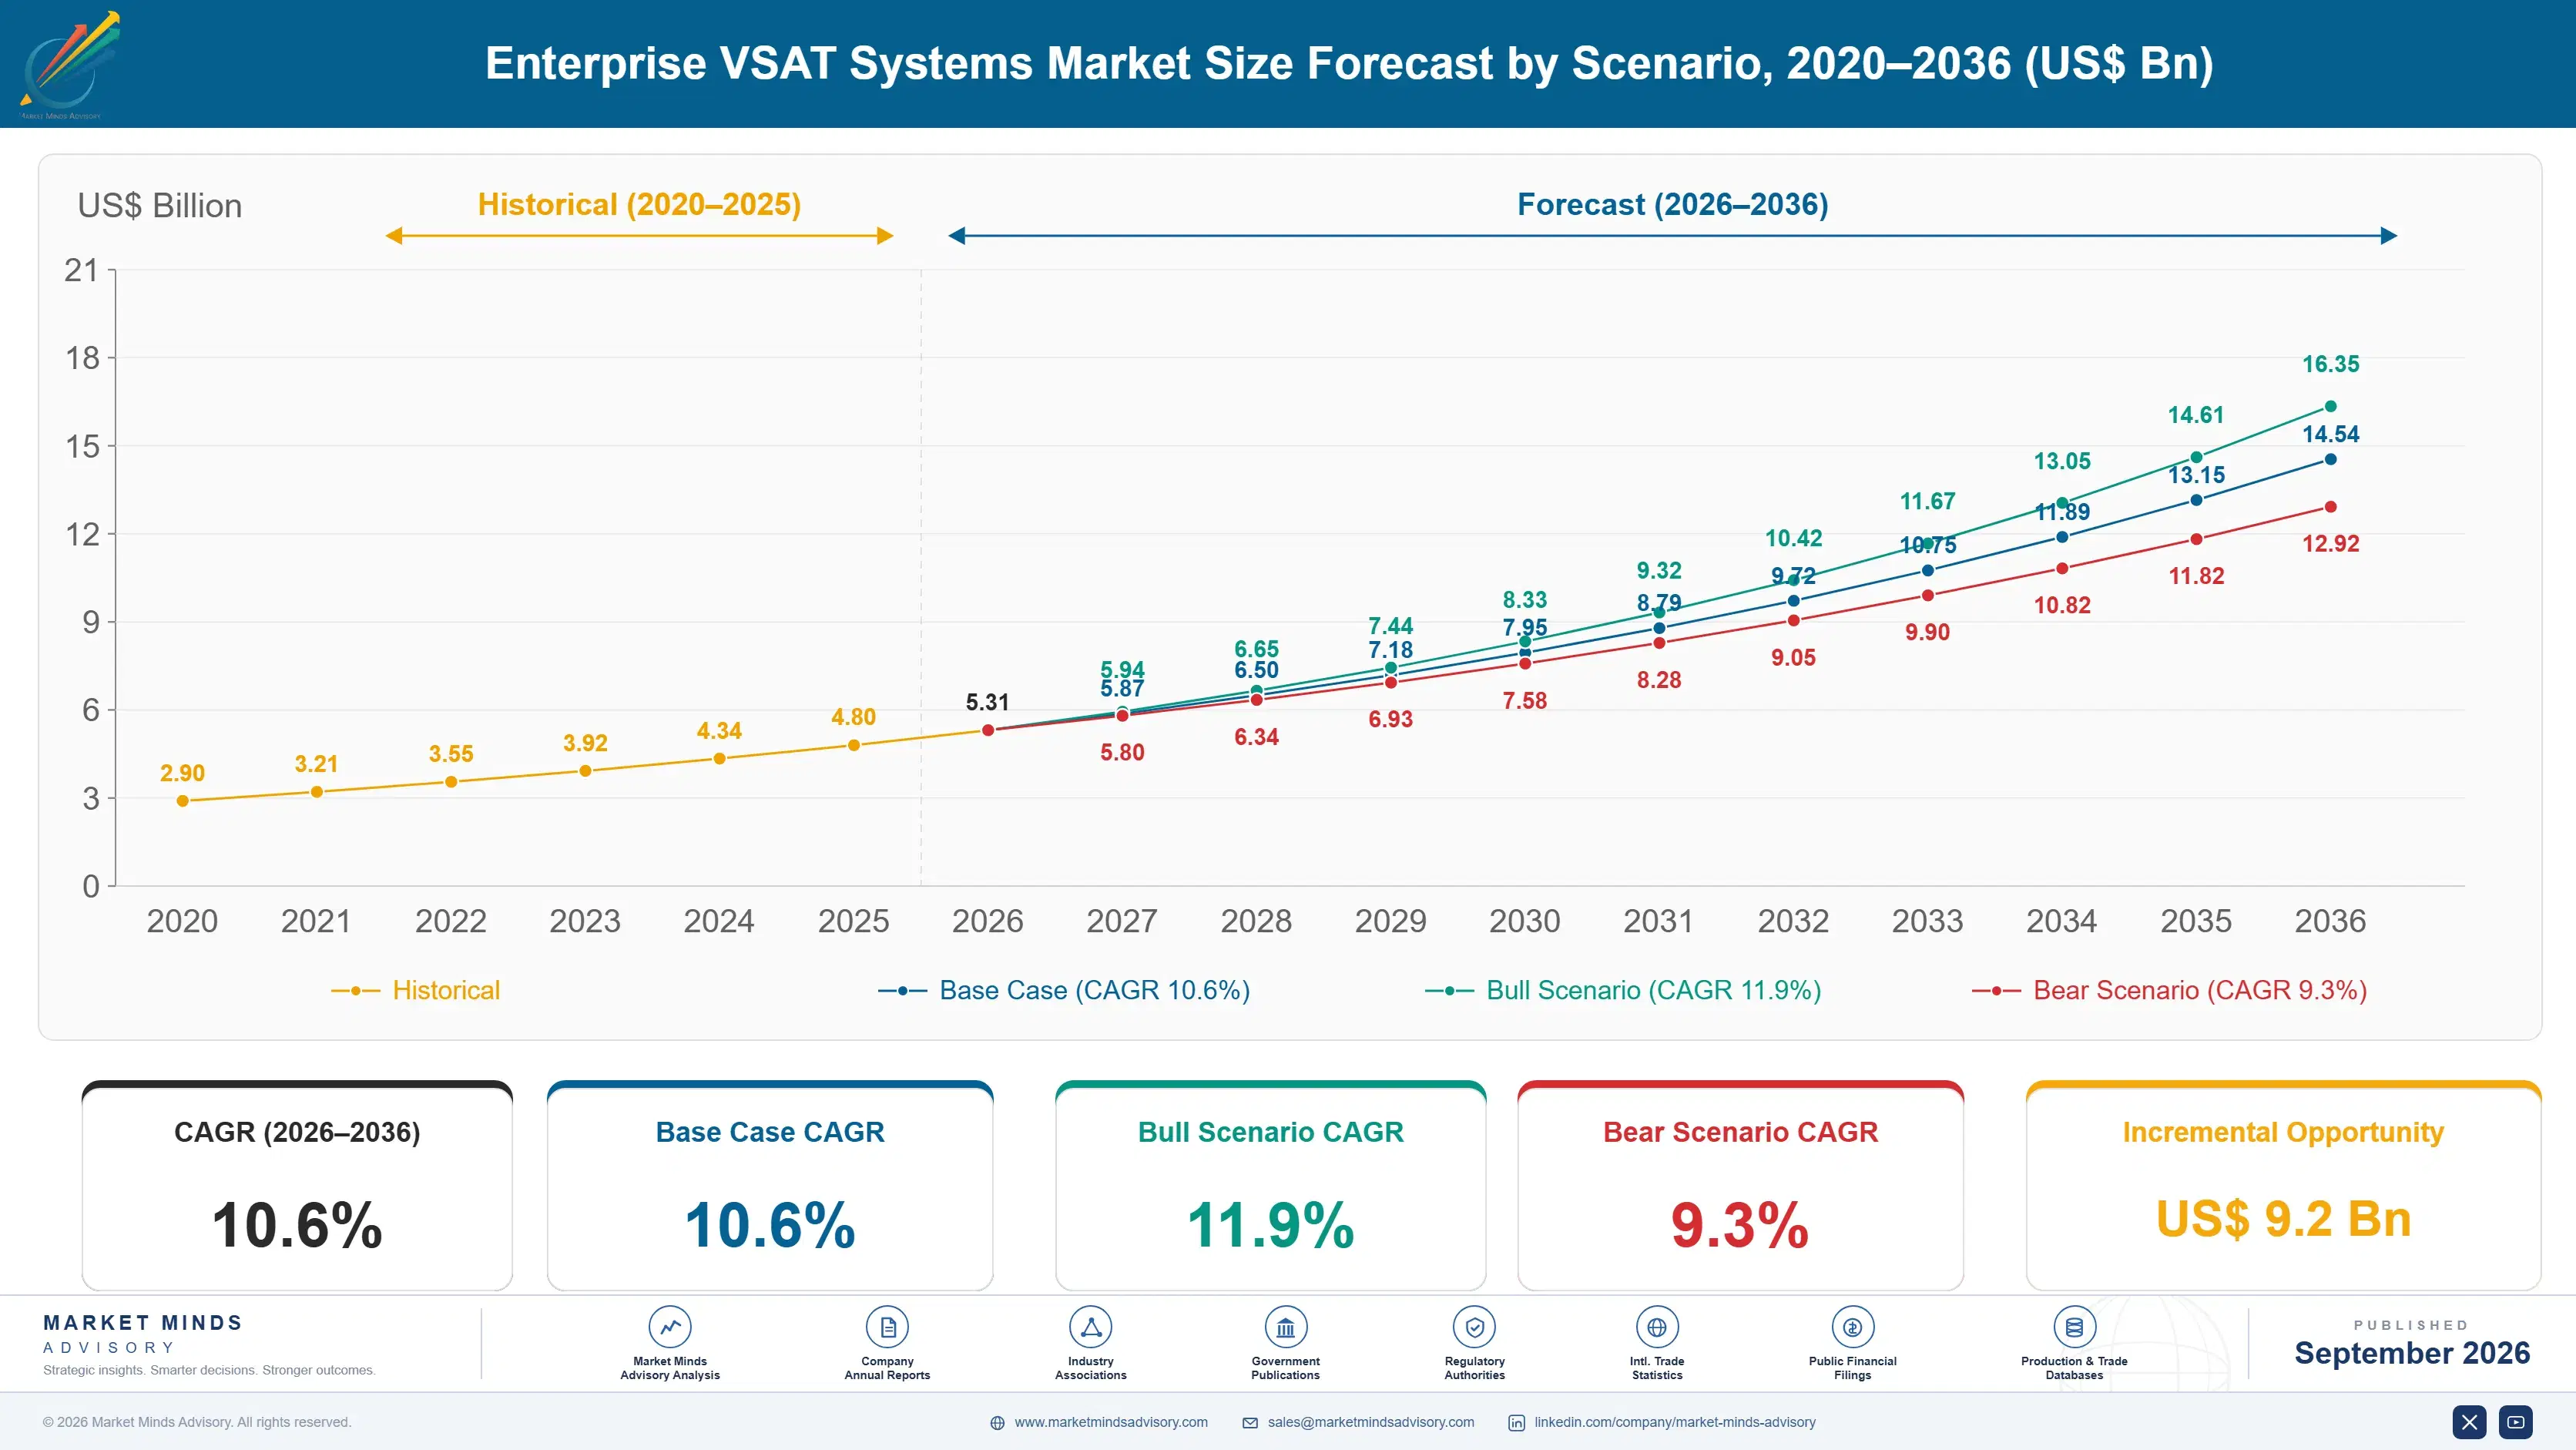
The market reaches USD 5.31 billion in 2026 and USD 14.54 billion by 2036, a 2.74 times expansion at 10.6%. Low earth orbit connectivity grows at 15.9%, half again the market rate of 10.6%, because 38 millisecond latency makes applications work that geostationary links simply could not carry. South Asia and Pacific holds 25% of terminal and service revenue on geography, and Indonesia grows fastest at 18.2% across some seventeen thousand separate islands.
Five operators hold 43% of terminal and service revenue. Viasat and Hughes Network Systems built geostationary enterprise positions across decades of long contracts. SES operates across multiple orbits. Eutelsat OneWeb and Starlink arrived selling bandwidth like terrestrial providers do, monthly and cancellable, against incumbents whose entire commercial model assumed committed capacity. Everybody is now repricing a book written under assumptions that no longer hold anywhere at all.
Market Definition
This report covers enterprise satellite connectivity terminals and services delivered through very small aperture terminal architectures: low earth orbit constellation connectivity, multi-orbit managed connectivity, geostationary Ka-band high throughput services, geostationary Ku-band wide beam services, medium earth orbit connectivity, and C-band and legacy wide beam services. It excludes consumer broadband subscriptions, direct to home broadcast, satellite manufacturing and launch, government and military dedicated systems, and terrestrial network equipment.
Base Year Value
$4.8B in 2025 (MMA Primary Research Dataset, September 2026)
Forecast Period
2026 to 2036, eleven discrete annual values
CAGR
10.6% base case. Bull 11.9%. Bear 9.3%.
Fastest Growth Segment
Low Earth Orbit Constellation Connectivity: 15.9% CAGR
Fastest Growth Country
Indonesia: 18.2% CAGR
Fastest Growth Region
South Asia and Pacific: 12.8% CAGR
Largest Region
South Asia and Pacific: 25% of 2025 global value
Market Leaders
Viasat, Hughes Network Systems, SES, Eutelsat OneWeb and Starlink lead on enterprise terminal and connectivity service revenue. Source: MMA Analysis.
Primary Survey
n=3,800 procurement and R&D decision-makers, Q4 2025, six countries
Methodology
Demand-side build-up, cross-validated against public data, 47 expert interviews

Enterprise VSAT Systems Market Forecast Scenarios

enterprise-vsat-systems-market-size-forecast-scenario-1789988870378
Between 2020 and 2025 the category compounded at 9.2%, and the commercial model underneath it changed completely partway through. Geostationary capacity was sold by megahertz on multi-year commitments because a satellite is a fixed asset with fixed capacity over a fixed footprint. Low earth orbit constellations arrived selling bandwidth per site per month, cancellable, and every incumbent contract became a comparison nobody wanted made.
The base case holds 10.6% on three mechanisms. Around 31% of enterprise sites still have no viable terrestrial alternative, and that gap closes slowly because the economics of rural fibre have not improved. Maritime and aviation connectivity keep expanding as passenger and crew expectations rise on vessels and aircraft that were offline a decade ago. And multi-orbit managed services are converting single-link sites into resilient ones, which raises spend per site rather than adding sites.
The bull case at 11.9% assumes electronically steered flat panel terminal costs fall far enough to remove the deployment barrier, since terminal price rather than capacity now gates enterprise adoption. The bear case at 9.3% is capacity pricing falling faster than volume grows: delivered bandwidth prices are declining around 22% annually, and revenue can shrink while traffic rises considerably.

Where The Ground Networks Do Not Reach

This is the only enterprise connectivity category where demand rises as infrastructure quality falls. A mining site in Western Australia, a bank branch in eastern Indonesia and an offshore platform in the Gulf of Guinea all need connectivity and none of them will ever get fibre. Around 31% of enterprise sites globally have no viable terrestrial option, and that inverse relationship explains the regional shape of this market entirely.
TOP FIVE CONCENTRATION43%Concentrated among constellation operators and integrated service providers
ENTERPRISE TERMINAL COSTUSD 2,400Average installed cost per site including antenna and mounting
ROUND TRIP LATENCY38 millisecondsTypical for low earth orbit against geostationary alternatives available
SERVICE CONTRACT LENGTH14 monthsAverage commitment across enterprise connectivity agreements signed now
TERRESTRIAL COVERAGE GAP31%Share of enterprise sites without viable fixed line access
CAPACITY PRICE DECLINE22%Annual reduction in delivered bandwidth pricing across all orbits
Low earth orbit did not simply improve latency, it dismantled the pricing model. Geostationary capacity was sold by megahertz on multi-year commitments, because a satellite is a fixed asset covering a fixed footprint with fixed capacity. Constellations sell bandwidth per site per month with short commitments, and enterprise buyers now compare a three year committed rate against something that looks like a consumer subscription and costs far less.
The constraint moved to the antenna, which nobody planned for. Tracking satellites crossing the sky requires either a mechanically steered dish or an electronically steered flat panel, and installed terminal cost averages around USD 2,400 per site. Space capacity is abundant and cheapening at roughly 22% a year. Terminal economics rather than satellite capacity now determine how quickly deployment scales.
"The satellite industry spent thirty years selling megahertz to people who wanted megabits. Then somebody started selling a monthly subscription with a flat panel on the roof, and an entire commercial architecture built around committed capacity stopped making sense to any buyer."
Director, Satellite Communications and Enterprise Connectivity Practice · MMA Technology Practice · September 2026

Market Trends

Constellations Replaced Committed Capacity With Monthly Subscriptions

Geostationary enterprise capacity was sold by megahertz on multi-year commitments, which made sense because a satellite covers a fixed footprint with capacity that cannot be redeployed. Low earth orbit operators sell bandwidth per site per month with short notice periods, which is how terrestrial providers have always sold. Average enterprise contract length has fallen to around 14 months. Incumbents are repricing books written under different physics against competitors with no legacy revenue to protect, and that conversation is considerably more painful than the latency comparison ever was. Physics changed and the commercial model followed it.
Market Impact: Indonesia compounds at 18.2% annually

Terminal Cost Replaced Capacity As The Real Constraint

Space segment capacity is abundant and delivered bandwidth pricing falls around 22% annually across every orbit, so the satellite is no longer what limits deployment. Tracking a constellation requires either a mechanically steered dish with moving parts or an electronically steered flat panel, and installed enterprise terminal cost averages around USD 2,400 per site. For an operator with four hundred remote locations that is the whole business case. Antenna manufacturing scale rather than orbital capacity now decides how quickly enterprise low earth orbit adoption can actually proceed. Antenna manufacturing scale is the whole question now.
Market Impact: Latency falls to 38 milliseconds

Market Opportunities and Growth Drivers

Island Geography Makes Satellite The Permanent Default

Indonesia spans roughly seventeen thousand islands and the Philippines several thousand more, which puts submarine cable and microwave backhaul economics permanently out of reach for most of them. Indonesian government connectivity programmes have funded satellite capacity specifically because no terrestrial alternative will ever be viable at that dispersion. Indonesia compounds at 18.2%, well ahead of any other country, on banking, government service delivery and mobile backhaul demand together. This is not a coverage gap that closes with investment. It is geography, and geography does not improve. Investment does not close a gap that geography creates.
Market Impact: Bandwidth pricing falls 22% yearly

Low Latency Made Enterprise Applications Actually Usable

Geostationary round trip latency around six hundred milliseconds breaks interactive applications, video conferencing and anything using modern transport protocols, which confined satellite connectivity to store and forward traffic for decades. Low earth orbit delivers roughly 38 milliseconds, comparable to a distant terrestrial link. That single change makes remote sites capable of running the same enterprise applications as headquarters, rather than a degraded subset. Low earth orbit connectivity compounds at 15.9% on this, and the demand comes from applications nobody previously tried to run over satellite at all. Nobody previously tried running those workloads over satellite.
Market Impact: Terminals cost USD 2,400 installed

Market Restraints and Challenges

Bandwidth Pricing Falls Faster Than Volume Grows

Delivered capacity pricing declines around 22% a year across every orbital architecture, which means an operator carrying substantially more traffic can still report less revenue than the year before. The root cause is that constellation capacity was launched faster than enterprise demand materialised, and unlike terrestrial networks that capacity cannot be held back once it is in orbit. Commercially this compresses everybody simultaneously. Mitigation runs through managed services, terminal supply and application level products where pricing is not indexed to megabits at all. Everybody in this industry is compressed at the same time, which makes differentiation genuinely hard.
Market Impact: Contracts fell to 14 months

Terminal Economics Gate Enterprise Deployment At Scale

Installed enterprise terminal cost averages around USD 2,400 per site, which is the deciding number for any organisation connecting hundreds of remote locations rather than a handful. The root cause is that tracking moving satellites requires either mechanical steering with moving parts that fail or electronically steered arrays whose semiconductor content remains expensive at current volumes. Commercially this delays deployments that the connectivity economics already justify. Mitigation runs through terminal leasing, phased rollouts and antenna manufacturing scale, which arrives only as volume arrives. Manufacturing volume arrives only once deployment volume does, which is an awkward sequencing problem.
Market Impact: Terminals cost about USD 2,400
3 additional market trends, 4 additional growth drivers, and 2 additional restraints and challenges are covered in the full report. Contact sales@marketmindsadvisory.com to access the complete intelligence.

Segment CAGR and Growth Architecture

Segmentation follows orbital architecture and frequency band, since where the satellite sits determines latency, terminal complexity, coverage geometry and how the capacity gets sold. Six architectures cover the market: low earth orbit constellation connectivity, multi-orbit managed connectivity, geostationary Ka-band high throughput, medium earth orbit connectivity, geostationary Ku-band wide beam, and C-band legacy services. Customer industry is a separate dimension.
enterprise-vsat-systems-market-market-share-analysis-1789988870940

Low Earth Orbit Constellation Connectivity

Low earth orbit connectivity grows at 15.9%, half again the market rate of 10.6%, on latency rather than on bandwidth. Geostationary links carry roughly six hundred millisecond round trips, which breaks interactive applications and modern transport protocols alike, and confined satellite connectivity to tolerant traffic for three decades. Constellations deliver around 38 milliseconds, comparable to a distant terrestrial connection. Remote sites can therefore run the same enterprise applications as headquarters rather than a degraded subset of them. The commercial model changed alongside the physics, with bandwidth sold per site per month on short commitments rather than by megahertz on multi-year contracts nobody enjoys signing. Buyers noticed the commercial change faster than the technical one.
CAGR 15.9%

Multi-Orbit Managed Connectivity

Multi-orbit managed connectivity compounds at 13.4% because enterprises with critical remote operations will not depend on a single constellation. A vessel, a mine or an offshore platform losing connectivity is an operational event rather than an inconvenience, so the terminal switches between low earth orbit for latency and geostationary for coverage assurance, managed by software the customer never sees. This raises spend per site rather than adding new sites, which is a different growth mechanism from anything else here. Service providers rather than satellite operators capture most of that value, since the integration and the management contract is where the margin actually sits. Satellite operators keep watching that margin settle one layer above them.
CAGR 13.4%
Full segment breakdown across 6 segments available in the complete report.

Regional Architecture and Country Demand Map

South Asia and Pacific leads at 25% of terminal and service revenue, far above the standard band, because Indonesian, Philippine, Indian and Australian geography puts terrestrial connectivity permanently out of reach for enormous numbers of enterprise sites. Infrastructure absence rather than spending power decides this market.

South Asia and Pacific

South Asia and Pacific holds 25% of terminal and service revenue, far above the 12% band ceiling, because geography here makes satellite permanent rather than transitional. Indonesia spans seventeen thousand islands and compounds at 18.2%, ahead of every other country, on banking, government services and mobile backhaul. India operates one of the largest enterprise terminal populations anywhere, connecting rural bank branches, cash machines and retail points where fixed lines were never economic. Australian mining and pastoral operations cover distances no terrestrial network will ever serve. Nelco and regional providers hold genuine positions. This is not a gap that investment eventually closes. Geography here is permanent, and permanent gaps face no substitute at all.
Share: 25% | CAGR: 12.8% (2026 to 2036)

North America

North America takes 22% of terminal and service revenue, at the band floor, and the demand concentrates in specific industries rather than spreading broadly. Energy operations across Texas, Alberta and the Gulf of Mexico need connectivity where no fixed infrastructure exists, and maritime traffic on both coasts carries substantial spend. Viasat, Hughes Network Systems and Starlink all operate from here, so the technology and the constellation capital are concentrated in a region that consumes proportionally less than it supplies. Growth at 9.8% sits below the global rate because terrestrial coverage is genuinely good almost everywhere that matters commercially. Technology and constellation capital concentrate here far more than actual consumption does.
Share: 22% | CAGR: 9.8% (2026 to 2036)
Regional intelligence for 5 additional markets available in the complete report: Western Europe, East Asia, Latin America, Middle East and Africa, Eastern Europe. Contact sales@marketmindsadvisory.com.
enterprise-vsat-systems-market-country-cagr-analysis-1789988871472

How This Business Defends Margin

Delivered bandwidth pricing falls around a fifth every single year, the terminal rather than the satellite now gates deployment, and the customers who need this most are located exactly where nobody else wants to operate. Each of the four levers below responds to one of those conditions rather than to any argument about capacity.

Sell Managed Outcomes Rather Than Megabits

Delivered capacity pricing falls around 22% annually across every orbit, so any revenue indexed to bandwidth shrinks even as traffic grows substantially. Managed connectivity priced per site, with availability guarantees, terminal supply, installation and support included, is not indexed to megabits at all. Multi-orbit managed services compound at 13.4% on precisely this logic, and service providers rather than satellite operators capture most of that margin. Operators selling capacity wholesale are handing the defensible layer to somebody else and then wondering where their margin went. Wholesale hands the defensible layer to somebody else entirely.
Market Impact: Managed services escape the annual 22% price decline

Remove The Terminal From The Capital Decision

Installed enterprise terminal cost averages around USD 2,400 per site, which decides whether an organisation with four hundred remote locations proceeds or defers indefinitely. Space capacity is abundant and cheap, so the gating item is a capital approval rather than a connectivity business case. Terminal leasing, bundled hardware inside a monthly service price and phased deployment all convert that capital request into operating expenditure that a site manager can approve. Providers still quoting terminals separately are creating a procurement obstacle where none needs to exist. Providers quoting terminals separately create an obstacle where none needs to exist.
Market Impact: A USD 2,400 terminal gates every enterprise rollout

Follow Geography That Never Gets Fibre

Around 31% of enterprise sites have no viable terrestrial option and a substantial share of those never will, because island dispersion, mountain terrain and distance defeat the economics permanently rather than temporarily. Indonesia compounds at 18.2% for exactly this reason. Providers chasing markets where terrestrial networks are improving are competing against a substitute that keeps getting better, while providers serving permanent gaps face no substitute at all. The distinction between a coverage gap and a coverage impossibility is worth building a strategy around. That distinction is worth building an entire strategy around.
Market Impact: Around 31% of sites lack any terrestrial access

Build Multi-Orbit Switching Into The Terminal

An enterprise with critical remote operations will not accept dependence on a single constellation, because losing connectivity at a mine or an offshore platform is an operational event rather than an inconvenience. Terminals switching between low earth orbit for 38 millisecond latency and geostationary for coverage assurance raise spend per site without needing any new sites at all. Multi-orbit managed connectivity compounds at 13.4% on that. The integration work sits with service providers, which is why satellite operators keep watching this margin go elsewhere. Integration sits with service providers rather than with operators.
Market Impact: Multi-orbit services compound at 13.4% every single year

Who Controls the Margin Pool

Five operators hold 43% of enterprise terminal and connectivity service revenue, which is moderately concentrated for an industry requiring this much capital. Viasat and Hughes Network Systems built geostationary enterprise positions across decades of committed capacity contracts. SES operates across multiple orbits. Eutelsat OneWeb and Starlink arrived with constellation capacity and terrestrial style commercial terms. All participants are assessed on enterprise terminal and connectivity service revenue.
Competition now runs on commercial terms rather than on technical capability, which reverses thirty years of how this industry sold. A buyer comparing a three year committed capacity contract against a cancellable monthly subscription is making a procurement decision rather than an engineering one. Incumbents defend on coverage assurance and service level guarantees, which are genuine advantages that price comparisons obscure completely.

Rankings shift on terminal supply rather than on space segment, since capacity is abundant and antennas are not. Whoever manufactures electronically steered flat panels at volume and acceptable cost removes the constraint gating enterprise adoption. The second pressure is service providers capturing managed service margin above operators who increasingly sell wholesale capacity into somebody else's customer relationship.
enterprise-vsat-systems-market-company-positioning-matrix-1789988871997

Competitive Moat and Risk Dimensions

VIASAT

Moat: Enterprise Service Level Depth

Viasat holds enterprise and government relationships built on guaranteed service levels, network security accreditation and support organisations that constellation newcomers have not assembled. Customers running critical operations in remote locations buy assurance rather than bandwidth, and that assurance is documented, audited and contractually enforceable. Building comparable credibility takes years of demonstrated delivery rather than any amount of orbital capacity.
VIASAT

Risk: Committed Capacity Repricing

A revenue base built on multi-year committed capacity contracts faces buyers comparing those terms against cancellable monthly subscriptions costing a fraction as much per site. Repricing that book is unavoidable and painful, since every renegotiation resets the comparison lower. Delivered bandwidth pricing falling around 22% annually compounds the problem at every single renewal date.
SES

Moat: Multi-Orbit Fleet Position

SES operates capacity across geostationary and medium earth orbit together, which lets it offer resilience combinations that single-orbit operators cannot assemble without partnering. Enterprises with critical remote operations value that assurance directly and pay for it. Assembling a comparable multi-orbit fleet requires capital and regulatory positions accumulated across decades rather than acquired through any single programme.
SES

Risk: Wholesale Margin Displacement

Selling capacity wholesale to service providers who build the managed service, own the customer relationship and capture the defensible margin leaves the operator holding the capital intensive and least differentiated layer. Multi-orbit managed connectivity compounds at 13.4% and most of that value accrues elsewhere. Moving into managed services directly means competing with the customers currently buying the capacity.

Players Tracked

Prominent Players

Viasat
Hughes Network Systems
SES
Eutelsat OneWeb
Starlink

Other Key Players

Intelsat
Telesat
Speedcast
Marlink
KVH Industries
Gilat Satellite Networks
ST Engineering iDirect
Comtech Telecommunications
Kymeta
Hispasat
Arabsat
Thaicom
Yahsat
Nelco
Orbcomm

Recent Developments

FEBRUARY 2025

Marlink Expands Multi-Orbit Managed Services For Maritime Fleets

Marlink extended multi-orbit managed connectivity across additional maritime customer fleets, an organic service expansion rather than an acquisition or joint venture. Vessels switch between low earth orbit for latency and geostationary for coverage assurance, managed by software the customer never interacts with directly at any point.
Signal: Service providers rather than satellite operators are capturing the margin that multi-orbit resilience actually generates for anybody.
AUGUST 2024

Kymeta Expands Flat Panel Terminal Production For Enterprise Deployment

Kymeta expanded electronically steered flat panel terminal manufacturing capacity aimed at enterprise and mobility deployments, an organic capacity expansion rather than any transaction. Installed terminal cost averaging around USD 2,400 per site is now the item gating enterprise adoption rather than any shortage of orbital capacity.
Signal: The antenna rather than the satellite decides how fast enterprise low earth orbit adoption can actually proceed.
JUNE 2025

Hughes Restructures Enterprise Contracts Toward Shorter Commitment Terms

Hughes Network Systems restructured enterprise connectivity offers toward shorter commitment periods and per site pricing, a commercial change rather than a merger or acquisition. Average enterprise contract length has fallen to around 14 months as constellation operators sell bandwidth the way terrestrial providers always have done.
Signal: Incumbents are repricing books written under physics and commercial assumptions that no longer apply anywhere at all.

What Delivering A Site Costs

Space segment capacity accounts for roughly 32% of the cost of serving an enterprise site, and that share falls every year as delivered bandwidth pricing declines. Terminal hardware carries around 26%, amortised across the contract where the provider supplies it. Installation and field service absorb about 18%, high because remote sites are remote by definition. Network operations take the balance.
Semiconductor content in electronically steered antennas rose in cost through 2022 and 2023 as component availability tightened across the industry, and flat panel terminals depend on that content heavily. Viasat Annual Report 2024 and SES Annual Report 2024 both record capacity pricing pressure and terminal supply as operating variables. Providers with fixed price customer contracts absorbed terminal cost increases directly, since a monthly service price agreed in 2022 does not reprice when component costs move.

The competitive disadvantage mechanism is field service geography rather than any capacity cost. Installation and maintenance at remote sites runs around 18% of cost and scales with how dispersed a provider's base is rather than with site count. A provider with four hundred sites in one region pays far less per site than one spread across four continents.
enterprise-vsat-systems-market-cost-volatility-analysis-1789988872195

Build Regional Field Service Density Before Expanding

Installation and field service run around 18% of the cost of serving a site and scale with geographic dispersion rather than with site count. A provider adding customers in a region where it already has engineers improves unit economics, while one adding a single site on another continent destroys them. Sales organisations chasing logos rarely account for this at all.

Amortise Terminal Cost Across Longer Committed Terms

Terminal hardware carries around 26% of the cost of serving a site, and average enterprise contract length has fallen to about 14 months as constellation operators normalised short commitments. A terminal amortised over fourteen months is expensive; the same hardware over thirty-six months is not. Price incentives for longer terms recover margin that short commitment competition removed.

Buy Capacity Across Multiple Operators On Short Terms

Space segment runs about 32% of site cost and delivered pricing falls roughly 22% every year, which makes any long capacity commitment a decision to overpay later. Buying shorter and across several operators keeps procurement aligned with a falling market and preserves negotiating position at every renewal. Providers holding multi-year commitments at older prices carry that difference directly.

Portfolio Architecture for Margin Defence

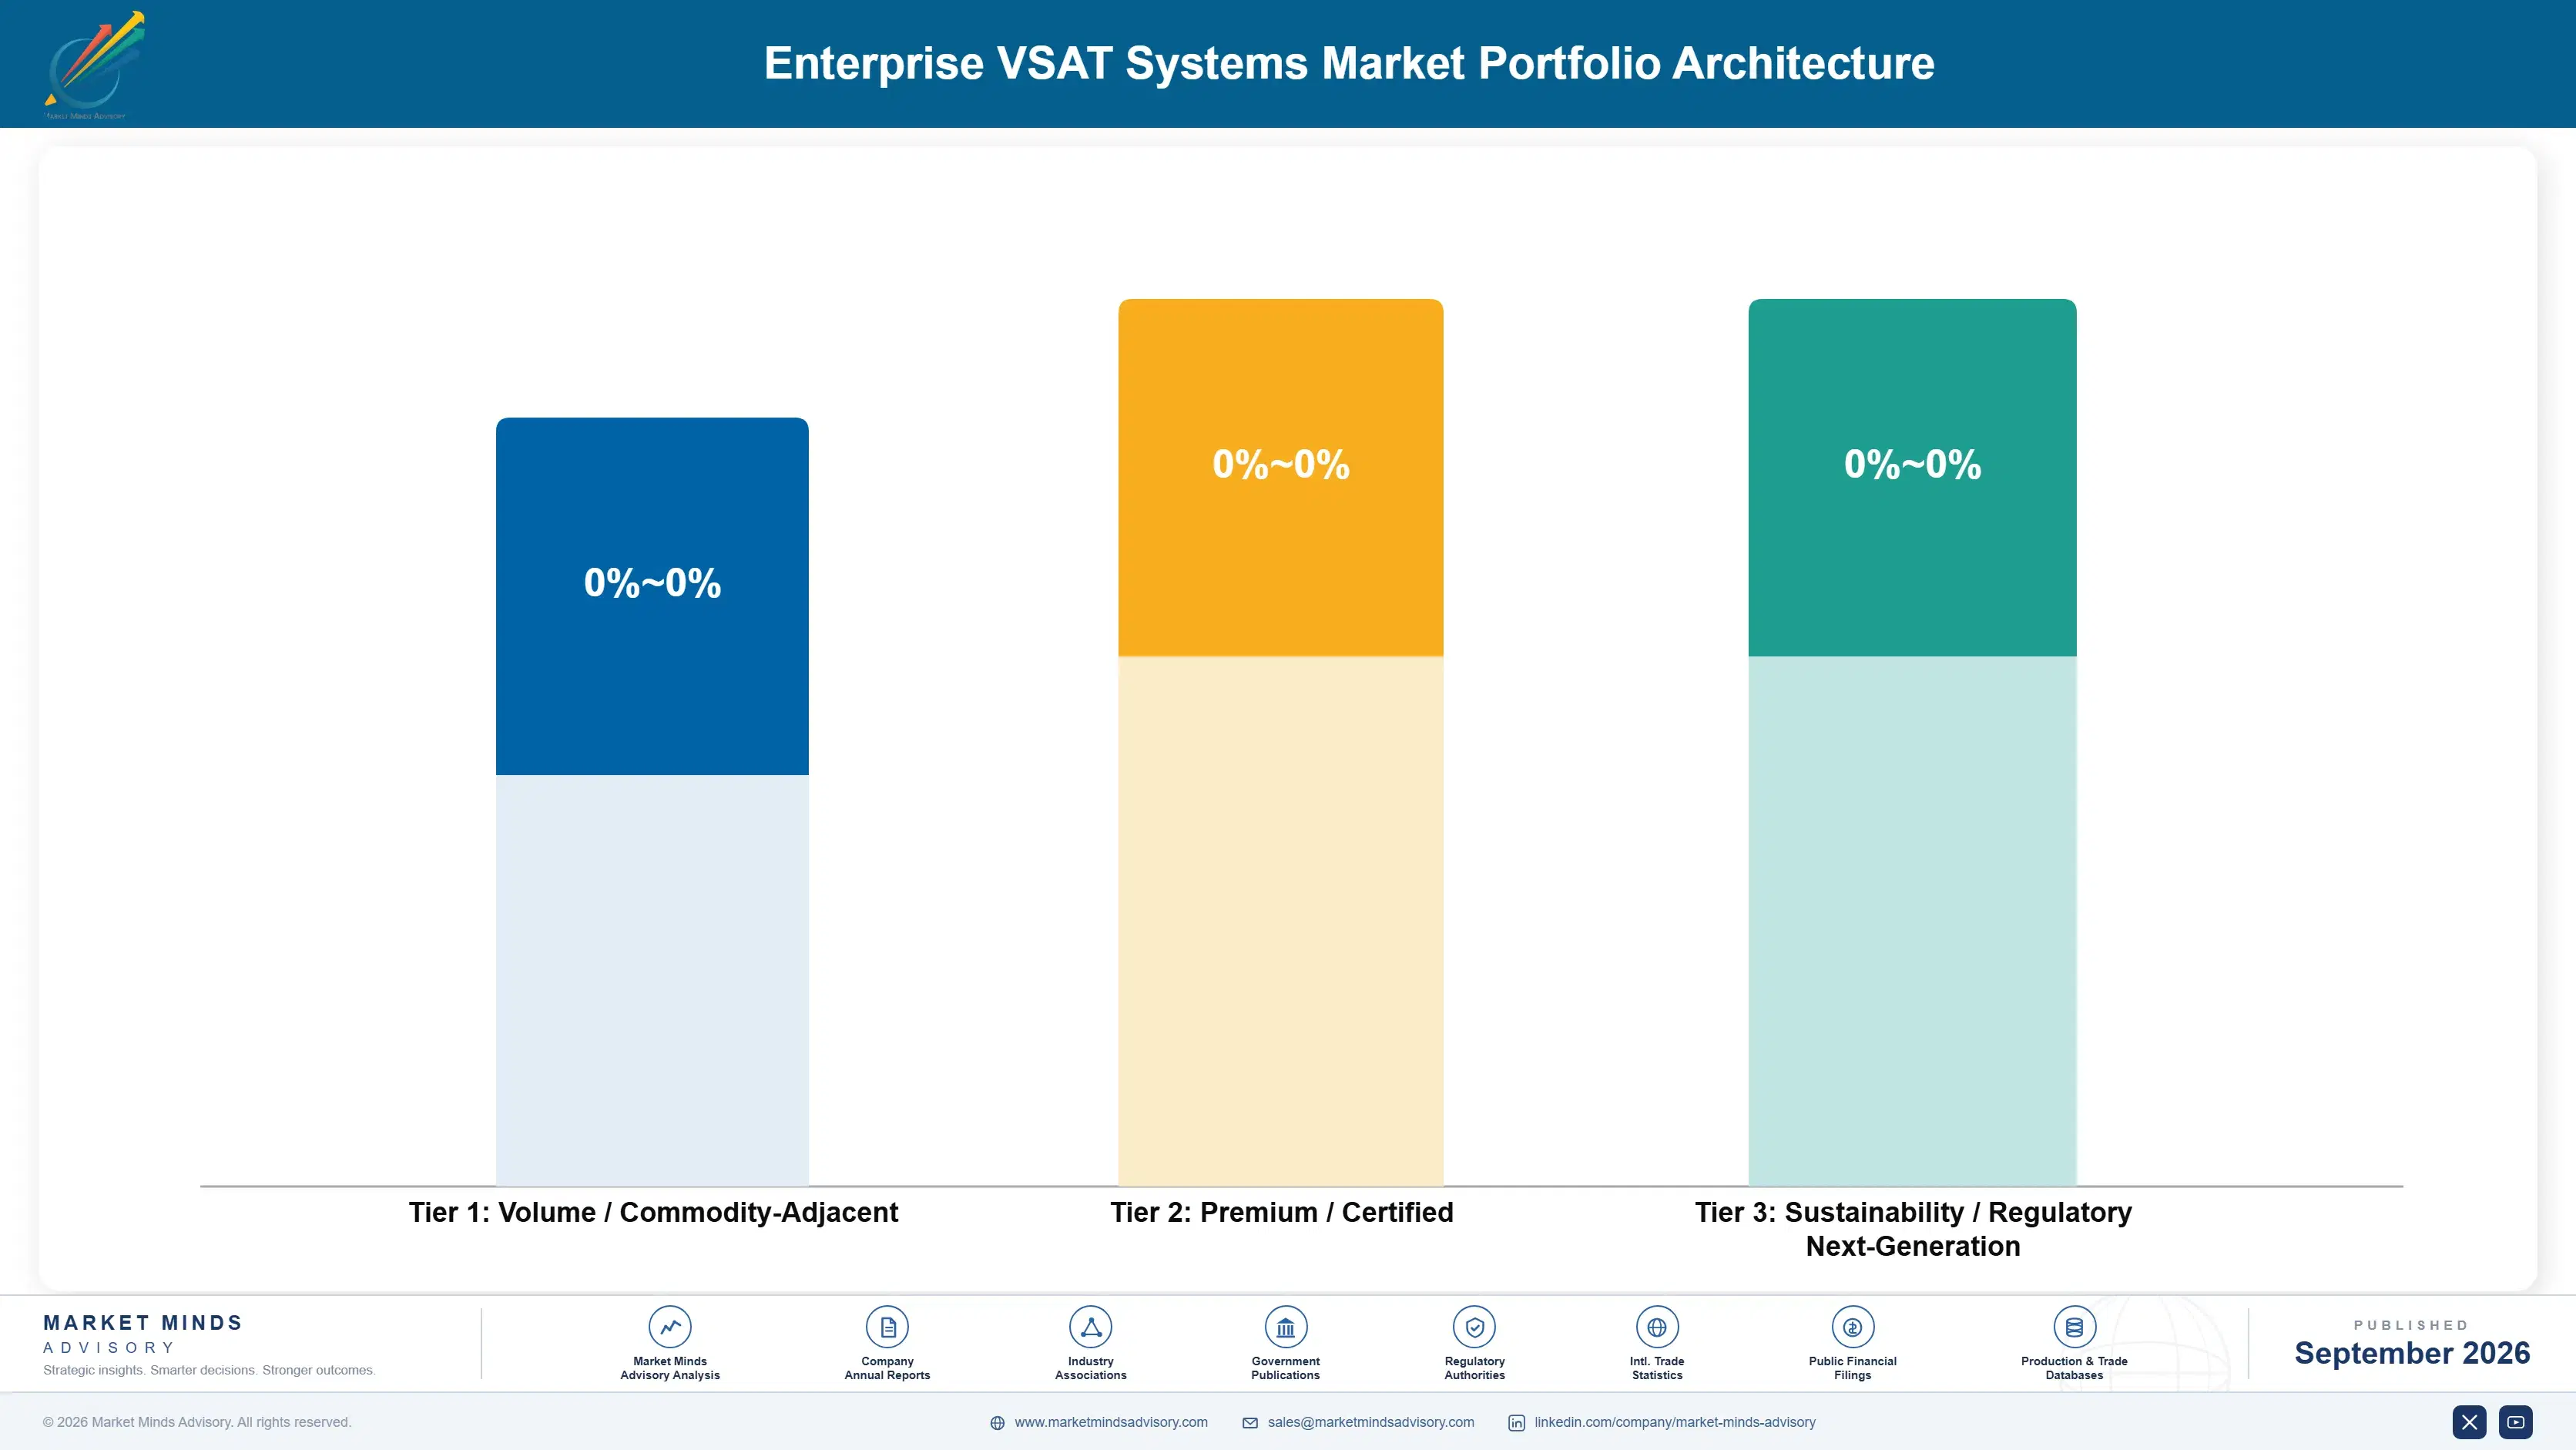
Margin architecture separates on how far a provider sits from raw capacity. Geostationary Ku-band wide beam and C-band legacy services earn least, selling declining capacity into applications with no alternative and no growth. Ka-band high throughput and medium earth orbit sit in the middle. Low earth orbit connectivity and multi-orbit managed services earn most, because one carries genuine scarcity value and the other carries integration nobody else performs.
The volume versus premium tension is about who owns the customer relationship. Selling wholesale capacity to service providers is simple, scales without field organisation and hands the defensible margin to somebody else entirely. Selling managed services means installing terminals in difficult places and answering the phone at three in the morning. Operators keep choosing wholesale for good operational reasons and then watching the value accumulate one layer above them.

High-value pools concentrate in multi-orbit managed connectivity and in terminal supply, and neither is reached by launching more capacity. Multi-orbit management requires software, service organisation and relationships with competing operators simultaneously. Terminal supply requires antenna manufacturing at volumes nobody has yet reached. Both sit outside what a satellite operator was built to do, which is precisely why the margin has settled there.

Volume / Commodity-Adjacent

Geostationary Ku-band wide beam and C-band legacy capacity sold into applications with no alternative and no growth ahead of them. The ten point spread separates operators with fully depreciated satellites from those still carrying capital cost on comparatively recent fleet.
Gross Margin: 18% to 28%

Premium / Certified

Geostationary Ka-band high throughput and medium earth orbit connectivity sold on coverage assurance and guaranteed service levels. The twelve point spread tracks how much of an operator's capacity sits under direct enterprise contracts rather than wholesale agreements sold to service providers.
Gross Margin: 34% to 46%

Sustainability / Regulatory / Next-Generation

Low earth orbit connectivity and multi-orbit managed services, where latency creates genuine scarcity and integration creates a defensible layer. The fourteen point spread reflects how much managed service the provider delivers rather than how much capacity it simply resells onward.
Gross Margin: 52% to 66%
enterprise-vsat-systems-market-portfolio-architecture-1789988872701

High-value Sub-segments and Strategic Watch-out

Low Earth Orbit Constellation Connectivity

Grows at 15.9% because 38 millisecond latency makes remote sites capable of running the same applications as headquarters. The fourteen point spread reflects managed service depth. Terminal cost near USD 2,400 rather than capacity now limits how fast this deploys. Space capacity is not the constraint here.
Gross Margin: 52% to 66%

Multi-Orbit Managed Connectivity

Grows at 13.4% because critical remote operations will not depend on a single constellation for connectivity they cannot lose. The fourteen point spread reflects integration capability. Service providers rather than satellite operators capture almost all of this margin. Losing a link is an operational event, not an inconvenience.
Gross Margin: 52% to 66%

Geostationary Ka-Band High Throughput

Grows at 8.7% on coverage assurance and guaranteed service levels that constellation operators have not yet matched for critical enterprise applications. The twelve point spread reflects contract structure. Committed capacity terms are repricing downward at every single renewal now. Coverage assurance is a genuine and underrated advantage.
Gross Margin: 34% to 46%

C-Band And Legacy Wide Beam Services

Grows at 1.4%, slowest of the six architectures, serving applications with no alternative and no growth on satellites that are largely depreciated. The ten point spread separates depreciated fleet from recent fleet. Rain fade resistance keeps specific tropical applications genuinely committed here. Depreciated fleet keeps it profitable.
Gross Margin: 18% to 28%

Why These Sites Stay Connected

The annuity is the absence of an alternative rather than any contract term. A mine, an island bank branch or an offshore platform with no terrestrial option does not churn to a competing technology, because there is no competing technology available at that location. Around 31% of sites are in that position permanently. Contract length has fallen to around 14 months and renewal rates barely moved, which tells you what actually held the customer.
Depth varies with how operationally critical the connection is. An offshore platform running safety systems over the link cannot switch supplier without a change management process nobody wants to run. A mining operation with machinery telematics is nearly as committed. A retail site using satellite as backup switches for a modest saving and gives no notice.

The buyer moved from a telecommunications manager to an operations director, and the questions changed completely. A telecommunications manager compared committed information rates, contention ratios and megahertz pricing. An operations director asks whether the mine site can run the same systems as head office and what happens when the link fails. Providers quoting capacity specifications answer a question nobody asks now.
enterprise-vsat-systems-market-end-use-penetration-index-1789988873198

What Decides Returns Here

These are among the four positions where our research anticipates prominent divergence between winners and laggards over the coming forecast period. Each is grounded in the demand model, the regulatory perimeter, and the announced capacity pipeline.
01 / MANAGED SERVICE MIGRATION

Stop Selling Capacity By The Megabit

Delivered capacity pricing declines around 22% every year across every orbital architecture, so any revenue line indexed to bandwidth shrinks even while the traffic carried grows substantially. Managed connectivity priced per site, with availability guarantees, terminal supply, installation and support all included, is not indexed to megabits in any way at all. Multi-orbit managed services compound at 13.4% on that logic, and service providers rather than satellite operators are currently capturing very nearly all of the margin that results from it.
02 / TERMINAL BARRIER REMOVAL

Take The Antenna Off The Capital Request

Installed enterprise terminal cost averages around USD 2,400 per site, which decides whether an organisation connecting four hundred remote locations proceeds this year or defers the decision indefinitely again. Space segment capacity is abundant and cheap, so the gating item is a capital approval rather than any connectivity business case that needs making. Terminal leasing, hardware bundled inside a monthly service price and phased deployment all convert that capital request into operating expenditure that a site manager can approve directly.
03 / PERMANENT GAP TARGETING

Serve Places Fibre Will Never Reach

Around 31% of enterprise sites have no viable terrestrial option, and a substantial share of those never will, because island dispersion, mountainous terrain and sheer distance defeat the economics permanently rather than temporarily. Indonesia compounds at 18.2% across some seventeen thousand separate islands for precisely that reason and nothing about it changes with investment. Providers chasing markets where terrestrial networks keep improving compete against a substitute that gets better, while providers serving permanent gaps face no substitute whatsoever, now or later.
04 / RESILIENCE PRODUCT DESIGN

Sell The Second Link, Not The First

An enterprise running critical remote operations will not accept dependence on any single constellation, because losing connectivity at a mine or an offshore platform is an operational event rather than a mild inconvenience. Terminals switching between low earth orbit for 38 millisecond latency and geostationary for coverage assurance raise spend per existing site without requiring a single new one. Multi-orbit managed connectivity compounds at 13.4%, and the integration work sits with service providers rather than with the satellite operators themselves.

Engagement Snapshot From the Field

A live engagement with an industry participant carrying material or product regulatory and market exposure ahead of a defining policy shift, showing how our research translates into a defensible multi-year portfolio strategy.
MARKET MINDS ADVISORY · CLIENT ENGAGEMENT SUMMARY
Enterprise VSAT Systems Producer Strategic Portfolio Review and Transition Roadmap 2026·Investment Scenario on Enterprise VSAT Systems Exposure Evaluation 2025-26
CLIENT PROFILE
A global mining group operating 46 sites across four continents, connected through a mixture of geostationary contracts signed at different times by regional teams with no central coordination. Total connectivity spend had risen for three consecutive years while delivered bandwidth pricing was falling industry wide. Nobody at group level knew what any individual site was actually paying per megabit.
STRATEGIC CHALLENGE
Regional operations teams defended their existing arrangements on service reliability grounds and resisted central procurement. Group technology wanted a single global agreement and had no evidence about what the regional contracts actually delivered. A constellation operator had approached the group directly with pricing that looked implausible against the incumbent contracts, and nobody could explain the difference.
MMA APPROACH
MMA normalised every site contract to cost per delivered megabit and per site month, separating capacity, terminal amortisation and field service. We modelled low earth orbit and multi-orbit alternatives against each site's application requirements and outage tolerance, and priced terminal replacement across the estate. The work drew on 47 expert interviews conducted in Q4 2025 with operators, service providers and comparable mining groups.
KEY FINDINGS
  1. Cost per delivered megabit varied by roughly 9 times across the 46 sites, and the most expensive contracts were not the oldest ones as everybody had assumed.
  2. Around 31% of sites were paying for committed capacity they had never once used, on terms signed before constellation alternatives existed at all.
  3. Terminal replacement across the estate cost about USD 2,400 per site and paid back in under seven months at the alternative pricing (client-reported, unverified by MMA).
  4. Eleven safety critical sites genuinely required the multi-orbit resilience the incumbent provided, and moving those on price alone would have been a serious mistake.
CLIENT PROFILE
A global mining group operating 46 sites across four continents, connected through a mixture of geostationary contracts signed at different times by regional teams with no central coordination. Total connectivity spend had risen for three consecutive years while delivered bandwidth pricing was falling industry wide. Nobody at group level knew what any individual site was actually paying per megabit.
STRATEGIC CHALLENGE
Regional operations teams defended their existing arrangements on service reliability grounds and resisted central procurement. Group technology wanted a single global agreement and had no evidence about what the regional contracts actually delivered. A constellation operator had approached the group directly with pricing that looked implausible against the incumbent contracts, and nobody could explain the difference.
MMA APPROACH
MMA normalised every site contract to cost per delivered megabit and per site month, separating capacity, terminal amortisation and field service. We modelled low earth orbit and multi-orbit alternatives against each site's application requirements and outage tolerance, and priced terminal replacement across the estate. The work drew on 47 expert interviews conducted in Q4 2025 with operators, service providers and comparable mining groups.
KEY FINDINGS
  1. Cost per delivered megabit varied by roughly 9 times across the 46 sites, and the most expensive contracts were not the oldest ones as everybody had assumed.
  2. Around 31% of sites were paying for committed capacity they had never once used, on terms signed before constellation alternatives existed at all.
  3. Terminal replacement across the estate cost about USD 2,400 per site and paid back in under seven months at the alternative pricing (client-reported, unverified by MMA).
  4. Eleven safety critical sites genuinely required the multi-orbit resilience the incumbent provided, and moving those on price alone would have been a serious mistake.
RECOMMENDED STRATEGY
Phase 1: Phase one: migrate the thirty-five sites without safety critical dependencies to constellation connectivity, replacing terminals as each regional contract expires. Phase 2: Phase two: keep multi-orbit managed services on the eleven safety critical sites and renegotiate those terms against the new market pricing. Phase 3: Phase three: normalise every future contract to cost per delivered megabit at group level, so regional variation becomes visible immediately rather than annually.
OUTCOME
The group migrated thirty-five sites and retained multi-orbit services where operations genuinely required them (client-reported, unverified by MMA). Connectivity spend fell substantially while delivered bandwidth rose across the estate. Contracts are now normalised to cost per delivered megabit and reviewed centrally, which is the change that outlasted the engagement itself.

Frequently Asked Questions

Foundational context covering the market sizes, CAGR, scope, country, region and competition that inform every finding below. This section is provided to cover basics and most often pre-purchase conversations, answered from the MMA Primary Research Dataset.

What is the current size of the Enterprise VSAT Systems Market?

Global value reaches USD 5.31 billion in 2026, measured as enterprise terminal and connectivity service revenue across all six orbital architectures. The 2025 base is USD 4.8 billion.

How large will the Enterprise VSAT Systems Market be by 2036?

Terminal and service revenue reaches USD 14.54 billion by 2036, an increase of USD 9.23 billion over the forecast period. That represents 2.74 times expansion from the 2026 base.

What is the CAGR for the Enterprise VSAT Systems Market 2026 to 2036?

The base case runs at 10.6% annually, with a bull case at 11.9% if flat panel terminal costs fall sharply and a bear case at 9.3% if capacity pricing declines faster than volume grows.

Which segment is growing fastest?

Low earth orbit constellation connectivity grows at 15.9%, half again the market rate of 10.6%. Latency around 38 milliseconds lets remote sites run the same enterprise applications as headquarters rather than a degraded subset.

Who are the major companies in the Enterprise VSAT Systems Market?

Viasat, Hughes Network Systems, SES, Eutelsat OneWeb and Starlink lead on terminal and service revenue, together holding 43%. Marlink, Speedcast and Gilat hold smaller positions in managed services.

Which country is growing fastest?

Indonesia leads at 18.2%, because seventeen thousand islands put terrestrial backhaul permanently out of economic reach for most enterprise sites. India and Nigeria follow on comparable geography.

Report Segmentation Architecture

The full report scope spans multiple orthogonal segmentation dimensions, with cross-tabulated demand data provided for each dimension pair. Coverage extends further to regional breakdowns, trend trajectories, and the competitive detail needed to support segment-level decision-making.

By Orbital Architecture

  • Low Earth Orbit Constellation Connectivity
  • Multi-Orbit Managed Connectivity
  • Geostationary Ka-Band High Throughput
  • Medium Earth Orbit Connectivity
  • Geostationary Ku-Band Wide Beam
  • C-Band And Legacy Wide Beam Services

By End-Use Industry

  • Mining And Extractive Operations
  • Oil And Gas Production
  • Maritime And Shipping
  • Banking And Retail Networks
  • Telecommunications Backhaul
  • Agriculture And Forestry

By Commercial Dimension

  • Direct Enterprise Service Contracts
  • Managed Service Provider Delivery
  • Wholesale Capacity Agreements
  • Regional Reseller Distribution
  • Government Programme Procurement
  • Terminal Hardware Supply

By Region

  • North America
  • Western Europe
  • East Asia
  • South Asia and Pacific
  • Latin America
  • Middle East and Africa
  • Eastern Europe

Scope, Methodology, and Coverage

Every figure in this report is reproducible from documented input assumptions. The scope below maps the historical period, the forecast horizon, the segmentation dimensions, and the countries covered, alongside the underlying primary and qualitative methodology.
Historical Period
2020 to 2025
Forecast Period
2026 to 2036
Base Year
2025 (USD billions; MMA Primary Research Dataset, September 2026)
Market Definition
This report covers enterprise satellite connectivity terminals and services delivered through very small aperture terminal architectures: low earth orbit constellation connectivity, multi-orbit managed connectivity, geostationary Ka-band high throughput services, geostationary Ku-band wide beam services, medium earth orbit connectivity, and C-band and legacy wide beam services. It excludes consumer broadband subscriptions, direct to home broadcast, satellite manufacturing and launch, government and military dedicated systems, and terrestrial network equipment.
Quantitative Units
USD millions, enterprise terminal and connectivity service revenue basis; installed terminals; round trip latency in milliseconds; installed terminal cost per site in USD; contract length in months.
Segmentation Dimensions
Orbital architecture and frequency band; customer industry; commercial delivery model; geography across seven regions.
Regions Covered
North America, Western Europe, East Asia, South Asia and Pacific, Latin America, Middle East and Africa, Eastern Europe
Countries Covered
Indonesia, India, Philippines, Australia, Papua New Guinea, United States, Canada, Mexico, Brazil, Chile, Peru, Nigeria, Angola, Saudi Arabia, United Arab Emirates, Norway, United Kingdom, France, Japan, South Korea.
Key Companies Profiled
Viasat, Hughes Network Systems, SES, Eutelsat OneWeb, Starlink, Intelsat, Telesat, Speedcast, Marlink, KVH Industries, Gilat Satellite Networks, ST Engineering iDirect, Kymeta, Thaicom, Nelco.
Quantitative Methodology
Primary survey, n=3,800 respondents, Q4 2025, six countries; demand-side model with trade association cross-validation
Qualitative Methodology
47 expert interviews, Q4 2025; applied to validate demand model assumptions, identify emerging dynamics, and assess competitive positioning
Report Format
PDF and XLSX data workbook (Word format preview document)
Publisher
Market Minds Advisory
Report Code
MMA-2026-TEC-511
Published
September 2026
Contact
sales@marketmindsadvisory.com | www.marketmindsadvisory.com

Purchase the full Enterprise VSAT Systems Market Report (2026 to 2036).

This report sizes the global enterprise VSAT systems market from 2026 to 2036 across six orbital architectures, six customer industries and seven regions. It explains why demand runs inversely to terrestrial network quality, how constellations replaced committed capacity with monthly subscriptions and cut contract length to around 14 months, and why a USD 2,400 terminal now gates deployment rather than orbital capacity. Cost composition is sourced to company annual reports, with field service geography analysed as the unit economics driver. Regional analysis explains why South Asia and Pacific leads at 25% while Indonesia grows at 18.2%. Competitive assessment covers 20 named providers.
Six orbital architectures sized through to 2036
Terminal economics modelled as the deployment constraint
Field service cost composition from company annual filings
Twenty named providers assessed on service revenue
Four revenue levers with quantified commercial impact
Anonymised global mining group connectivity engagement included fully

Built For The People Who Decide

From boardroom strategy to bench-side execution, this report is read cover-to-cover by leaders shaping the next decade of their industry, turning demand scenarios, market dynamics and valuation benchmarks into decisions.
CXOs/ Presidents/ VPs/ Managers
M&A and Corporate Development
Strategy Teams and R&D Heads
Procurement and Product Directors
Regulatory and Compliance Leaders
Investor Relations and Equity Analysts