Market Minds Advisory
Enterprise Video Market

Enterprise Video Market: Enterprise Video Market: Recording Volume, Retention Liability and Why Nobody Watches 2026 to 2036

Organisations record everything now and watch almost none of it afterwards. What they have accumulated is not a content library, it is a discoverable record that somebody will eventually subpoena.

Lead Analyst

Published

September 2026

Make Smarter Decisions with Customized Research Insights

Request a free sample report and evaluate market opportunities, growth trends, and competitive dynamics relevant to your business needs.

2025 MARKET VALUE$11.4BMarket Size 2025
2036 FORECAST VALUE$34.5BBase Case , 2026 to 2036
CAGR 2026 TO 203610.6 %Bull 11.9% / Bear 9.4%
INCREMENTAL OPPORTUNITY$21.9BNet 10- year value creation
EXPANSION MULTIPLE2.74x2036 value over 2026 base
Strategic Levers
M&A Pipeline
Regional Outlook
Country Rankings
Competitive Intelligence
Segmental Deep-dive
Call-Us : 91 93563 13602

Executive Snapshot and Market Trajectory.

Organisations now record almost every meeting they hold and watch essentially none of the recordings afterwards. What they have accumulated is not a content library in any useful sense at all. It is a discoverable record that somebody will eventually ask a court to produce.
The market reaches USD 12.6 billion in 2026 and USD 34.5 billion by 2036, a 2.74 times expansion at 10.6% annually. Retention governance and discovery controls grow at 15.9%, half again the market rate of 10.6%, because unmanaged recordings are a legal liability rather than an asset. East Asia holds 27% of spending, and India compounds fastest at 17.1% on distributed workforce scale. Concentration sits with platforms rather than with video specialists.
Five suppliers hold 52% of enterprise video platform and service revenue, and meeting platforms rather than video specialists now hold the great majority of it. Microsoft, Zoom, Cisco, Google and Kaltura lead. The specialists that survived did so by handling exactly what the meeting platforms deliberately avoid: retention, discovery, live events at genuine scale and statutory accessibility obligations. Video specialists hold considerably less than the category name suggests.
Market Definition
This report covers enterprise video platforms and services by function class: retention governance and discovery controls, live streaming and virtual event platforms, video content management and portals, accessibility and transcription services, video analytics and engagement measurement, and secure external video distribution. It excludes consumer video services, video conferencing endpoints and room hardware, video surveillance systems, media production and broadcast software, and content delivery network infrastructure sold by capacity.
Base Year Value
$11.4B in 2025 (MMA Primary Research Dataset, September 2026)
Forecast Period
2026 to 2036, eleven discrete annual values
CAGR
10.6% base case. Bull 11.9%. Bear 9.4%.
Fastest Growth Segment
Retention Governance And Discovery Controls: 15.9% CAGR
Fastest Growth Country
India: 17.1% CAGR
Fastest Growth Region
South Asia and Pacific: 12.9% CAGR
Largest Region
East Asia: 27% of 2025 global value
Market Leaders
Microsoft, Zoom, Cisco, Google and Kaltura lead on enterprise video platform and service revenue. Source: MMA Analysis.
Primary Survey
n=3,800 procurement and R&D decision-makers, Q4 2025, six countries
Methodology
Demand-side build-up, cross-validated against public data, 47 expert interviews

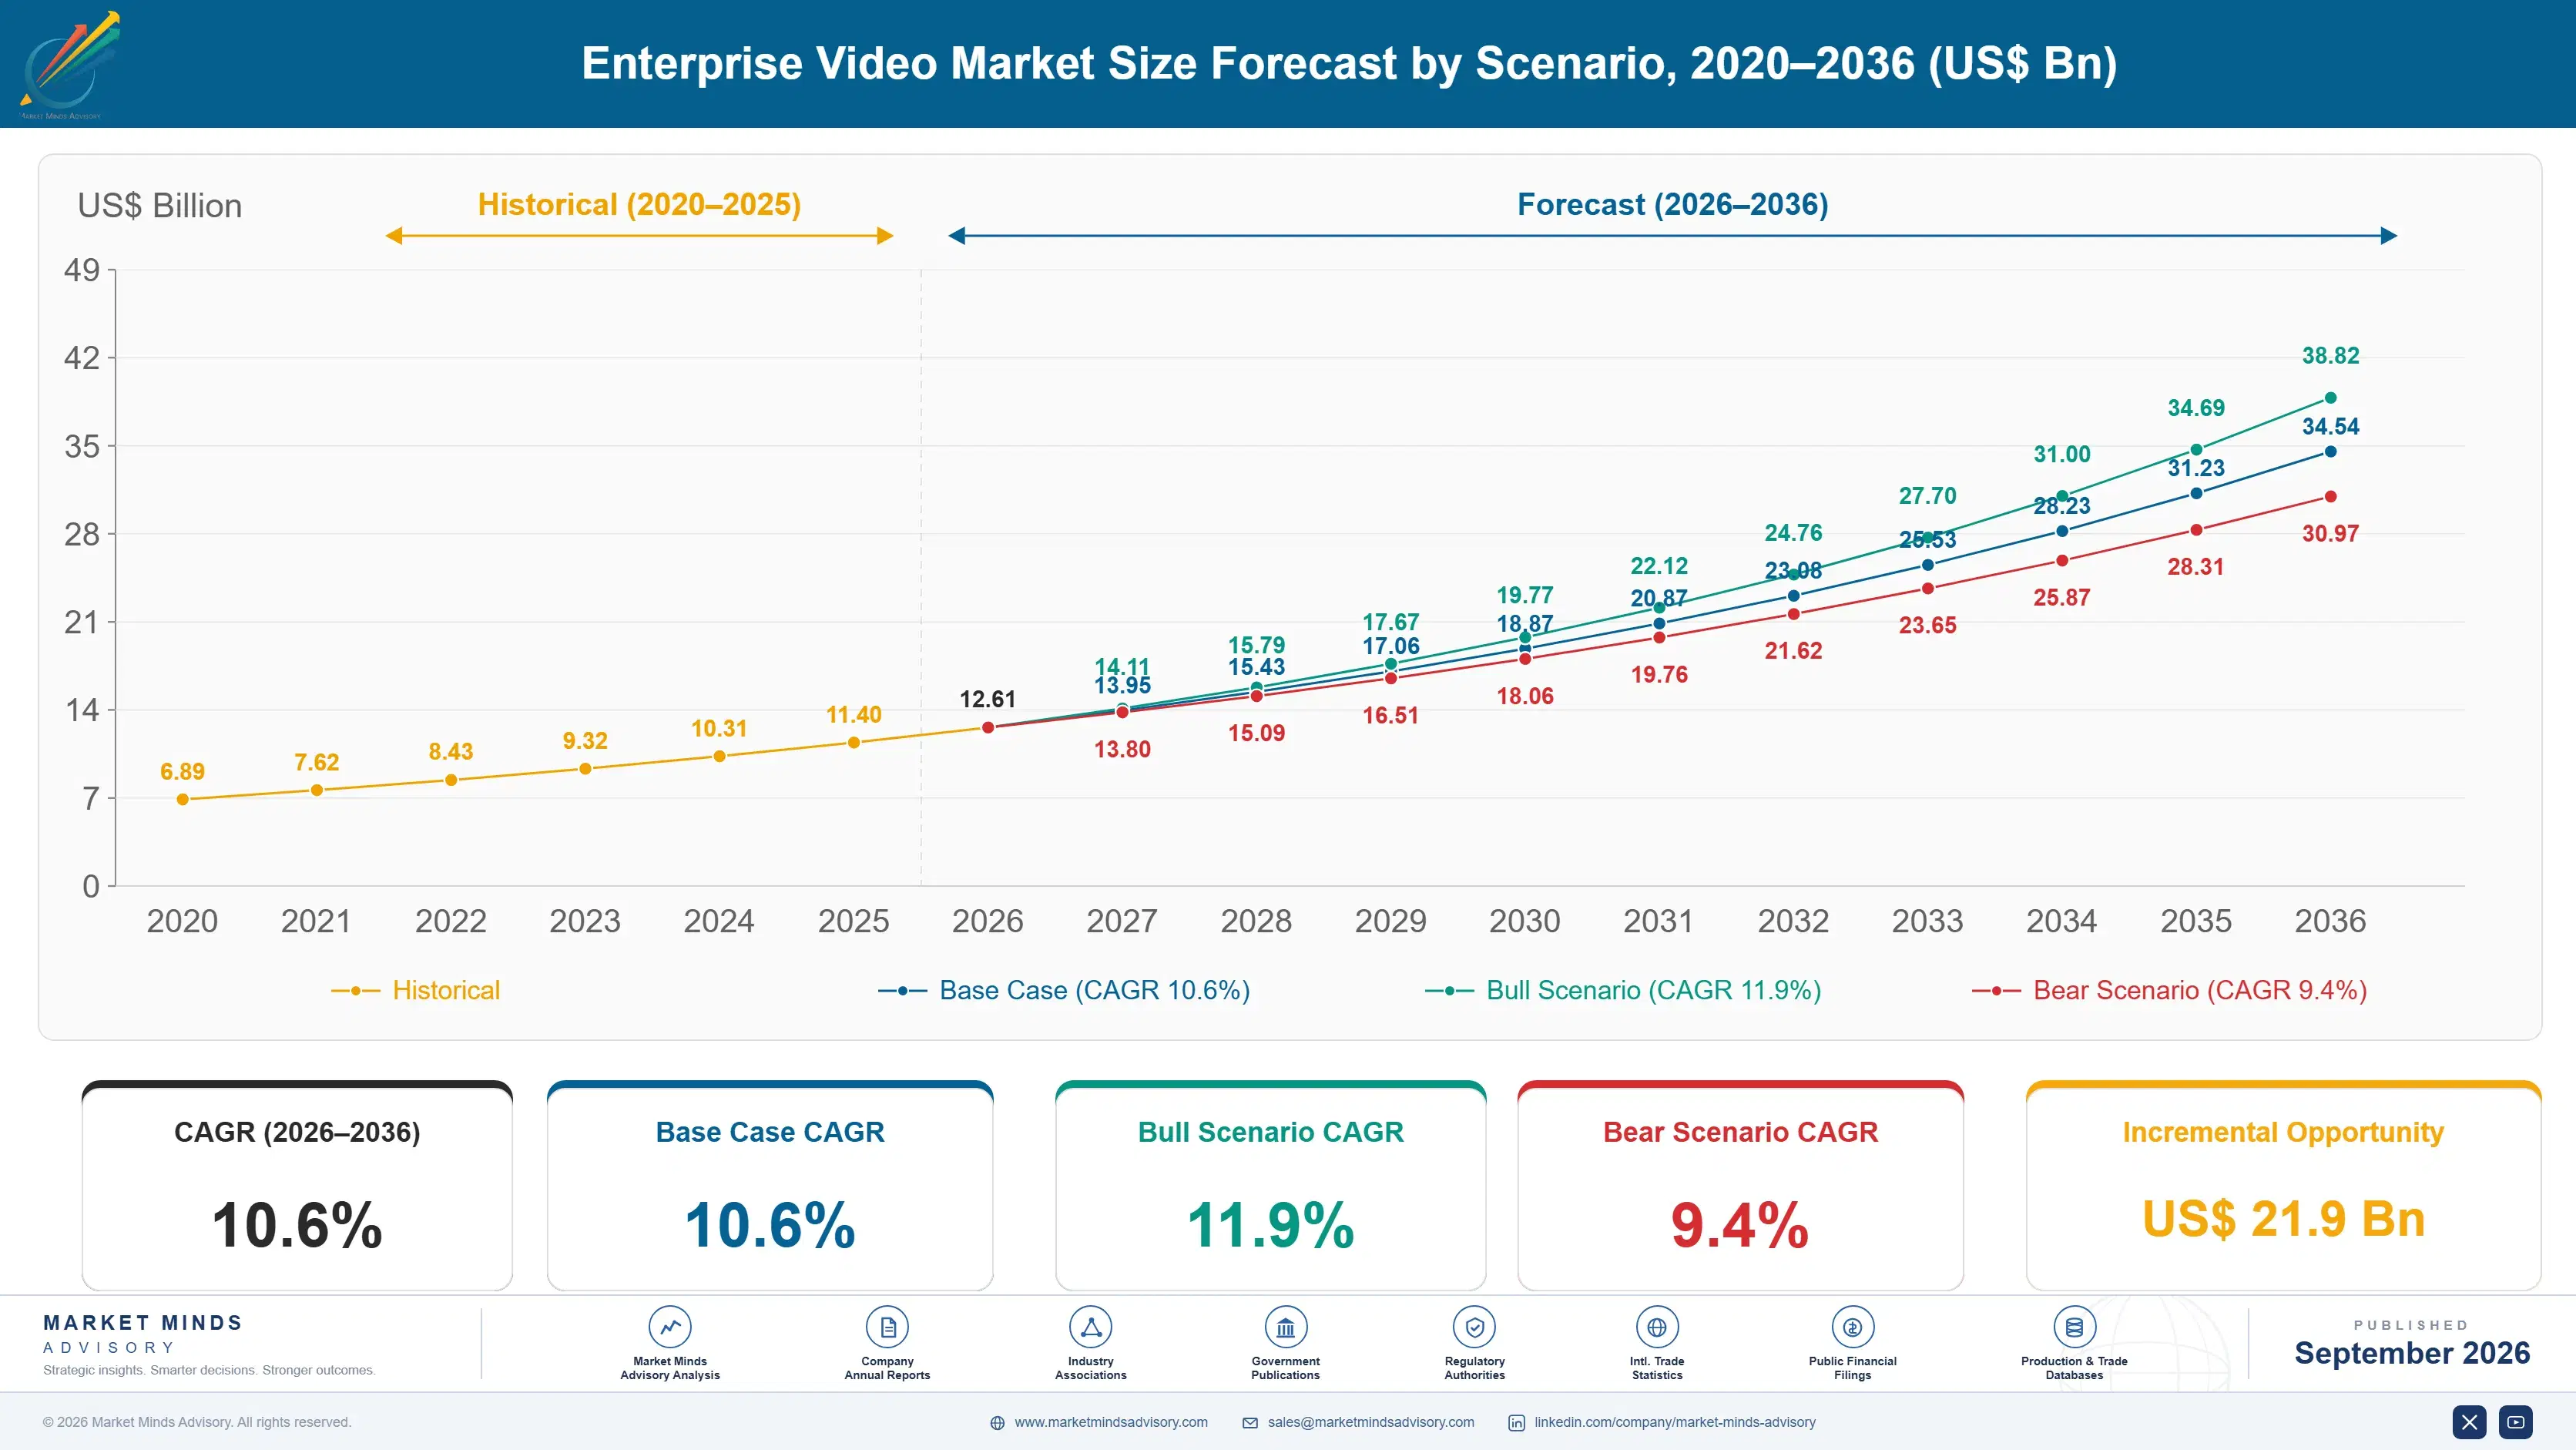
Enterprise Video Market Forecast Scenarios

enterprise-video-market-size-forecast-scenario-1789997478999
Between 2020 and 2025 the category compounded at 9.5%, driven by a shift to distributed working that arrived faster than any policy could keep pace with. Recording defaults turned on across whole organisations without much thought about what happens to the resulting files. Volume accumulated quickly, viewing did not follow, and legal departments began noticing an enormous discoverable record nobody had decided to keep.
The base case holds 10.6% on three mechanisms. Retention obligations keep tightening as regulators and courts treat recorded meetings the same way they treat email, which no organisation was prepared for. Accessibility requirements keep expanding across public sector and large employer obligations, and captioning at scale is genuinely expensive. And distributed workforces across India, Southeast Asia and Latin America keep growing in organisations recording by default from the first day.
The bull case at 11.9% assumes a significant legal action turns on recorded meeting content, which would move retention governance from prudent practice to board-level urgency across every comparable organisation. The bear case at 9.4% is meeting platform absorption: Microsoft and Google keep extending governance features, and an organisation with adequate capability inside a platform it already pays for has little reason to buy anything separate.

Recorded, Stored, Never Watched

The number that should worry every organisation in this category is nine percent. That is the share of recorded meetings anybody ever opens again, which means the overwhelming majority of what gets recorded is stored, backed up, replicated and never consulted by a single human being. It accumulates at roughly 14 gigabytes per recording-enabled employee each year, and nobody decided any of it should be kept.
TOP FIVE CONCENTRATION52%Held mostly by meeting platforms rather than by video specialists
RECORDING PLAYBACK RATE9%Recorded meetings that anybody ever opens again afterwards
DEFAULT RETENTION PERIOD7 yearsHow long most organisations keep recordings without deciding to
DISCOVERY REVIEW COST340 dollarsLegal review cost per hour of recorded material produced
CAPTIONING COVERAGE GAP58%Recorded content lacking captions where statutory obligations apply
STORAGE GROWTH PER EMPLOYEE14 gigabytesVideo accumulated annually by each recording enabled worker
That accumulation is a liability rather than an asset, and legal departments worked this out considerably faster than technology departments did. Recorded meetings are discoverable, courts increasingly treat them as they treat email, and reviewing produced material costs around 340 dollars for every hour of recording. An organisation defaulting to seven year retention on everything has created an expensive obligation it never chose. Retention governance grows at 15.9% against 10.6% for the market.
The competitive structure follows from where recording actually happens. Meeting platforms capture the material and now hold most of the revenue, which is why concentration sits at 52% among firms that are not video specialists at all. The specialists that survived handle what those platforms avoid: retention rules, discovery workflow, live events at scale and statutory accessibility obligations.
"Somebody in every organisation eventually asks what happens to the recordings. The honest answer is that they go into storage forever, nobody watches them, and one day a lawyer asks for all of them. That conversation is what actually sells governance software, not anything about engagement."
Director, Workplace Technology and Digital Communications Practice · MMA Technology Practice · September 2026

Market Trends

Recorded Meetings Become A Discoverable Legal Record

Courts and regulators increasingly treat recorded meetings the way they treat email, and most organisations default to keeping them for around seven years without anybody ever deciding that they should. Reviewing produced material costs around 340 dollars for every hour of recording, which turns an unmanaged archive into a genuinely expensive obligation. Retention governance and discovery controls grow at 15.9% against 10.6% for the market. The buyer sits in legal rather than anywhere near the technology function that switched recording on. Nobody in technology consulted legal before switching it on. That conversation happens afterwards and it is uncomfortable.
Market Impact: Coverage gap reaches 58% today

Accumulation Continues While Viewing Never Materialises

Around 9% of recorded meetings are ever opened again by anybody, while storage accumulates at roughly 14 gigabytes per recording-enabled employee every year across the organisation. That combination produces enormous volumes of material carrying no informational value and considerable liability at the same time. Organisations that examined the numbers have started turning default recording off for routine meetings rather than buying more storage. Suppliers selling engagement analytics are measuring something that mostly is not happening at all. Several large organisations have now turned default recording off entirely for routine internal meetings.
Market Impact: India compounds at 17.1% annually

Market Opportunities and Growth Drivers

Accessibility Obligations Require Captioning At Real Scale

Public sector bodies and large employers face expanding statutory obligations to caption recorded content, and around 58% of material subject to those requirements currently lacks captions entirely. That is a compliance gap with a deadline rather than an aspiration anybody can defer indefinitely. Accessibility and transcription services grow at 12.4% as a direct consequence, and the work scales with recording volume rather than with viewership, which makes it considerably more expensive than most organisations initially assumed. Captioning material nobody watches is an uncomfortable conversation with an unambiguous statutory answer. Language coverage varies enormously between vendors.
Market Impact: Concentration reaches 52% already

Distributed Workforces Record By Default From Day One

Organisations building distributed teams across India, Southeast Asia and Latin America enable recording from the outset rather than switching it on across an established estate afterwards. India compounds at 17.1%, faster than any other market, on distributed workforce growth at genuine scale across technology and business services. Those organisations accumulate video from their first day of operation, which means governance is a design decision rather than a remediation project, and vendors reaching them early set the retention defaults. Governance decided at design costs a fraction of remediation later. Vendors reaching those organisations early set the defaults themselves.
Market Impact: Storage grows 14 gigabytes yearly

Market Restraints and Challenges

Meeting Platforms Keep Absorbing Adjacent Capability

Microsoft and Google keep extending retention, transcription and governance features inside platforms organisations already pay for, which removes the reason to buy anything separate for requirements that stop short of specialist complexity. The root cause is that the meeting platform captures the recording and therefore owns the natural place to manage it. Commercially this caps the specialist market permanently. Mitigation runs through discovery workflow, live events at scale and statutory accessibility obligations, none of which those platforms handle convincingly. Specialists are pushed steadily toward the obligations nobody wants to assume.
Market Impact: Review costs 340 dollars hourly

Nobody Wants To Fund Managing Unwatched Material

Persuading an organisation to spend on governing recordings that around 9% of people ever open is genuinely difficult, because the material has no demonstrated value and the risk it carries is hypothetical until it is not. The root cause is that liability arrives suddenly while cost arrives continuously. Commercially this delays purchases until an incident forces them. Mitigation runs through discovery cost at 340 dollars an hour, and through storage growth at 14 gigabytes per employee that finance can see accumulating. Most organisations act only after their first production request. That single experience reframes the entire conversation permanently.
Market Impact: Only 9% get watched again
4 additional market trends, 3 additional growth drivers, and 2 additional restraints and challenges are covered in the full report. Contact sales@marketmindsadvisory.com to access the complete intelligence.

Segment CAGR and Growth Architecture

Segmentation follows function class, since each carries a different buyer, different exposure to meeting platform absorption and quite different evidence about whether anybody values it. Six classes cover the market, spanning retention governance, live event platforms, content management portals, accessibility services, engagement analytics and secure external distribution. Organisation type and deployment route are separate dimensions handled elsewhere.
enterprise-video-market-market-share-analysis-1789997479539

Retention Governance And Discovery Controls

Retention governance and discovery controls grow at 15.9%, half again the market rate of 10.6%, because courts and regulators now treat recorded meetings much as they treat email and most organisations default to keeping everything for around seven years without deciding to. Reviewing produced material costs around 340 dollars for every hour, which turns an unmanaged archive into an expensive obligation nobody chose to take on. The buyer sits in legal rather than in the technology function that originally switched recording on, which makes this a risk purchase carrying an entirely different evaluation from anything else here. Jurisdictional variation in discovery obligation makes this genuinely difficult to build well, which is precisely why meeting platforms have avoided it.
CAGR 15.9%

Accessibility And Transcription Services

Accessibility and transcription services compound at 12.4% because public sector bodies and large employers face expanding statutory captioning obligations, and around 58% of material subject to those requirements currently has no captions at all. The work scales with recording volume rather than with viewership, which makes it far more expensive than organisations expect given only 9% of recordings are ever watched. That mismatch produces an uncomfortable conversation about whether material nobody views needs captioning at all, and the statutory answer is frequently that it does regardless. Language coverage quality varies enormously between vendors and determines where the service can actually be sold at all. Standards testing is unforgiving. Coverage gaps are measurable and dated.
CAGR 12.4%
Full segment breakdown across 6 segments available in the complete report.

Regional Architecture and Country Demand Map

East Asia holds 27% of category spending, ahead of every other region, on the very large distributed workforces and the heavy platform adoption running across China, Japan and South Korea. North America follows closely behind at 26% on discovery exposure and statutory accessibility obligations together.

East Asia

East Asia takes 27% of spending, the largest regional share, on very large distributed workforces and platform adoption that spread faster here than in most Western markets. Japanese and South Korean corporations record extensively and retain conservatively, which produces exactly the accumulation problem governance products address. Chinese enterprises run largely on domestic platforms under separate arrangements, which removes that portion from international competition. Live event platforms are more heavily used here for internal communication than elsewhere. Growth at 11.7% sits above the global rate on workforce scale rather than regulatory pressure. Retention practice here is conservative by default. Accumulation is correspondingly larger than in most Western organisations. Governance products address exactly that accumulation.
Share: 27% | CAGR: 11.7% (2026 to 2036)

North America

Twenty-six percent of spending reaches North America, where discovery exposure and accessibility obligations both bite harder than anywhere else in the world. Litigation practice treats recorded meetings as producible material, and review at around 340 dollars per hour makes an unmanaged archive expensive in a way legal departments understand immediately. Microsoft, Zoom, Cisco, Google and Kaltura all hold substantial regional positions. Federal and state accessibility requirements make captioning a statutory matter rather than a preference. Growth at 10.2% sits marginally below the global rate on adoption maturity. Litigation practice makes the internal argument straightforward. Accessibility obligations carry statutory weight rather than good intentions. Legal departments understand the cost immediately. Adoption maturity limits further growth.
Share: 26% | CAGR: 10.2% (2026 to 2036)
Regional intelligence for 5 additional markets available in the complete report: Western Europe, South Asia and Pacific, Latin America, Middle East and Africa, Eastern Europe. Contact sales@marketmindsadvisory.com.
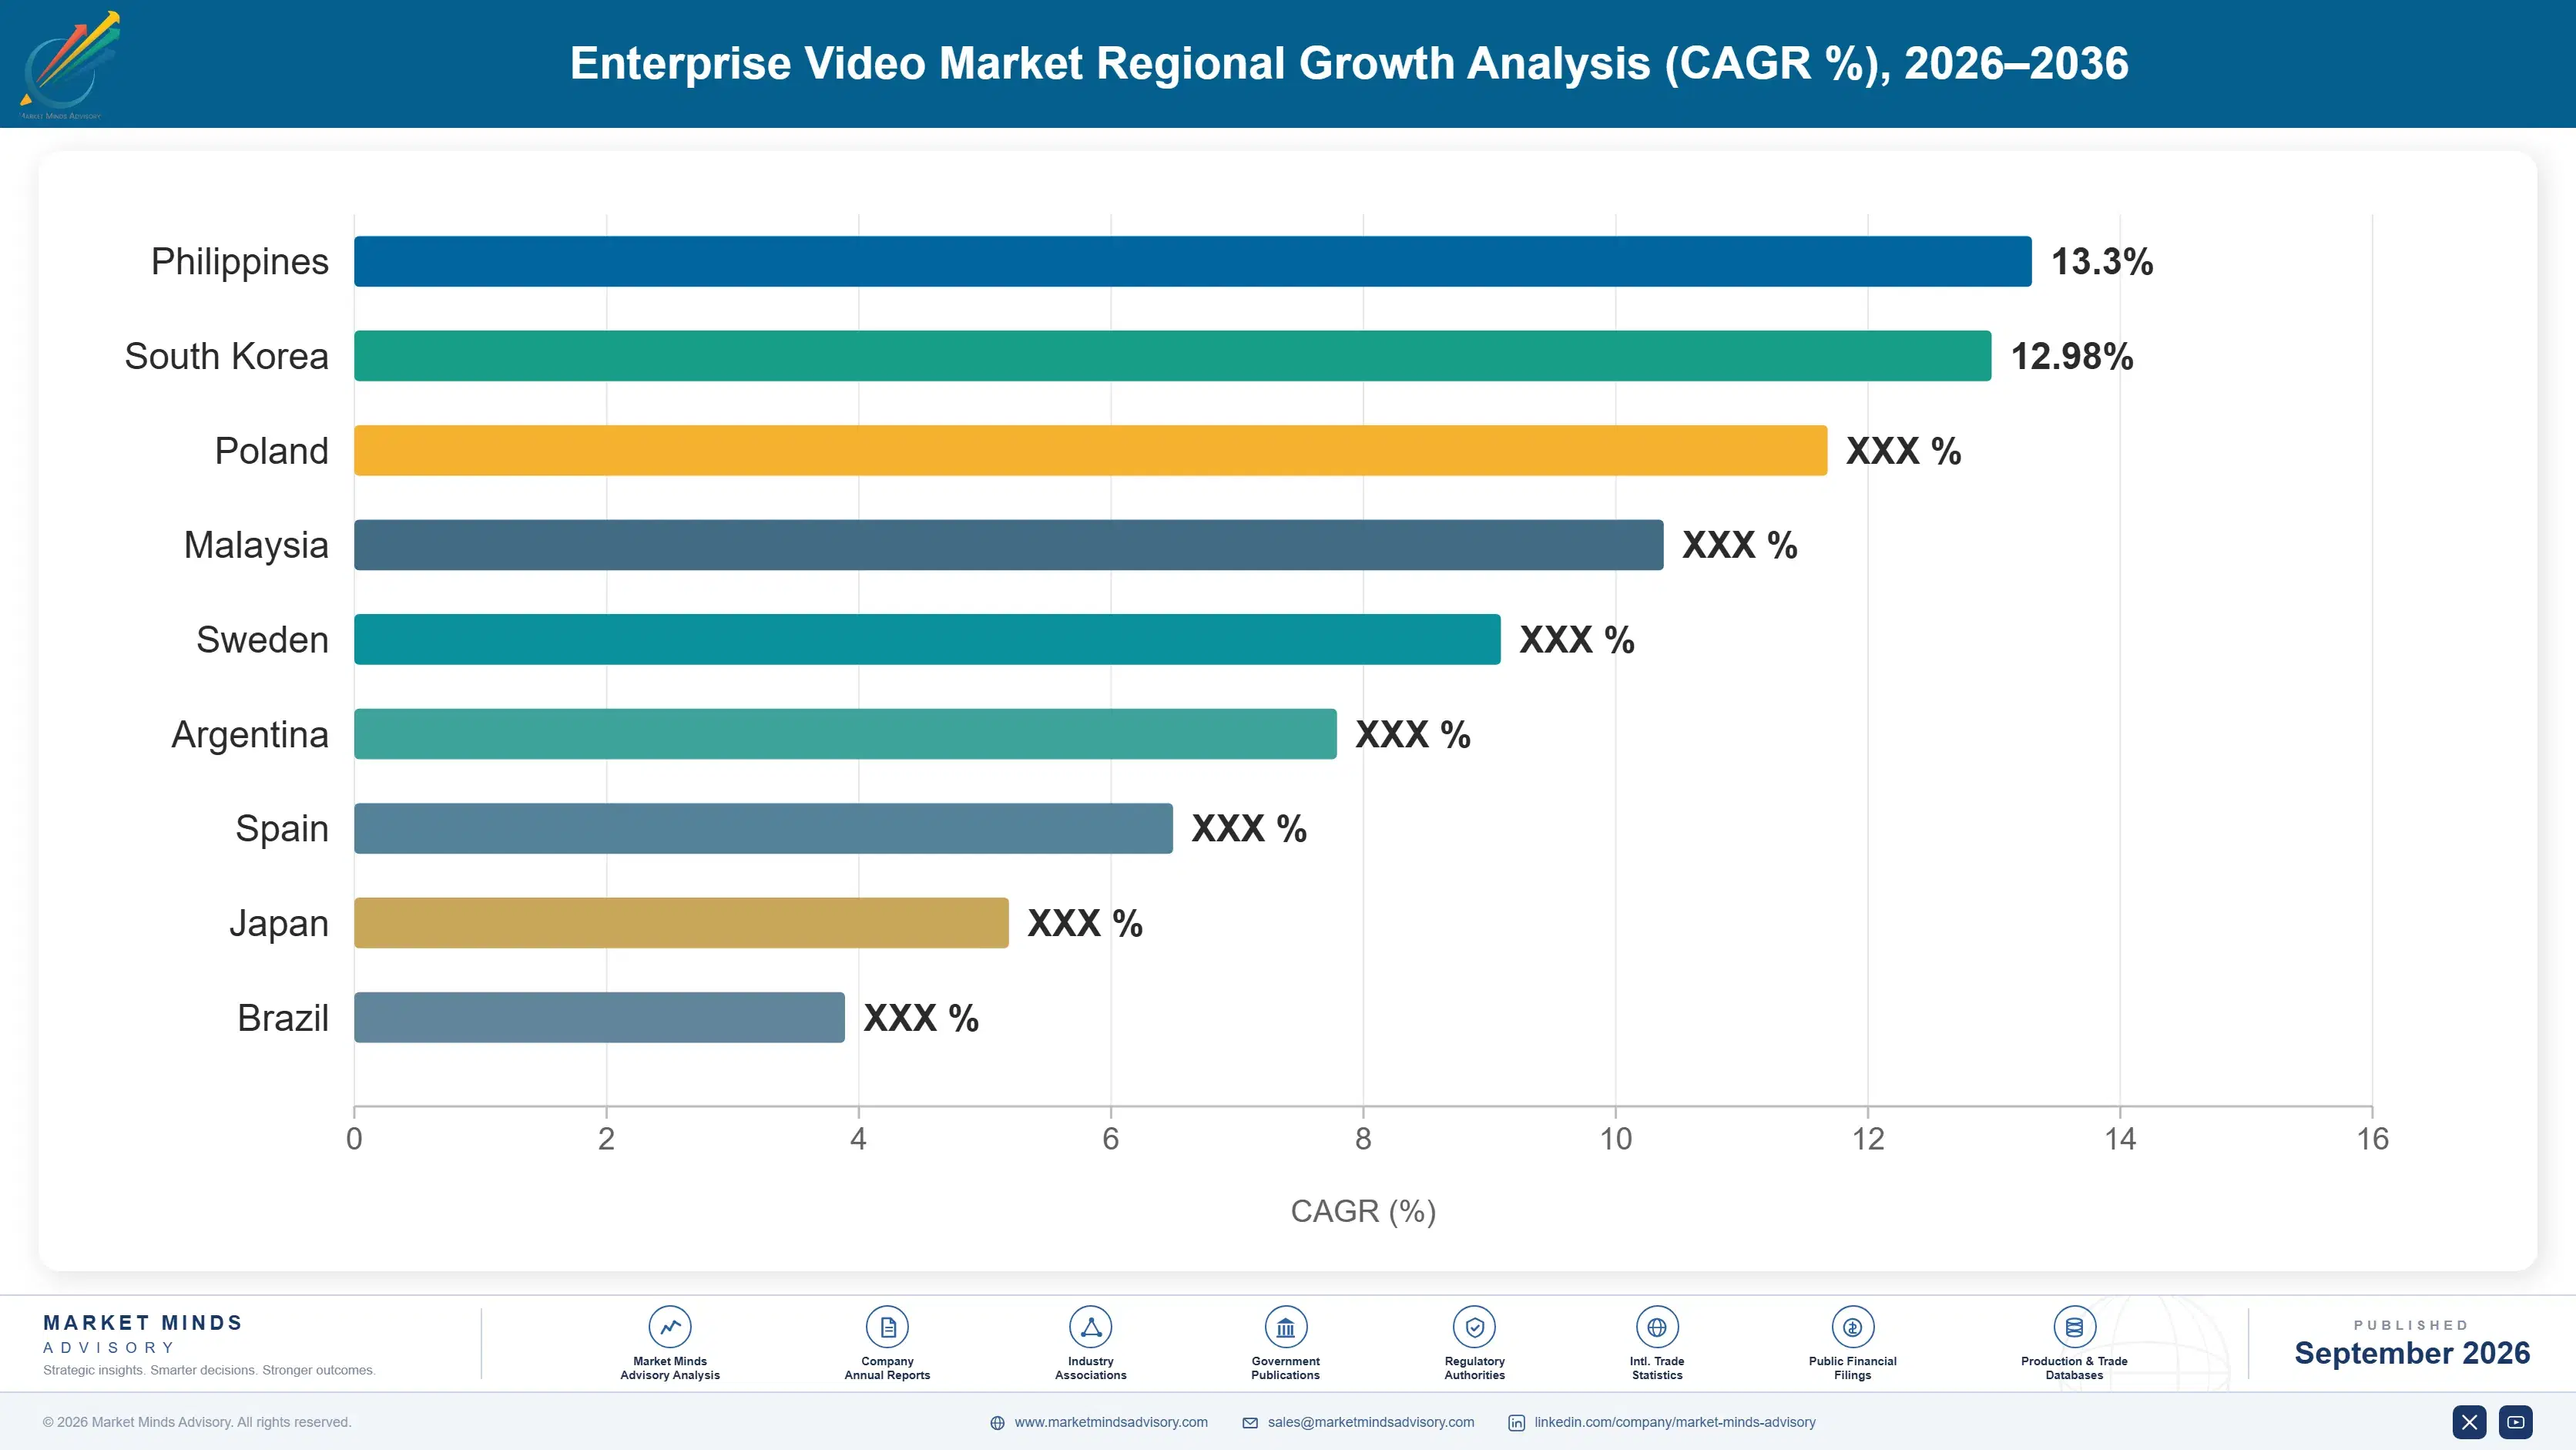
enterprise-video-market-country-cagr-analysis-1789997480071

Where This Software Actually Sells

Almost nobody watches any of the recordings at all, the meeting platforms already own the capture point and keep absorbing features around it, and the material accumulating is a genuine legal liability rather than any kind of asset. The four levers below follow those conditions rather than any argument about engagement or communication effectiveness.

Sell Discovery Cost Rather Than Engagement Value

Around 9% of recorded meetings are ever opened again, so any argument built on the value of recorded content is contradicted by the organisation's own usage data. Reviewing produced material in litigation costs around 340 dollars for every hour, and default retention runs to seven years across material nobody chose to keep. Vendors selling engagement analytics are measuring something that mostly is not happening. Those selling discovery cost avoidance are addressing a number legal departments already understand well. Usage data contradicts the engagement argument before anybody finishes presenting it. Legal already knows the number.
Market Impact: Review costs 340 dollars for each recorded hour

Build What Meeting Platforms Deliberately Avoid

Microsoft and Google keep extending retention and transcription inside platforms organisations already pay for, which is why concentration sits at 52% among firms that are not video specialists. Discovery workflow, live events at genuine scale and statutory accessibility obligations are the three things those platforms handle unconvincingly, largely because doing so means assuming obligations they prefer to leave with the customer. Specialists competing on basic content management are competing against a feature their customer already owns. Obligations platforms will not assume are the only genuinely defensible ground remaining here. That ground is smaller and considerably better defended.
Market Impact: Concentration already reaches fully 52% across this market

Price Accessibility Work Against Statutory Deadlines

Around 58% of content subject to accessibility obligations currently has no captions, and those obligations carry deadlines rather than aspirations. The work scales with recording volume rather than with viewership, which makes it expensive in a way organisations consistently underestimate before they measure it. Vendors positioning captioning as an inclusion benefit are addressing a discretionary budget. Those positioning it against a statutory deadline are addressing somebody who has to act regardless of what they would prefer. Regulators test compliance rather than accepting reasonable effort as sufficient. Deadlines rather than aspirations drive the whole purchase decision here.
Market Impact: Some 58% of covered content still lacks captions

Reach Distributed Organisations Before Defaults Set

Organisations building distributed teams across India and Southeast Asia enable recording from the first day and accumulate roughly 14 gigabytes per employee annually thereafter. India compounds at 17.1% on exactly that growth. Reaching those organisations while governance is still a design decision is far easier than arriving after several years of accumulation has already happened. Vendors organised around remediating established estates are competing for the considerably harder half of this market. Setting the default at inception costs almost nothing compared with remediating years of accumulation afterwards. The window closes quickly.
Market Impact: India alone compounds at 17.1% every single year

Who Controls the Margin Pool

Five suppliers hold 52% of enterprise video platform and service revenue, and meeting platforms rather than video specialists now hold the great majority of that share. Microsoft, Zoom, Cisco, Google and Kaltura lead. All participants here are assessed on enterprise video platform and service revenue rather than on any broader collaboration or communications business they also operate. Video specialists hold a considerably smaller share than the category name would suggest.
Competition runs on governance capability and statutory compliance rather than on video handling, which meeting platforms perform adequately and give away inside subscriptions organisations already hold. The second dimension is live event capability at genuine scale, because an all-hands broadcast to tens of thousands of employees is an operational problem that ordinary meeting infrastructure handles rather poorly.

Pressure comes overwhelmingly from meeting platforms extending into the category rather than from specialists competing with each other. Rankings shift where distributed organisations are being built rather than where established estates are remediated, particularly across India, Southeast Asia and Latin America at present. Governance decided at inception rather than remediated afterwards is what makes those markets commercially attractive to enter now.
enterprise-video-market-company-positioning-matrix-1789997480595

Competitive Moat and Risk Dimensions

MICROSOFT

Moat: Capture Point Ownership

Microsoft owns the point where recordings are actually created across an enormous share of enterprise meetings, which makes it the natural place to manage what happens afterwards. Governance features added there require no separate purchase, no integration and no additional vendor relationship. Specialists must argue their capability justifies buying something extra alongside a platform already paid for.
MICROSOFT

Risk: Obligation Avoidance Limits

Platform vendors have been notably slow to build discovery workflow and statutory accessibility capability, largely because doing so means assuming obligations they would rather leave sitting with the customer. Those are the fastest growing parts of this category at 15.9% and 12.4%. Owning the capture point does not answer a question a court or a regulator is asking.
KALTURA

Moat: Live Event Scale Capability

Kaltura built genuine capability in live events at scale, where broadcasting to tens of thousands of employees at once is an operational problem ordinary meeting infrastructure handles poorly. That requires delivery engineering and event operations experience rather than any software feature. Meeting platforms have shown limited appetite for building it.
KALTURA

Risk: Narrow Use Case Exposure

Large-scale live events are infrequent for most organisations, which makes the capability valuable but the purchase episodic rather than recurring. Governance and accessibility are the segments with continuous demand and statutory pressure behind them. Depth in a use case that occurs a few times a year is harder to build subscription revenue on than depth in an ongoing obligation.

Players Tracked

Prominent Players

Microsoft
Zoom
Cisco
Google
Kaltura

Other Key Players

Vimeo
Brightcove
Panopto
Vbrick
Qumu
Wistia
Verizon Business
Haivision
Notified
ON24
Hopin
Vidyard
Sonix
Verbit
3Play Media

Recent Developments

APRIL 2025

Courts Extend Treatment Of Recordings As Producible Material

Litigation practice across several jurisdictions extended treatment of recorded meetings as material producible on the same terms as email, a legal development rather than any corporate transaction. Review costs around 340 dollars for every hour of recording produced, which turns default seven year retention into an expensive obligation nobody chose.
Signal: Default retention that nobody decided on becomes an expensive obligation once a court asks for it.
OCTOBER 2024

Accessibility Deadlines Tighten Across Public Sector Bodies

Public sector accessibility requirements tightened captioning obligations for recorded content across several jurisdictions, a regulatory development rather than any commercial transaction. Around 58% of material subject to those requirements currently carries no captions at all, and the work scales with recording volume rather than with how much anybody watches.
Signal: Captioning scales with the total recording volume, not with the tiny share that anybody actually watches.
JULY 2025

Distributed Organisations Set Recording Defaults From Inception

Technology and business services organisations building distributed teams across India and Southeast Asia enabled recording from inception, an operational development rather than any corporate transaction. Those organisations accumulate roughly 14 gigabytes of video per recording-enabled employee annually, which makes governance a design decision rather than a later remediation project.
Signal: Governance decided at inception costs a very small fraction of remediating years of accumulated recordings afterwards.

What Enterprise Video Costs

Storage and content delivery absorb roughly 34% of vendor cost of delivery, and that share rises directly with accumulation nobody is deleting. Transcription and captioning processing takes around 22%, scaling with recording volume rather than with viewership. Product engineering absorbs about 24%, concentrated in governance logic and language coverage, with support taking most of the remaining balance.
Cloud storage and egress pricing rose materially through 2023 and 2024 as demand outpaced provider capacity, and vendors on per-seat subscription pricing absorbed that movement against archives growing at roughly 14 gigabytes per employee annually. Microsoft Annual Report 2024 and Zoom Annual Report 2024 both record infrastructure cost as a significant operating variable. Vendors with tiered storage architecture managed that period considerably better than those keeping everything on primary storage.

The competitive disadvantage mechanism is storage architecture rather than headline cloud pricing. A vendor moving unwatched material to cheaper tiers carries far lower cost per customer than one holding everything hot, and around 91% of recordings are never opened again. Exposure concentrates among vendors whose pricing assumed viewership that never materialised, which describes a considerable share of the specialist field.
enterprise-video-market-cost-volatility-analysis-1789997480790

Tier Storage Against Actual Playback Behaviour

Storage absorbs roughly 34% of delivery cost while only around 9% of recordings are ever opened again by anybody. Moving unwatched material to cheaper tiers after a defined period cuts that cost substantially without affecting anything customers actually do. The engineering sits in lifecycle policy rather than infrastructure procurement, and vendors holding everything hot carry worsening cost.

Process Captioning Selectively Where Obligations Apply

Transcription absorbs around 22% of cost and scales with recording volume rather than with viewership or with obligation coverage. Identifying which content actually falls under statutory requirements, rather than captioning everything by default, cuts that cost considerably. The discipline is policy configuration rather than processing capability, and most vendors caption indiscriminately because it is simpler to build that way.

Invest Language Coverage By Recording Volume

Product engineering absorbs roughly 24% of cost, and transcription language coverage only pays back where recording volume in that language is genuinely substantial. Prioritising by measured volume rather than by market prestige keeps that spending proportionate to any return. Vendors adding languages for competitive appearance carry engineering cost against accessibility revenue that rarely materialises at the scale assumed.

Portfolio Architecture for Margin Defence

Margin architecture separates on whether meeting platforms have already absorbed the function. Video content management and portals earn least, since platforms provide adequate equivalents inside subscriptions organisations already hold. Engagement analytics sits above on measurement content, though it measures behaviour that mostly is not occurring. Retention governance, accessibility services and live event platforms earn most, because each addresses an obligation or capability those platforms avoid.
The volume versus premium tension runs between storage-heavy services and governance software. Content management carries enormous storage cost against thin subscription pricing, and accumulation makes it worse annually. Governance and discovery carry almost no storage burden at strong margin. Vendors organised around holding video are accumulating cost, while those organised around deciding what to keep are accumulating margin instead.

High-value pools concentrate in retention governance and in statutory accessibility, and neither is reached through video handling capability. Governance requires understanding discovery obligations that vary by jurisdiction. Accessibility requires meeting standards a regulator will test rather than approximating them. Both are deliberate investments rather than natural extensions of a video platform, which is precisely why the meeting platforms have avoided building them.

Volume / Commodity-Adjacent

Video content management and portal delivery at standard capability, where meeting platforms provide adequate equivalents inside subscriptions organisations already pay for anyway. The twelve point spread separates vendors with tiered storage architecture from those holding all accumulated material on primary storage indefinitely.
Gross Margin: 38% to 50%

Premium / Certified

Live event platforms, secure external distribution and engagement analytics, where operational capability and delivery scale determine selection alongside price. The twelve point spread tracks how much delivery engineering each vendor genuinely operates against how much it resells from underlying infrastructure providers.
Gross Margin: 56% to 68%

Sustainability / Regulatory / Next-Generation

Retention governance, discovery controls and statutory accessibility services, each addressing an obligation that meeting platforms have deliberately avoided assuming for themselves. The fourteen point spread reflects jurisdictional depth and standards compliance quality, neither of which is quick to build.
Gross Margin: 72% to 86%
enterprise-video-market-portfolio-architecture-1789997481295

High-value Sub-segments and Strategic Watch-out

Retention Governance And Discovery Controls

Grows at 15.9% because courts now treat recorded meetings much as they treat email and nobody decided to keep any of it. The fourteen point spread reflects jurisdictional depth. Review costs around 340 dollars for every hour of recording actually produced. Jurisdictional variation makes this genuinely hard.
Gross Margin: 72% to 86%

Accessibility And Transcription Services

Grows at 12.4% as statutory captioning obligations expand while around 58% of covered content still carries no captions at all. The fourteen point spread reflects standards compliance quality. Work scales with recording volume rather than with any measure of viewership. Standards testing is entirely unforgiving here.
Gross Margin: 72% to 86%

Live Streaming And Virtual Event Platforms

Grows at 11.2% on all-hands broadcasts to tens of thousands that ordinary meeting infrastructure handles rather poorly. The twelve point spread reflects delivery engineering depth. Demand is episodic rather than continuous, which makes subscription revenue harder to build. Delivery engineering separates vendors sharply. Event operations experience matters more than software.
Gross Margin: 56% to 68%

Video Content Management And Portals

Grows at 5.8%, slowest of the six function classes, because meeting platforms provide adequate equivalents inside subscriptions organisations already pay for. The twelve point spread reflects storage architecture. Only around 9% of stored recordings are ever opened again anyway. Accumulation makes the cost position worse annually.
Gross Margin: 38% to 50%

Why Platforms Rarely Change

The annuity here follows the meeting platform rather than any video relationship. Recording happens inside the platform an organisation already standardised on, and moving video governance elsewhere means integrating with something the platform vendor has limited incentive to make easy. Organisations change meeting platforms rarely and reluctantly, which means the video decision follows a decision made for entirely different reasons and persists for as long as it does.
Depth varies sharply by function. Retention governance holding years of policy application and discovery history is deeply embedded, since the record of what was kept and deleted may itself be evidence. Accessibility services with compliance documentation behind them are similarly fixed. Content management portals are barely embedded at all, and organisations abandon them quietly when the meeting platform ships something adequate.

The buyer has moved from communications and technology functions toward legal and compliance. A communications team evaluated whether video reached employees effectively. A legal function evaluates discovery exposure across material nobody watches. A compliance function evaluates whether captioning meets a standard a regulator will test. Vendors still selling internal communication effectiveness are addressing the buyer whose original assumptions the usage data has quietly refuted.
enterprise-video-market-end-use-penetration-index-1789997481783

What Decides These Purchases

These are among the four positions where our research anticipates prominent divergence between winners and laggards over the coming forecast period. Each is grounded in the demand model, the regulatory perimeter, and the announced capacity pipeline.
01 / LIABILITY COST SELLING

Sell The Subpoena, Not The Engagement

Around 9% of recorded meetings are ever opened again by anybody, so any argument built on the value of recorded content is directly contradicted by the organisation's own usage data before anybody has finished presenting it. Reviewing produced material in litigation costs around 340 dollars for every hour, against default retention running to seven years across material nobody ever chose to keep. Vendors selling engagement analytics are measuring something that mostly is not happening, and the customer can check that number themselves.
02 / PLATFORM GAP BUILDING

Build Obligations Platforms Refuse To Assume

Microsoft and Google keep extending retention and transcription capability directly inside the platforms that organisations already pay for, which is exactly why concentration sits at 52% among firms that are not really video specialists at all. Discovery workflow, live events at genuine scale and statutory accessibility are the three things that those platforms handle rather unconvincingly across every deployment. Building any of them means assuming obligations that platform vendors would far rather leave sitting with the customer instead of taking on.
03 / STATUTORY DEADLINE POSITIONING

Price Captioning Against The Regulator

Around 58% of content subject to accessibility obligations currently carries no captions at all, and those obligations arrive with deadlines attached rather than as aspirations anybody can defer to a later budget cycle. The work scales with recording volume rather than with viewership, which makes it expensive in a way organisations consistently underestimate before somebody measures it properly. Vendors positioning captioning as an inclusion benefit are addressing a purely discretionary budget, and regulators test compliance rather than accepting reasonable effort.
04 / EARLY GOVERNANCE COVERAGE

Set Defaults Before Accumulation Begins

Organisations building distributed teams across India and Southeast Asia enable recording from the very first day and then accumulate roughly 14 gigabytes per employee annually for as long as nobody intervenes. India compounds at 17.1% annually on exactly that kind of growth continuing at genuine pace. Reaching those organisations while governance is still a design decision is considerably easier than arriving after several years of unmanaged accumulation has already happened, by which point the defaults have already been set by somebody else.

Engagement Snapshot From the Field

A live engagement with an industry participant carrying material or product regulatory and market exposure ahead of a defining policy shift, showing how our research translates into a defensible multi-year portfolio strategy.
MARKET MINDS ADVISORY · CLIENT ENGAGEMENT SUMMARY
Enterprise Video Producer Strategic Portfolio Review and Transition Roadmap 2026·Investment Scenario on Enterprise Video Exposure Evaluation 2025-26
CLIENT PROFILE
A professional services firm of around fourteen thousand staff, recording meetings by default right across the whole organisation since distributed working first began. A litigation matter had required production of recorded material, and the review cost had substantially exceeded anything anybody had expected. Nobody had ever decided what should be retained or for how long.
STRATEGIC CHALLENGE
Technology wanted more storage capacity, which was the immediate operational pressure everybody could see. Legal wanted retention rules following the production experience. Nobody had measured how much recorded material was ever watched, what it cost to hold, or what proportion actually needed keeping for any business or regulatory reason at all.
MMA APPROACH
MMA measured playback rates across recorded material by meeting type, and separated storage cost from the review cost incurred during the litigation production. We assessed what retention obligations genuinely applied against what the platform defaults were doing, and modelled the effect of turning default recording off for routine meetings. Work drew on 47 expert interviews conducted in Q4 2025.
KEY FINDINGS
  1. Under 1 in 10 recorded meetings had ever been opened again, and the great majority of those were opened within the first week.
  2. Storage cost was modest by comparison with the review cost incurred during the single litigation production that the firm had actually faced.
  3. No retention obligation applied to the majority of recorded material, which was being kept purely because a platform default said so (client-reported, unverified by MMA).
  4. Turning default recording off for routine internal meetings would have removed most of the accumulation with no operational complaint expected from anybody.
CLIENT PROFILE
A professional services firm of around fourteen thousand staff, recording meetings by default right across the whole organisation since distributed working first began. A litigation matter had required production of recorded material, and the review cost had substantially exceeded anything anybody had expected. Nobody had ever decided what should be retained or for how long.
STRATEGIC CHALLENGE
Technology wanted more storage capacity, which was the immediate operational pressure everybody could see. Legal wanted retention rules following the production experience. Nobody had measured how much recorded material was ever watched, what it cost to hold, or what proportion actually needed keeping for any business or regulatory reason at all.
MMA APPROACH
MMA measured playback rates across recorded material by meeting type, and separated storage cost from the review cost incurred during the litigation production. We assessed what retention obligations genuinely applied against what the platform defaults were doing, and modelled the effect of turning default recording off for routine meetings. Work drew on 47 expert interviews conducted in Q4 2025.
KEY FINDINGS
  1. Under 1 in 10 recorded meetings had ever been opened again, and the great majority of those were opened within the first week.
  2. Storage cost was modest by comparison with the review cost incurred during the single litigation production that the firm had actually faced.
  3. No retention obligation applied to the majority of recorded material, which was being kept purely because a platform default said so (client-reported, unverified by MMA).
  4. Turning default recording off for routine internal meetings would have removed most of the accumulation with no operational complaint expected from anybody.
RECOMMENDED STRATEGY
Phase 1: Phase one: turn default recording off for routine internal meetings, since almost nothing recorded was ever watched and none of it was required. Phase 2: Phase two: apply retention rules to the remaining material based on genuine obligation rather than on whatever the platform default happened to be. Phase 3: Phase three: build the business case on discovery cost avoided rather than on storage saved, which was the smaller number by a wide margin.
OUTCOME
The firm disabled default recording for routine meetings and applied retention rules to what remained (client-reported, unverified by MMA). Accumulation fell sharply and no operational complaint followed. Recording is now a deliberate decision per meeting rather than a platform default, which is the change that outlasted the engagement itself.

Frequently Asked Questions

Foundational context covering the market sizes, CAGR, scope, country, region and competition that inform every finding below. This section is provided to cover basics and most often pre-purchase conversations, answered from the MMA Primary Research Dataset.

What is the current size of the Enterprise Video Market?

Global value reaches USD 12.6 billion in 2026, measured as platform and service revenue across six function classes. The 2025 base is USD 11.4 billion.

How large will the Enterprise Video Market be by 2036?

The market reaches USD 34.5 billion by 2036, an increase of USD 21.9 billion across the forecast period. That represents 2.74 times expansion from the 2026 base.

What is the CAGR for the Enterprise Video Market 2026 to 2036?

The base case runs at 10.6% annually, with a bull case at 11.9% if a significant legal action turns on recorded content and a bear case at 9.4% if meeting platforms absorb more governance capability.

Which segment is growing fastest?

Retention governance and discovery controls grow at 15.9%, half again the market rate of 10.6%. Unmanaged recordings are a legal liability rather than any kind of asset.

Who are the major companies in the Enterprise Video Market?

Microsoft, Zoom, Cisco, Google and Kaltura lead on platform and service revenue, together holding 52%. Vimeo, Brightcove and Panopto hold smaller specialist positions behind them.

Which country is growing fastest?

India leads at 17.1%, on distributed workforce growth across technology and business services organisations that record by default. Indonesia and Brazil both follow behind it.

Report Segmentation Architecture

The full report scope spans multiple orthogonal segmentation dimensions, with cross-tabulated demand data provided for each dimension pair. Coverage extends further to regional breakdowns, trend trajectories, and the competitive detail needed to support segment-level decision-making.

By Function Class

  • Retention Governance And Discovery Controls
  • Accessibility And Transcription Services
  • Live Streaming And Virtual Event Platforms
  • Secure External Video Distribution
  • Video Analytics And Engagement Measurement
  • Video Content Management And Portals

By End-Use Industry

  • Professional And Financial Services
  • Technology And Software Organisations
  • Healthcare Providers And Systems
  • Public Sector And Government Bodies
  • Higher Education Institutions
  • Manufacturing And Industrial Enterprises

By Commercial Dimension

  • Meeting Platform Bundled Delivery
  • Direct Specialist Subscription
  • Systems Integrator Deployment
  • Managed Accessibility Services
  • Event Production Service Contracts
  • Public Sector Framework Procurement

By Region

  • North America
  • Western Europe
  • East Asia
  • South Asia and Pacific
  • Latin America
  • Middle East and Africa
  • Eastern Europe

Scope, Methodology, and Coverage

Every figure in this report is reproducible from documented input assumptions. The scope below maps the historical period, the forecast horizon, the segmentation dimensions, and the countries covered, alongside the underlying primary and qualitative methodology.
Historical Period
2020 to 2025
Forecast Period
2026 to 2036
Base Year
2025 (USD billions; MMA Primary Research Dataset, September 2026)
Market Definition
This report covers enterprise video platforms and services by function class: retention governance and discovery controls, live streaming and virtual event platforms, video content management and portals, accessibility and transcription services, video analytics and engagement measurement, and secure external video distribution. It excludes consumer video services, conferencing endpoints and room hardware, video surveillance, media production and broadcast software, and content delivery infrastructure sold by capacity.
Quantitative Units
USD millions, platform and service revenue basis; recorded hours managed; playback rates as a percentage; retention periods in years; discovery review cost per recorded hour; storage accumulation per employee in gigabytes.
Segmentation Dimensions
Function class; end-use organisation type; commercial purchase and delivery route; geography across seven regions.
Regions Covered
North America, Western Europe, East Asia, South Asia and Pacific, Latin America, Middle East and Africa, Eastern Europe
Countries Covered
China, Japan, South Korea, India, Indonesia, Singapore, Australia, United States, Canada, Mexico, Brazil, Colombia, United Kingdom, Germany, France, Netherlands, Sweden, Poland, United Arab Emirates, South Africa.
Key Companies Profiled
Microsoft, Zoom, Cisco, Google, Kaltura, Vimeo, Brightcove, Panopto, Vbrick, Qumu, Haivision, ON24, Vidyard, Verbit, 3Play Media.
Quantitative Methodology
Primary survey, n=3,800 respondents, Q4 2025, six countries; demand-side model with trade association cross-validation
Qualitative Methodology
47 expert interviews, Q4 2025; applied to validate demand model assumptions, identify emerging dynamics, and assess competitive positioning
Report Format
PDF and XLSX data workbook (Word format preview document)
Publisher
Market Minds Advisory
Report Code
MMA-2026-TEC-871
Published
September 2026
Contact
sales@marketmindsadvisory.com | www.marketmindsadvisory.com

Purchase the full Enterprise Video Market Report (2026 to 2036).

This report sizes the global enterprise video market from 2026 to 2036 across six function classes, six organisation types and seven regions. It explains why around 9% of recorded meetings are ever opened again and why the accumulated material is a discoverable liability rather than any content asset. Discovery review at roughly 340 dollars per recorded hour is analysed as the number that actually sells governance software. Meeting platform absorption behind 52% concentration is examined as the permanent constraint on specialist vendors. Regional analysis explains why East Asia leads at 27% of spending.
Six function classes sized through to 2036
Playback rates quantified against accumulation and storage growth
Discovery review cost assessed as the governance purchase driver
Twenty named vendors assessed on platform revenue
Four revenue levers with quantified commercial impact
Anonymised professional services governance engagement documented in full

Built For The People Who Decide

From boardroom strategy to bench-side execution, this report is read cover-to-cover by leaders shaping the next decade of their industry, turning demand scenarios, market dynamics and valuation benchmarks into decisions.
CXOs/ Presidents/ VPs/ Managers
M&A and Corporate Development
Strategy Teams and R&D Heads
Procurement and Product Directors
Regulatory and Compliance Leaders
Investor Relations and Equity Analysts