Market Minds Advisory
Enterprise Manufacturing Intelligence Market

Enterprise Manufacturing Intelligence Market: Enterprise Manufacturing Intelligence Market. Real-Time Shop Floor Data Converges Into Unified Decision Platforms

Factory operators are replacing spreadsheet-driven production reporting with real-time analytics platforms that pull machine, quality, and workforce data into a single unified decision layer for global plant management teams worldwide.

Lead Analyst

Published

September 2026

Make Smarter Decisions with Customized Research Insights

Request a free sample report and evaluate market opportunities, growth trends, and competitive dynamics relevant to your business needs.

2025 MARKET VALUE$6.8BMarket Size 2025
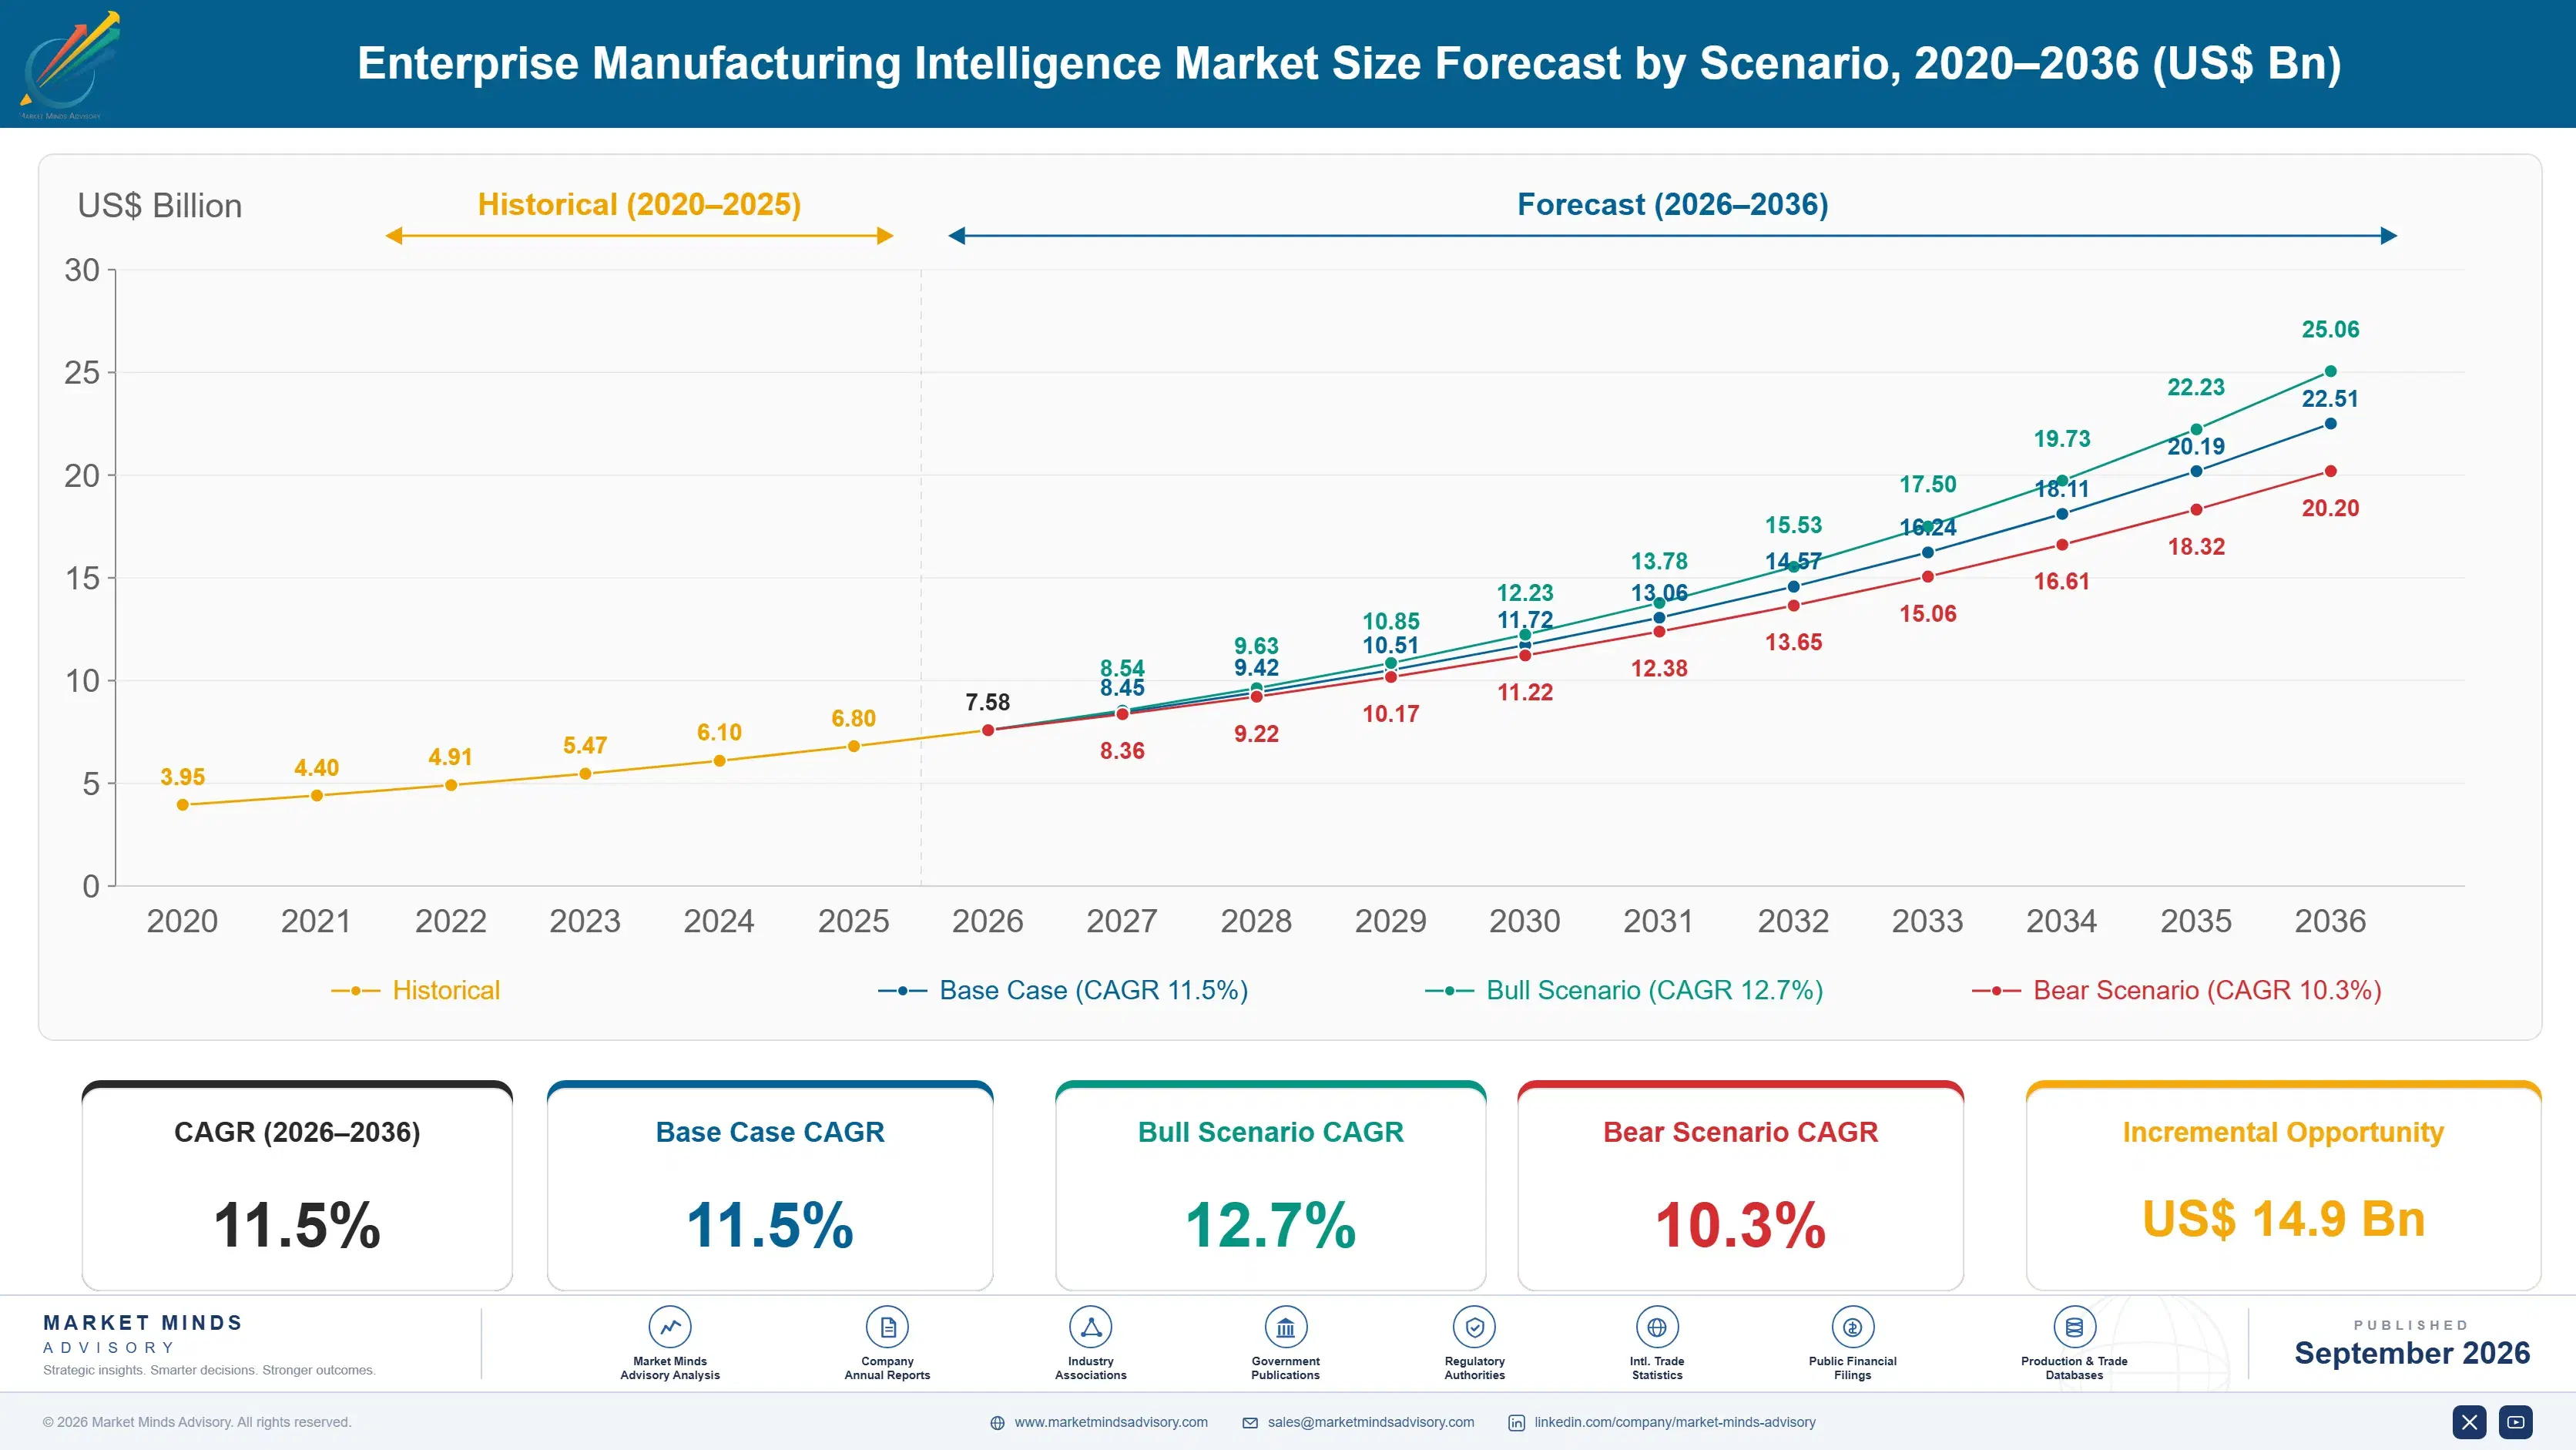
2036 FORECAST VALUE$22.5BBase Case , 2026 to 2036
CAGR 2026 TO 203611.5 %Bull 12.7% / Bear 10.3%
INCREMENTAL OPPORTUNITY$14.9BNet 10- year value creation
EXPANSION MULTIPLE2.97x2036 value over 2026 base
Strategic Levers
M&A Pipeline
Regional Outlook
Country Rankings
Competitive Intelligence
Segmental Deep-dive
Call-Us : 91 93563 13602

Executive Snapshot and Market Trajectory.

Factory operators are converging machine telemetry, quality inspection, and workforce scheduling data into unified analytics platforms, replacing the fragmented spreadsheet and standalone dashboard reporting that plant managers relied on for decades of production tracking across multiple shifts, facilities, regional operating units, and outdated legacy reporting systems everywhere worldwide.
Predictive maintenance and quality defect analytics still anchor the fastest-growing platform adoption, but energy and sustainability analytics are pulling installed base growth steadily as regulatory reporting requirements make automated data capture increasingly preferable to manual utility tracking across most large manufacturing operators and their multi-plant networks worldwide and across export-oriented supply chains facing tightening compliance deadlines, investor scrutiny, and demanding customer sustainability audits each fiscal year.
Competitive intensity concentrates around integration breadth across legacy programmable logic controllers and modern sensor networks rather than dashboard visualization polish alone, as vendors race to certify connectors across the widest possible set of plant floor equipment ahead of committee decisions spanning several manufacturing sites, equipment vintages, and regional automation standards. This pressure is pushing smaller analytics specialists lacking integration budgets toward consolidation or a full category exit within a few years.
Market Definition
The enterprise manufacturing intelligence market covers software platforms that aggregate, analyze, and visualize real-time production, quality, and workforce data from factory floor equipment and systems for plant and enterprise decision-making. It excludes full manufacturing execution system suites, enterprise resource planning software, and standalone industrial automation hardware sold separately from analytics software.
Base Year Value
$6.8B in 2025 (MMA Primary Research Dataset, September 2026)
Forecast Period
2026 to 2036, eleven discrete annual values
CAGR
11.5% base case. Bull 12.7%. Bear 10.3%.
Fastest Growth Segment
Predictive Maintenance Analytics: 16.0% CAGR
Fastest Growth Country
India: 14.5% CAGR
Fastest Growth Region
South Asia and Pacific: 13.5% CAGR
Largest Region
East Asia: 29% of 2025 global value
Market Leaders
PTC, Rockwell Automation, Siemens, AVEVA, and Tulip Interfaces lead the competitive landscape. Source: MMA Primary Research Dataset, July 2026.
Primary Survey
n=3,800 procurement and R&D decision-makers, Q4 2025, six countries
Methodology
Demand-side build-up, cross-validated against public data, 47 expert interviews

Enterprise Manufacturing Intelligence Market Forecast Scenarios

enterprise-manufacturing-intelligence-market-size-forecast-scenario-1790004974695
Between 2020 and 2025 enterprise manufacturing intelligence adoption progressed steadily as large manufacturers piloted point analytics solutions across individual plants, with enterprise-wide platform standardization entering the mainstream only toward the end of the period, producing a historical CAGR of 10.5 percent that understates the pace now underway as digital transformation programs mature across multi-plant networks.
The base case assumes three commercial mechanisms compound together: falling sensor and connectivity hardware costs make comprehensive plant floor data capture economically viable across mid-sized manufacturers, regulatory sustainability reporting requirements push automated data collection well ahead of manual utility tracking, and platform vendors increasingly expand integration breadth across legacy equipment rather than requiring costly hardware replacement before software deployment can begin across a customer's entire multi-plant facility and supplier network.
A bull scenario builds on accelerated regulatory sustainability reporting mandates that pull forward enterprise-wide platform standardization years ahead of current adoption timelines across major manufacturing economies, their supplier networks, and downstream customer requirements. The bear case centers on large enterprise software vendors bundling manufacturing intelligence modules free within existing ERP contracts, eroding independent platform vendor pricing power across mature accounts.

Integration Breadth Determines Enterprise Platform Selection

Enterprise buyers increasingly evaluate manufacturing intelligence platforms on legacy equipment connector breadth and implementation partner network strength before comparing dashboard visualization features directly, a shift that rewards vendors able to demonstrate proven integration across the widest range of plant floor equipment vintages simultaneously rather than a single flagship equipment generation alone across a customer's entire multi-site facility footprint, equipment inventory, and various regional operating standards.
MARKET CONCENTRATIONCR5 44%Top five vendors hold meaningfully fragmented but consolidating share
AVERAGE CONTRACT VALUE$340,000 per plantTypical annual subscription value per manufacturing facility deployment
TOP ADOPTING COUNTRY SHAREUnited States 24%Largest single-country base of enterprise platform deployments recorded
EQUIPMENT CONNECTOR COVERAGE220 protocolsAverage protocol count a leading platform supports across plant equipment
SUBSCRIPTION RENEWAL RATE88%Share of enterprise customers renewing platform subscriptions annually
IMPLEMENTATION SERVICES SHARE34%Portion of contract value tied to deployment and integration work
Automotive and electronics manufacturers favor platforms bundled with predictive maintenance and quality defect analytics modules, since standalone visualization dashboards alone rarely justify enterprise-wide procurement budgets without a clear return on investment case tied to downtime reduction or scrap rate improvement across multiple production lines, shift patterns, and quarterly reporting cycles simultaneously each fiscal year, budget planning window, and executive review meeting.
Platform development remains concentrated among a small number of vendors with deep industrial automation heritage, though rising demand from mid-sized manufacturers is pushing some smaller vendors toward specialized vertical niches that larger incumbents deprioritize given limited near-term deal volume and uncertain long-term account commitments, renewal cycles, expansion opportunities, and multi-year budget approval timelines across various procurement committees and stakeholders.
"Every vendor shows a beautiful dashboard in the demo. What separates winners is whether that dashboard still works after connecting to a fifteen-year-old programmable logic controller."
Senior Analyst, Industrial Software and Manufacturing Technology Practice · MMA Technology Practice · September 2026

Market Trends

AI-Driven Anomaly Detection Reshapes Maintenance Priorities

Manufacturing intelligence platforms increasingly bundle machine learning anomaly detection that flags developing equipment failures weeks before traditional threshold-based alerts would trigger, letting maintenance teams schedule repairs during planned downtime rather than responding to unplanned failures that halt entire production lines and cascade across dependent downstream processes and connected supplier operations. Vendors are responding by prioritizing predictive maintenance module development over general-purpose visualization dashboards, reallocating engineering resources toward the specific failure pattern recognition capabilities that plant managers increasingly demand before committing to a multi-year platform contract across their full facility network this year.
Market Impact: Cuts sensor deployment cost 24 percent
Sustainability Reporting Mandates Accelerate Data Automation

Expanding corporate sustainability disclosure requirements are pushing manufacturers to automate energy and emissions data capture rather than relying on manual utility bill reconciliation that most finance and sustainability teams previously used to compile annual reports across multiple facilities, reporting jurisdictions, and increasingly complex international regulatory frameworks worldwide today and going forward. Manufacturing intelligence vendors are responding by expanding energy analytics modules that integrate directly with existing production data streams, letting customers generate compliance-ready reporting without maintaining a separate parallel data collection process across their sustainability and finance teams simultaneously each fiscal quarter.
Market Impact: Cuts administrative workload by 31 percent

Market Opportunities and Growth Drivers

Falling Sensor Costs Widen Small Plant Adoption

Industrial sensor and wireless connectivity hardware prices have declined steadily as broader IoT device manufacturing scale improved across the shared component supply chain that manufacturing intelligence hardware makers also draw from for their own gateway and sensor products and edge computing devices. Mid-sized manufacturers who previously viewed comprehensive plant floor data capture as prohibitively expensive now specify sensor retrofits as standard equipment on new analytics deployments, since the marginal cost premium over partial instrumentation has narrowed considerably against the operational visibility gains data capture delivers across production, quality, and maintenance teams simultaneously.
Market Impact: Adds 4 to 8 months delay

Labor Shortages Push Automated Data Capture Adoption

Persistent skilled labor shortages across manufacturing operations are pushing plant managers to automate data collection and reporting tasks that previously required dedicated staff to manually record production metrics on paper forms or standalone spreadsheets throughout each shift and across multiple production lines, facility locations, and quarterly reporting periods across most regions nationwide. Manufacturers report meaningfully reduced administrative burden on production supervisors when automated platforms replace manual data entry, freeing supervisory staff to focus on process improvement rather than routine reporting tasks across their limited available workforce and shrinking talent pipeline nationwide.
Market Impact: Slows adoption 15 to 20 percent

Market Restraints and Challenges

Legacy Equipment Integration Complexity Slows Deployment

Many manufacturing plants still operate programmable logic controllers and equipment installed decades ago using proprietary communication protocols that require custom integration work before a modern analytics platform can capture usable data, extending deployment timelines well beyond what vendors quote initially. The root cause is that equipment manufacturers historically had little incentive to standardize communication protocols across competing product lines, leaving plant floors with a fragmented mix of proprietary interfaces that no single connector library fully covers. Vendors are responding by building larger protocol libraries and partnering with systems integrators who specialize in legacy equipment retrofits to shorten deployment timelines.
Market Impact: Covers 33 percent of new deployments

Data Governance Concerns Slow Cloud Platform Adoption

Manufacturers in regulated industries and those protecting proprietary process knowledge remain cautious about sending production data to cloud-hosted analytics platforms, slowing adoption among customers who would otherwise value the reduced infrastructure burden that cloud deployment offers over on-premises alternatives. The underlying constraint is that production data often reveals proprietary process parameters that competitors could exploit if compromised, making data governance a board-level concern rather than a purely technical decision left to IT departments alone. Some vendors now offer hybrid deployment models keeping sensitive process data on-premises while cloud-hosting less sensitive analytics workloads.
Market Impact: Lifts automated reporting adoption 27 percent
3 additional market trends, 4 additional growth drivers, and 2 additional restraints and challenges are covered in the full report. Contact sales@marketmindsadvisory.com to access the complete intelligence.

Segment CAGR and Growth Architecture

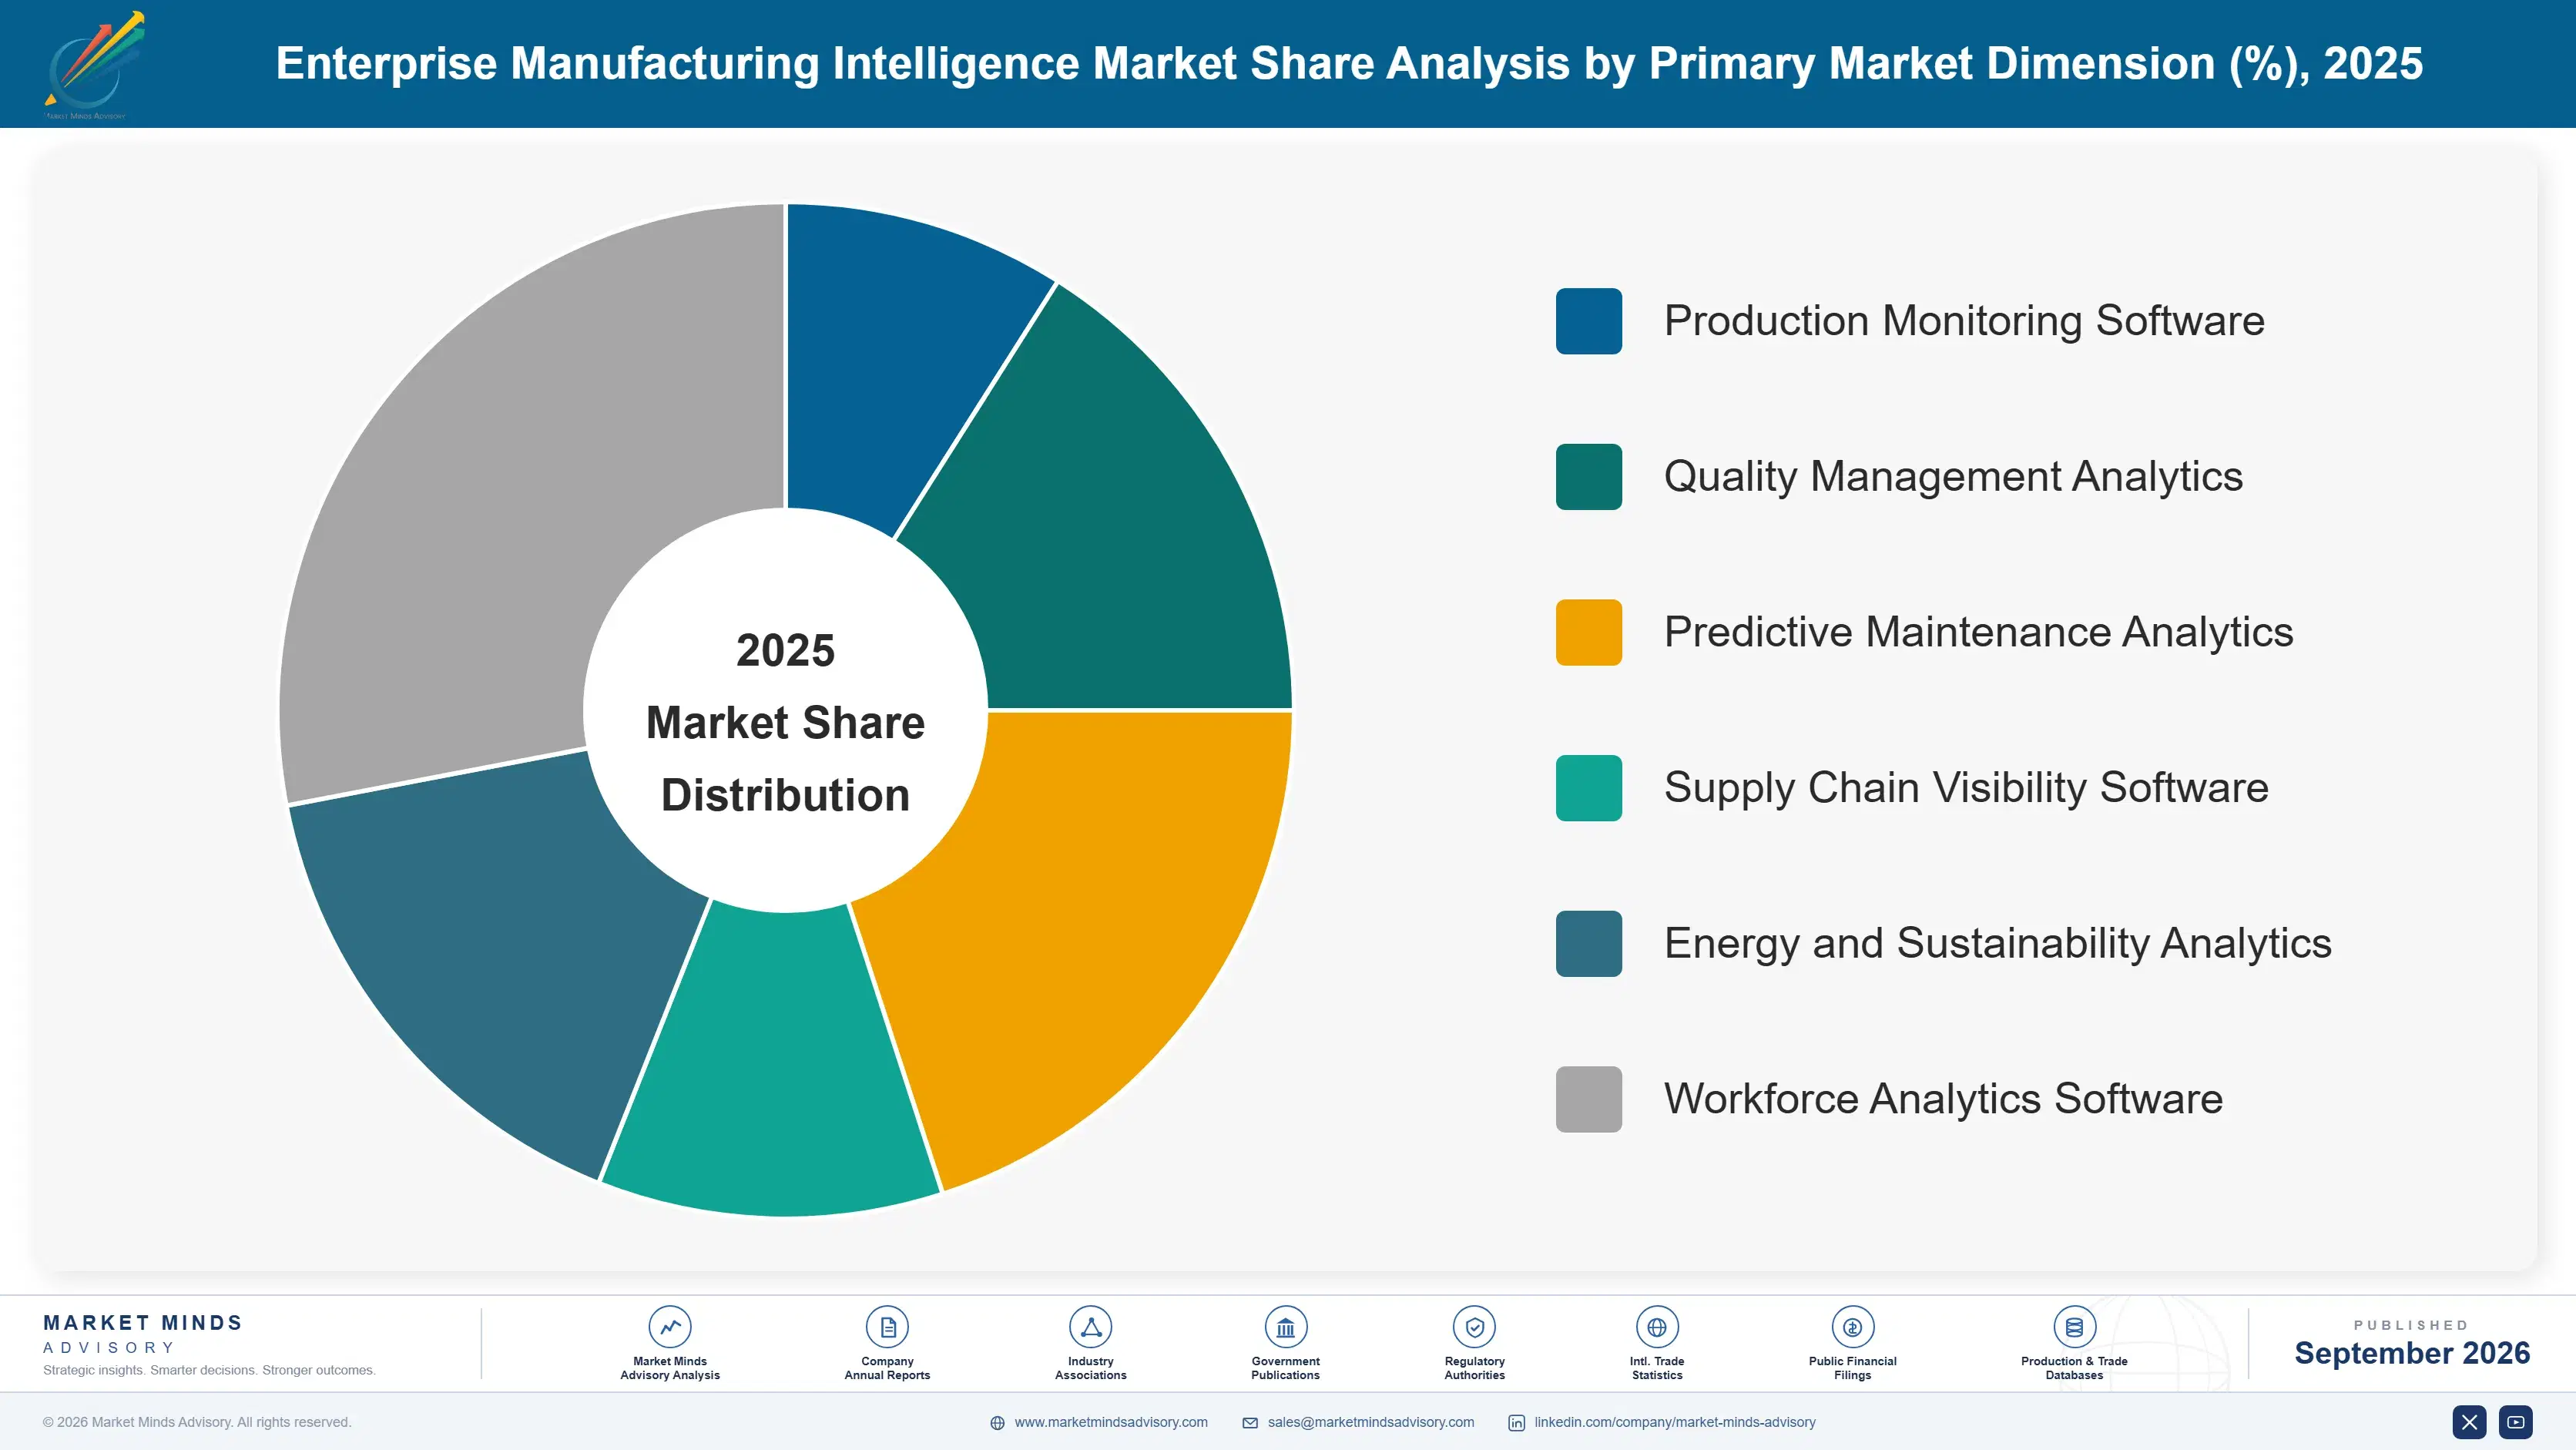
Six application segments define enterprise manufacturing intelligence demand, spanning production monitoring, quality management, predictive maintenance, supply chain visibility, energy analytics, and workforce analytics across enterprise and mid-sized manufacturers worldwide and their extended supplier networks and logistics partners today. Predictive maintenance now grows fastest as machine learning anomaly detection matures across most production equipment categories.
enterprise-manufacturing-intelligence-market-market-share-analysis-1790004975265

Predictive Maintenance Analytics

Manufacturers are deploying machine learning models trained on vibration, temperature, and acoustic sensor data to flag developing equipment failures weeks before traditional threshold-based alerts would trigger, letting maintenance teams schedule repairs during planned downtime windows rather than responding reactively to unplanned production line failures that halt entire facilities and cascade across downstream operations and connected supplier deliveries. Automotive and heavy industrial manufacturers anchor much of the current licensing volume, given the severe cost of unplanned downtime across their high-throughput production lines and tightly coupled supply chains. Mid-sized manufacturers increasingly contribute meaningful growth as sensor and platform costs decline enough to justify deployment beyond only the largest enterprise accounts and flagship facilities.
CAGR 16.0%

Quality Management and Defect Analytics

Manufacturers are integrating computer vision defect detection directly into production line analytics platforms, letting quality teams identify defect patterns and root causes in real time rather than discovering problems during downstream final inspection stages when correction costs are substantially higher and rework volumes accumulate across the production line, warehouse operations, and final shipping preparation processes. Electronics and automotive component manufacturers anchor much of the current demand, given their tight tolerance requirements and the severe cost of shipping defective products to downstream customers. Consumer packaged goods manufacturers increasingly contribute growth as computer vision hardware costs decline enough to justify deployment across lower-margin production lines previously considered uneconomical for this advanced technology.
CAGR 14.2%
Full segment breakdown across 6 segments available in the complete report.

Regional Architecture and Country Demand Map

East Asia leads global enterprise manufacturing intelligence demand, anchored by the world's largest concentration of factory floor deployments across China, Japan, and South Korea's manufacturing base and supply chain nationwide, well ahead of a fast-growing North American enterprise software adoption and digital transformation investment base.

East Asia

Manufacturing base concentration gives this region the largest raw count of factory floor deployments anywhere globally, with China anchoring the bulk of regional adoption across its dense cluster of electronics and automotive assembly operations pursuing government-backed smart manufacturing modernization programs. Japan contributes substantial licensing revenue tied to its established precision manufacturing sector, where predictive maintenance adoption runs particularly deep given aging equipment fleets and persistent skilled labor shortages. South Korea's semiconductor and electronics manufacturers increasingly specify comprehensive analytics platforms as standard equipment across new production line investments, reinforcing the region's overall adoption depth. Taiwan's electronics contract manufacturers also drive meaningful regional demand tied to their high-mix, high-precision production environments requiring granular quality analytics.
Share: 29% | CAGR: 12.5% (2026 to 2036)

North America

Enterprise software procurement sophistication anchors regional demand, with large manufacturers here typically running more mature digital transformation programs than peer regions given earlier enterprise resource planning modernization investment across their operations. The United States leads regional licensing volume, driven by automotive, aerospace, and electronics manufacturers pursuing predictive maintenance and quality analytics to offset persistent skilled labor shortages across their production workforce. Canada contributes a smaller but steady secondary demand base tied to its automotive parts and industrial equipment manufacturing sector operating in close coordination with United States supply chains. Mexico's growing role as a nearshoring manufacturing hub is also pulling incremental regional licensing volume from multinational customers extending existing analytics contracts.
Share: 27% | CAGR: 12.3% (2026 to 2036)
Regional intelligence for 5 additional markets available in the complete report: Western Europe, South Asia and Pacific, Latin America, Middle East and Africa, Eastern Europe. Contact sales@marketmindsadvisory.com.
enterprise-manufacturing-intelligence-market-country-cagr-analysis-1790004975796

Converting Plant Deployments Into Enterprise Contracts

Vendors capture the largest share of long-term value by bundling core platforms with predictive analytics modules, implementation services, and multi-plant expansion agreements that convert single-site pilots into enterprise-wide subscription relationships spanning a customer's entire facility network, broader supplier base, multi-year digital transformation roadmap, and its own recurring annual budget planning and contract renewal cycle.

Bundle Predictive Maintenance Modules With Core Platform

Vendors increasingly attach predictive maintenance analytics modules to core visualization platform subscriptions, converting a base licensing agreement into a higher-value recurring relationship that captures meaningfully more revenue per facility than dashboard access alone would generate across a typical multi-year contract term and its subsequent renewal cycle. Customers gain measurable downtime reduction that justifies the module's incremental cost, while vendors capture margin that platform price competition alone increasingly compresses across standard visualization tiers. Roughly 36 percent of enterprise customers now attach at least one advanced analytics module to their base platform subscription.
Market Impact: Adds roughly 24 percent recurring module revenue overall

Offer Multi-Plant Expansion and Rollout Support

Vendors bundling structured multi-plant rollout support with initial single-site deployments capture ongoing implementation service revenue, worth roughly 20 percent of total contract value, as customers extend successful pilots across their broader facility network, avoiding a costly renegotiation each time a customer plans an expansion to a new manufacturing site or region. This approach appeals particularly to customers running large multi-site operations, where a proven rollout methodology meaningfully reduces deployment risk and internal change management burden across the entire organization. Vendors report significantly higher expansion rates among enrolled customers each year.
Market Impact: Lifts multi-site expansion rates by 28 percent overall

Sell Custom Integration Services for Legacy Equipment

Vendors with deep legacy equipment integration expertise increasingly offer custom connector development services to customers operating equipment outside their standard protocol library, capturing meaningfully higher margins, often 25 percent above standard rates, than standard subscription licensing alone since customers pay a premium for engineering time dedicated specifically to their unique equipment inventory and overall plant configuration needs, constraints, and legacy vintage. This service layer also builds a valuable feedback loop, since custom connectors developed for one customer frequently expand the vendor's standard library for future prospects across similar equipment types.
Market Impact: Generates roughly 21 percent incremental service margin overall

Monetize Cross-Plant Benchmarking and Analytics Data

Vendors with large multi-customer installed bases increasingly package anonymized cross-plant performance benchmarking data into secondary analytics products sold to customers seeking to compare their operational metrics against comparable industry peers, facility types, and production environments across their broader competitive set. This data layer requires minimal incremental cost to produce once the underlying platform infrastructure already exists, making it disproportionately profitable relative to standard subscription margins that rarely exceed 28 percent across the category. Early movers in this space are building data moats that later entrants will find increasingly difficult to replicate.
Market Impact: Generates roughly 15 percent incremental margin each year

Who Controls the Margin Pool

The enterprise manufacturing intelligence market carries a CR5 of 44 percent, leaving meaningful room for specialized analytics vendors to compete alongside the largest industrial automation incumbents across most application segments and geographies simultaneously. PTC and Rockwell Automation's industrial software platform scale and existing customer relationships separate them clearly from the next tier of challengers, most of whom compete on specialized vertical niches rather than broad platform competition.
Current competitive activity centers on legacy equipment integration breadth and predictive maintenance model accuracy races, as vendors work to certify connectors across the widest possible set of plant floor equipment ahead of enterprise buyers committing to a single platform for a multi-year digital transformation program. Several vendors have also begun bundling multi-plant rollout support and custom integration services to lock in customers beyond the initial single-site deployment.

Rankings are most likely to shift as large enterprise software vendors expand manufacturing intelligence modules within existing ERP contracts, favoring vendors who differentiate clearly on integration depth over those competing primarily on visualization polish. Smaller specialists focused narrowly on single-application analytics face rising pressure from platform vendors extending coverage across adjacent use cases, threatening the niche positioning several mid-tier vendors have relied on for years.
enterprise-manufacturing-intelligence-market-company-positioning-matrix-1790004976319

Competitive Moat and Risk Dimensions

PTC

Moat: Industrial IoT platform breadth

PTC's ThingWorx industrial IoT platform gives it design-in relationships across a wide range of equipment manufacturers and system integrators that competitors offering narrower point solutions struggle to replicate, letting the company bundle manufacturing intelligence into broader multi-year IoT and product lifecycle management subscription agreements across its enterprise customer base.
PTC

Risk: Slower specialty niche response

PTC's broad platform focus makes it comparatively slower to respond to highly specialized vertical analytics requirements, where smaller focused vendors move faster on custom module development and industry-specific configurations tailored to narrower manufacturing use cases, technical requirements, and very specific individual customer segment needs and preferences.
ROCKWELL AUTOMATION

Moat: Installed automation base depth

Rockwell's massive installed base of programmable logic controllers and industrial automation hardware across North American manufacturing gives it a natural integration advantage that software-only competitors lack, letting the company bundle analytics directly into existing hardware refresh and service contracts that customers already plan around Rockwell equipment.
ROCKWELL AUTOMATION

Risk: Regional concentration exposure

Rockwell's installed base concentration in North America leaves it more exposed to regional manufacturing investment cycles than globally diversified competitors, and its hardware-centric heritage sometimes puts it at a disadvantage competing for software-first customers evaluating platform-agnostic analytics vendors across multiple hardware platforms and equipment vendors.

Players Tracked

Prominent Players

PTC Inc
Rockwell Automation Inc
Siemens AG
AVEVA Group plc
Tulip Interfaces Inc

Other Key Players

Sight Machine Inc
Seeq Corporation
MachineMetrics Inc
Braincube SAS
Cognite AS
Uptake Technologies Inc
Falkonry Inc
Litmus Automation Inc
Parsec Automation Corp
Critical Manufacturing SA
Inductive Automation LLC
Element Analytics Inc
Instrumental Inc
L2L Inc
Datch Systems Inc

Recent Developments

JULY 2025

PTC launches AI-powered manufacturing intelligence module

PTC announced a new AI-powered manufacturing intelligence module integrating predictive maintenance and quality defect analytics directly into its ThingWorx platform, targeting enterprise customers seeking unified analytics across production, quality, and equipment health data streams within a single consolidated subscription package for their entire facility network.
Signal: Signals platform vendors steadily consolidating previously separate analytics modules into unified integrated offerings for enterprise customers
MARCH 2025

Rockwell Automation acquires manufacturing analytics startup

Rockwell Automation acquired a manufacturing analytics startup specializing in computer vision quality inspection, strengthening its FactoryTalk platform portfolio for automotive and electronics customers seeking integrated defect detection alongside existing production monitoring and predictive maintenance capabilities across their broader multi-plant facility networks and existing supplier relationships nationwide.
Signal: Signals continued consolidation among the industry's most established global industrial automation and analytics software vendors worldwide
OCTOBER 2025

Siemens signs analytics partnership with major automaker

Siemens entered into a supply agreement with a major automaker to deploy its manufacturing intelligence platform across the customer's full global facility network, extending its existing automation hardware relationship into a broader multi-year enterprise analytics subscription covering dozens of production sites worldwide and their supply chains.
Signal: Signals hardware incumbents steadily expanding further into enterprise-wide analytics subscription revenue streams and support services overall

Cloud Infrastructure and Engineering Talent Exposure

Cloud hosting and compute infrastructure, alongside senior data engineering and machine learning talent, together represent roughly 52 percent of manufacturing intelligence vendor cost of goods sold, concentrated primarily across the United States, Western Europe, and increasingly India's growing engineering talent pool and technology outsourcing hubs spread across major metro centers and emerging technology corridors nationwide.
Cloud infrastructure pricing spiked meaningfully during 2025 as demand for GPU compute capacity surged across AI training and inference workloads simultaneously, a trend company annual reports linked to broader data center capacity constraints affecting multiple industries at once worldwide and across several regions and hyperscale provider zones, forcing several vendors to absorb higher hosting costs for two consecutive fiscal quarters rather than pass the full increase through to enterprise customers mid-contract.

Smaller vendors without long-term cloud provider agreements face the sharpest cost pressure during these episodes, since they lack the purchasing volume to secure priority compute allocation during capacity shortages. Larger vendors with multi-year hosting contracts and diversified cloud provider relationships weather these episodes with comparatively minor disruption to platform performance and existing customer service level commitments across their subscriber base.
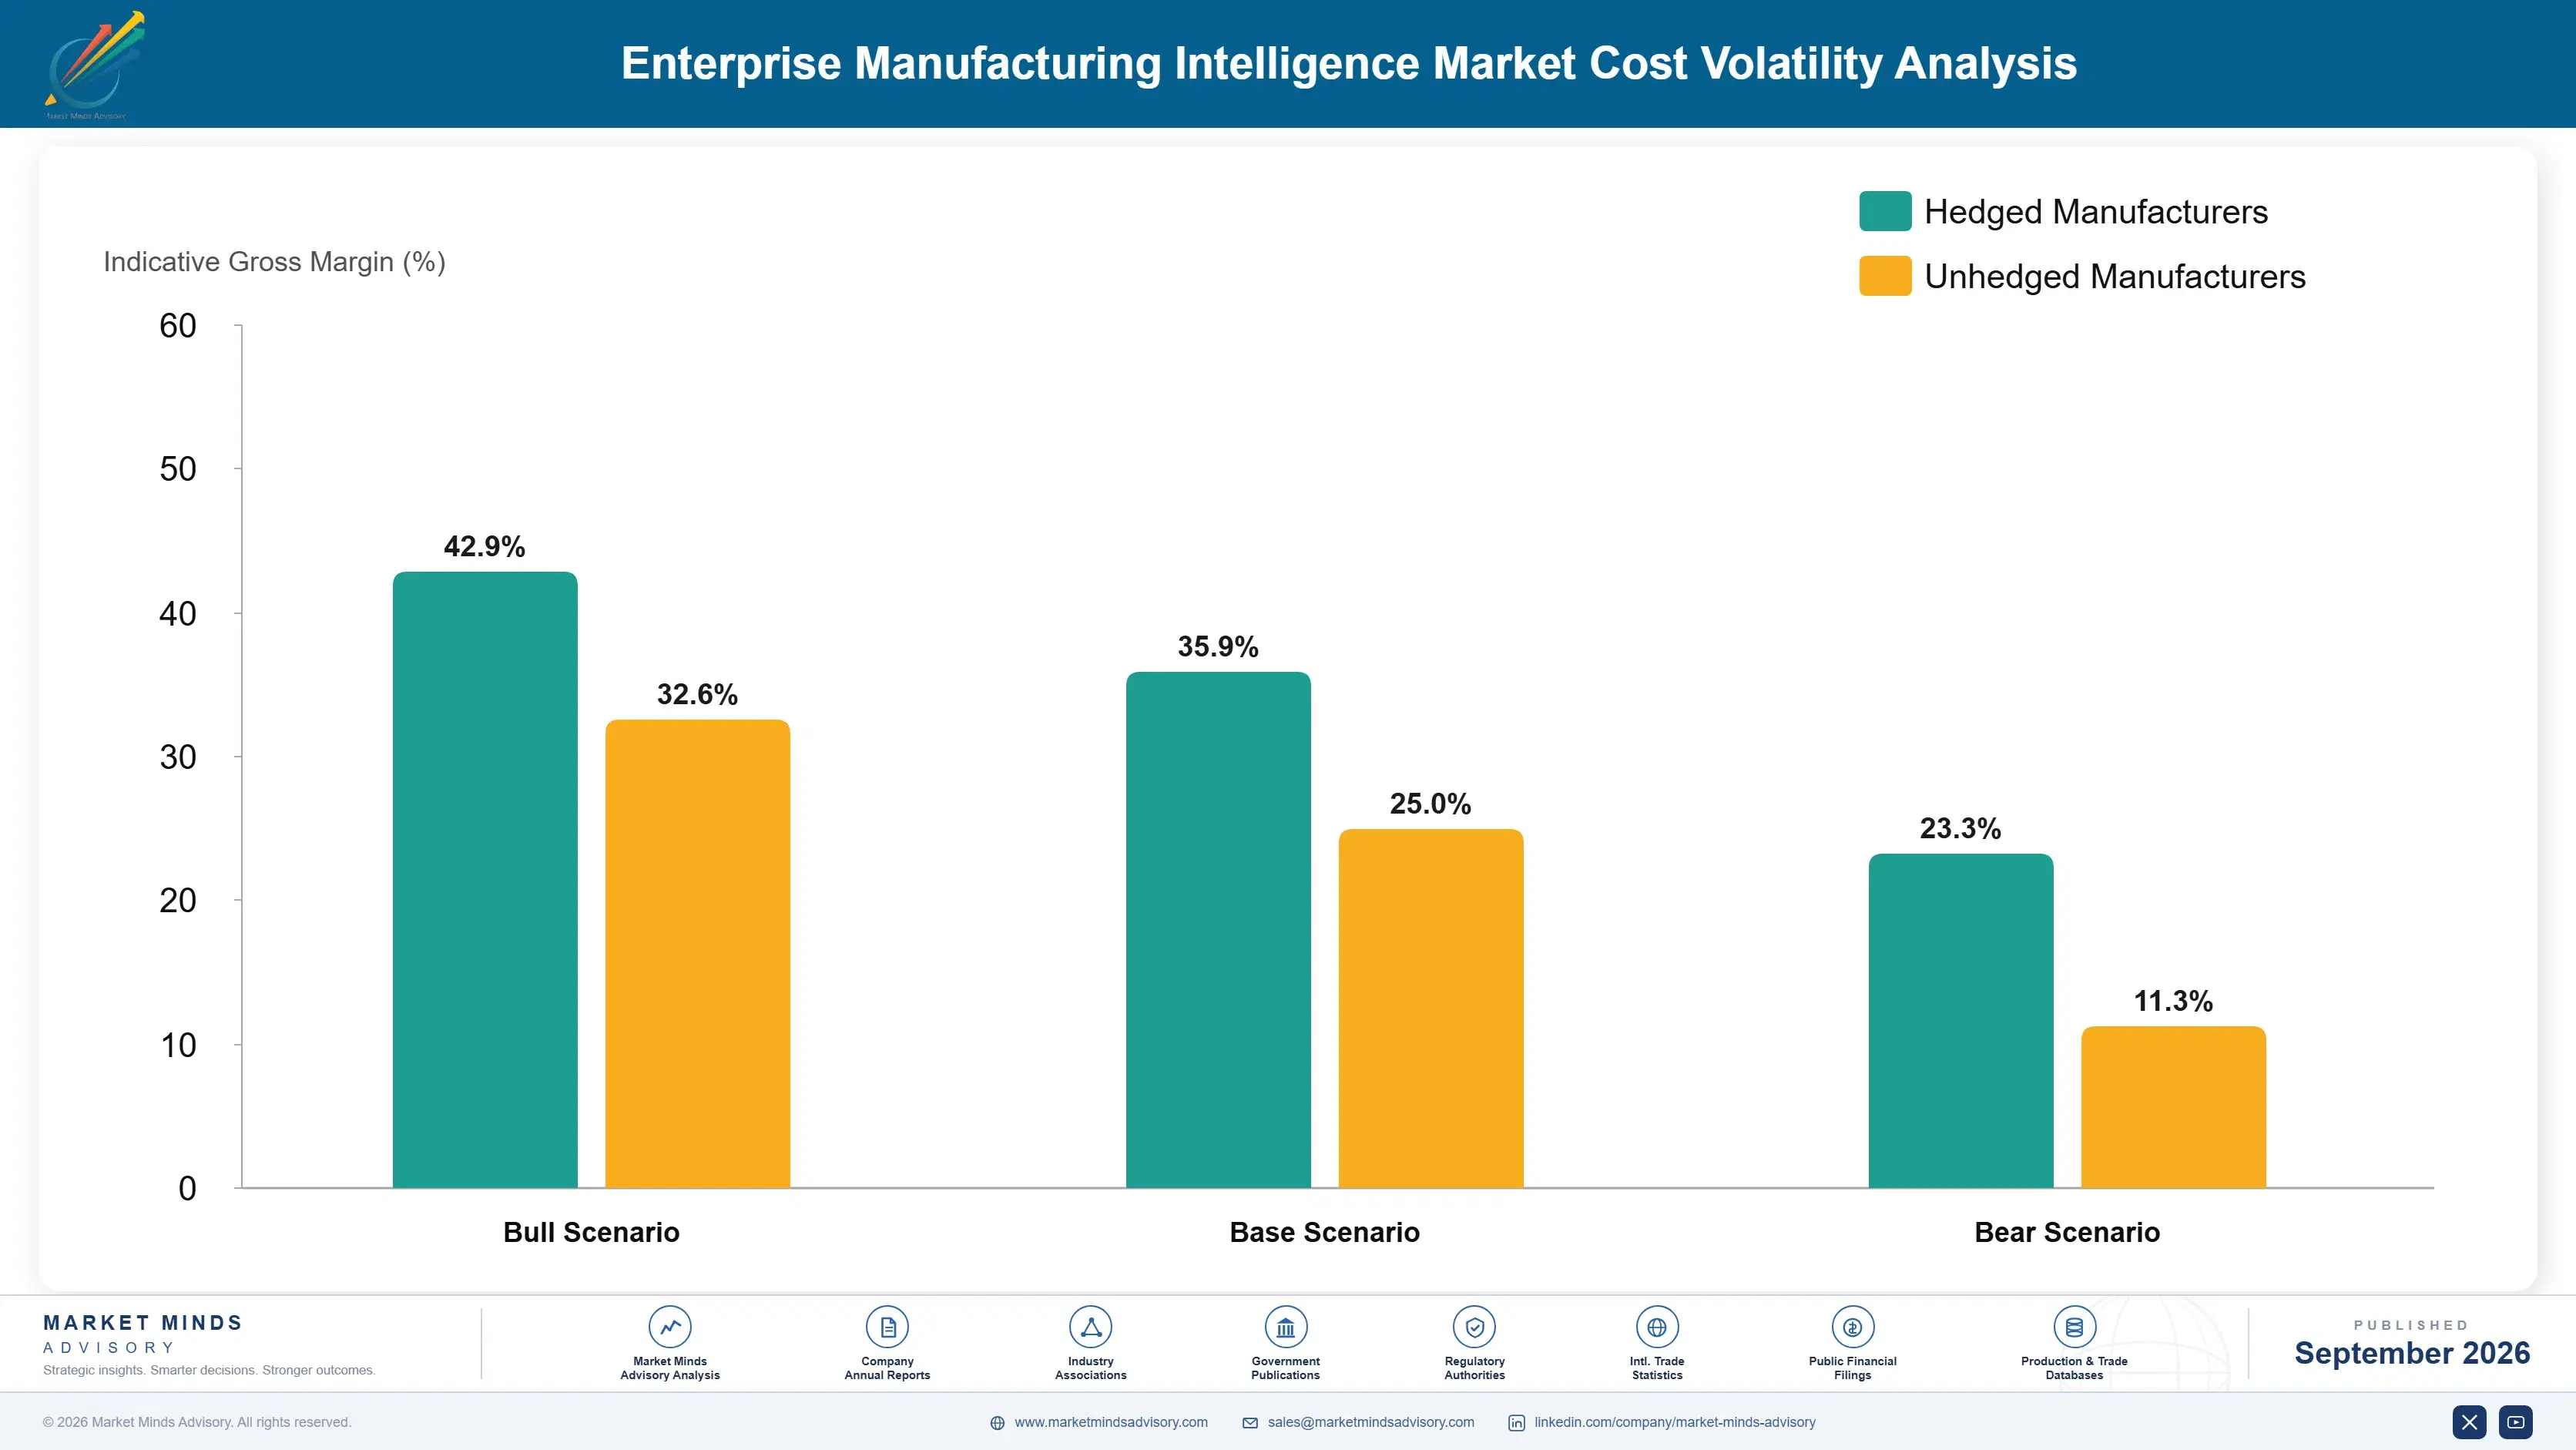
enterprise-manufacturing-intelligence-market-cost-volatility-analysis-1790004976523

Diversify cloud infrastructure provider relationships

Several vendors are qualifying alternative cloud infrastructure providers beyond a single primary vendor relationship, reducing exposure to future capacity disruptions tied to a concentrated set of hyperscale compute providers and shortening emergency capacity procurement timelines across regions and infrastructure zones during periods of tight availability affecting the broader technology industry and its supply chain.

Expand engineering talent pipelines in India

Larger vendors increasingly invest in expanding data engineering and machine learning talent pipelines across India and other lower-cost markets, reducing exposure to compensation inflation concentrated in the United States and Western Europe while building broader long-term engineering capacity, hiring pipelines, and structured retention programs supporting future headcount growth, organizational stability, and product delivery consistency.

Negotiate multi-year cloud hosting agreements

Vendors are increasingly locking in multi-year fixed-price cloud hosting agreements with key infrastructure providers, trading some near-term flexibility for predictable infrastructure cost planning across multi-year customer subscription commitments and internal margin forecasts spanning several fiscal years, product roadmap cycles, and broader organizational headcount planning decisions across every business department, regional office, and engineering team.

Portfolio Architecture for Margin Defence

Three tiers structure the enterprise manufacturing intelligence market, separating volume-oriented single-plant visualization from premium multi-plant analytics platforms carrying predictive maintenance and quality certification value. Gross margin ranges span roughly twenty points between the volume tier and the certified premium tier, reflecting how much value enterprise buyers place on legacy equipment integration breadth and advanced analytics capability across their full facility network and downstream applications.
Volume-tier subscriptions still dominate deployment counts across single-plant pilots and mid-sized manufacturer accounts, but premium multi-plant and predictive analytics platforms capture a disproportionate share of vendor profit pools because large enterprise buyers pay materially more for proven reliability and integration breadth across their full facility network. This tension shapes vendor product roadmaps directly, pushing established players toward higher-margin enterprise platforms and away from single-plant licensing alone as competition intensifies.

High-value margin pools concentrate specifically around predictive maintenance modules bundled with implementation and rollout support subscriptions, since large enterprise buyers increasingly value the recurring analytics and expansion assistance these platforms generate over simple visualization dashboard access alone, a pattern accelerating as facility counts under management grow across multiple manufacturing verticals and geographic regions worldwide.

Volume / Commodity-Adjacent Tier

Standard single-plant visualization and production monitoring platforms sold largely on price and delivery speed against established regional competitors across mid-sized manufacturer accounts and secondary procurement channels open to smaller buyers.
Gross Margin: 26 to 34%

Premium / Certified Tier

Multi-plant predictive maintenance and quality analytics platforms commanding materially higher prices from large enterprise buyers requiring guaranteed integration breadth and proven reliability across complex facility networks and multi-year digital transformation programs.
Gross Margin: 42 to 50%

Sustainability / Regulatory / Next-Generation Tier

Energy and emissions analytics platforms aligned to emerging corporate sustainability disclosure mandates and long-term regulatory compliance reporting targets across large multi-plant manufacturing operator groups, their subsidiaries, and broader supply chains.
Gross Margin: 46 to 55%
enterprise-manufacturing-intelligence-market-portfolio-architecture-1790004977029

High-value Sub-segments and Strategic Watch-out

Predictive Maintenance and AI Analytics

Combines the fastest unit growth with the richest margin profile as large manufacturers pair core platforms with machine learning subscriptions, creating durable recurring revenue streams beyond the initial licensing fee itself across expanding multi-plant deployment programs and successive facility rollouts worldwide throughout the forecast decade.
Gross Margin: 48 to 56%

Quality and Defect Detection Analytics

Commands strong margins from electronics and automotive manufacturers seeking certified defect detection across regulated quality standards, though growth trails the fastest predictive maintenance segment by a moderate but consistent margin across most procurement cycles and annual budget approval timelines nationwide and across several export-oriented markets.
Gross Margin: 40 to 48%

Standard Single-Plant Visualization Platforms

Remains the volume core of the market, anchoring subscription counts across routine single-plant deployments even as margin pressure intensifies steadily from regional low-cost competitors expanding aggressively into adjacent mid-market accounts and secondary procurement channels across multiple continents and several fast-growing emerging manufacturing economies worldwide today.
Gross Margin: 26 to 33%

Legacy Spreadsheet Reporting Replacement

Warrants close monitoring as manual spreadsheet-based production reporting continues declining gradually, creating a swing factor that could either sustain volume-tier demand or accelerate migration toward integrated platforms entirely across the customer base over the coming several forecast years and its multi-year budget planning cycles ahead.
Gross Margin: 22 to 29%

Platform Contracts as Recurring Infrastructure

Manufacturing intelligence platforms increasingly function as long-lived enterprise infrastructure rather than one-time software purchases, generating recurring subscription, module, and eventual multi-plant expansion revenue across a typical five to eight year customer relationship. Enterprise customers rarely swap platform vendors mid-contract given the integration cost of retraining plant staff and reconfiguring connector libraries, giving incumbent vendors durable annuity-like revenue once a platform is standardized across a facility network.
Adoption stickiness varies meaningfully by end-use vertical. Automotive and aerospace manufacturers exhibit the deepest lock-in given multi-year digital transformation programs and extensive legacy equipment integration work, while consumer packaged goods buyers switch more readily since their production lines carry lower integration complexity and shorter product cycles. Electronics manufacturers sit between these two, valuing proven reliability but retaining flexibility as new sensor and computer vision technologies create natural vendor re-evaluation points.

Buyer profiles are shifting generationally as manufacturing operations teams increasingly favor cloud-native platforms offering rapid deployment over legacy on-premises software requiring lengthy installation and configuration cycles. Younger plant management leadership entering manufacturing organizations expect the same intuitive interfaces and flexible commercial terms common across other enterprise software categories, gradually reshaping vendor selection criteria toward platforms bundling analytics support alongside core visualization capability.
enterprise-manufacturing-intelligence-market-end-use-penetration-index-1790004977541

Where Manufacturing Intelligence Value Concentrates

These are among the four positions where our research anticipates prominent divergence between winners and laggards over the coming forecast period. Each is grounded in the demand model, the regulatory perimeter, and the announced capacity pipeline.
01 / INTEGRATION BREADTH PRIORITY

Prioritize legacy equipment integration over visualization polish

Vendors still competing primarily on dashboard visualization features face compressing margins as regional low-cost competitors intensify price competition across standard single-plant deployments and mid-market accounts approaching contract renewal decisions. Reallocating engineering investment toward legacy equipment connector breadth captures the disproportionate profit pool tied to enterprise-wide platform standardization contracts now determining vendor selection across the most demanding customer segments and highest-value accounts. Firms that delay this shift risk ceding the highest-margin multi-plant contracts to faster-moving rivals within the next several years of the forecast window.
02 / CLOUD INFRASTRUCTURE RESILIENCE

Diversify cloud infrastructure providers and hosting agreements

Cloud infrastructure exposure remains concentrated among a small number of hyperscale providers, leaving vendors without diversified hosting relationships vulnerable during future capacity shortages tied to competing AI training and inference demand across multiple industries simultaneously and unpredictably. Securing multi-year fixed-price hosting contracts protects platform performance against the kind of cost compression seen during the 2025 pricing spike, when several vendors absorbed higher costs for two consecutive fiscal quarters rather than pass them through. This single step meaningfully reduces earnings volatility tied to infrastructure pricing swings ahead.
03 / GEOGRAPHIC MARKET PRIORITIZATION

Prioritize East Asia and India expansion investment

East Asia anchors regional volume through the world's largest concentration of factory floor deployments, while India's faster growth trajectory reflects an earlier stage of manufacturing digitalization investment across its expanding electronics and automotive component base and government incentive programs supporting domestic manufacturing capability. Vendors that establish local implementation partnerships or service centers in these regions gain meaningful cost and delivery advantages over competitors operating from more distant headquarters locations. This positioning matters increasingly as customers favor suppliers who can meet compressed deployment timelines reliably.
04 / RECURRING REVENUE MONETIZATION

Build recurring revenue through predictive analytics subscriptions

Bundling predictive maintenance modules with subscription-based implementation and rollout support creates a recurring revenue stream that base platform licensing alone cannot replicate across a vendor's installed customer base and multi-plant expansion programs spanning several years of ongoing customer relationship management. Vendors making this transition report materially stronger blended margins than peers still selling standard visualization access as a flat licensing fee, and several have begun restructuring sales compensation around module attachment rates. Building this capability now positions vendors ahead of the broader industry shift toward subscription-based analytics.

Engagement Snapshot From the Field

A live engagement with an industry participant carrying material or product regulatory and market exposure ahead of a defining policy shift, showing how our research translates into a defensible multi-year portfolio strategy.
MARKET MINDS ADVISORY · CLIENT ENGAGEMENT SUMMARY
Enterprise Manufacturing Intelligence Producer Strategic Portfolio Review and Transition Roadmap 2026·Investment Scenario on Enterprise Manufacturing Intelligence Exposure Evaluation 2025-26
CLIENT PROFILE
A multi-plant automotive component supplier operating twelve manufacturing facilities across North America approached MMA to evaluate consolidating fragmented plant-level reporting tools into a single enterprise manufacturing intelligence platform. The supplier's individual plants had adopted five different point analytics solutions over the prior decade, creating inconsistent reporting standards that complicated corporate-level performance benchmarking and executive decision-making.
STRATEGIC CHALLENGE
The supplier faced a choice between standardizing on a single enterprise platform vendor immediately across all twelve plants or pursuing a phased migration that would let individual plants retain existing tools until natural contract renewal dates. Internal teams disagreed on which approach better balanced near-term disruption risk against the corporate-level reporting consistency executives increasingly demanded.
MMA APPROACH
MMA conducted primary interviews with plant managers and corporate operations executives and benchmarked platform vendor integration capabilities against the supplier's diverse equipment inventory across all twelve facilities. The team modeled migration cost and disruption risk under three consolidation scenarios, drawing on comparable multi-plant standardization engagements across the broader automotive supplier industry.
KEY FINDINGS
  1. Roughly forty-five percent of existing plant-level analytics contracts were already approaching natural renewal within the following eighteen months across the entire network.
  2. A phased migration tied to existing contract renewal dates reduced disruption risk relative to immediate full-scale platform replacement (client-reported, unverified by MMA).
  3. Standardizing on a single platform vendor reduced projected total licensing and support costs by roughly seventeen percent compared to maintaining five separate vendor relationships (client-reported, unverified by MMA).
  4. Corporate-level reporting consistency improved measurably once at least half of the entire twelve-plant facility network had migrated onto the newly standardized platform.
CLIENT PROFILE
A multi-plant automotive component supplier operating twelve manufacturing facilities across North America approached MMA to evaluate consolidating fragmented plant-level reporting tools into a single enterprise manufacturing intelligence platform. The supplier's individual plants had adopted five different point analytics solutions over the prior decade, creating inconsistent reporting standards that complicated corporate-level performance benchmarking and executive decision-making.
STRATEGIC CHALLENGE
The supplier faced a choice between standardizing on a single enterprise platform vendor immediately across all twelve plants or pursuing a phased migration that would let individual plants retain existing tools until natural contract renewal dates. Internal teams disagreed on which approach better balanced near-term disruption risk against the corporate-level reporting consistency executives increasingly demanded.
MMA APPROACH
MMA conducted primary interviews with plant managers and corporate operations executives and benchmarked platform vendor integration capabilities against the supplier's diverse equipment inventory across all twelve facilities. The team modeled migration cost and disruption risk under three consolidation scenarios, drawing on comparable multi-plant standardization engagements across the broader automotive supplier industry.
KEY FINDINGS
  1. Roughly forty-five percent of existing plant-level analytics contracts were already approaching natural renewal within the following eighteen months across the entire network.
  2. A phased migration tied to existing contract renewal dates reduced disruption risk relative to immediate full-scale platform replacement (client-reported, unverified by MMA).
  3. Standardizing on a single platform vendor reduced projected total licensing and support costs by roughly seventeen percent compared to maintaining five separate vendor relationships (client-reported, unverified by MMA).
  4. Corporate-level reporting consistency improved measurably once at least half of the entire twelve-plant facility network had migrated onto the newly standardized platform.
RECOMMENDED STRATEGY
Phase 1: Phase one migrated the three plants with contracts nearest to natural renewal onto the newly standardized enterprise platform right away. Phase 2: Phase two extended migration to the remaining nine plants as their existing contracts reached renewal over the following two years. Phase 3: Phase three established a formal corporate governance process requiring future plant acquisitions to standardize on the platform immediately upon integration.
OUTCOME
The supplier adopted the phased migration approach, reporting a seventeen percent reduction in total licensing and support costs once the full facility network was standardized (client-reported, unverified by MMA). Corporate-level performance benchmarking became measurably more consistent within the first year of the entire migration program.

Frequently Asked Questions

Foundational context covering the market sizes, CAGR, scope, country, region and competition that inform every finding below. This section is provided to cover basics and most often pre-purchase conversations, answered from the MMA Primary Research Dataset.

What is the current size of the Enterprise Manufacturing Intelligence Market?

The enterprise manufacturing intelligence market reached an estimated 6.8 billion dollars globally in 2025. Growth reflects accelerating adoption of predictive maintenance and quality analytics platforms across manufacturers worldwide.

How large will the Enterprise Manufacturing Intelligence Market be by 2036?

MMA projects the market will reach roughly 22.5 billion dollars by 2036 under the base case scenario. That reflects nearly a tripling of 2026 revenue over the eleven-year forecast window.

What is the CAGR for the Enterprise Manufacturing Intelligence Market 2026 to 2036?

The base case compound annual growth rate is 11.5 percent across the forecast period. Bull and bear scenarios range from 10.3 percent to 12.7 percent depending on digital transformation adoption pace.

Which segment is growing fastest?

Predictive Maintenance Analytics leads growth at a 16.0 percent CAGR, roughly 1.39 times the overall market rate. AI-driven anomaly detection capability drives this accelerating adoption pace.

Who are the major companies in the Enterprise Manufacturing Intelligence Market?

PTC, Rockwell Automation, Siemens, AVEVA, and Tulip Interfaces lead the competitive landscape. Combined, the top five players hold an estimated 44 percent share on a revenue basis.

Which country is growing fastest?

India leads country-level growth at a 14.5 percent CAGR, outpacing the global average as its electronics and automotive manufacturing base scales rapidly. Government incentive programs contribute meaningfully to this pace.

Report Segmentation Architecture

The full report scope spans multiple orthogonal segmentation dimensions, with cross-tabulated demand data provided for each dimension pair. Coverage extends further to regional breakdowns, trend trajectories, and the competitive detail needed to support segment-level decision-making.

By Primary Market Dimension

  • Production Monitoring Software
  • Quality Management Analytics
  • Predictive Maintenance Analytics
  • Supply Chain Visibility Software
  • Energy and Sustainability Analytics
  • Workforce Analytics Software

By End-Use Industry

  • Automotive Manufacturing
  • Electronics and Semiconductor Manufacturing
  • Aerospace and Defense Manufacturing
  • Consumer Packaged Goods Manufacturing
  • Industrial Machinery Manufacturing
  • Pharmaceutical and Chemical Manufacturing

By Commercial Dimension

  • Direct Enterprise Licensing
  • Systems Integrator Channel
  • OEM Equipment Bundled Sales
  • Managed Service Provider Channel
  • Multi-Plant Enterprise Agreements
  • Implementation and Support Services

By Region

  • East Asia
  • North America
  • Western Europe
  • South Asia and Pacific
  • Latin America
  • Middle East and Africa
  • Eastern Europe

Scope, Methodology, and Coverage

Every figure in this report is reproducible from documented input assumptions. The scope below maps the historical period, the forecast horizon, the segmentation dimensions, and the countries covered, alongside the underlying primary and qualitative methodology.
Historical Period
2020 to 2025
Forecast Period
2026 to 2036
Base Year
2025 (USD billions; MMA Primary Research Dataset, September 2026)
Market Definition
The enterprise manufacturing intelligence market covers software platforms that aggregate, analyze, and visualize real-time production, quality, and workforce data from factory floor equipment and systems for plant and enterprise decision-making. It excludes full manufacturing execution system suites, enterprise resource planning software, and standalone industrial automation hardware sold separately from analytics software.
Quantitative Units
USD Billion
Segmentation Dimensions
Application, End-Use Industry, Commercial Channel, Region
Regions Covered
East Asia, North America, Western Europe, South Asia and Pacific, Latin America, Middle East and Africa, Eastern Europe
Countries Covered
United States, Canada, Germany, United Kingdom, France, China, Japan, South Korea, India, Australia, Brazil, Mexico, Saudi Arabia, Israel, Poland
Key Companies Profiled
PTC Inc, Rockwell Automation Inc, Siemens AG, AVEVA Group plc, Tulip Interfaces Inc, Sight Machine Inc, Seeq Corporation, MachineMetrics Inc, Braincube SAS, Cognite AS, Uptake Technologies Inc, Falkonry Inc, Litmus Automation Inc, Parsec Automation Corp, Critical Manufacturing SA, Inductive Automation LLC, Element Analytics Inc, Instrumental Inc, L2L Inc, Datch Systems Inc
Quantitative Methodology
Primary survey, n=3,800 respondents, Q4 2025, six countries; demand-side model with trade association cross-validation
Qualitative Methodology
47 expert interviews, Q4 2025; applied to validate demand model assumptions, identify emerging dynamics, and assess competitive positioning
Report Format
PDF and XLSX data workbook (Word format preview document)
Publisher
Market Minds Advisory
Report Code
MMA-2026-TEC-547
Published
September 2026
Contact
sales@marketmindsadvisory.com | www.marketmindsadvisory.com

Purchase the full Enterprise Manufacturing Intelligence Market Report (2026 to 2036).

This report delivers a comprehensive analysis of the global enterprise manufacturing intelligence market across the 2026 to 2036 forecast period. It covers market sizing, segmentation by application and end-use industry, and regional demand dynamics across all seven major world regions. The report profiles twenty leading vendors, benchmarks competitive positioning, and quantifies input cost exposure tied to cloud infrastructure and engineering talent supply chains. Analysts detail revenue diversification strategies, portfolio margin economics, and the demand mechanisms shaping enterprise procurement decisions through the coming decade. A dedicated client case study illustrates how these findings translate into practical platform consolidation decisions.
Seven-region demand and CAGR breakdown analysis
Twenty-company competitive benchmarking and positioning profile
Revenue lever and monetization pathway analysis
Input cost exposure and mitigation strategies
Segment-level growth and margin forecasting detail
Client engagement case study with outcomes

Built For The People Who Decide

From boardroom strategy to bench-side execution, this report is read cover-to-cover by leaders shaping the next decade of their industry, turning demand scenarios, market dynamics and valuation benchmarks into decisions.
CXOs/ Presidents/ VPs/ Managers
M&A and Corporate Development
Strategy Teams and R&D Heads
Procurement and Product Directors
Regulatory and Compliance Leaders
Investor Relations and Equity Analysts