Market Minds Advisory
Enterprise LLM Market

Enterprise LLM Market: Enterprise LLM Market: Token Deflation, Model Substitution and Where the Value Is Actually Being Captured

Price per unit of equivalent capability has collapsed while consumption has multiplied, so revenue now depends on volume outrunning deflation and on holding a position models themselves no longer confer.

Lead Analyst

Published

September 2026

Make Smarter Decisions with Customized Research Insights

Request a free sample report and evaluate market opportunities, growth trends, and competitive dynamics relevant to your business needs.

2025 MARKET VALUE$9.5BMarket Size 2025
2036 FORECAST VALUE$56.5BBase Case , 2026 to 2036
CAGR 2026 TO 203617.6 %Bull 18.8% / Bear 16.2%
INCREMENTAL OPPORTUNITY$45.3BNet 10- year value creation
EXPANSION MULTIPLE5.06x2036 value over 2026 base
Strategic Levers
M&A Pipeline
Regional Outlook
Country Rankings
Competitive Intelligence
Segmental Deep-dive
Call-Us : 91 93563 13602

Executive Snapshot and Market Trajectory.

Cost per unit of equivalent capability has fallen roughly 78% in two years while consumption has multiplied. Revenue growth in this market therefore depends entirely on volume outrunning deflation, and that is a harder race than the headline adoption figures suggest. Usage and revenue have decoupled.
Enterprises responded by treating models as substitutable. Around 56% of production deployments now call more than one provider, and 34% of enterprise inference runs on openly licensed models that cost nothing to license. Open-weight support and licensing is the fastest segment at 26.4%, half again the market rate of 17.6%. North America takes 44% of spending because that is where the deployments and the providers both sit.
Concentration is high at roughly 71% across the top five on measured enterprise model and serving revenue, and that figure is more fragile than it looks. Routing layers make substitution a configuration change rather than a migration. Only about 29% of pilots reach sustained production, and the ones that do are held together by data and workflow rather than by any model. No model holds a deployment together on its own any more.
Market Definition
This market covers large language model capability supplied to enterprises, spanning public application interface token consumption, dedicated and private model deployment, open-weight model support and licensing, model customisation and fine-tuning, inference serving and routing platforms, and sovereign or regionally hosted model services. Revenue is measured as model, serving and attributable customisation value at supplier level. Consumer subscriptions, accelerator hardware, model training infrastructure, agent development frameworks, general cloud infrastructure and downstream applications embedding models are excluded.
Base Year Value
$9.5B in 2025 (MMA Primary Research Dataset, September 2026)
Forecast Period
2026 to 2036, eleven discrete annual values
CAGR
17.6% base case. Bull 18.8%. Bear 16.2%.
Fastest Growth Segment
Open-Weight Model Support and Licensing: 26.4% CAGR
Fastest Growth Country
India: 23.8% CAGR
Fastest Growth Region
South Asia and Pacific: 20.0% CAGR
Largest Region
North America: 44% of 2025 global value
Market Leaders
Microsoft, Google, Amazon Web Services, OpenAI and Anthropic lead on measured enterprise model and serving revenue. Source: MMA Primary Research Dataset, July 2026.
Primary Survey
n=3,800 procurement and R&D decision-makers, Q4 2025, six countries
Methodology
Demand-side build-up, cross-validated against public data, 47 expert interviews

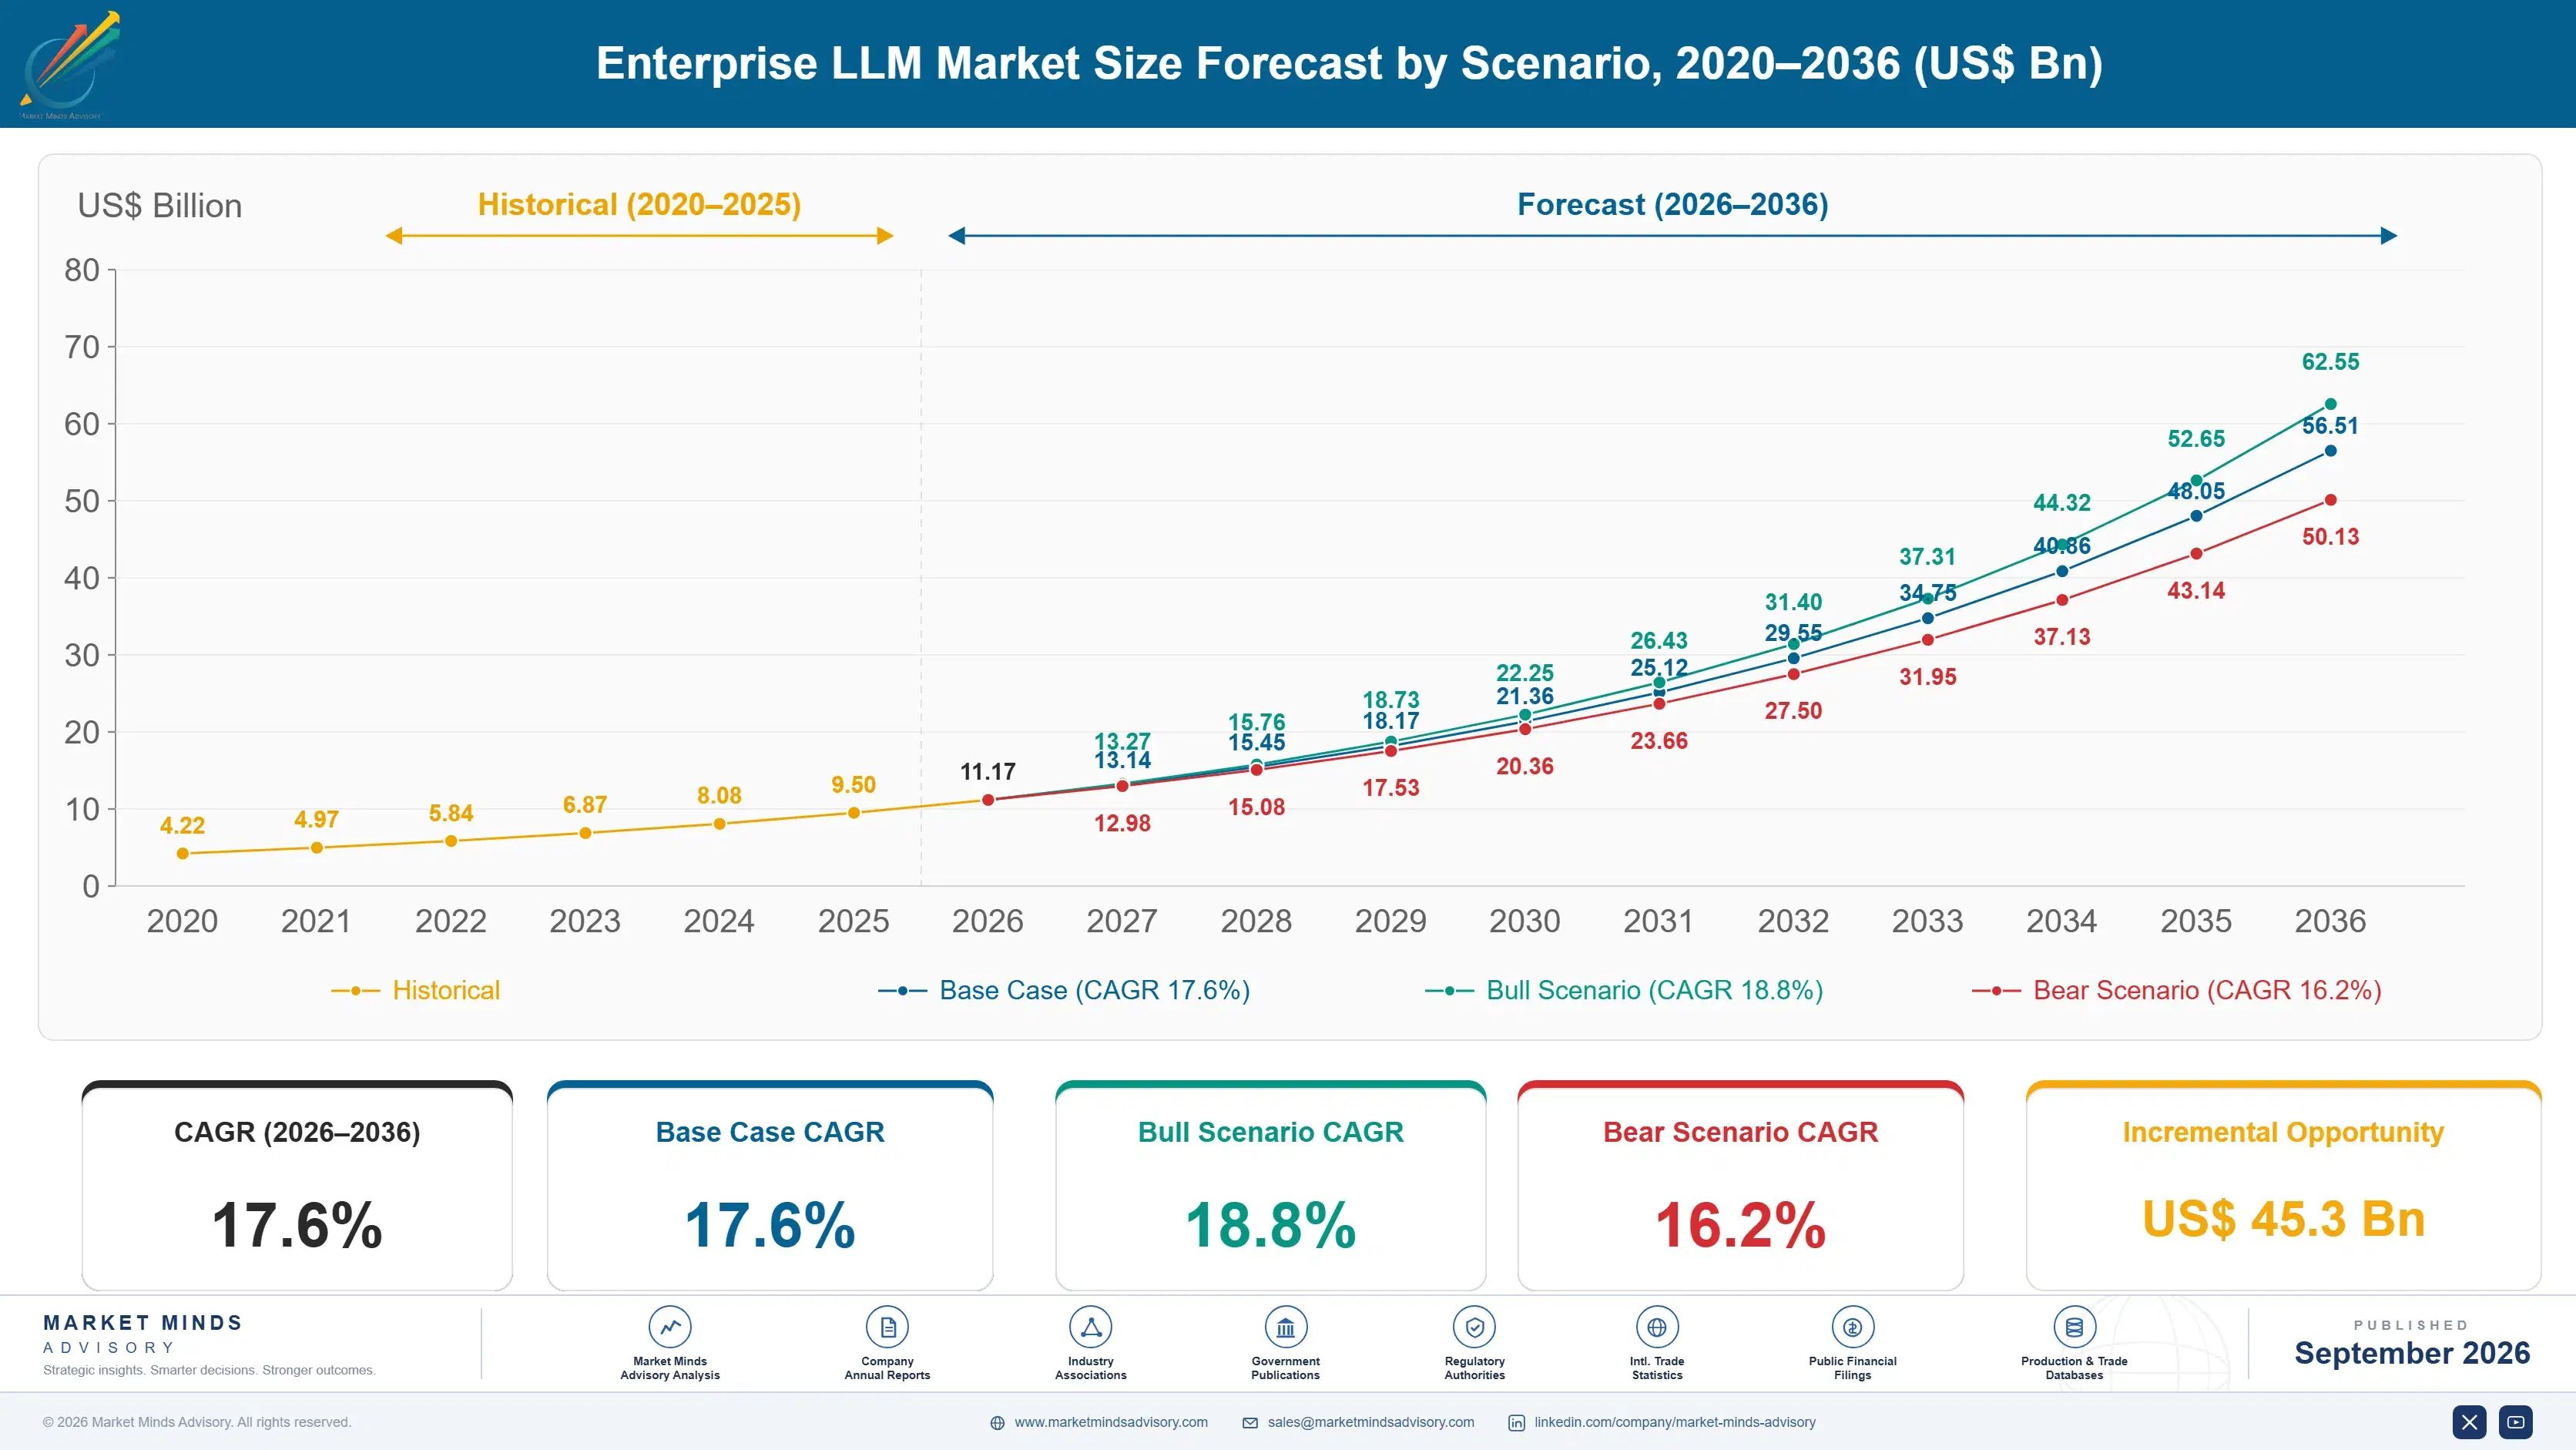
Enterprise LLM Market Forecast Scenarios

enterprise-llm-market-size-forecast-scenario-1788419634554
The 2020 to 2025 period grew at 16.4% in value terms and that number badly understates what happened underneath it. Enterprise consumption rose by orders of magnitude across 2023 to 2025 while price per unit of capability fell roughly 78%, so revenue grew far more slowly than usage did. Reading the value series without the volume series behind it gives entirely the wrong impression.
The base case at 17.6% carries that same tension forward and rests on three mechanisms. Volume expands as models move from pilots into embedded workflow, though only about 29% of pilots currently make that transition. Deflation continues as capability that required a frontier model becomes available from a smaller or openly licensed one. Third, spending shifts from raw tokens toward serving, routing, customisation and sovereign hosting, which deflate far more slowly.
The bull case at 18.8% assumes a genuine step in capability that resets what enterprises are willing to pay for the frontier. The bear case at 16.2% assumes open-weight models absorb most routine workload while routing layers commoditise the rest, leaving providers competing on price for volume they cannot differentiate. The bear case describes what is currently happening rather than a hypothetical.

Consumption Rising, Price Falling, Value Moving

The central fact about this market is that its unit price is falling faster than almost any technology input in living memory. Cost per unit of equivalent capability has dropped roughly 78% in two years, which is excellent for buyers and difficult for sellers. Consumption has so far grown fast enough to compensate. Whether it continues to decides every provider's revenue trajectory.
TOP FIVE CONCENTRATION71%Highly concentrated among frontier model and cloud providers
TOKEN PRICE DECLINE78%Fall in cost per unit of equivalent capability
OPEN-WEIGHT WORKLOAD SHARE34%Enterprise inference now served by openly licensed models
MULTI-MODEL ROUTING SHARE56%Deployments calling more than one provider in production
PRODUCTION CONVERSION RATE29%Pilots reaching sustained production use within a year
AVERAGE ENTERPRISE SPENDUSD 1.9mAnnual outlay across models, serving and customisation work
Enterprises reacted rationally by refusing to commit. Around 56% of production deployments call more than one provider, routed by cost, latency or task rather than loyalty, and 34% of enterprise inference runs on openly licensed models carrying no fee. Switching has become a configuration change rather than a migration project. That is the single most consequential development in this market and providers rarely discuss it directly.
Value is accordingly migrating away from model access. Serving infrastructure, routing, customisation against proprietary data and sovereign hosting all deflate far more slowly than tokens do, since they involve engineering and obligation rather than a commodity output. Only about 29% of pilots reach sustained production, and the ones that do are held together by data access and workflow integration rather than by whichever model happens to sit underneath them.
"Every provider is selling capability and every buyer is quietly building a router. The uncomfortable implication is that the model is becoming the least defensible layer in the stack, and the firms that understood that first stopped pricing as though it were the product."
Director, Applied Artificial Intelligence Practice · MMA Technology Practice · September 2026

Market Trends

Routing Layers Turn Models Into Substitutable Components

Enterprises building on a single provider discovered the cost of that dependency early and responded by inserting a routing layer between their applications and any model. Around 56% of production deployments now call more than one provider, choosing by task, cost, latency or availability rather than by relationship. The consequence is that switching became configuration rather than migration, which removes the lock-in providers had assumed they were building. Inference serving and routing platforms grow at 24.0% as a direct result, and they capture margin the model layer is losing. Providers rarely discuss this development directly.
Market Impact: Costs fell 78% in 2 years
Open-Weight Models Absorb the Routine Majority of Workload

Most enterprise inference is summarisation, extraction, classification, drafting and retrieval, and openly licensed models handle all of it adequately at no licence cost. About 34% of enterprise workload now runs that way, and the share rises every quarter as smaller models improve. Frontier models retain the genuinely difficult reasoning, long-context and code tasks, which are valuable and narrow. Open-weight support and licensing grows at 26.4%, faster than any other segment, because enterprises want indemnity, security patching and support rather than the weights themselves. Support renews on obligation rather than preference.
Market Impact: Segment grows at 20.8% yearly

Market Opportunities and Growth Drivers

Deflation Expands the Set of Economically Viable Applications

Applications that made no sense at earlier prices become obvious at a fraction of the cost, and a 78% fall in cost per unit of capability has opened a very large set of them. Document processing at population scale, per-transaction classification and continuous monitoring of unstructured content are all now affordable where they were not. This is why volume has grown faster than price has fallen so far. It also means providers depend entirely on their customers finding new uses rather than on any pricing action they can take themselves.
Market Impact: Only 29% reach production

Data Residency Requirements Create Sovereign Deployment Demand

Regulated industries and public sector bodies across Europe, the Gulf and Asia increasingly require that model inference occur within a defined jurisdiction, on infrastructure subject to local law, with documented data handling. That rules out shared public endpoints regardless of contractual assurances. Sovereign and regionally hosted model services grow at 20.8% as a result, at prices well above commodity token rates because the constraint removes cheaper alternatives entirely. National programmes funding domestic model capability add a second and quite separate strand of demand. Neither strand responds to conventional cost arguments, which changes the negotiation completely.
Market Impact: Prices fell 78% while volume grew

Market Restraints and Challenges

Most Pilots Never Reach Sustained Production

Only about 29% of enterprise pilots convert into sustained production use within a year, and the failure pattern is consistent rather than varied. The root cause is rarely model quality: deployments stall on data access, evaluation that nobody can define, integration into workflow people actually use, and the absence of anyone accountable for the outcome. Commercially this caps consumption growth well below what adoption headlines imply. Providers are mitigating with reference architectures, evaluation tooling and delivery partnerships, though the binding constraint remains organisational rather than technical. Adoption headlines and production reality remain a long way apart.
Market Impact: Routing covers 56% of deployments

Deflation Outruns Volume in Mature Workloads

Once a workload is established, its token consumption stabilises while the price per token continues falling, which means revenue from that customer declines year over year unless new applications appear. The root cause is competition among providers with closely similar offerings and no basis for differentiated pricing on routine tasks. This is already visible in mature accounts and it worries providers considerably more than they say publicly. Mitigation depends on moving customers toward serving, customisation and sovereign hosting, which deflate far more slowly. Mature accounts already show the effect clearly enough.
Market Impact: Handles 34% of enterprise workload
3 additional market trends, 4 additional growth drivers, and 3 additional restraints and challenges are covered in the full report. Contact sales@marketmindsadvisory.com to access the complete intelligence.

Segment CAGR and Growth Architecture

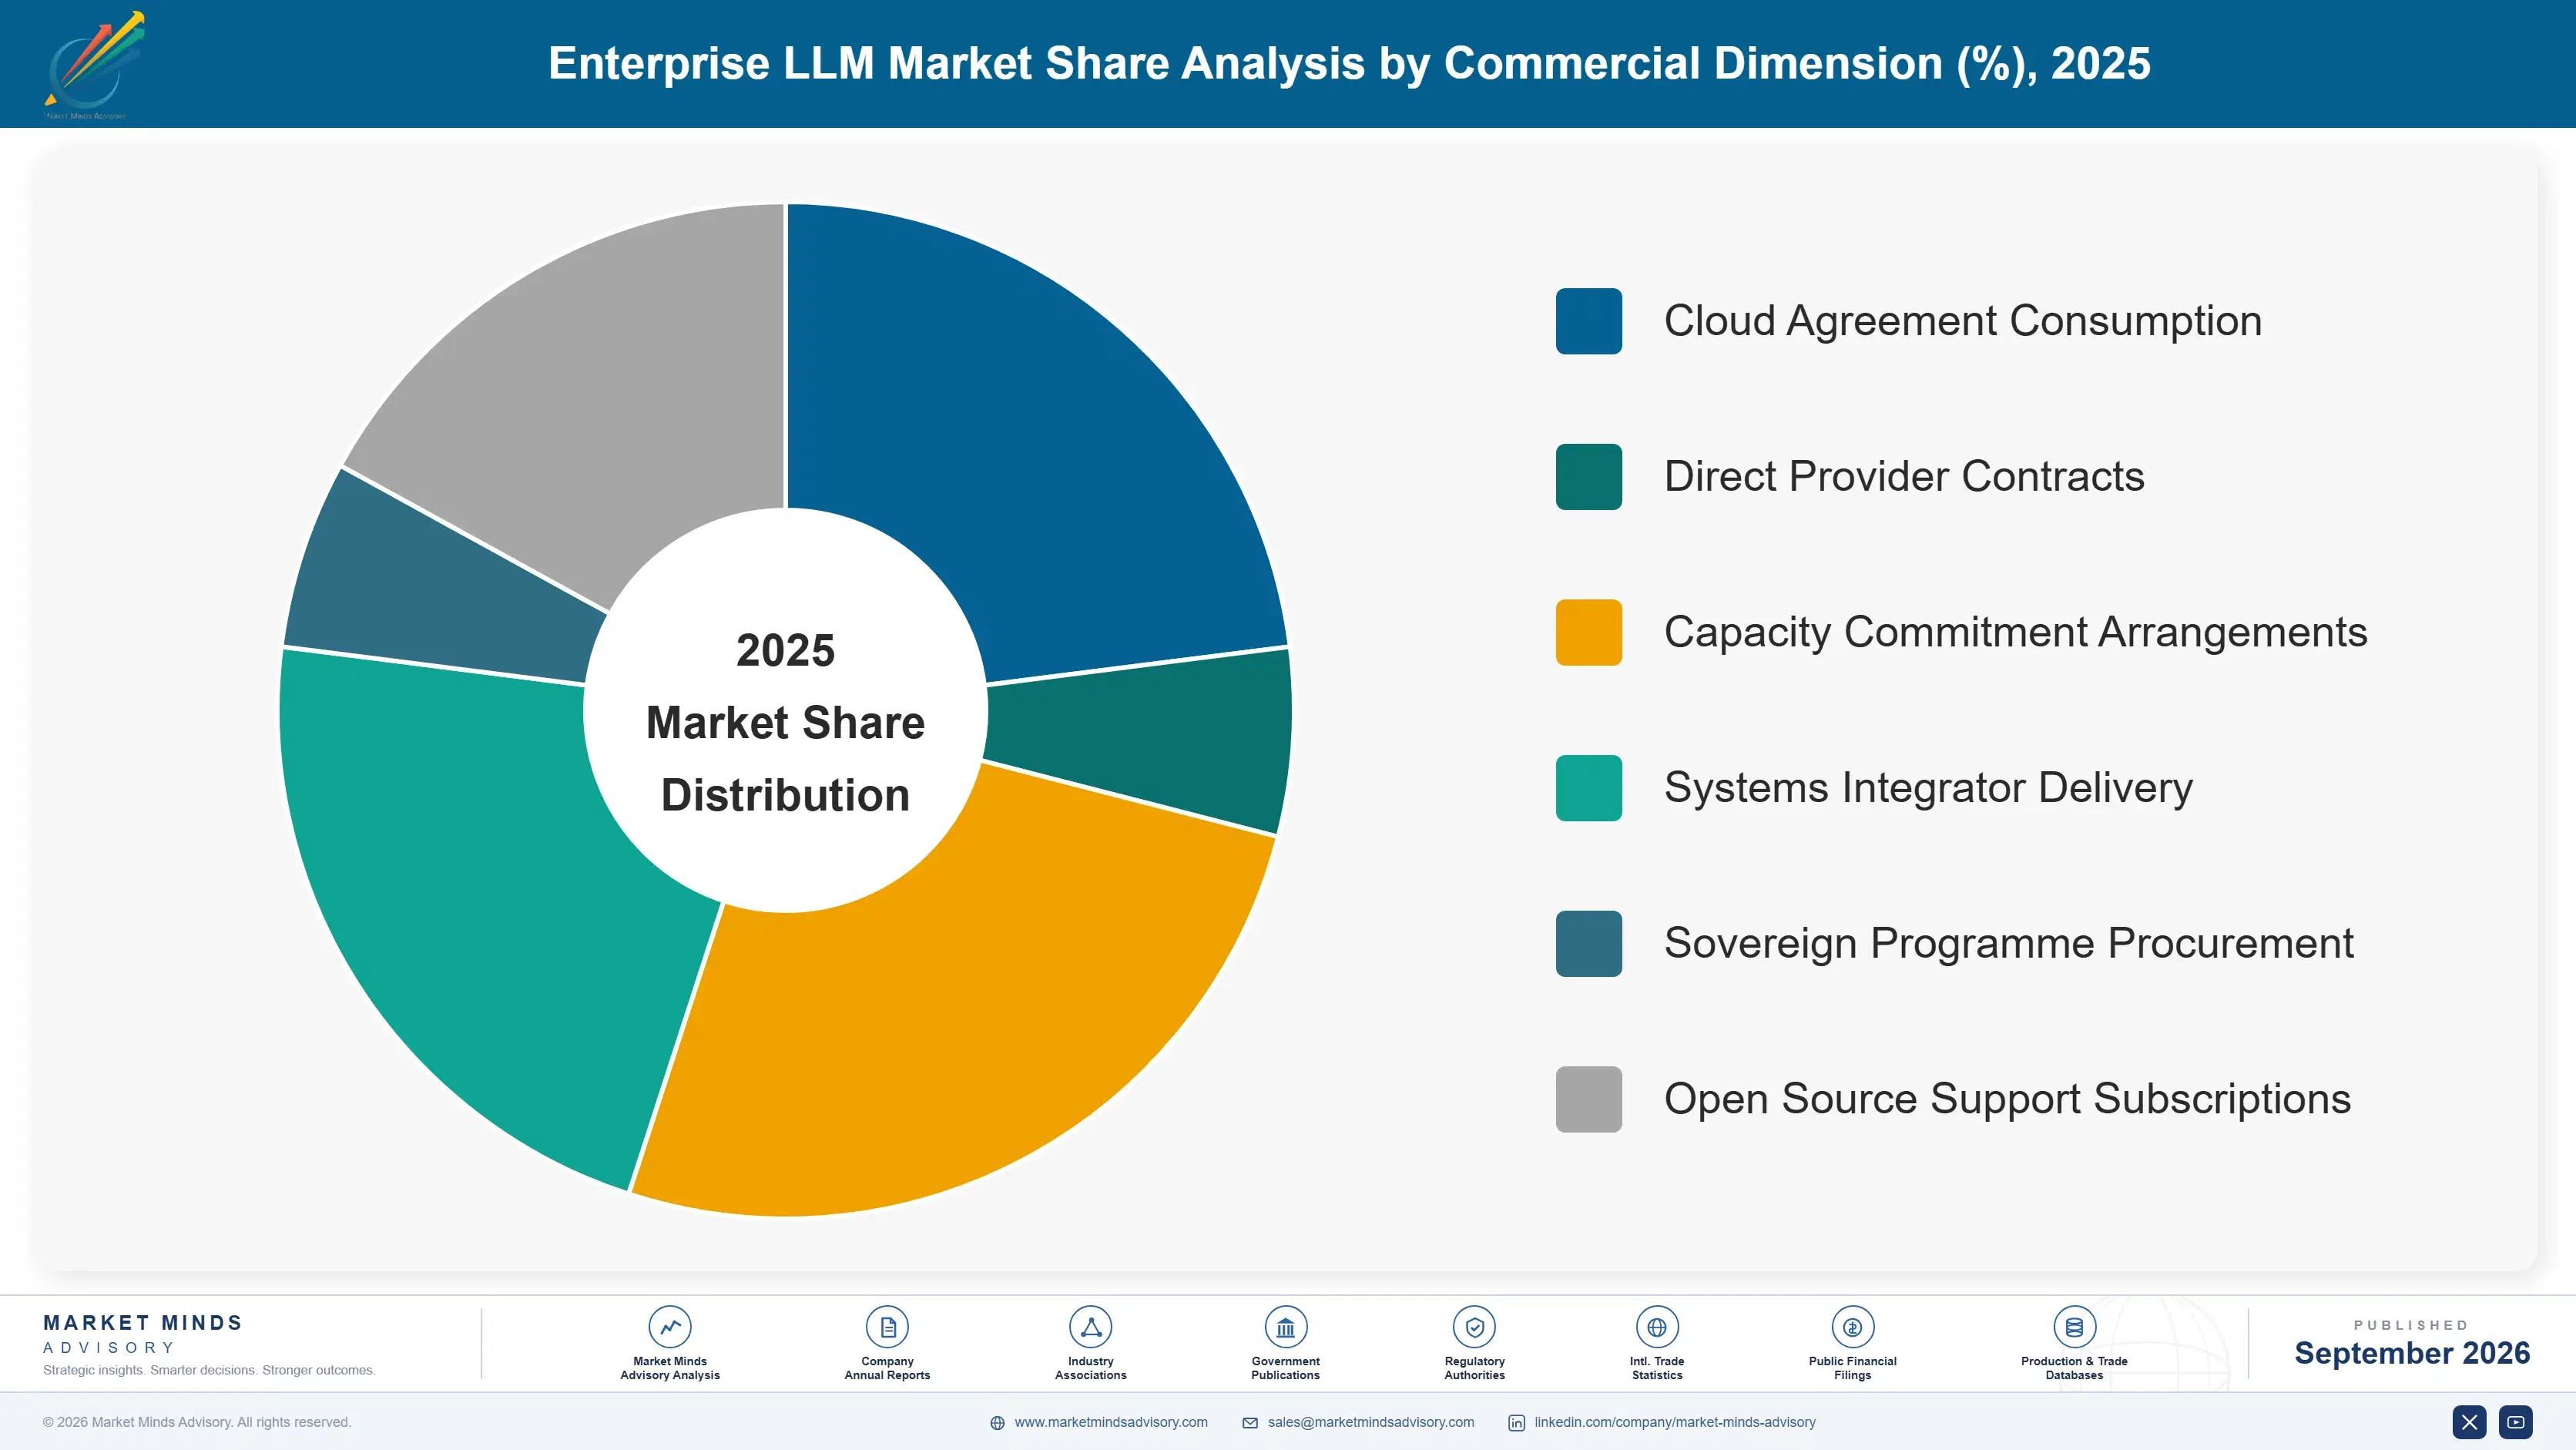
Segmentation follows how model capability is consumed, because that determines who supplies it, what obligations attach and how quickly the price deflates. Raw model access is deflating fastest and everything involving engineering, indemnity or jurisdiction is deflating slowest, which explains essentially all of the growth divergence across this market. The divergence keeps widening. Suppliers differ accordingly.
enterprise-llm-market-market-share-analysis-1788419635105

Open-Weight Model Support and Licensing

Open-weight support grows fastest at 26.4%, half again the market rate of 17.6%, and the product being sold is not the model at all. Enterprises can obtain the weights without payment, and what they cannot obtain is indemnification, security patching, validated builds, long-term version support and someone contractually answerable when something fails. That is what suppliers actually charge for, and it is a support business closer to enterprise open-source software than to model licensing. Around 34% of enterprise inference now runs this way, concentrated in routine summarisation, extraction and classification workloads where frontier capability adds nothing a buyer can measure or justify. Renewal follows obligation rather than preference, which makes the revenue steadier than model access.
CAGR 26.4%

Inference Serving and Routing Platforms

Serving and routing platforms grow at 24.0% by occupying the position that model substitutability created. They sit between applications and models, select destinations by task, cost, latency and availability, manage fallback when a provider degrades, and give enterprises consumption visibility that raw application interfaces never provided. Around 56% of production deployments now run through such a layer. The commercial significance is that this layer captures margin as the model layer deflates, and it holds the consumption data that makes provider negotiation possible. Model providers building their own routing face an obvious conflict, since honest routing means recommending a competitor. Independent operators have an advantage there that model providers cannot easily overcome.
CAGR 24.0%
Full segment breakdown across 6 segments available in the complete report.

Regional Architecture and Country Demand Map

Demand concentrates where enterprise deployment and model supply happen to coincide, which is unusual and will not persist. Regulated data residency requirements are already pulling inference toward the jurisdictions where the data itself originates rather than where providers operate. Provider location explains less each year.

North America

North America holds 44%, well above the regional band, because enterprise deployment and model supply are both concentrated here and revenue is recognised where the provider sits. Financial services, technology and healthcare organisations account for most consumption, with software engineering and customer operations the deepest workloads. Cloud provider relationships channel much of the spending, since enterprises prefer models procured inside agreements they already hold. The routing and open-weight shift is furthest advanced here as well, which means the deflation pressure providers face globally is being felt first and hardest in their largest market. Regional growth at 16.8% sits near the market rate, which understates volume growth considerably given how fast unit prices are falling here.
Share: 44% | CAGR: 16.8% (2026 to 2036)

Western Europe

European demand is shaped by regulation and by where inference is permitted to run. Artificial intelligence rules and data protection obligations push regulated industries toward dedicated deployment and regionally hosted services rather than shared public endpoints, at prices well above commodity rates. German and French enterprises show the strongest preference for open-weight models on sovereignty grounds rather than cost. Financial services in the United Kingdom and Switzerland buy dedicated capacity with contractual data handling commitments. National model initiatives across several countries add publicly funded demand that follows policy rather than commercial logic. Regional growth at 16.0% is the slowest of the major markets, held back by deployment caution rather than by any shortage of interest.
Share: 20% | CAGR: 16.0% (2026 to 2036)
Regional intelligence for 5 additional markets available in the complete report: East Asia, South Asia and Pacific, Latin America, Middle East and Africa, Eastern Europe. Contact sales@marketmindsadvisory.com.
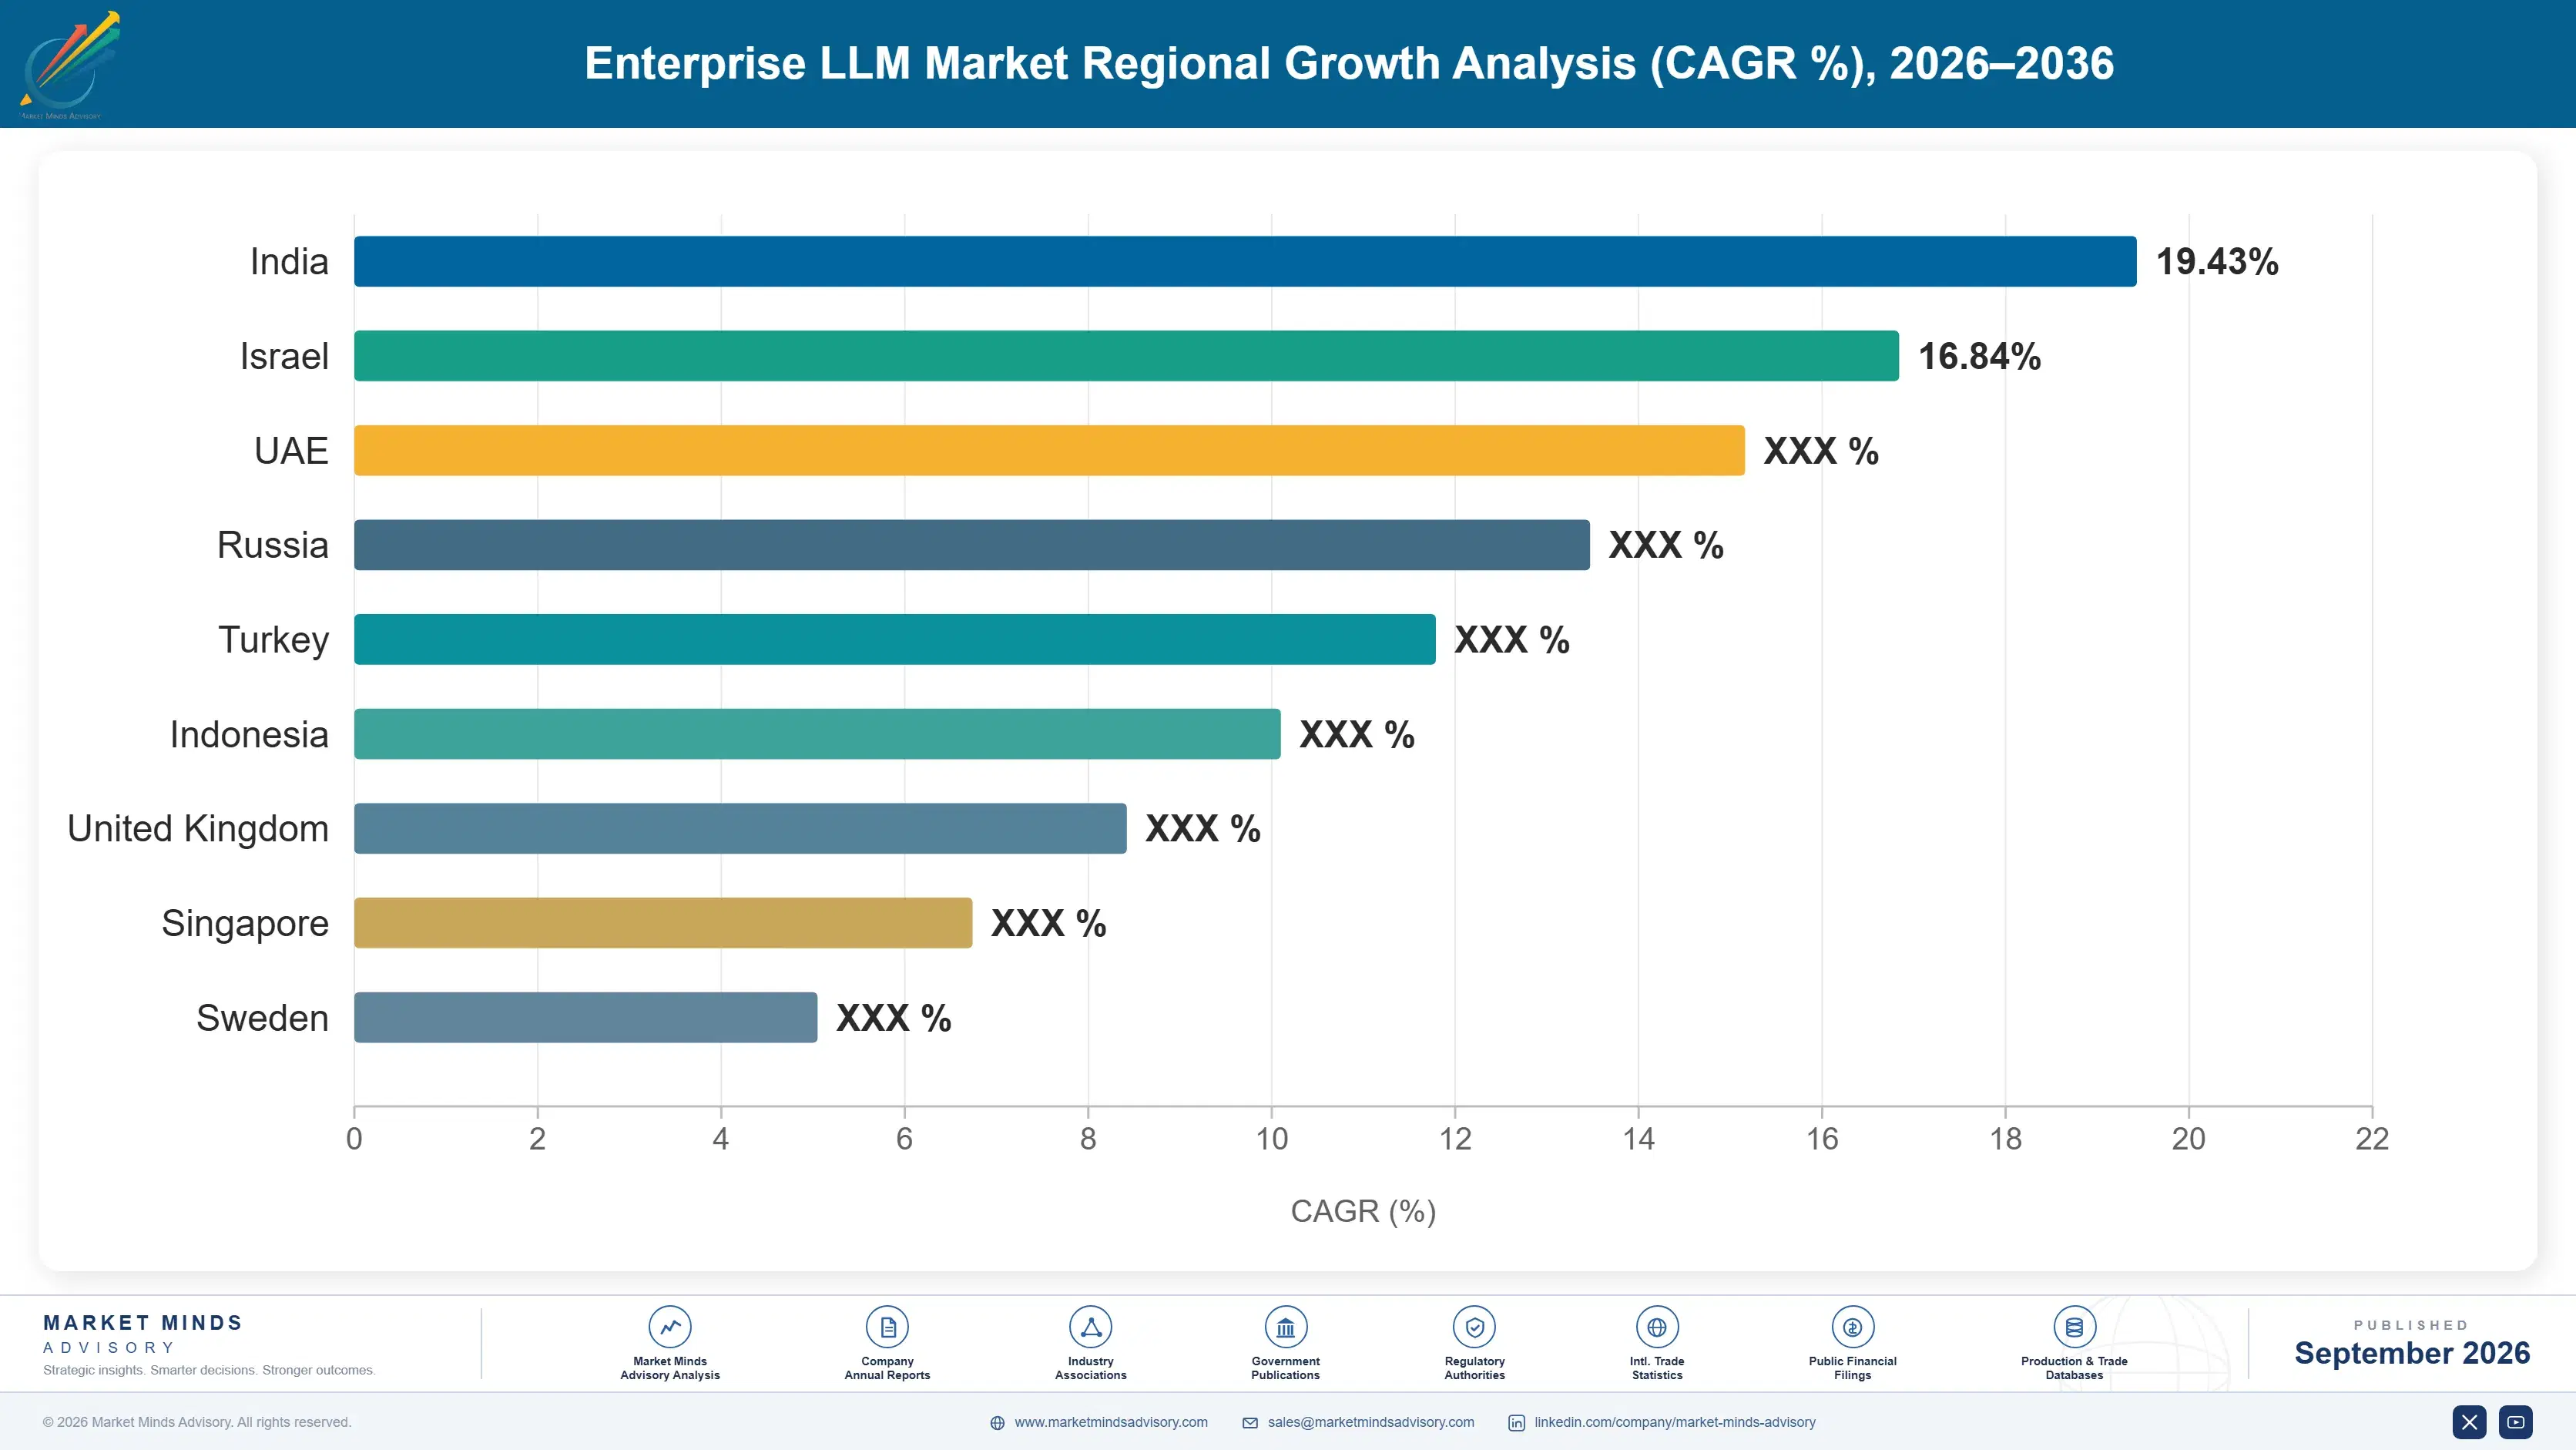
enterprise-llm-market-country-cagr-analysis-1788419635628

Where Model Revenue Still Holds

Selling tokens into a market where price per unit of capability fell 78% in two years is a race nobody wins by running harder. What holds value is the layer between applications and models, the customisation that runs on data only the customer owns, and obligations like indemnity and jurisdiction that a commodity cannot satisfy.

Occupy the Routing Layer Before Customers Build It

Around 56% of production deployments already route across providers, and enterprises that build their own routing keep the consumption data and the negotiating position that comes with it. Suppliers providing routing, fallback and consumption visibility hold a position that deflates roughly 3 times more slowly than model access does, because the value is operational rather than a commodity output. The obvious difficulty is that honest routing sometimes means sending traffic to a competitor. Suppliers unwilling to do that will not be trusted with the layer at all. Trust in the layer is what makes it valuable at all.
Market Impact: Deflates roughly 3 times more slowly than access

Sell Indemnity and Support Around Open Weights

Enterprises can obtain open model weights for nothing and cannot obtain indemnification, validated builds, security patching or contractual accountability, which is precisely what they will pay for. That business grows at 26.4%, faster than anything else in this market, and it resembles enterprise open-source support far more than model licensing. Margins are respectable and the customer relationship is durable, since support contracts renew on obligation rather than preference. Frontier providers dismissing this as low-value are conceding 34% of enterprise workload without contest. It is an obligation business rather than a licensing one, and it renews accordingly.
Market Impact: Already covers a full 34% of enterprise workload

Customise Against Data Only the Customer Holds

When every enterprise reaches the same models, output differs only where inputs do, which makes customisation against proprietary data the one thing competitors cannot replicate. That work grows at 19.4% and resists deflation because it is specific engineering rather than a commodity output. Suppliers building customisation and evaluation capability capture roughly 2 times the account value of those supplying model access alone. It requires delivery capability that pure model providers generally lack, and partnerships rarely substitute for it convincingly. Output only differs where the inputs do, and inputs are where a customer's advantage lives. Nothing else resists copying.
Market Impact: Captures roughly 2 times the total account value

Price Jurisdiction Where Alternatives Are Prohibited

Regulated buyers required to keep inference inside a jurisdiction cannot use shared public endpoints whatever the contractual assurances say, which removes cheaper alternatives from the comparison entirely. Sovereign and regionally hosted services grow at 20.8% and sustain prices roughly 4 times commodity token rates for identical underlying capability. Building the capacity is expensive and the demand is concentrated among governments and regulated institutions. It is nonetheless the clearest position in this market where deflation simply does not apply. Deflation does not reach it, which is rare here. Building the capacity is expensive and demand concentrates among governments and regulated institutions.
Market Impact: Sustains roughly 4 times the commodity token rates

Who Controls the Margin Pool

Concentration is high at roughly 71% across the top five on measured enterprise model and serving revenue, and it overstates how secure those positions are. Cloud providers reach enterprises through agreements already in place, a distribution advantage rather than a product one. The gap between leaders and challengers is narrowing on capability for routine workloads, where openly licensed models perform adequately at no licence cost, and widening only at the genuinely difficult end.
Competition runs on three dimensions rather than on benchmark performance. Distribution is first, since enterprises prefer consuming models inside cloud agreements they already hold. Second is the obligations a supplier will accept, covering indemnity, data handling, jurisdiction and version support, which is where enterprise procurement actually spends its time. Third is serving economics, because inference cost determines what a supplier can charge before the customer routes elsewhere.

Two pressures are reshaping positions. Routing layers make substitution a configuration change, which removes the lock-in providers assumed they were accumulating. Meanwhile open-weight models keep absorbing routine workload, leaving frontier providers competing for a narrower band of genuinely difficult tasks. Rankings will move toward suppliers holding serving infrastructure, customisation capability and jurisdictional coverage.
enterprise-llm-market-company-positioning-matrix-1788419636157

Competitive Moat and Risk Dimensions

MICROSOFT

Moat: Enterprise distribution and agreements

Microsoft reaches enterprise buyers through commercial agreements and cloud commitments already signed, which converts model consumption into an incremental decision rather than a new procurement. Its productivity and developer platforms place capability inside workflow people already use, where successful pilots generally originate. Data residency options across many regions address the jurisdictional requirements that rule out shared endpoints.
MICROSOFT

Risk: Frontier model supply dependence

A substantial part of the enterprise proposition depends on frontier model capability the company does not exclusively control, and open-weight alternatives are absorbing the routine workloads where volume sits. Routing layers make substitution straightforward for customers who want it. Defending the position increasingly means competing on serving economics and obligations rather than capability.
ANTHROPIC

Moat: Frontier reasoning and enterprise safety

Anthropic holds a position at the difficult end of the capability range, in extended reasoning, long-context work and code, which is the band that open-weight alternatives have not absorbed. Its emphasis on interpretability and reliability addresses the concerns that stall regulated deployments. Agreements covering data handling and training use have made it a common choice in financial services and healthcare.
ANTHROPIC

Risk: Narrow layer in the stack

The company operates at the model layer, which is where deflation is sharpest and where routing has made substitution a configuration change rather than a migration. Capturing serving, customisation and jurisdictional revenue means building or partnering into layers where cloud providers already sit. Concentration in frontier workloads also exposes it if a competitor closes the capability gap on those tasks.

Players Tracked

Prominent Players

Microsoft
Google
Amazon Web Services
OpenAI
Anthropic

Other Key Players

Meta
Mistral AI
Cohere
IBM
Databricks
Snowflake
NVIDIA
Alibaba Cloud
Baidu
Together AI
Fireworks AI
Hugging Face
Groq
Oracle
SAP

Recent Developments

APRIL 2025

Enterprise routing platforms reach majority adoption in production deployments

Survey evidence indicated that most enterprises running models in production had inserted a routing layer between applications and providers, selecting destinations by task, cost and availability. The shift was driven by procurement concern over dependency rather than by any technical requirement. Application changes were rarely required afterwards.
Signal: Substitution became a configuration change, which removes the lock-in every provider assumed they were quietly accumulating.
SEPTEMBER 2025

Open-weight model releases close capability gap on routine enterprise tasks

Successive open-weight releases reached performance sufficient for summarisation, extraction, classification and drafting workloads that account for most enterprise volume. The releases were organic development by their publishers rather than the result of any acquisition or licensing arrangement between parties. Licence terms remained permissive across all of them.
Signal: Frontier pricing now has to be justified on a narrow band of difficult tasks rather than across enterprise workloads generally.
FEBRUARY 2025

Sovereign model hosting programmes expand across Europe and the Gulf

Several governments funded regionally hosted model infrastructure and domestic language capability, procuring capacity and support rather than acquiring providers. The programmes target regulated sectors required to keep inference within a defined jurisdiction under existing data protection obligations. Capacity commitments ran for several years in each case.
Signal: Jurisdiction is the one requirement that removes cheaper alternatives entirely, which makes it the most defensible pricing basis available.

What Serving a Model Costs

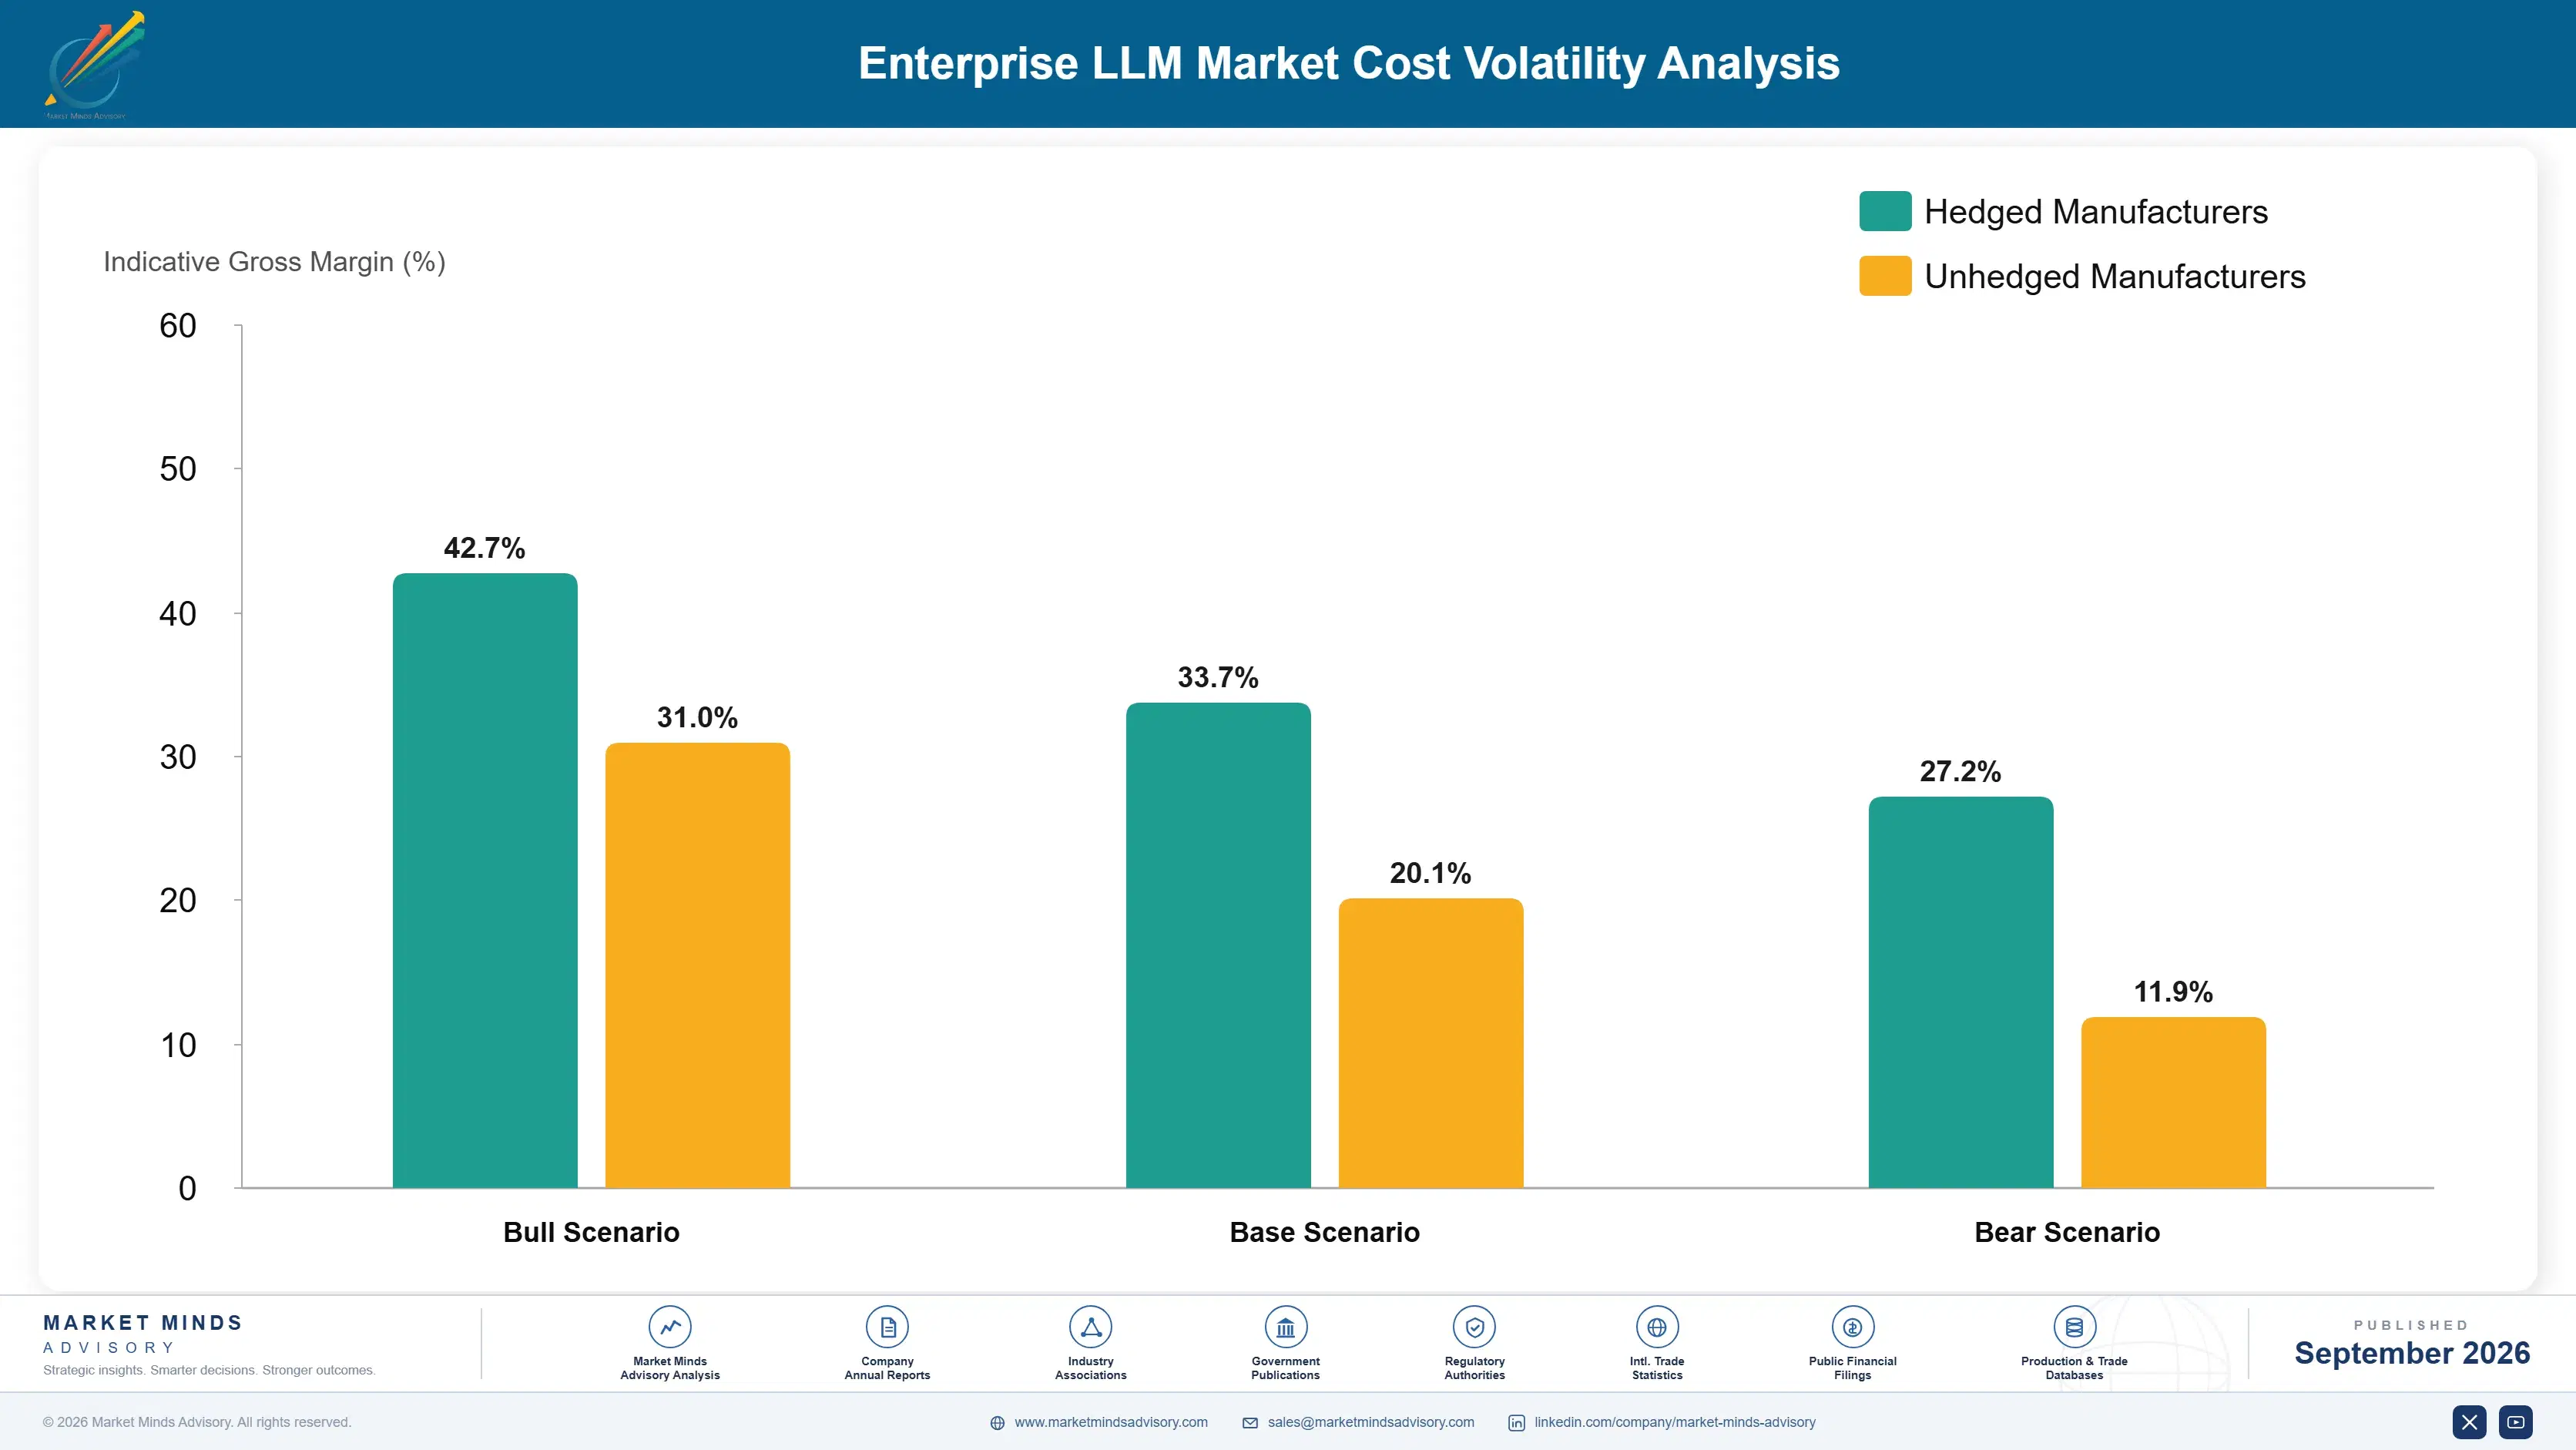
Cost of serving is dominated by compute and the power behind it. Accelerator capacity, whether owned or rented, runs between 48% and 64% of cost of goods, the range reflecting utilisation and whether infrastructure is owned or resold. Electricity and facility costs add roughly 14%, networking and storage 8%, and engineering for optimisation and model operations the balance. Utilisation is the variable that separates profitable serving from unprofitable serving.
Accelerator supply and power have both been binding. Advanced accelerator availability stayed constrained through 2024 and 2025 while demand grew faster than manufacturing capacity, and NVIDIA reported supply conditions in annual disclosures. Data centre electricity demand rose sharply at the same time, which IEA reporting documents, and power availability rather than capital became the practical constraint in several markets. Connection queues now run into years.

Exposure varies by infrastructure position rather than by scale. Suppliers owning accelerators carry utilisation risk and earn well when demand fills them. Those renting capacity flex more easily and pay a margin to whoever owns it. Providers offering fixed token pricing on rented capacity carry the worst combination, with variable cost and fixed revenue. Smaller serving specialists lack the scale to secure allocation during constrained periods.
enterprise-llm-market-cost-volatility-analysis-1788419636354

Route workloads by model size not by default preference

Most enterprise inference is routine work that a smaller model handles indistinguishably, and sending it to a frontier model wastes compute the supplier pays for. Task-based routing to the smallest adequate model cuts serving cost by roughly 60% at equivalent output quality. It requires evaluation infrastructure to establish adequacy per task, which suppliers skip because defaulting upward is faster.

Contract power and capacity ahead of demand curves

Power availability rather than capital has become the practical limit on serving capacity in several markets, and connection queues run years rather than months. Securing power and accelerator allocation ahead of demand is expensive and determines whether capacity exists when needed. Suppliers waiting for demand to justify commitment could not serve growth they had already won.

Avoid fixed token pricing on rented compute

Committing to fixed prices per token while paying variable rates for rented accelerator capacity transfers the whole margin risk onto the supplier, and several have discovered this expensively during constrained periods. Either own the infrastructure or price with terms that move alongside capacity cost. Buyers prefer fixed pricing and accept indexed terms when the alternative is unreliable availability.

Portfolio Architecture for Margin Defence

Margin architecture separates on how quickly a layer deflates. Raw model access is the fastest deflating position in enterprise technology, and margin depends on utilisation and on being whichever destination a router selects. Serving, routing and customisation deflate far more slowly because they involve engineering and operations rather than a commodity output. Jurisdictional hosting barely deflates at all, since the constraint removes cheaper alternatives from consideration.
The volume tension is between token consumption that fills infrastructure and services that generate margin. Consumption justifies the capital committed to accelerators and power, and it is where enterprises begin. Customisation, evaluation and sovereign hosting generate the profit and require capabilities that model supply alone does not build. Suppliers optimising purely for consumption growth fill capacity at prices falling every quarter.

High-value revenue concentrates in sovereign and regionally hosted services and in customisation against proprietary data. Both share the property that no competitor can supply an identical substitute, because jurisdiction prohibits it or the data exists nowhere else. Public token consumption occupies the volume position, provides the relationship that everything else is sold through, and is deflating faster than any other layer in the stack.

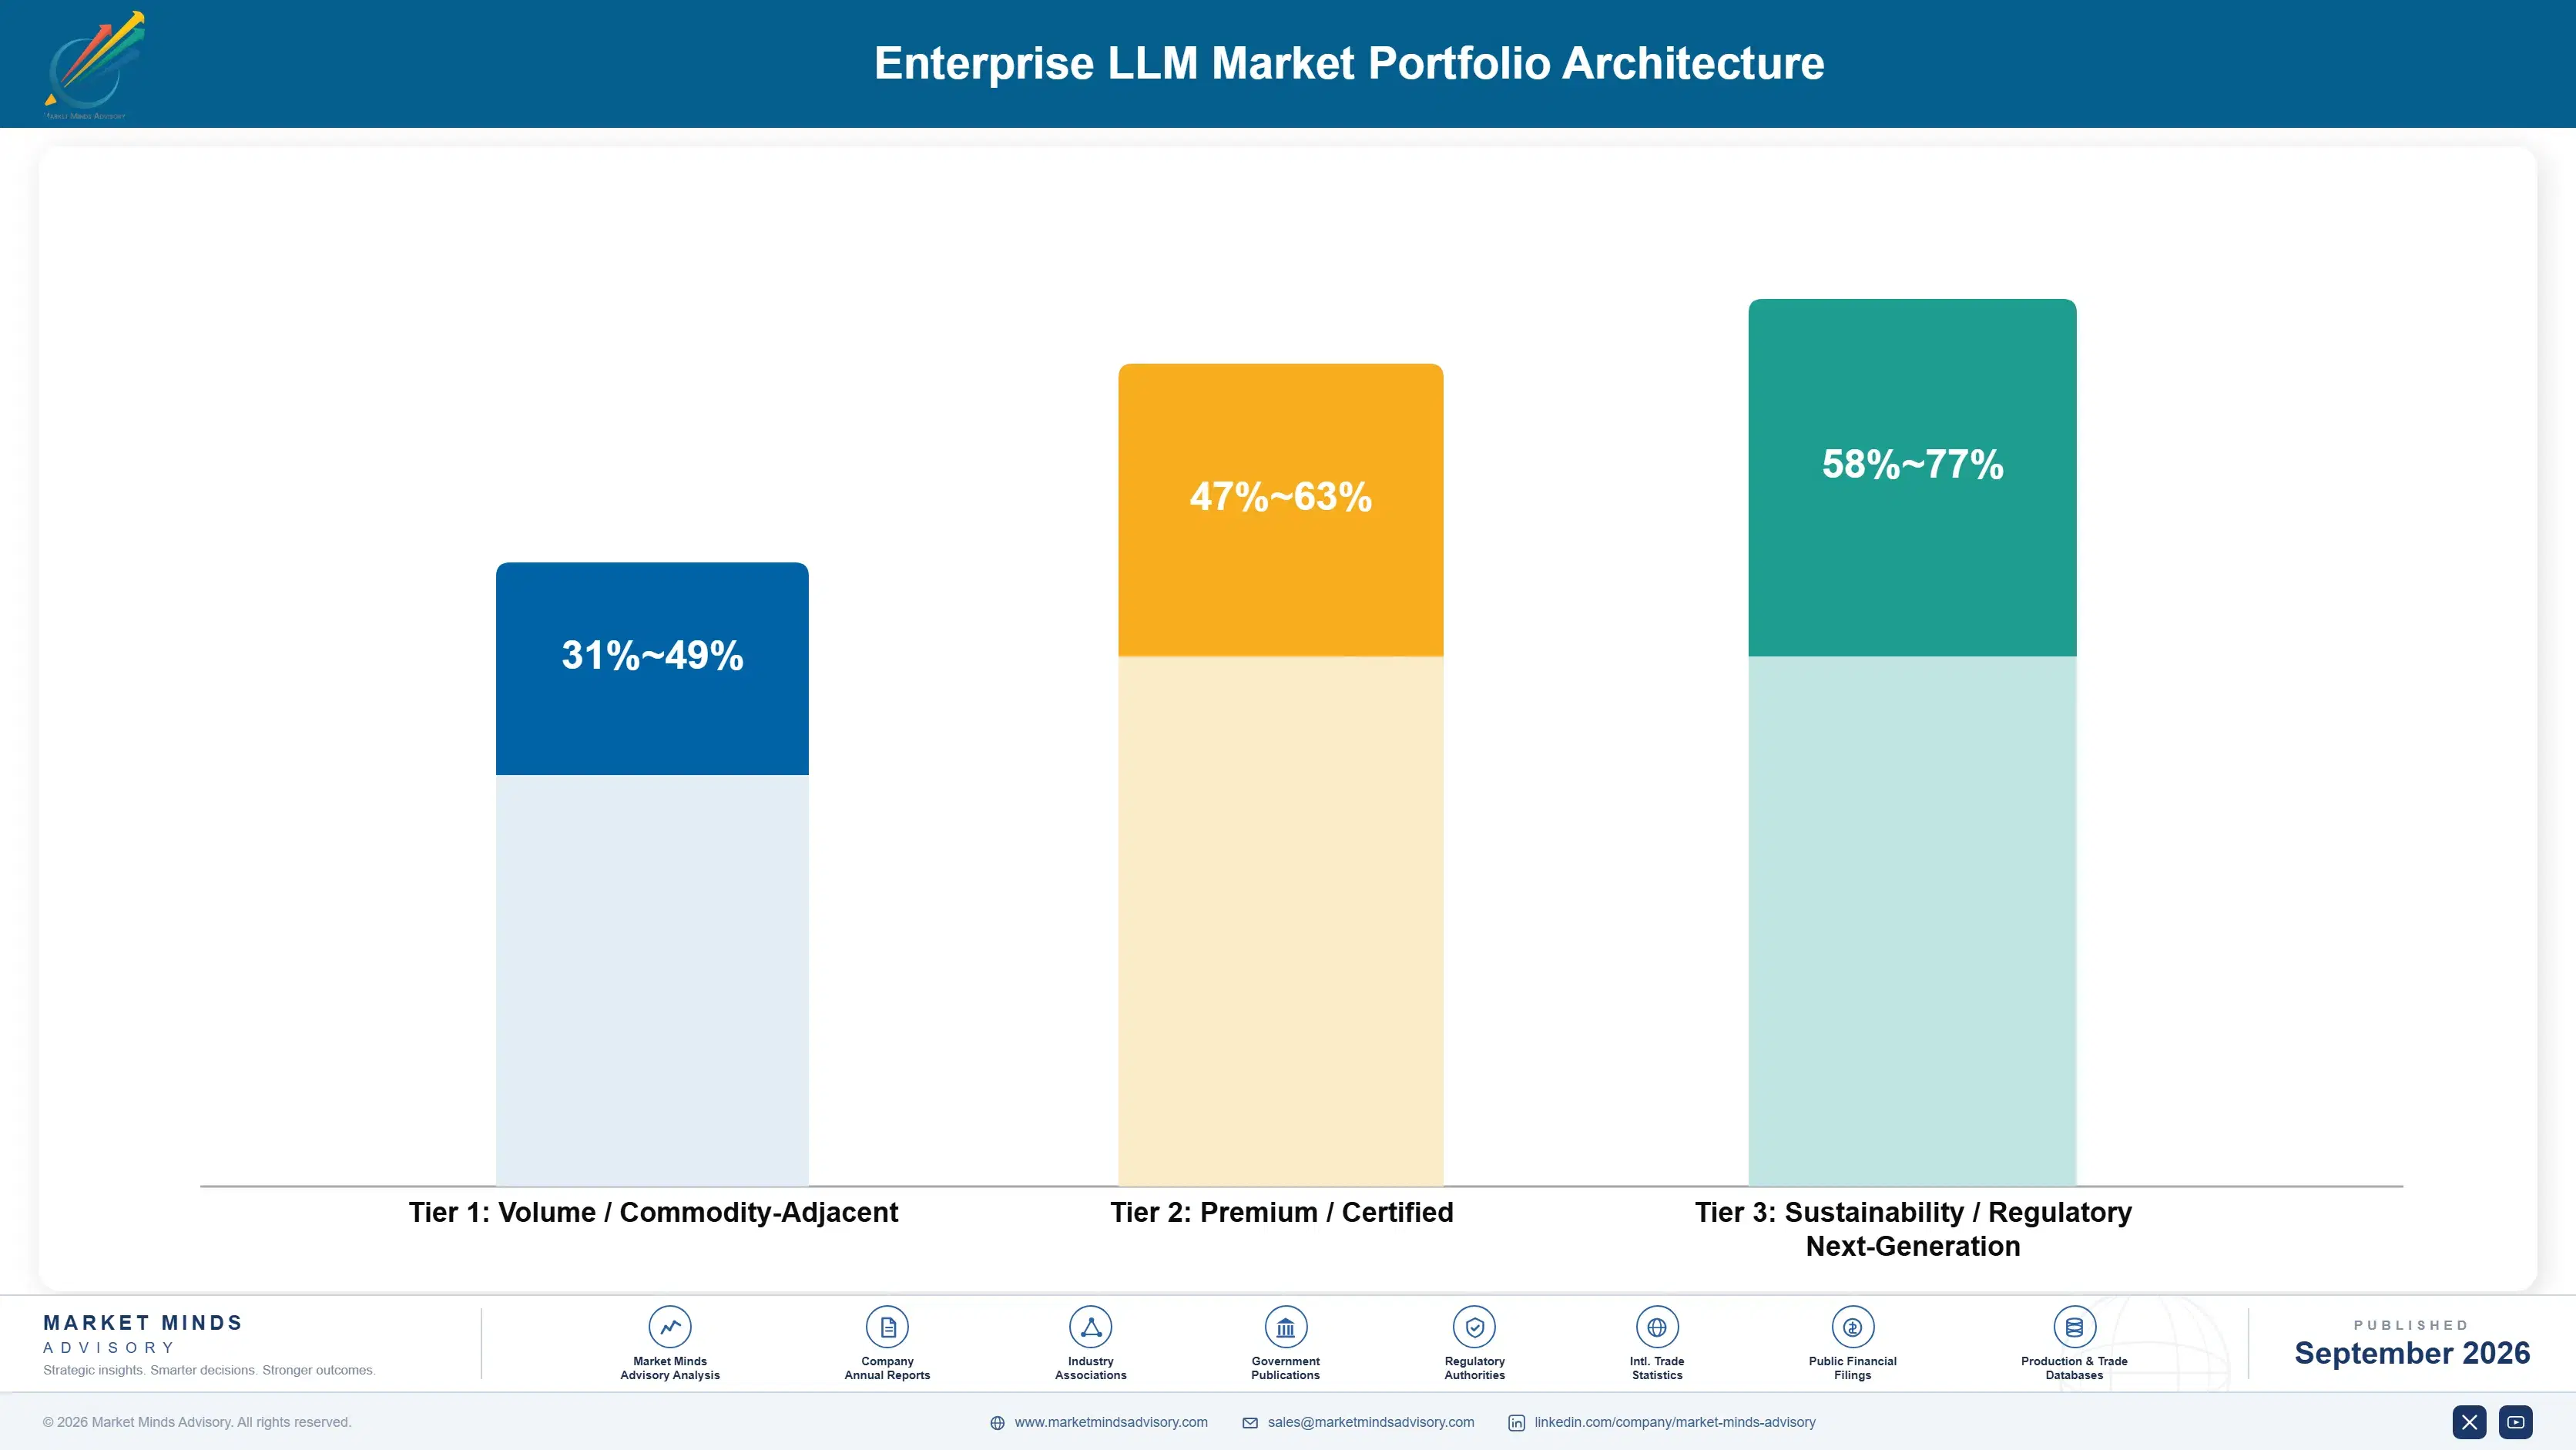
Volume / Commodity-Adjacent

Public application interface token consumption sold on published per-unit pricing. The wide range reflects utilisation and whether the supplier owns serving infrastructure or resells capacity. Deflation here is the fastest of any layer and shows no sign at all of slowing.
Gross Margin: 31-49%

Premium / Certified

Dedicated deployment, serving and routing platforms sold with capacity commitments, availability guarantees and consumption visibility. Margin holds because the value is operational rather than a commodity output. Routing positions also capture the consumption data that shapes provider negotiations.
Gross Margin: 47-63%

Sustainability / Regulatory / Next-Generation

Sovereign and regionally hosted services, customisation against proprietary data, and indemnified open-weight support. The widest range in the portfolio, reflecting how much engineering and obligation accompanies the capacity. Highest margin and the least exposed to deflation anywhere in this market.
Gross Margin: 58-77%
enterprise-llm-market-portfolio-architecture-1788419636860

High-value Sub-segments and Strategic Watch-out

Sovereign and Regional Hosting

High value and high growth together, because jurisdictional requirements remove cheaper alternatives from consideration entirely rather than merely disadvantaging them. The margin range reflects infrastructure ownership and the scope of local obligations accepted. Demand concentrates among governments and regulated institutions making very large individual commitments.
Gross Margin: 64-77%

Customisation and Evaluation Services

High value with strong growth, resisting deflation because the work is specific engineering against data no competitor can access. The range reflects delivery model and how much evaluation infrastructure is included. It requires capabilities that pure model suppliers rarely hold, which is why partnerships here so often disappoint both parties.
Gross Margin: 55-70%

Public Token Consumption

The volume core of the market and the most exposed part of it, deflating faster than any other technology input and increasingly selected by an automated router. It provides the relationship through which everything else is sold. Suppliers need the volume and are steadily less able to earn from it.
Gross Margin: 30-48%

Open-Weight Substitution Capacity

The strategic watch-out, carried at zero because it displaces paid model consumption rather than generating any. Openly licensed models already handle 34% of enterprise workload and the share rises quarterly. Frontier providers treating this as a low-end concern are conceding the volume that funds their serving infrastructure.
Gross Margin: 0-0%

How This Consumption Repeats

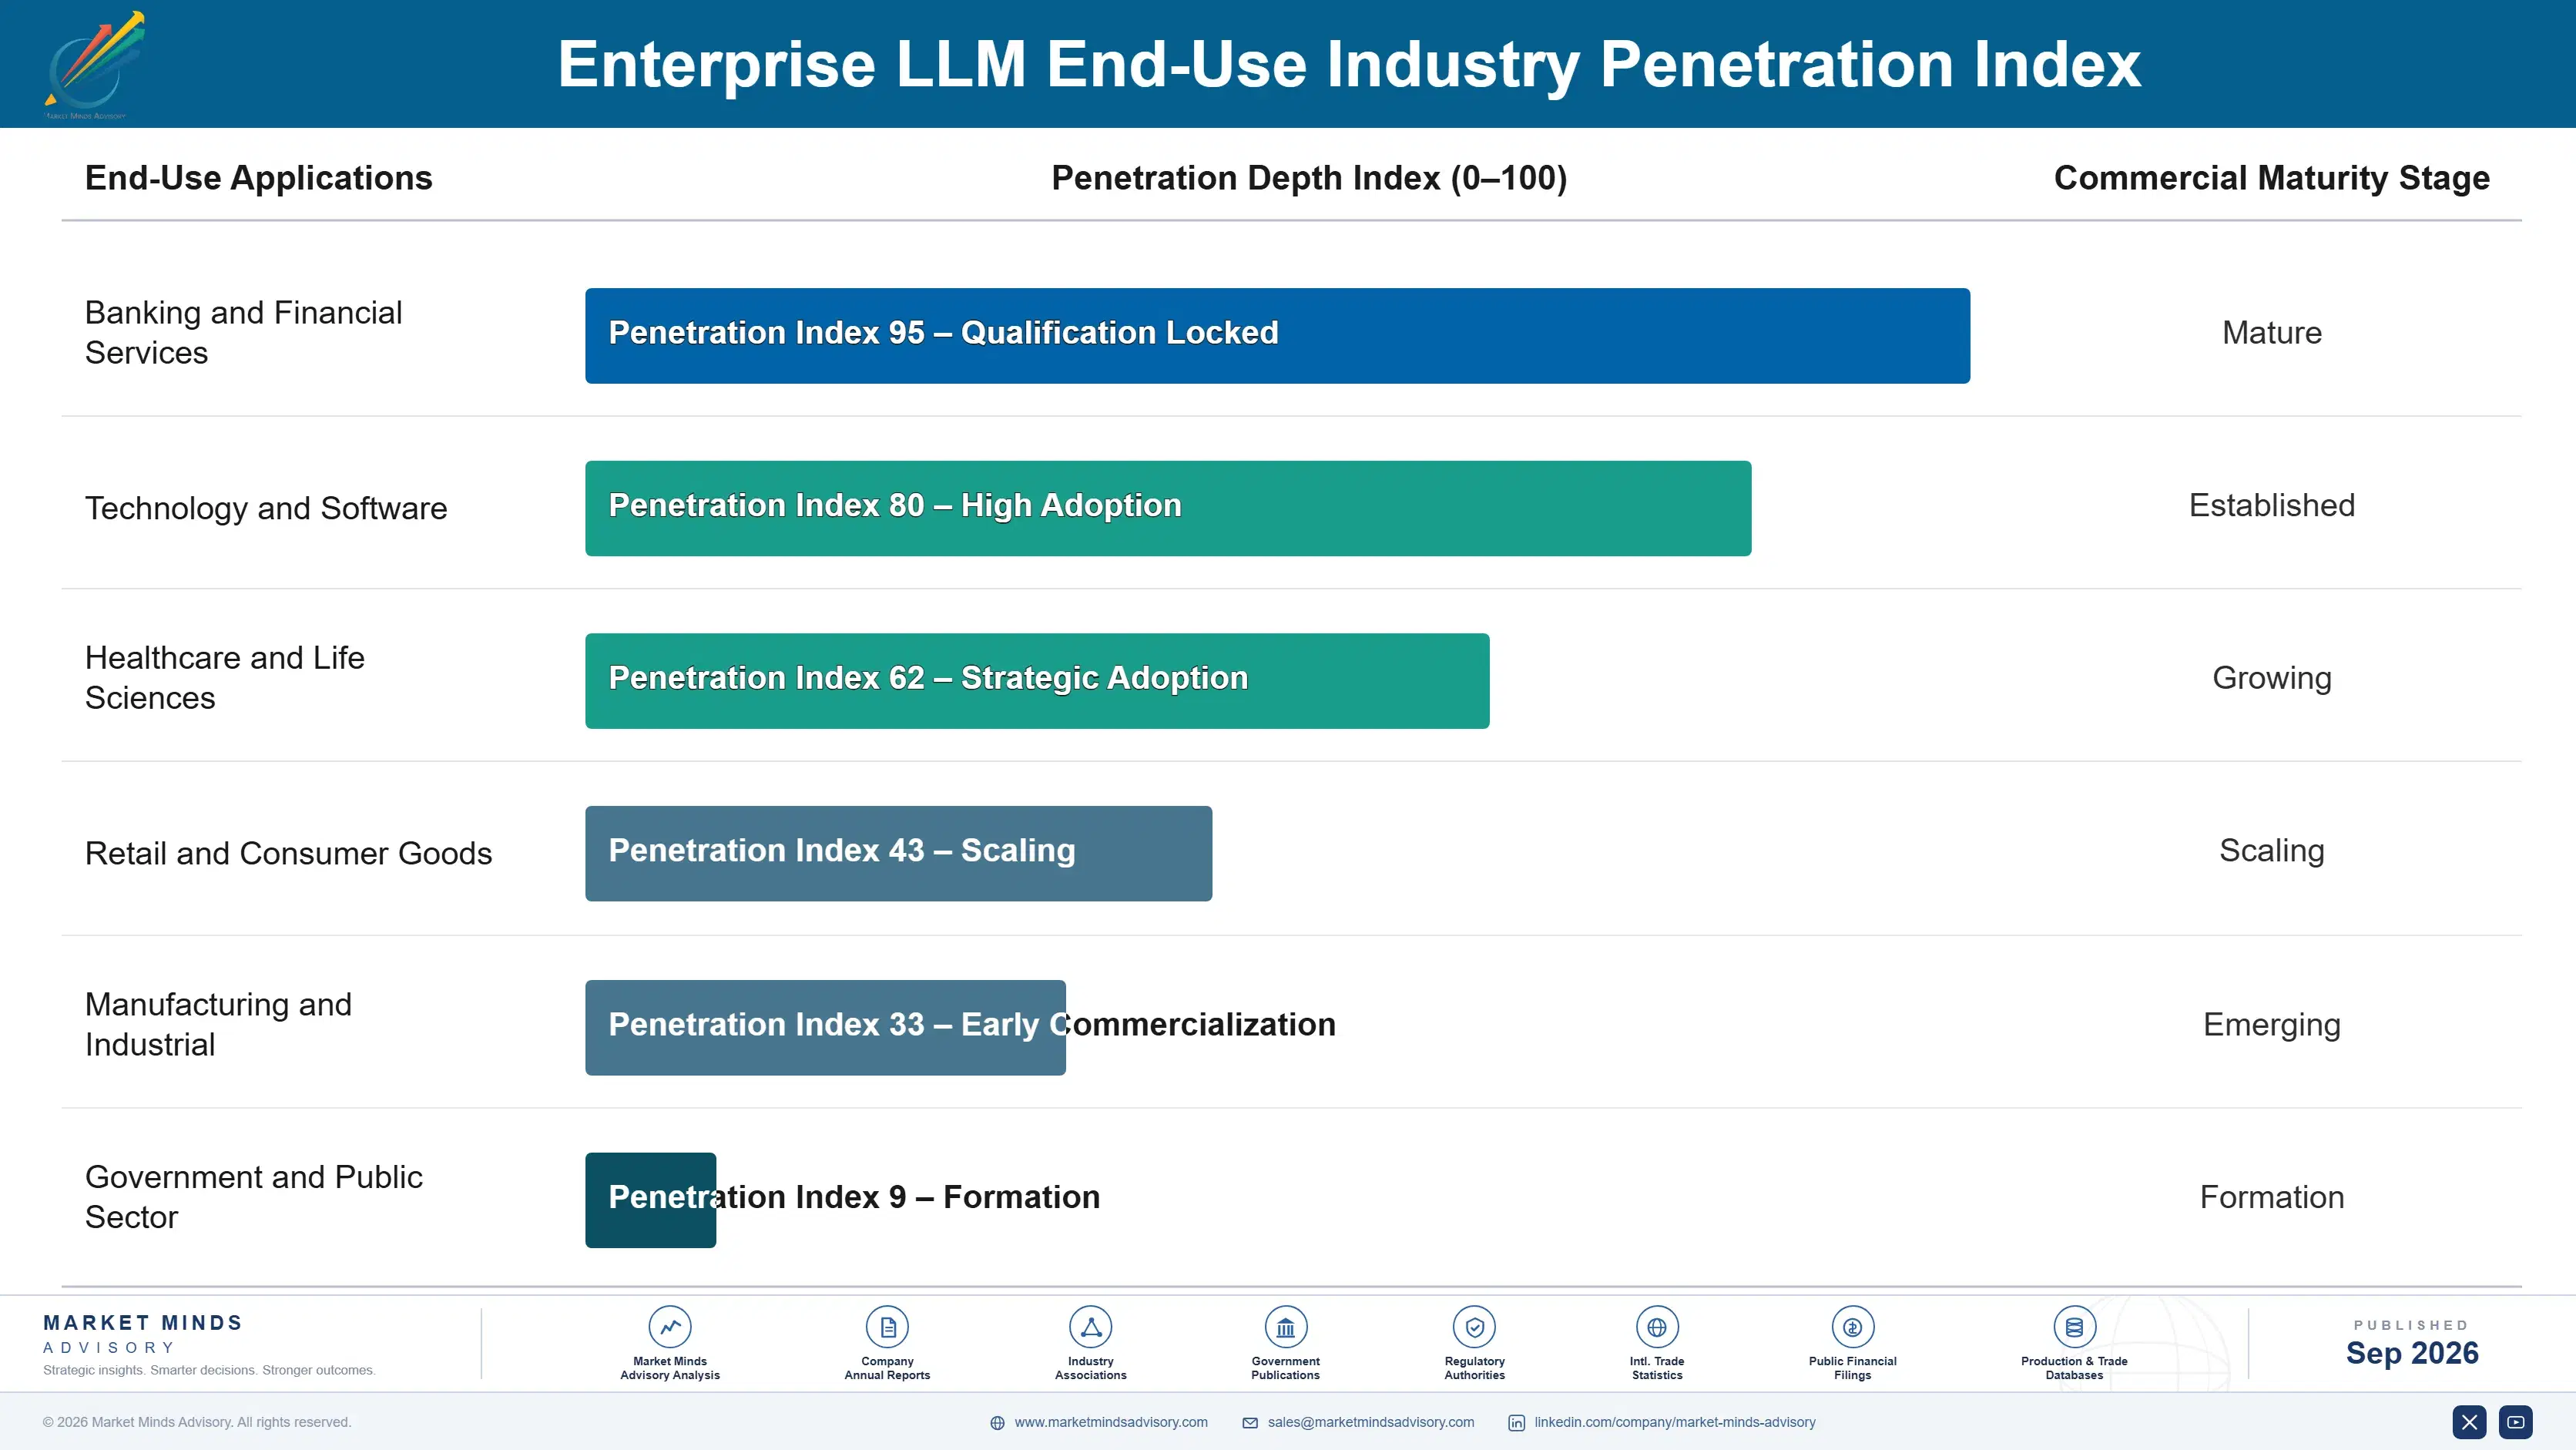
Consumption repeats reliably once a workload is embedded in a process people use, and it declines in value terms even as it holds in volume terms because unit prices keep falling. That is an unusual annuity: the customer stays, the usage holds, and the revenue shrinks unless new applications appear. Suppliers depend on customers continuing to find uses, which is far less control than subscription providers are used to.
Adoption depth varies sharply by function. Software engineering uses models most intensively and most measurably, since output quality can be evaluated immediately. Customer operations follows, with high volume and modest value per call. Legal, compliance and research functions use them selectively for difficult tasks that justify frontier pricing. Finance and regulated decisioning adopt slowly because explainability requirements are unresolved. Sales and marketing adopt broadly and shallowly, producing volume without durability.

The buyer has shifted from innovation teams toward platform engineering and procurement. Early consumption came from teams experimenting with capability and paying published rates. Today a platform function owns the routing layer, holds the consumption data and negotiates against several providers with real substitution available. Suppliers selling capability demonstrations address an audience that no longer decides where traffic goes.
enterprise-llm-market-end-use-penetration-index-1788419637352

Where Value Holds Here

These are among the four positions where our research anticipates prominent divergence between winners and laggards over the coming forecast period. Each is grounded in the demand model, the regulatory perimeter, and the announced capacity pipeline.
01 / ROUTING LAYER CAPTURE

Own the layer between applications and models

Around 56% of production deployments already route across providers, and whoever operates that layer holds the consumption data, the fallback logic and all the negotiating position that follows from both. The position deflates roughly 3 times more slowly than model access because its value is operational rather than a commodity output. The difficulty is that credible routing sometimes means sending traffic to a competitor, and suppliers unwilling to do exactly that will never be trusted with the layer at all.
02 / OPEN-WEIGHT OBLIGATION SELLING

Charge for indemnity and support, not for weights

Enterprises obtain open model weights for nothing and cannot obtain indemnification, validated builds, security patching or contractual accountability, which is precisely the gap that they will pay real money to close. That business is now growing at 26.4% and already covers 34% of total enterprise workload, resembling enterprise open-source support far more than any licensing model. Frontier providers dismissing it as a low-end concern are conceding the routine volume that funds their serving infrastructure, without ever seriously contesting it at all.
03 / PROPRIETARY DATA CUSTOMISATION

Build on inputs competitors cannot possibly replicate

When every enterprise reaches the same models, outputs differ only where inputs do, which makes customisation against proprietary data the one single differentiator that competitors simply cannot copy. That work grows at 19.4% and resists deflation because it is specific engineering rather than a commodity output, and suppliers building the capability capture roughly 2 times the account value of those supplying model access alone. It requires delivery capability that pure model providers generally lack, and partnerships have rarely substituted for it convincingly.
04 / JURISDICTIONAL POSITION PRICING

Sell where cheaper alternatives are simply not permitted

Regulated buyers required to keep inference inside a defined jurisdiction cannot use shared public endpoints whatever contractual assurances accompany them, which removes the cheap comparison entirely rather than merely disadvantaging it. Sovereign and regionally hosted services grow at 20.8% and sustain prices roughly 4 times commodity token rates for identical underlying capability. The capacity is expensive to build and the demand concentrates in large commitments, and it is the one position in this market where deflation genuinely does not apply.

Engagement Snapshot From the Field

A live engagement with an industry participant carrying material or product regulatory and market exposure ahead of a defining policy shift, showing how our research translates into a defensible multi-year portfolio strategy.
MARKET MINDS ADVISORY · CLIENT ENGAGEMENT SUMMARY
Enterprise LLM Producer Strategic Portfolio Review and Transition Roadmap 2026·Investment Scenario on Enterprise LLM Exposure Evaluation 2025-26
CLIENT PROFILE
A global banking group operating in 31 countries with roughly 78,000 employees (client-reported, unverified by MMA), running model workloads across software engineering, customer operations, compliance monitoring and research after two years of largely uncoordinated departmental adoption. Annual model spending had reached approximately USD 34 million with no central view of what was being consumed or by whom.
STRATEGIC CHALLENGE
Procurement was negotiating a multi-year commitment with a single provider at a discount contingent on volume, while the technology function argued that dependency was the greater risk (client-reported, unverified by MMA). Nobody could establish what proportion of workloads genuinely required frontier capability, and data residency obligations in seven jurisdictions had not been reconciled against where inference was actually running.
MMA APPROACH
MMA instrumented consumption by workload type rather than by business unit, which the group had never done, and evaluated a representative sample of tasks against smaller and openly licensed models to establish where capability was actually required. We interviewed 21 internal stakeholders, five providers and two supervisory advisers. Provider evaluation weighted jurisdictional coverage and contractual obligations ahead of benchmark performance throughout.
KEY FINDINGS
  1. Roughly 81% of consumed tokens went to summarisation, extraction and drafting tasks where openly licensed models performed indistinguishably in blind evaluation against the frontier alternative.
  2. Inference for four of seven regulated jurisdictions was running outside the required boundary, an exposure procurement had not identified in any prior review.
  3. The proposed volume commitment would have locked pricing above where spot rates were already trending, given how fast per-unit costs had been falling.
  4. No routing layer existed, so substituting any provider would have required coordinated application changes across 40 separate internal systems and their owners.
CLIENT PROFILE
A global banking group operating in 31 countries with roughly 78,000 employees (client-reported, unverified by MMA), running model workloads across software engineering, customer operations, compliance monitoring and research after two years of largely uncoordinated departmental adoption. Annual model spending had reached approximately USD 34 million with no central view of what was being consumed or by whom.
STRATEGIC CHALLENGE
Procurement was negotiating a multi-year commitment with a single provider at a discount contingent on volume, while the technology function argued that dependency was the greater risk (client-reported, unverified by MMA). Nobody could establish what proportion of workloads genuinely required frontier capability, and data residency obligations in seven jurisdictions had not been reconciled against where inference was actually running.
MMA APPROACH
MMA instrumented consumption by workload type rather than by business unit, which the group had never done, and evaluated a representative sample of tasks against smaller and openly licensed models to establish where capability was actually required. We interviewed 21 internal stakeholders, five providers and two supervisory advisers. Provider evaluation weighted jurisdictional coverage and contractual obligations ahead of benchmark performance throughout.
KEY FINDINGS
  1. Roughly 81% of consumed tokens went to summarisation, extraction and drafting tasks where openly licensed models performed indistinguishably in blind evaluation against the frontier alternative.
  2. Inference for four of seven regulated jurisdictions was running outside the required boundary, an exposure procurement had not identified in any prior review.
  3. The proposed volume commitment would have locked pricing above where spot rates were already trending, given how fast per-unit costs had been falling.
  4. No routing layer existed, so substituting any provider would have required coordinated application changes across 40 separate internal systems and their owners.
RECOMMENDED STRATEGY
Phase 1: Build a routing layer before signing any commitment, so that provider substitution becomes a configuration change rather than an application change programme. Phase 2: Move routine summarisation and extraction workloads to indemnified open-weight deployment, reserving frontier capability strictly for genuinely difficult reasoning and code generation work. Phase 3: Contract regionally hosted capacity for the four exposed jurisdictions, accepting higher unit rates where residency obligations remove any cheaper alternative.
OUTCOME
The group declined the multi-year commitment and reduced annual model spending to roughly USD 21 million while consumption volumes rose (client-reported, unverified by MMA). Jurisdictional exposure was closed within five months, and provider substitution now requires only a configuration change rather than an engineering programme.

Frequently Asked Questions

Foundational context covering the market sizes, CAGR, scope, country, region and competition that inform every finding below. This section is provided to cover basics and most often pre-purchase conversations, answered from the MMA Primary Research Dataset.

What is the current size of the Enterprise LLM Market?

The market was worth USD 9.5 billion in 2025 and reaches USD 11.17 billion in 2026. Value grows far more slowly than consumption because cost per unit of capability keeps falling.

How large will the Enterprise LLM Market be by 2036?

MMA forecasts USD 56.50 billion by 2036, an expansion of 5.06 times over the forecast period. That represents USD 45.33 billion of incremental annual revenue against 2026.

What is the CAGR for the Enterprise LLM Market 2026 to 2036?

The base case is 17.6% compound annual growth, with a bull case at 18.8% and a bear case at 16.2%. Whether volume keeps outrunning price deflation separates the scenarios.

Which segment is growing fastest?

Open-weight model support and licensing grows at 26.4%, half again the market rate of 17.6%. Enterprises pay for indemnification, validated builds and support rather than for the weights themselves.

Who are the major companies in the Enterprise LLM Market?

Microsoft, Google, Amazon Web Services, OpenAI and Anthropic lead on measured enterprise model and serving revenue. Together they hold roughly 71%, though routing layers make those positions less secure than the figure suggests.

Which country is growing fastest?

India grows fastest at 23.8%, as capability centres run workloads for enterprises headquartered elsewhere and domestic adoption expands across financial services, telecommunications and government programmes.

Report Segmentation Architecture

The full report scope spans multiple orthogonal segmentation dimensions, with cross-tabulated demand data provided for each dimension pair. Coverage extends further to regional breakdowns, trend trajectories, and the competitive detail needed to support segment-level decision-making.

By Primary Market Dimension

  • Public API Token Consumption
  • Dedicated and Private Model Deployment
  • Open-Weight Model Support and Licensing
  • Model Customisation and Fine-Tuning
  • Inference Serving and Routing Platforms
  • Sovereign and Regionally Hosted Services

By End-Use Industry

  • Banking and Financial Services
  • Technology and Software
  • Healthcare and Life Sciences
  • Retail and Consumer Goods
  • Manufacturing and Industrial
  • Government and Public Sector

By Commercial Dimension

  • Cloud Agreement Consumption
  • Direct Provider Contracts
  • Capacity Commitment Arrangements
  • Systems Integrator Delivery
  • Sovereign Programme Procurement
  • Open Source Support Subscriptions

By Region

  • North America
  • Western Europe
  • East Asia
  • South Asia and Pacific
  • Latin America
  • Middle East and Africa
  • Eastern Europe

Scope, Methodology, and Coverage

Every figure in this report is reproducible from documented input assumptions. The scope below maps the historical period, the forecast horizon, the segmentation dimensions, and the countries covered, alongside the underlying primary and qualitative methodology.
Historical Period
2020 to 2025
Forecast Period
2026 to 2036
Base Year
2025 (USD billions; MMA Primary Research Dataset, September 2026)
Market Definition
This market covers large language model capability supplied to enterprise buyers, spanning public application interface token consumption, dedicated and private model deployment, open-weight model support and licensing, model customisation and fine-tuning, inference serving and routing platforms, and sovereign or regionally hosted model services. Revenue is measured as model access, serving capacity and directly attributable customisation and support value at supplier level. Consumer subscriptions, accelerator and networking hardware, model training infrastructure, agent development frameworks, general cloud compute and storage, and downstream software applications embedding models are excluded.
Quantitative Units
USD billions, model, serving and attributable services revenue
Segmentation Dimensions
Consumption model, end-use industry, commercial channel, region
Regions Covered
North America, Western Europe, East Asia, South Asia and Pacific, Latin America, Middle East and Africa, Eastern Europe
Countries Covered
United States, Canada, United Kingdom, Germany, France, Netherlands, Switzerland, Sweden, Spain, Italy, Ireland, Poland, Czechia, China, Japan, South Korea, Taiwan, Singapore, India, Australia, Brazil, Mexico, Chile, United Arab Emirates, Saudi Arabia, Qatar, South Africa
Key Companies Profiled
Microsoft, Google, Amazon Web Services, OpenAI, Anthropic, Meta, Mistral AI, Cohere, IBM, Databricks, Snowflake, NVIDIA, Alibaba Cloud, Baidu, Together AI, Fireworks AI, Hugging Face, Groq, Oracle, SAP
Quantitative Methodology
Primary survey, n=3,800 respondents, Q4 2025, six countries; demand-side model with trade association cross-validation
Qualitative Methodology
47 expert interviews, Q4 2025; applied to validate demand model assumptions, identify emerging dynamics, and assess competitive positioning
Report Format
PDF and XLSX data workbook (Word format preview document)
Publisher
Market Minds Advisory
Report Code
MMA-2026-TEC-831
Published
September 2026
Contact
sales@marketmindsadvisory.com | www.marketmindsadvisory.com

Purchase the full Enterprise LLM Market Report (2026 to 2036).

The full MMA report examines why enterprise model revenue grows far more slowly than consumption does, and where value is migrating as raw model access deflates. It sizes the market to 2036 across six consumption models, seven regions and 27 countries, with segment growth rates and regional demand mechanisms set out in full. Competitive analysis covers 20 suppliers assessed on measured enterprise model and serving revenue, including moat and risk assessment for the two leaders. The report quantifies serving cost structure, deflation exposure by layer, and margin architecture across three portfolio tiers. It closes with four strategic verdicts and an anonymised banking group consumption engagement.
Six consumption models sized to 2036
Seven regions with demand mechanism analysis
Twenty suppliers on consistent revenue basis
Serving cost and deflation exposure benchmarks
Margin architecture across three portfolio tiers
Anonymised banking group model consumption engagement

Built For The People Who Decide

From boardroom strategy to bench-side execution, this report is read cover-to-cover by leaders shaping the next decade of their industry, turning demand scenarios, market dynamics and valuation benchmarks into decisions.
CXOs/ Presidents/ VPs/ Managers
M&A and Corporate Development
Strategy Teams and R&D Heads
Procurement and Product Directors
Regulatory and Compliance Leaders
Investor Relations and Equity Analysts