Market Minds Advisory
Enterprise Intellectual Property (IP) Management Software Market

Enterprise Intellectual Property (IP) Management Software Market: Enterprise IP Management Software: Deadline Risk, Annuity Economics and the Analytics Nobody Renews

One missed patent office deadline can extinguish a valuable right permanently, which makes docketing almost impossible to displace and everything else sold alongside it a great deal easier to cancel.

Lead Analyst

Published

September 2026

Make Smarter Decisions with Customized Research Insights

Request a free sample report and evaluate market opportunities, growth trends, and competitive dynamics relevant to your business needs.

2025 MARKET VALUE$2.1BMarket Size 2025
2036 FORECAST VALUE$5.7BBase Case , 2026 to 2036
CAGR 2026 TO 20369.4 %Bull 10.6% / Bear 8.2%
INCREMENTAL OPPORTUNITY$3.4BNet 10- year value creation
EXPANSION MULTIPLE2.46x2036 value over 2026 base
Strategic Levers
M&A Pipeline
Regional Outlook
Country Rankings
Competitive Intelligence
Segmental Deep-dive
Call-Us : 91 93563 13602

Executive Snapshot and Market Trajectory.

Only about 4% of corporate IP departments change docketing provider in a given year, and the reason is not satisfaction. A missed patent office date can extinguish a right permanently, and nobody volunteers to carry that risk during a migration.
That asymmetry runs through the whole market. Deadline management is untouchable and everything sold beside it renews at 71% or worse, which is why growth has moved to the one thing finance actually cares about. IP spend and outside counsel management grows at 14.1%, half again the market rate of 9.4%, because external firms consume 62% of a corporate IP budget. North America takes 36% of spending despite filing far fewer applications than East Asia.
Concentration sits near 58% across the top five on measured software and attributable services revenue, following a decade in which the largest players bought most of the independents. The cash generation behind that consolidation was never software. It was annuity payment handling, where 44% of renewals now flow through external providers and where margin depends on foreign exchange and float rather than on product. Transparent-fee competitors are making that arithmetic visible.
Market Definition
This market covers software used by corporate intellectual property departments and law firms to manage patent, trademark and design portfolios, spanning docketing and prosecution workflow, annuity and renewal management, invention disclosure and harvesting, portfolio analytics and valuation, licensing and royalty management, and IP spend and outside counsel management. Revenue is measured as software subscription and attributable service value. Official patent office fees paid on behalf of clients, patent search databases sold standalone, legal services, translation services and general contract lifecycle management are excluded.
Base Year Value
$2.1B in 2025 (MMA Primary Research Dataset, September 2026)
Forecast Period
2026 to 2036, eleven discrete annual values
CAGR
9.4% base case. Bull 10.6%. Bear 8.2%.
Fastest Growth Segment
IP Spend and Outside Counsel Management: 14.1% CAGR
Fastest Growth Country
India: 13.6% CAGR
Fastest Growth Region
South Asia and Pacific: 11.4% CAGR
Largest Region
North America: 36% of 2025 global value
Market Leaders
Clarivate, Anaqua, Questel, Dennemeyer and LexisNexis Intellectual Property lead on measured IP management software and attributable services revenue. Source: MMA Primary Research Dataset, July 2026.
Primary Survey
n=3,800 procurement and R&D decision-makers, Q4 2025, six countries
Methodology
Demand-side build-up, cross-validated against public data, 47 expert interviews

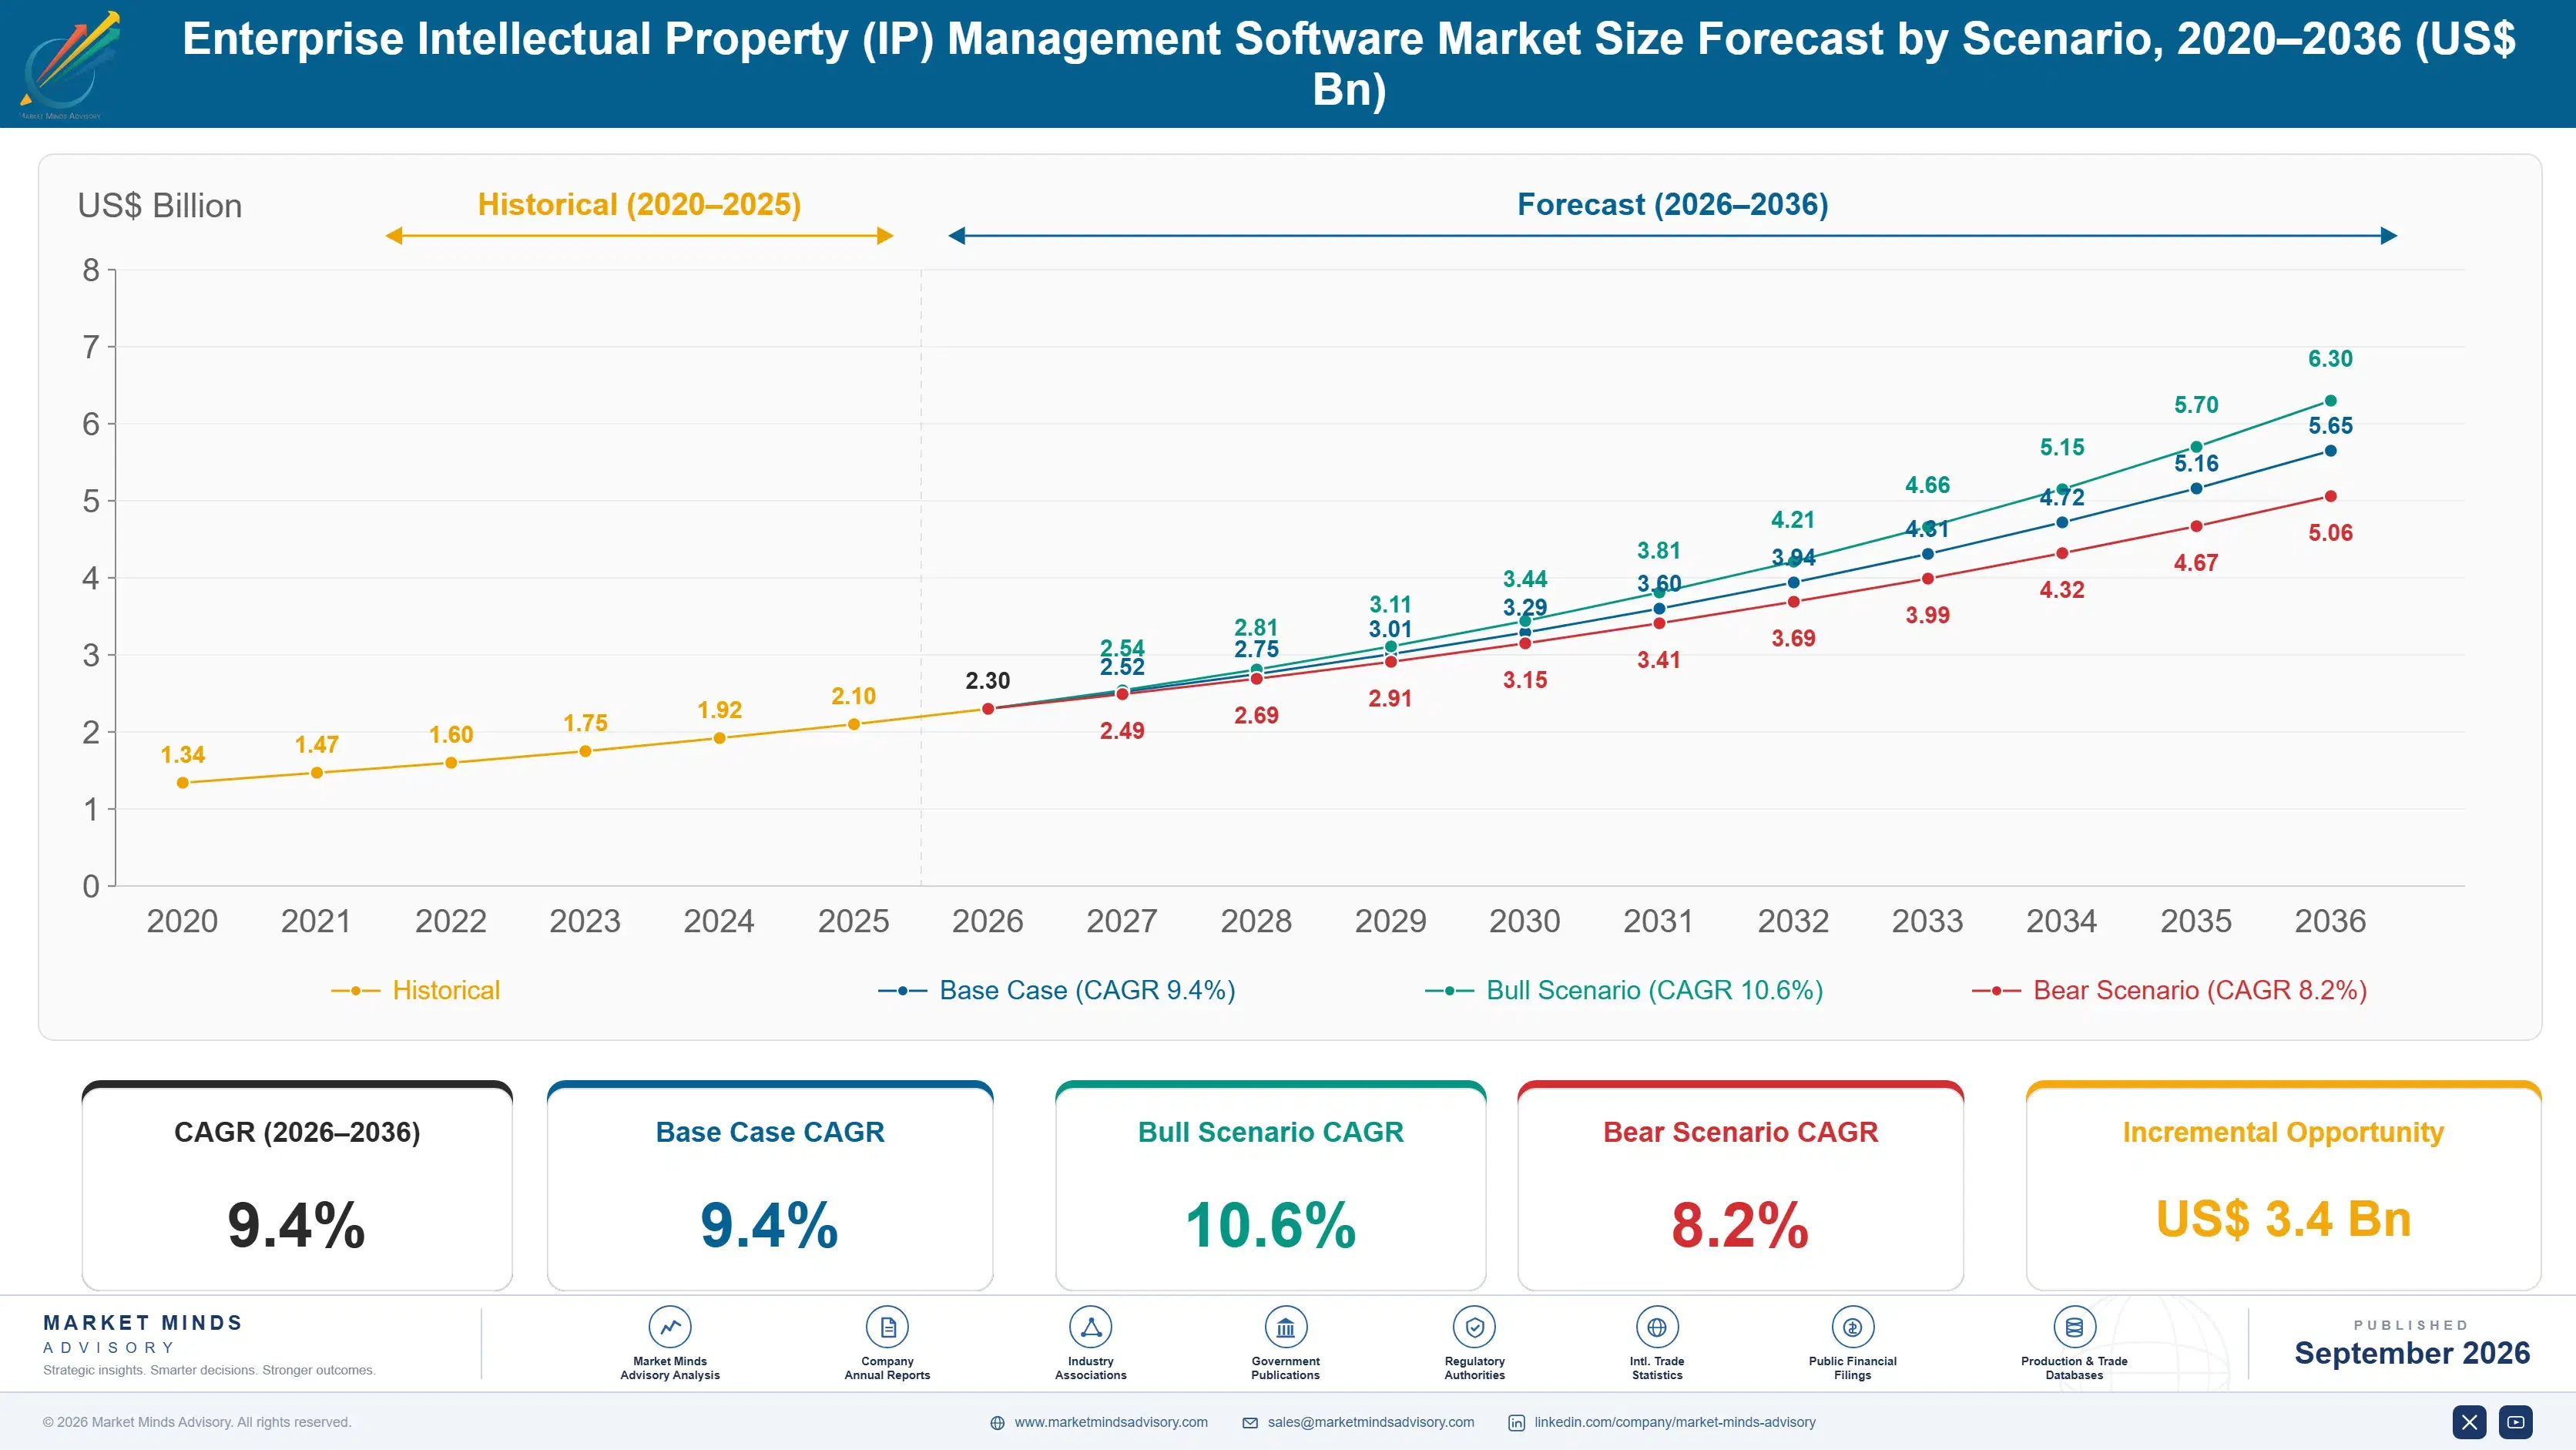
Enterprise Intellectual Property (IP) Management Software Market Forecast Scenarios

enterprise-intellectual-property-ip-management-sof-size-forecast-scenario-1788421725954
Growth ran at 8.4% from 2020 to 2025 and most of it came from consolidation rather than from expansion. The largest providers acquired independent docketing systems, annuity services firms and analytics tools, and repriced the combined installed base. Underlying seat growth was modest, since corporate IP departments were under headcount pressure and nobody added staff to justify licences.
The base case at 9.4% rests on three mechanisms. Outside counsel spending is the largest line in a corporate IP budget at roughly 62%, and any tool that demonstrably reduces it is funded by finance rather than by the IP department, which changes the budget and the urgency together. Portfolio pruning under cost pressure requires analytics supporting abandonment rather than filing. Third, IP work is migrating to lower-cost delivery centres, which requires workflow software that supports distributed handling.
The bull case at 10.6% assumes automated drafting and prior art capability materially reduces outside counsel hours, releasing budget that flows back into software and internal tooling. The bear case at 8.2% is that corporate IP departments keep shrinking, portfolios keep being pruned and seat counts fall alongside them. Departmental headcount most directly sets this market's size, and it is not rising.

Deadlines Are Sticky and Everything Else Is Not

The commercial foundation of this market is fear rather than capability. Patent and trademark systems run on absolute deadlines, and missing one can extinguish a right that cost hundreds of thousands to obtain, with a negligence claim behind it. Software that manages those dates therefore gets replaced at a rate of roughly 4% a year, and those who do switch are usually forced by an acquisition.
TOP FIVE CONCENTRATION58%Concentrated following a decade of sustained platform consolidation
DOCKETING SWITCHING RATE4%Corporate departments changing docketing provider in a year
OUTSIDE COUNSEL SPEND SHARE62%Portion of corporate budget paid to external law firms
ANALYTICS RENEWAL RATE71%Portfolio analytics subscriptions renewed after the initial term
AVERAGE PORTFOLIO SIZE1,840Active patent families held by a large corporate department
EXTERNAL ANNUITY SHARE44%Renewal fees handled by external providers rather than internally
Everything sold alongside it behaves completely differently. Portfolio analytics, valuation and competitive landscaping renew at around 71%, and the shortfall reflects a purchasing pattern rather than a product failure: bought during a strategic review, used hard for a quarter, then left alone. Vendors keep selling them on high attach rates and keep discovering that attachment and retention are separate problems.
The money underneath all of it is annuity payment handling. Providers pay official renewal fees to patent offices on a client's behalf, and around 44% of corporate renewals flow through them. Margin comes from service fees, currency conversion and float rather than from software, and it generated the cash that funded a decade of acquisitions. It is also under sustained pricing attack, rarely discussed alongside the software it supports.
"Everybody in this market sells analytics and everybody makes their money on renewal payments and docketing that nobody dares replace. The gap between what is presented in a pitch and what appears in the accounts is the widest I see in enterprise software."
Director, Legal and Intellectual Property Technology Practice · MMA Technology Practice · September 2026

Market Trends

Finance Takes Control of the Intellectual Property Budget

External law firms consume roughly 62% of a corporate IP budget, which makes the department one of the larger discretionary spending lines in a legal function and an obvious target when costs are reviewed. Chief financial officers have begun requiring visibility into matter-level spend, rate compliance and forecast commitments that IP departments could not previously produce. Spend and outside counsel management grows at 14.1%, faster than anything else here, because it is funded from a budget that is not the IP department's own. The buyer and the user are different people, which changes the sale entirely.
Market Impact: Switching runs at 4% yearly

Portfolio Pruning Replaces Filing Growth as the Analytical Question

For two decades portfolio analytics answered which inventions to file and where. Cost pressure inverted the question, and departments now use the same tools to decide what to abandon, since annuity fees on a large portfolio compound into a substantial annual commitment. Average corporate portfolios run around 1,840 active families, and pruning decisions carry real money. The analytical requirement is different: abandonment needs evidence a business unit will accept, not a competitive landscape chart. Vendors built for filing strategy have adapted slowly and their renewal rates show it clearly. Renewal fees compound quietly until somebody totals them.
Market Impact: India grows at 13.6% annually

Market Opportunities and Growth Drivers

Deadline Liability Makes Docketing Effectively Irreplaceable

A missed response deadline at a patent office can abandon an application permanently, and there is no discretionary relief in most jurisdictions once the period has run. That makes docketing a professional liability system rather than a productivity tool, and it explains a switching rate near 4% a year across corporate departments. Migration risk is concentrated precisely where the consequence is worst, since dates must transfer completely and be verified against office records. Vendors holding docketing hold a position that product quality alone would never have secured for them. Nobody volunteers to carry that risk.
Market Impact: Renewal stalls near 71%

Distributed Delivery Requires Workflow Software Departments Lacked

Corporate IP work is increasingly performed across time zones, with formalities, docketing support and first-pass drafting handled from lower-cost delivery centres while decisions stay with a small onshore team. That model needs workflow, task routing and audit capability that departments running on shared drives and email never required. India is the fastest-growing country market at 13.6% partly for this reason, since delivery capacity and domestic filing growth are expanding together. The software requirement follows the operating model rather than any strategic decision about technology. Shared drives and email cannot support work split across time zones and entities.
Market Impact: Departments flat for 10 years

Market Restraints and Challenges

Analytics Get Bought Once and Abandoned Quietly

Portfolio analytics and valuation tools renew at around 71%, and the shortfall reflects how they are used rather than how they perform. A department buys during a strategic review, uses the tool intensively for one quarter and then returns to the work that has deadlines attached to it. The root cause is that analytical questions are episodic while docketing is continuous. Vendors mitigate by embedding analytics into renewal decisions and invention review workflows, so the tool appears inside recurring processes rather than waiting to be opened. Episodic use and continuous pricing do not fit together.
Market Impact: Counsel takes 62% of budget

Departmental Headcount Sets the Ceiling on Seat Growth

Corporate IP departments have been shrinking or flat for most of a decade, and seat-based software cannot grow against a falling user count however good the product becomes. The root cause is that IP is a cost centre whose output is difficult to attribute to revenue, which makes it a reliable target in every efficiency programme. Vendors are mitigating by pricing against portfolio size or matter volume rather than users, and by selling to finance and procurement budgets that are not constrained by IP department headcount at all. Portfolio-based pricing grows even as the department shrinks around it.
Market Impact: Portfolios average 1,840 families
3 additional market trends, 4 additional growth drivers, and 2 additional restraints and challenges are covered in the full report. Contact sales@marketmindsadvisory.com to access the complete intelligence.

Segment CAGR and Growth Architecture

Segmentation follows the function performed, because each function carries a different level of consequence if it fails and therefore a completely different renewal profile. Anything attached to a legal deadline or a payment obligation is close to permanent, while anything supporting a periodic decision behaves like a project purchase and prices accordingly. Renewal profiles differ enormously.
enterprise-intellectual-property-ip-management-sof-market-share-analysis-1788421726515

IP Spend and Outside Counsel Management

Spend management is the fastest part of this market at 14.1%, half again the market rate of 9.4%, and it grows because it is funded from somewhere other than the IP department. External firms consume roughly 62% of a corporate IP budget, and finance functions now expect matter-level visibility, rate compliance checking and accrual forecasting that departments running on invoices and spreadsheets cannot produce. The buyer is a finance or legal operations leader rather than an IP manager, which shortens the sale and raises the price ceiling considerably. It is also the one part of this market where the return is arithmetic rather than argued, and buyers can verify it within a quarter.
CAGR 14.1%

Portfolio Analytics and Valuation

Analytics grows at 12.4% on a demand shift rather than a product improvement, since departments now use these tools to decide what to abandon rather than what to file. Annuity fees on portfolios averaging 1,840 active families escalate steeply in later years, which makes pruning a genuine financial exercise requiring evidence a business unit will accept. That is a different analytical product from competitive landscaping, and vendors built for filing strategy have adapted slowly. Renewal at around 71% remains the weakest of any segment here, because analytical questions arrive episodically while the tools are priced as though they were used continuously. Vendors embedding analytics into renewal workflow lift retention well above 90%.
CAGR 12.4%
Full segment breakdown across 6 segments available in the complete report.

Regional Architecture and Country Demand Map

Software spending follows corporate IP department budgets rather than filing volumes, and the two point in different directions. East Asia files far more applications than anywhere, while North American and European corporates spend far more managing what they hold. Filing counts predict very little here.

North America

North America holds 36%, above the regional band, and the justification is spending rather than filing: American corporates run the largest IP departments, pay the highest outside counsel rates anywhere and conduct most of the world's patent licensing and litigation, all of which requires management infrastructure that filing volume alone does not. Technology, pharmaceutical and medical device portfolios dominate. Litigation exposure makes docketing accuracy a board-level concern rather than an administrative one. Law firms are a substantial second buyer group here, larger relative to corporates than in any other region, and they buy differently on both features and price. Regional growth at 8.6% is modest, since the base is mature and departmental headcount has been falling steadily throughout the period.
Share: 36% | CAGR: 8.6% (2026 to 2036)

Western Europe

European demand grows at 7.8%, the slowest of the major regions, on corporate portfolios that are mature and increasingly being pruned rather than expanded. German industrial and Swiss pharmaceutical portfolios are among the largest anywhere and generate substantial annuity management activity across many national validations. The unitary patent arrangement has simplified some renewal handling while adding a strategic decision that departments now need tooling to evaluate. British and Dutch corporates were early adopters of spend management. Language and national office variety across the region makes formalities workflow considerably more complex than in single-jurisdiction markets. Regional growth at 7.8% is the slowest anywhere, reflecting mature portfolios under active pruning rather than any lack of sophistication among the buyers.
Share: 26% | CAGR: 7.8% (2026 to 2036)
Regional intelligence for 5 additional markets available in the complete report: East Asia, South Asia and Pacific, Latin America, Middle East and Africa, Eastern Europe. Contact sales@marketmindsadvisory.com.
enterprise-intellectual-property-ip-management-sof-country-cagr-analysis-1788421727042

Where This Software Actually Earns

Docketing is nearly impossible to displace and equally difficult to grow, since seat counts follow shrinking departments. The revenue that expands comes from budgets outside the IP department, from renewal handling economics that have nothing to do with software, and from embedding analytics into processes that recur. Growth has to come from somewhere other than the department itself.

Sell Into the Finance Budget Not the Department

Corporate IP departments have been flat or shrinking for a decade, which caps anything priced per seat regardless of product quality. Outside counsel spending at roughly 62% of the budget is a finance problem with a verifiable return, and tools addressing it are funded from legal operations or procurement budgets that IP headcount does not constrain. Vendors selling there achieve contract values around 3 times those achievable from IP department budgets, and the sales cycle is shorter because the return can be demonstrated within a quarter rather than argued. Finance verifies rather than debates.
Market Impact: Achieves 3 times the typical departmental contract value

Price Against Portfolio Size Not User Seats

Seat pricing ties revenue directly to headcount that is falling for reasons entirely outside the vendor's influence, which is a poor structure in a market where portfolios of around 1,840 families are managed by ever fewer people. Pricing against active families, matters or renewal volume aligns revenue with the work rather than the workers, and it grows even as departments shrink. Buyers accept it readily because it matches how they think about their own cost. Vendors that made this change years ago have materially better revenue trajectories than those that did not.
Market Impact: Aligns pricing with the 1,840 family average portfolio

Embed Analytics Inside Decisions That Recur

Portfolio analytics renews at around 71% because it is opened during a strategic review and then abandoned once the review ends. Embedding the same capability inside annuity renewal decisions and invention disclosure review puts it into a process that recurs monthly rather than one that recurs when somebody asks a question. Vendors that made that change lift analytics renewal above 90% without altering the underlying product at all. It is a packaging and workflow decision rather than a development one, which is why the improvement is available quickly. The improvement arrives in one release cycle.
Market Impact: Lifts analytics renewal above 90% overall retention levels

Defend Annuity Economics Before They Are Competed Away

Renewal payment handling generates the cash that funded a decade of consolidation, earning on service fees, currency conversion and float rather than on software, and around 44% of corporate renewals now flow through it. It is also under sustained pricing attack from transparent-fee competitors who publish what incumbents prefer not to itemise. Providers bundling renewal handling into portfolio decision workflow retain the volume at defensible margins. Those defending opaque pricing alone are losing accounts steadily to competitors who simply show buyers the arithmetic. Opacity loses accounts one procurement review at a time. Publishing first preserves the relationship.
Market Impact: Handles 44% of all corporate renewal payment volume

Who Controls the Margin Pool

Concentration sits near 58% across the top five on measured software and attributable services revenue, and it arrived through acquisition rather than through anyone winning share. The largest providers bought independent docketing systems, annuity businesses and analytics tools over a decade, funded largely by renewal cash flow. The gap between leaders and challengers is one of installed base and payment infrastructure rather than product, since smaller vendors frequently hold better analytics and better user experience.
Competition runs on three dimensions. Incumbency in docketing is first and close to decisive, since a 4% switching rate leaves most accounts uncontestable each year. Second is annuity handling economics, where transparent-fee challengers are attacking margins that were never itemised for clients. Third is finance-facing spend capability, which reaches a budget outside the department and is where growth occurs.

Two pressures are reshaping the field. Transparent renewal fee models are exposing margin structures that supported the consolidation, which threatens the cash flow behind it. Meanwhile automated drafting and prior art tools are appearing from suppliers with no docketing position at all, reaching IP departments through a route incumbents do not control. Rankings will move toward providers with finance-facing capability and defensible renewal economics.
enterprise-intellectual-property-ip-management-sof-company-positioning-matrix-1788421727565

Competitive Moat and Risk Dimensions

CLARIVATE

Moat: Installed base and renewal infrastructure

Clarivate holds one of the largest docketing installed bases alongside global annuity payment infrastructure, combining a rarely contested position with cash flow that funded years of acquisition. Its patent data assets support analytics that pure workflow vendors cannot match from their own sources. Jurisdiction scale matters in renewal handling, where local payment relationships are hard to replicate.
CLARIVATE

Risk: Renewal fee transparency pressure

A meaningful share of profit derives from renewal handling margins built on service fees, currency conversion and float that were historically not itemised for clients. Transparent-fee competitors are making those margins visible and winning volume on that basis alone. Defending those economics while selling software to the same customer creates a tension challengers do not face.
ANAQUA

Moat: Integrated corporate department workflow

Anaqua built around the corporate IP department rather than the law firm, integrating disclosure, prosecution, renewals and spend into one workflow that matches how in-house teams actually operate. That integration makes displacement difficult once a department has configured its processes around it. Strong positions among large technology and industrial portfolios provide reference credibility that shortens evaluations considerably in comparable accounts.
ANAQUA

Risk: Narrower data asset position

The company depends on licensed patent data rather than owning the underlying assets, which limits how far it can differentiate analytics against competitors that publish their own. Its law firm presence is smaller than the leader's, removing a substantial second buyer group from reach. Growth also depends on department budgets that headcount pressure has constrained for a decade.

Players Tracked

Prominent Players

Clarivate
Anaqua
Questel
Dennemeyer
LexisNexis Intellectual Property

Other Key Players

PatSnap
Wellspring
Inteum
Alt Legal
IPzen
Minesoft
Patrix
IP.com
Evalueserve
Sagacious IP
IPAN
Computer Packages Incorporated
Aistemos
Patentfield
Ambercite

Recent Developments

APRIL 2025

Transparent-fee renewal providers win corporate annuity mandates

Several large corporate portfolios moved renewal handling to providers publishing itemised service fees and currency conversion terms, following procurement reviews that examined total cost rather than headline service pricing. The moves were competitive procurement outcomes rather than any acquisition or partnership. Portfolio records themselves were unaffected.
Signal: Renewal economics that funded a decade of consolidation are now being examined by procurement rather than by legal.
SEPTEMBER 2025

Patent offices confirm further scheduled increases to renewal fee structures

Major patent offices published fee adjustments continuing the pattern of steep escalation in later renewal years, which raises the annual commitment attached to holding a large portfolio. Departments responded by formalising abandonment review rather than renewing families by default. Later-year escalation was steepest in the largest jurisdictions.
Signal: Fee escalation is converting renewal from administration into a documented decision requiring evidence and business unit input.
JANUARY 2025

Legal operations functions extend spend management into intellectual property matters

Corporate legal operations teams brought patent and trademark matters into existing outside counsel spend management platforms, applying rate compliance and accrual forecasting previously used only for litigation and general legal work. The extensions used existing platform capability rather than new procurement. Specialist vendors were not involved.
Signal: Spend capability is arriving through legal operations rather than through the intellectual property software vendors themselves.

What Delivering These Services Costs

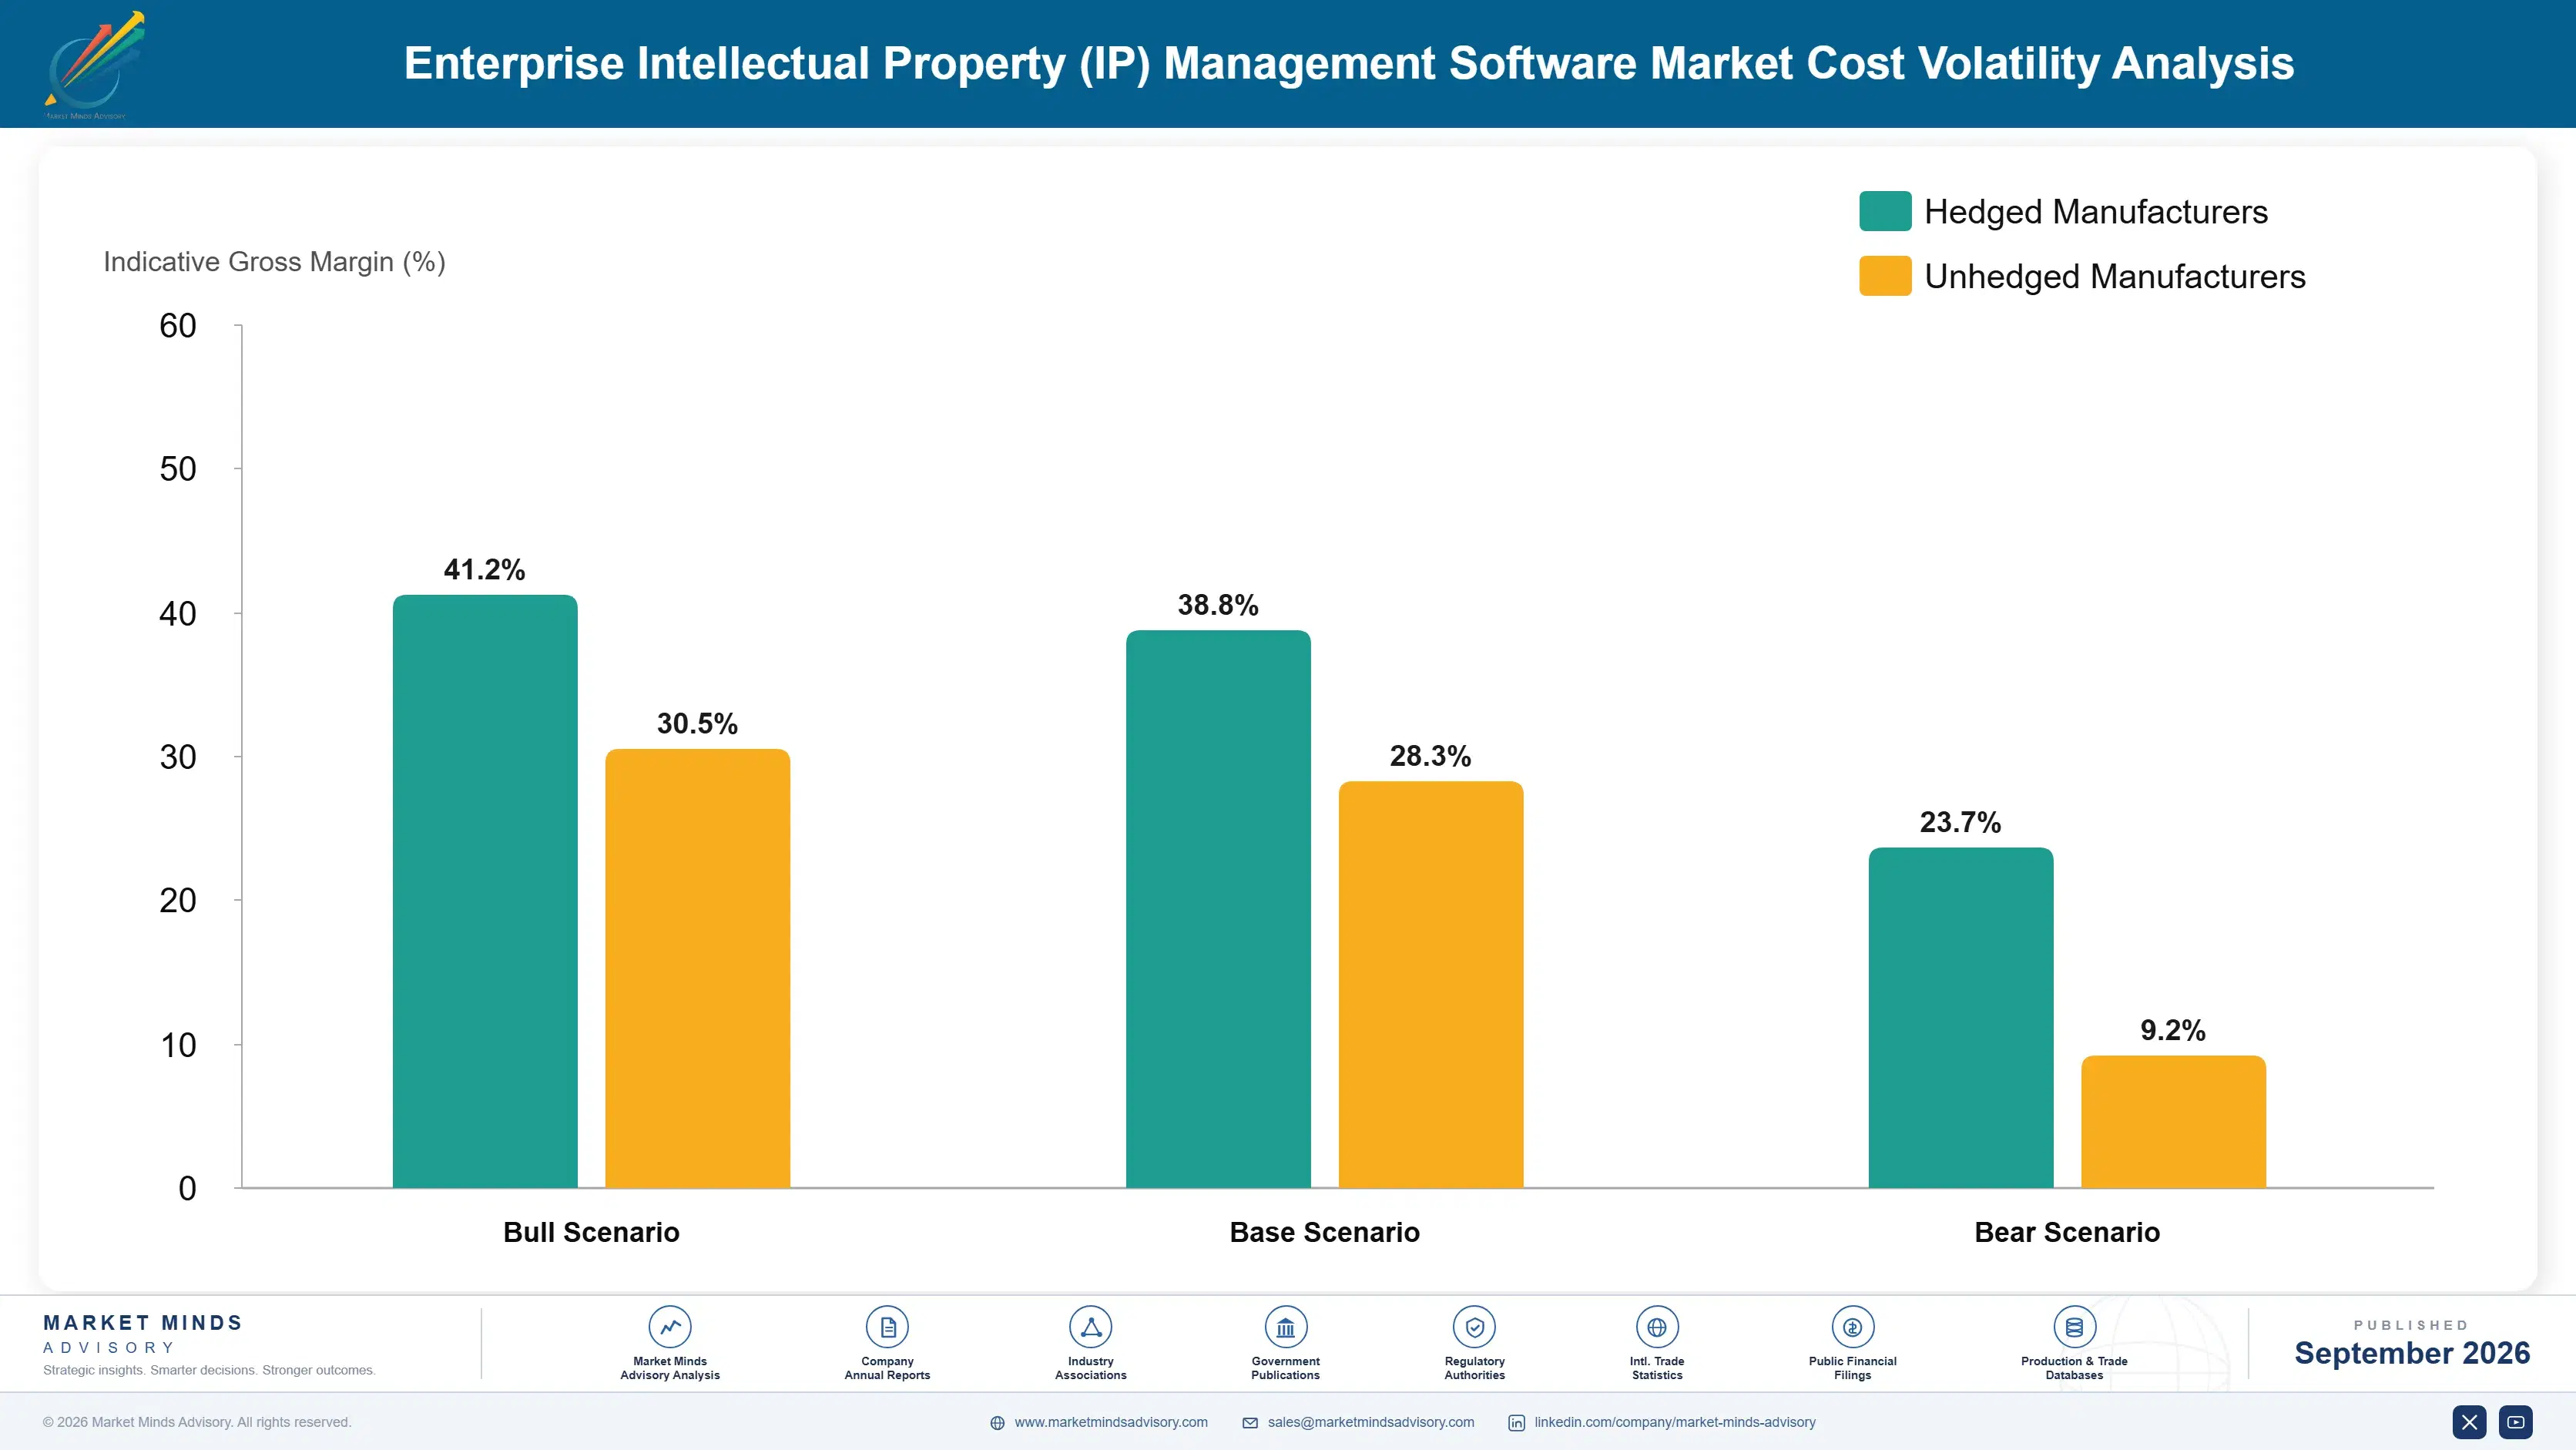
Cost structure divides between software and payment operations, which behave nothing alike. Software delivery runs to engineering, hosting and support at roughly 31% of cost, with implementation and data migration a further 18% because docketing migrations demand verification against patent office records. Renewal payment operations carry local payment relationships, jurisdiction expertise and reconciliation at around 34%. Compliance, insurance and client account handling take the balance.
Official fee changes and currency movement have been the recent pressure. Patent office renewal fee schedules rose across several major jurisdictions through 2024 and 2025, and providers holding client funds across many currencies saw conversion economics move with exchange rates rather than with anything they controlled. Clarivate referenced renewal service conditions in recent annual reporting. Providers pricing renewal handling on fixed service fees absorbed the variation themselves.

Exposure varies by business model rather than by scale. Providers combining software with renewal handling carry payment risk and client fund obligations software vendors avoid. Broad jurisdiction coverage brings the widest exposure and the deepest position. Software-only vendors have simpler economics and no access to consolidation cash flow. Smaller renewal providers hold client funds without an adequate balance sheet.
enterprise-intellectual-property-ip-management-sof-cost-volatility-analysis-1788421727763

Itemise renewal service fees before competitors do it

Renewal margins built on unitemised service fees and conversion spreads survive only until a procurement team examines them, and that examination is now routine. Publishing transparent pricing ahead of the challenge preserves the relationship at a lower but defensible margin. It means accepting a revenue reduction in advance, which is why few do it before losing an account.

Hedge client fund currency exposure explicitly

Holding client money across many currencies to pay official fees on defined dates creates exposure that behaves like a treasury position rather than a service business. Providers pricing on fixed fees while carrying unhedged conversion risk are running an unintended currency book. Explicit hedging removes that variability at modest cost and makes renewal margins predictable.

Standardise docketing migration into a verified process

Migration is the largest implementation cost and the greatest source of client anxiety, since every date must transfer completely and be verified against patent office records. A standardised verification process with documented reconciliation cuts migration effort by roughly 40% and answers the objection that keeps switching at 4%. It answers the objection prospects raise about lost dates.

Portfolio Architecture for Margin Defence

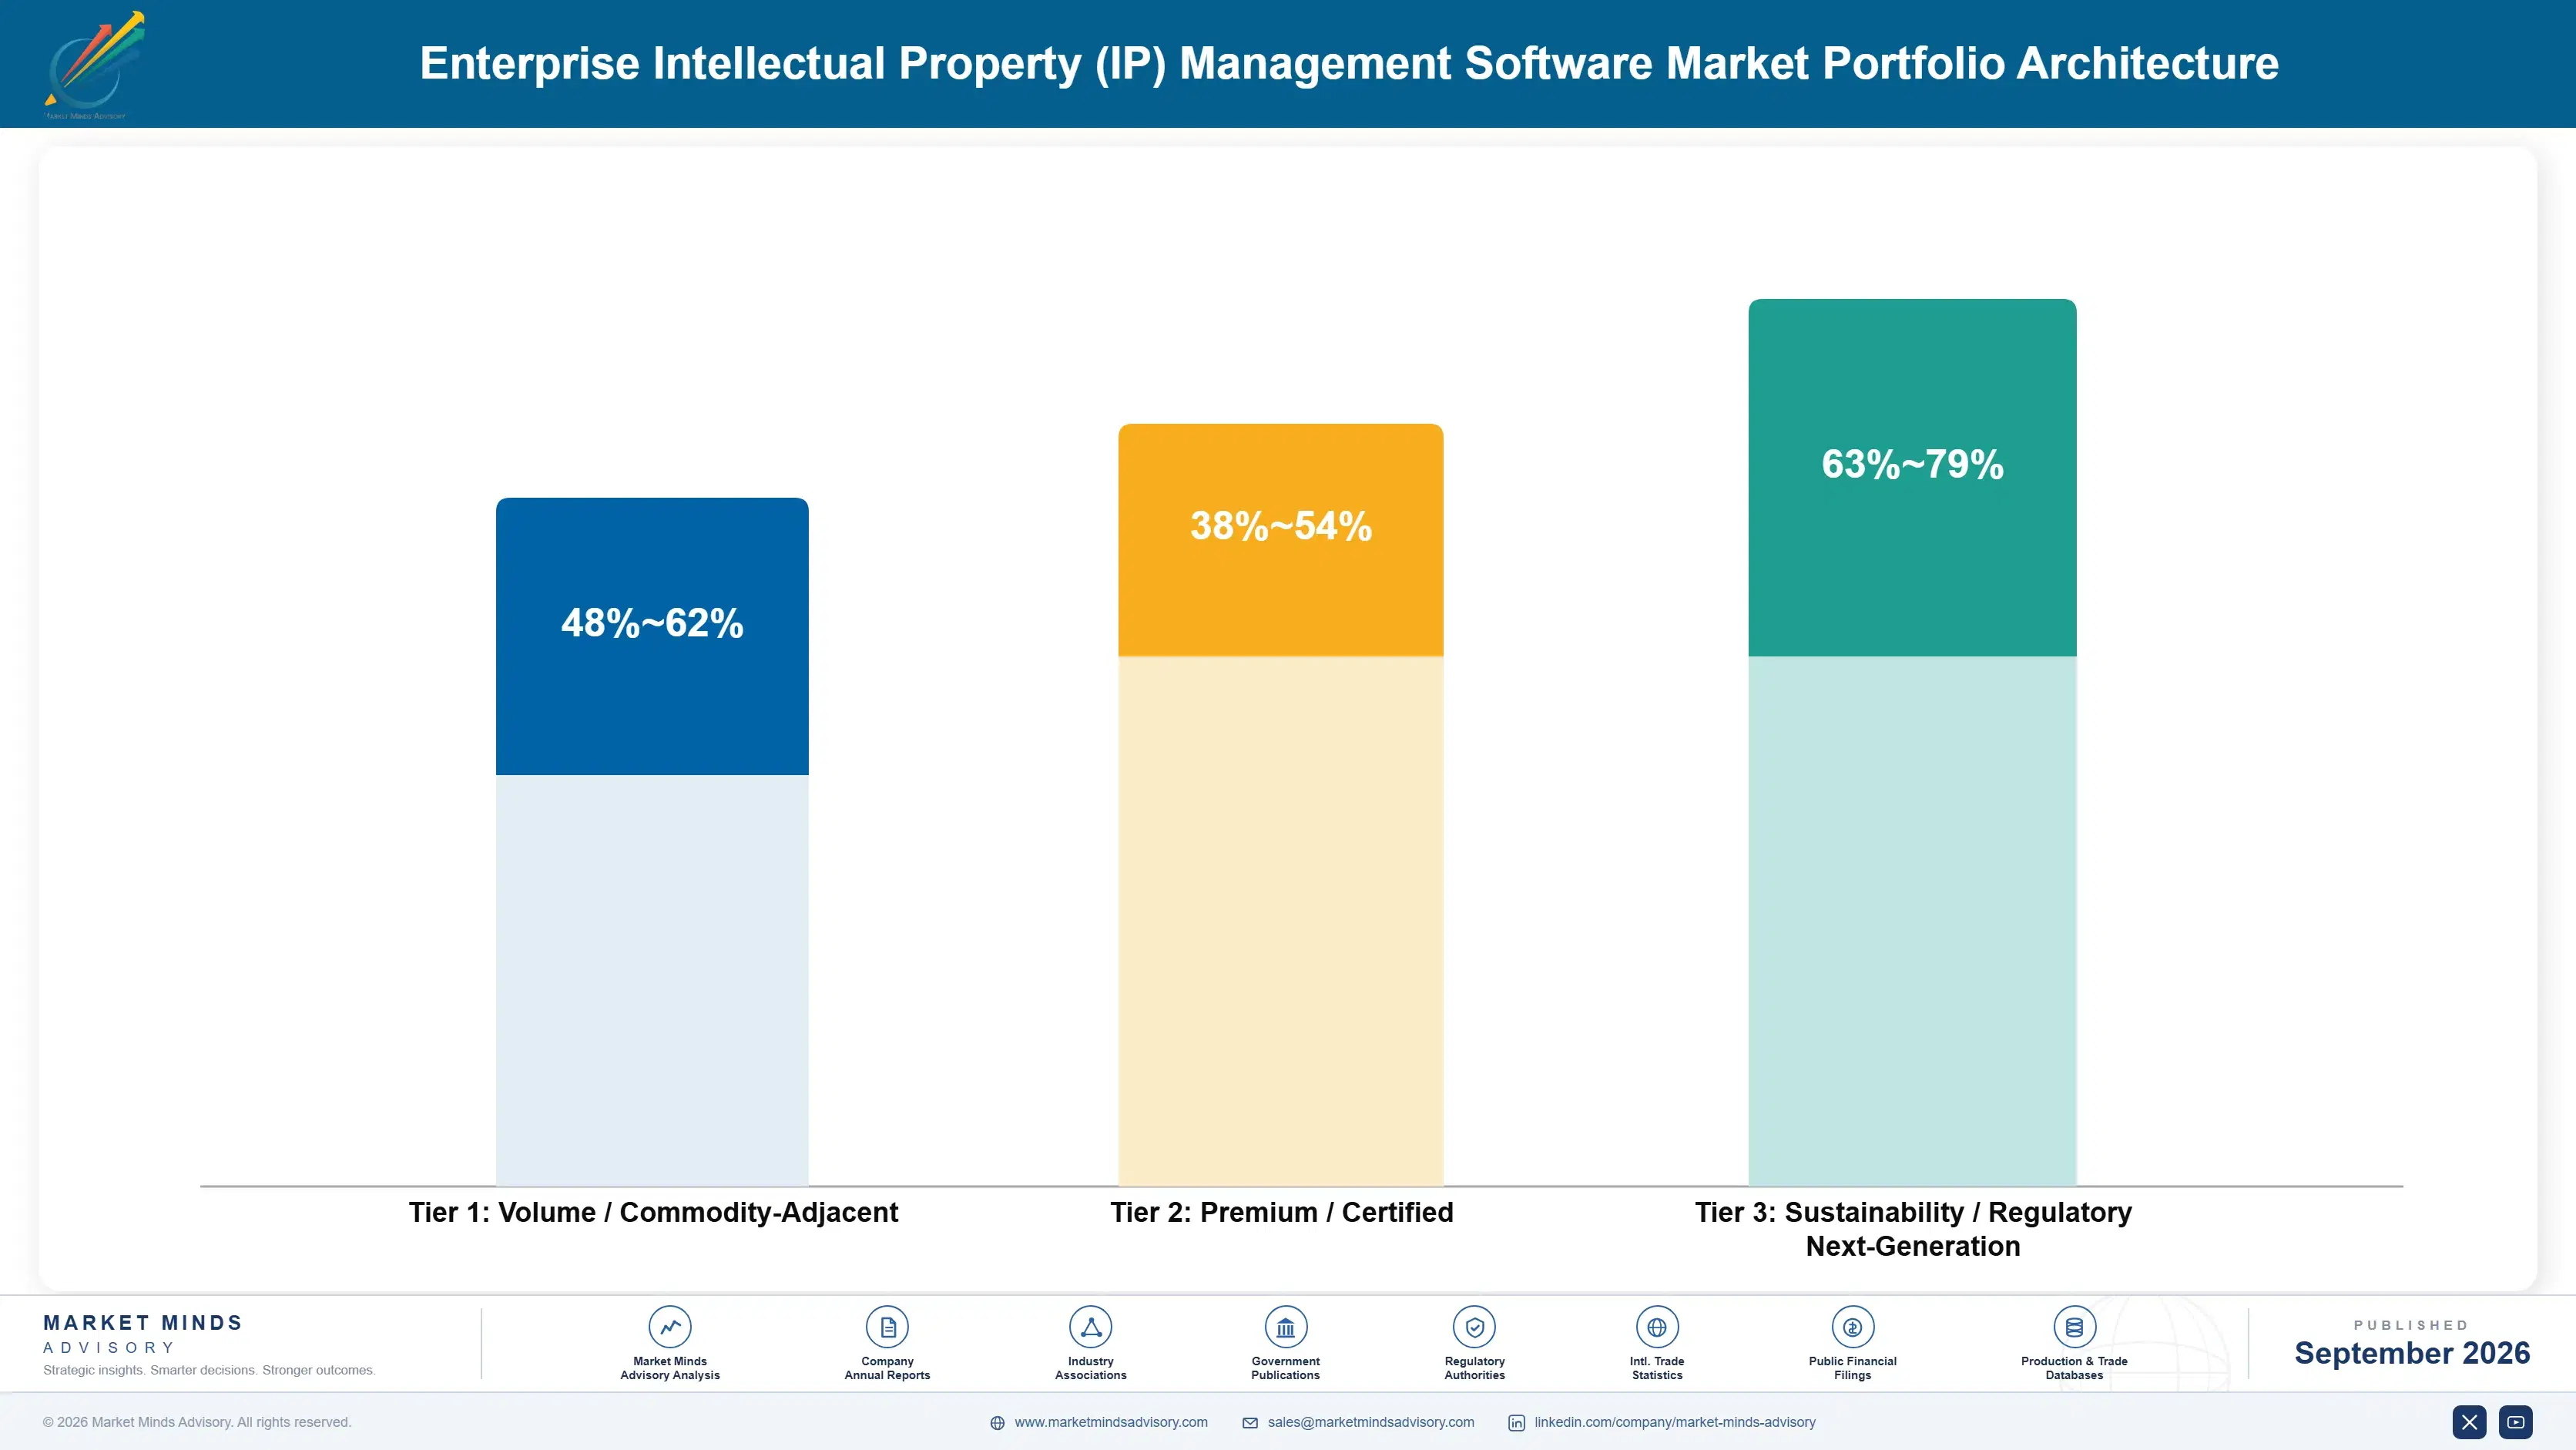
Margin architecture separates on whether the revenue attaches to an obligation or to a question. Docketing and renewal handling attach to legal deadlines and payment dates, renew automatically and carry pricing power unrelated to product quality. Analytics and valuation attach to questions departments ask occasionally, renew at 71% and compete against consultants and internal analysis. The same vendor often sells both and reports one business.
The volume tension is between corporate departments and law firms, which want different things and pay differently. Corporates buy integrated workflow, pay more per account and shrink their headcount every year. Law firms buy docketing depth and jurisdiction coverage, pay less per seat, and grow with case volume rather than with any internal budget cycle. Serving only one forgoes roughly half the addressable base, and serving both requires two different products.

High-value revenue concentrates in renewal handling and in spend management sold to finance. Both share the property that the buyer is managing a large and visible cash outflow rather than buying a capability, which makes the return arithmetic rather than argument. Docketing occupies the volume position, generates the account relationship everything else is sold through, and cannot be grown quickly because nobody switches.

Volume / Commodity-Adjacent

Docketing and prosecution workflow sold per seat to corporate departments and law firms. The wide range separates modern hosted platforms from legacy systems carrying heavy support obligations. Retention is exceptional and growth is limited by user counts that keep falling.
Gross Margin: 48-62%

Premium / Certified

Renewal and annuity handling combining software with payment operations across many jurisdictions. Margin depends on service fee structure and currency handling rather than on software, and transparent-fee competition is compressing it. Local office relationships are what defend the position.
Gross Margin: 38-54%

Sustainability / Regulatory / Next-Generation

Spend and outside counsel management, licensing and royalty administration sold to finance and legal operations budgets. The widest range in the portfolio, reflecting how much analytical and advisory content is bundled. Highest margin and the only part reliably funded from outside the department.
Gross Margin: 63-79%
enterprise-intellectual-property-ip-management-sof-portfolio-architecture-1788421728271

High-value Sub-segments and Strategic Watch-out

Spend and Counsel Management

High value and high growth together, addressing the 62% of budget that goes to external firms and funded from finance rather than departmental money. The margin range reflects analytical and benchmarking content. Buyers verify the return within a quarter, which makes this the easiest sale anywhere in this market.
Gross Margin: 68-79%

Renewal and Annuity Handling

High value with steady volume, generating the cash flow that funded a decade of consolidation across this industry. The range reflects fee structure and currency handling, both under transparent-fee attack from newer competitors. Jurisdiction breadth is the defence, since local payment relationships take years to establish properly.
Gross Margin: 36-52%

Docketing and Prosecution Workflow

The volume core and the most secure revenue in the market, with switching near 4% because deadline migration risk terrifies every department that considers it. It generates the relationship through which everything else is sold. It also cannot grow faster than departmental headcount, which has been flat for a decade.
Gross Margin: 46-60%

Legal Operations Platform Encroachment

The strategic watch-out, carried at zero because it displaces specialist revenue rather than creating any. General legal operations platforms are extending spend management into patent and trademark matters using capability they already hold. Specialists assuming intellectual property matters are too distinctive to absorb are misreading how these platforms are built.
Gross Margin: 0-0%

How This Revenue Recurs

Recurrence here is unusually reliable and unusually hard to expand. Docketing renews at rates most enterprise software vendors would envy, because switching risks a lost right and a negligence claim, and the same logic protects renewal handling once payment relationships are established. What neither does is grow, since both scale with portfolio size and headcount rather than with anything the vendor influences. Expansion has to come from selling adjacent capability into the same account.
Adoption depth varies sharply by buyer type. Large corporate departments use workflow, renewals and spend management continuously and configure them heavily. Law firms use docketing intensively and almost nothing else, since portfolio strategy belongs to their clients. University technology transfer offices use disclosure and licensing tools deeply and prosecution tooling lightly. Small corporates buy whatever their outside counsel recommends, which frequently means the firm's own system.

The buyer has broadened rather than shifted. Docketing is still specified by IP operations staff who care about jurisdiction coverage and date rules. Renewal handling is increasingly decided by procurement examining total cost. Spend management is bought by finance or legal operations. Vendors organised around the IP manager alone address one of three buyers, and not the growing one.
enterprise-intellectual-property-ip-management-sof-end-use-penetration-index-1788421728774

Where Growth Is Available

These are among the four positions where our research anticipates prominent divergence between winners and laggards over the coming forecast period. Each is grounded in the demand model, the regulatory perimeter, and the announced capacity pipeline.
01 / FINANCE BUDGET ACCESS

Sell where the money is, not where the users are

Corporate IP departments have been flat or shrinking for a decade, which caps any seat-priced product regardless of how good it becomes. Outside counsel spending at roughly 62% of the budget is a finance problem with an arithmetic return, funded from legal operations or procurement money that departmental headcount does not constrain. Vendors selling there achieve contract values around 3 times those available from IP department budgets, and buyers can verify the saving within a single quarter rather than taking it on argument.
02 / PORTFOLIO BASED PRICING

Charge for families managed, never for people employed

Seat pricing ties vendor revenue to headcount that falls for reasons entirely outside the vendor's control, which is an unfortunate structure when portfolios averaging 1,840 families are increasingly managed by fewer people each year. Pricing against active families, matters or renewal volume aligns revenue with the actual work and keeps growing while departments shrink. Buyers accept it readily because it matches how they already think about their own costs, and the vendors who switched years ago now show materially better revenue trajectories.
03 / ANALYTICS WORKFLOW EMBEDDING

Put the analysis inside processes that repeat monthly

Portfolio analytics renews near 71% because departments buy it for a strategic review, use it hard for a quarter and then return to work that carries deadlines attached. Embedding the same capability inside annuity renewal decisions and invention disclosure review lifts renewal above 90% without changing the underlying product at all. It is a packaging and workflow decision rather than a development programme, which makes it one of the few improvements in this market available inside a single release cycle.
04 / RENEWAL MARGIN DEFENCE

Itemise renewal pricing before procurement does it first

Renewal handling generates the cash flow that funded a decade of consolidation, earning on service fees, currency conversion and float rather than on software, across roughly 44% of corporate renewals. Transparent-fee competitors are making those margins visible and winning volume purely on that basis. Providers who publish their own pricing and bundle renewal handling into portfolio decision workflow keep the volume at a lower but genuinely defensible margin, while those defending opacity lose accounts one procurement review at a time.

Engagement Snapshot From the Field

A live engagement with an industry participant carrying material or product regulatory and market exposure ahead of a defining policy shift, showing how our research translates into a defensible multi-year portfolio strategy.
MARKET MINDS ADVISORY · CLIENT ENGAGEMENT SUMMARY
Enterprise Intellectual Property (IP) Management Software Producer Strategic Portfolio Review and Transition Roadmap 2026·Investment Scenario on Enterprise Intellectual Property (IP) Management Software Exposure Evaluation 2025-26
CLIENT PROFILE
A global medical device manufacturer holding roughly 3,400 active patent families across 41 jurisdictions with an IP department of 19 people (client-reported, unverified by MMA), down from 31 five years earlier. Docketing ran on a system installed in 2011, renewals were handled by a single external provider, and portfolio analytics had been bought twice and lapsed both times.
STRATEGIC CHALLENGE
Total IP spending had reached roughly USD 47 million annually, of which USD 29 million went to external law firms with no matter-level visibility (client-reported, unverified by MMA). Finance had asked for a spend reduction the department could not model, and a procurement review had separately questioned renewal handling costs the department had never examined in any detail.
MMA APPROACH
MMA rebuilt total IP cost by matter and by jurisdiction rather than by supplier, which the department had never attempted, and benchmarked renewal handling fees against transparent-fee alternatives. We interviewed 12 internal stakeholders, four vendors, two renewal providers and three outside firms. Evaluation weighted spend visibility and renewal transparency ahead of docketing feature comparison, which the department had expected to dominate.
KEY FINDINGS
  1. Renewal handling was costing roughly USD 1.9 million annually in service fees and conversion spread against a transparent-fee benchmark near USD 1.1 million for identical work.
  2. Outside counsel rates varied by up to 70% for comparable prosecution work across firms, and nobody had compared them because invoices arrived at matter level rather than task level.
  3. Both lapsed analytics subscriptions had been used for a single strategic review each, exactly as the vendor's own usage data showed and nobody internally had examined.
  4. Docketing replacement was rejected by every stakeholder interviewed on migration risk grounds, despite what proved to be near universal dissatisfaction with the existing system.
CLIENT PROFILE
A global medical device manufacturer holding roughly 3,400 active patent families across 41 jurisdictions with an IP department of 19 people (client-reported, unverified by MMA), down from 31 five years earlier. Docketing ran on a system installed in 2011, renewals were handled by a single external provider, and portfolio analytics had been bought twice and lapsed both times.
STRATEGIC CHALLENGE
Total IP spending had reached roughly USD 47 million annually, of which USD 29 million went to external law firms with no matter-level visibility (client-reported, unverified by MMA). Finance had asked for a spend reduction the department could not model, and a procurement review had separately questioned renewal handling costs the department had never examined in any detail.
MMA APPROACH
MMA rebuilt total IP cost by matter and by jurisdiction rather than by supplier, which the department had never attempted, and benchmarked renewal handling fees against transparent-fee alternatives. We interviewed 12 internal stakeholders, four vendors, two renewal providers and three outside firms. Evaluation weighted spend visibility and renewal transparency ahead of docketing feature comparison, which the department had expected to dominate.
KEY FINDINGS
  1. Renewal handling was costing roughly USD 1.9 million annually in service fees and conversion spread against a transparent-fee benchmark near USD 1.1 million for identical work.
  2. Outside counsel rates varied by up to 70% for comparable prosecution work across firms, and nobody had compared them because invoices arrived at matter level rather than task level.
  3. Both lapsed analytics subscriptions had been used for a single strategic review each, exactly as the vendor's own usage data showed and nobody internally had examined.
  4. Docketing replacement was rejected by every stakeholder interviewed on migration risk grounds, despite what proved to be near universal dissatisfaction with the existing system.
RECOMMENDED STRATEGY
Phase 1: Retender renewal handling on transparent itemised pricing, since the same work is available at materially lower cost without changing any portfolio record. Phase 2: Implement spend management with task-level rate compliance before touching docketing, because that is demonstrably where the recoverable money actually sits. Phase 3: Buy analytics only if embedded into the annuity review workflow, and otherwise commission the analysis as a service when the question actually arises.
OUTCOME
The client reduced annual IP spending by roughly USD 6.2 million within fourteen months, with USD 4.8 million of that from outside counsel rate and task management (client-reported, unverified by MMA). Renewal handling moved to transparent itemised pricing, and the docketing system was deliberately left alone.

Frequently Asked Questions

Foundational context covering the market sizes, CAGR, scope, country, region and competition that inform every finding below. This section is provided to cover basics and most often pre-purchase conversations, answered from the MMA Primary Research Dataset.

What is the current size of the Enterprise Intellectual Property (IP) Management Software Market?

The market was worth USD 2.1 billion in 2025 and reaches USD 2.30 billion in 2026. Spend management and renewal handling account for most of the recent growth.

How large will the Enterprise Intellectual Property (IP) Management Software Market be by 2036?

MMA forecasts USD 5.65 billion by 2036, an expansion of 2.46 times over the forecast period. That represents USD 3.35 billion of incremental annual revenue against 2026.

What is the CAGR for the Enterprise Intellectual Property (IP) Management Software Market 2026 to 2036?

The base case is 9.4% compound annual growth, with a bull case at 10.6% and a bear case at 8.2%. Corporate IP department headcount is what separates the scenarios.

Which segment is growing fastest?

IP spend and outside counsel management grows at 14.1%, half again the market rate of 9.4%. External firms consume roughly 62% of a corporate IP budget, which makes it a finance problem.

Who are the major companies in the Enterprise Intellectual Property (IP) Management Software Market?

Clarivate, Anaqua, Questel, Dennemeyer and LexisNexis Intellectual Property lead on measured software and attributable services revenue. Together they hold roughly 58%, assembled largely through acquisition.

Which country is growing fastest?

India grows fastest at 13.6%, combining rising domestic patent filing with its position as the delivery base for formalities and docketing support performed for corporates elsewhere.

Report Segmentation Architecture

The full report scope spans multiple orthogonal segmentation dimensions, with cross-tabulated demand data provided for each dimension pair. Coverage extends further to regional breakdowns, trend trajectories, and the competitive detail needed to support segment-level decision-making.

By Primary Market Dimension

  • Docketing and Prosecution Workflow
  • Annuity and Renewal Management
  • Invention Disclosure and Harvesting
  • Portfolio Analytics and Valuation
  • Licensing and Royalty Management
  • IP Spend and Outside Counsel Management

By End-Use Industry

  • Technology and Electronics
  • Pharmaceutical and Biotechnology
  • Medical Devices and Diagnostics
  • Industrial and Automotive Manufacturing
  • Consumer Goods and Retail Brands
  • Universities and Research Institutions

By Commercial Dimension

  • Corporate Department Direct Purchase
  • Law Firm Subscriptions
  • Finance and Legal Operations Budgets
  • Managed Renewal Service Contracts
  • Delivery Centre Workflow Licensing
  • Reseller and Agent Channels

By Region

  • North America
  • Western Europe
  • East Asia
  • South Asia and Pacific
  • Latin America
  • Middle East and Africa
  • Eastern Europe

Scope, Methodology, and Coverage

Every figure in this report is reproducible from documented input assumptions. The scope below maps the historical period, the forecast horizon, the segmentation dimensions, and the countries covered, alongside the underlying primary and qualitative methodology.
Historical Period
2020 to 2025
Forecast Period
2026 to 2036
Base Year
2025 (USD billions; MMA Primary Research Dataset, September 2026)
Market Definition
This market covers software used by corporate intellectual property departments, law firms and research institutions to manage patent, trademark and design portfolios, spanning docketing and prosecution workflow, annuity and renewal management, invention disclosure and harvesting, portfolio analytics and valuation, licensing and royalty management, and intellectual property spend and outside counsel management. Revenue is measured as software subscription, licence and directly attributable service value at supplier level. Official patent office fees paid on behalf of clients, standalone patent search databases, legal and agent services, translation services, litigation support and general contract lifecycle management are excluded.
Quantitative Units
USD billions, software subscription and attributable service revenue
Segmentation Dimensions
Software function, end-use industry, buyer type, region
Regions Covered
North America, Western Europe, East Asia, South Asia and Pacific, Latin America, Middle East and Africa, Eastern Europe
Countries Covered
United States, Canada, United Kingdom, Germany, Switzerland, France, Netherlands, Sweden, Italy, Spain, Poland, Czechia, Japan, South Korea, China, Taiwan, Singapore, India, Australia, Brazil, Mexico, Chile, Israel, United Arab Emirates, Saudi Arabia, South Africa
Key Companies Profiled
Clarivate, Anaqua, Questel, Dennemeyer, LexisNexis Intellectual Property, PatSnap, Wellspring, Inteum, Alt Legal, IPzen, Minesoft, Patrix, IP.com, Evalueserve, Sagacious IP, IPAN, Computer Packages Incorporated, Aistemos, Patentfield, Ambercite
Quantitative Methodology
Primary survey, n=3,800 respondents, Q4 2025, six countries; demand-side model with trade association cross-validation
Qualitative Methodology
47 expert interviews, Q4 2025; applied to validate demand model assumptions, identify emerging dynamics, and assess competitive positioning
Report Format
PDF and XLSX data workbook (Word format preview document)
Publisher
Market Minds Advisory
Report Code
MMA-2026-TEC-851
Published
September 2026
Contact
sales@marketmindsadvisory.com | www.marketmindsadvisory.com

Purchase the full Enterprise Intellectual Property (IP) Management Software Market Report (2026 to 2036).

The full MMA report separates the parts of this market that renew automatically from those that quietly lapse, and why the reported business and the profitable one differ. It sizes the market to 2036 across six software functions, seven regions and 26 countries, with segment growth rates and regional demand mechanisms set out in full. Competitive analysis covers 20 suppliers assessed on measured software and attributable services revenue, including moat and risk assessment for the two leaders. The report quantifies delivery cost structure, renewal handling economics and margin architecture across three portfolio tiers. It closes with four strategic verdicts and an anonymised medical device manufacturer engagement.
Six software functions sized to 2036
Seven regions with demand mechanism analysis
Twenty suppliers on consistent revenue basis
Renewal handling and switching rate benchmarks
Margin architecture across three portfolio tiers
Anonymised medical device IP operations engagement

Built For The People Who Decide

From boardroom strategy to bench-side execution, this report is read cover-to-cover by leaders shaping the next decade of their industry, turning demand scenarios, market dynamics and valuation benchmarks into decisions.
CXOs/ Presidents/ VPs/ Managers
M&A and Corporate Development
Strategy Teams and R&D Heads
Procurement and Product Directors
Regulatory and Compliance Leaders
Investor Relations and Equity Analysts