Market Minds Advisory
Enterprise Feedback Management Industry Analysis in Japan

Enterprise Feedback Management Industry Analysis in Japan: Enterprise Feedback Management in Japan: Programme Types, Response Collapse and Workforce Priority 2026 to 2036

Japanese customers do not complain. They stop coming back quietly, and a five point scale calibrated for American variance produces almost no usable signal from any of them at all.

Lead Analyst

Published

September 2026

Make Smarter Decisions with Customized Research Insights

Request a free sample report and evaluate market opportunities, growth trends, and competitive dynamics relevant to your business needs.

2025 MARKET VALUE$3.3BMarket Size 2025
2036 FORECAST VALUE$8.7BBase Case , 2026 to 2036
CAGR 2026 TO 20369.2 %Bull 10.5% / Bear 7.9%
INCREMENTAL OPPORTUNITY$5.1BNet 10- year value creation
EXPANSION MULTIPLE2.41x2036 value over 2026 base
Strategic Levers
M&A Pipeline
Regional Outlook
Country Rankings
Competitive Intelligence
Segmental Deep-dive
Call-Us : 91 93563 13602

Executive Snapshot and Market Trajectory.

Survey response rates collapsed and this industry has not admitted it. A customer experience programme that once returned a quarter of recipients now returns around 7%, and the people still answering differ systematically from the people who stopped. Every dashboard in this category reports a self-selected minority.
The market reaches USD 3.60 billion in 2026 and USD 8.68 billion by 2036, a 2.41 times expansion at 9.2%. Digital and in-product feedback capture grows at 13.8%, half again the market rate of 9.2%, because it observes behaviour rather than asking questions nobody answers. Japan compounds at 12.4%, ahead of any other market, on a workforce shortage that turned employee programmes into an operational necessity.
Five vendors hold 46% of subscription revenue, fragmented between global experience platforms and Japanese research specialists who understand the local instrument problem. Qualtrics, Medallia and Sprinklr lead internationally. NICE and Verint arrived through contact centre analytics. Macromill, Cross Marketing and Emotion Tech hold Japanese positions that merely translated Western products have consistently failed to displace, and score compression is exactly the reason for it. Score compression is precisely why they hold on to them.
Market Definition
This report covers software for collecting, analysing and acting on structured customer and employee feedback: customer experience measurement programmes, employee experience and engagement programmes, product and concept feedback programmes, digital and in-product feedback capture, contact centre interaction analytics, and operational frontline feedback programmes. It excludes market research services sold as projects, social media monitoring, customer relationship management systems, human resources information systems, and general business intelligence tools.
Base Year Value
$3.3B in 2025 (MMA Primary Research Dataset, September 2026)
Forecast Period
2026 to 2036, eleven discrete annual values
CAGR
9.2% base case. Bull 10.5%. Bear 7.9%.
Fastest Growth Segment
Digital And In-Product Feedback Capture: 13.8% CAGR
Fastest Growth Country
Japan: 12.4% CAGR
Fastest Growth Region
South Asia and Pacific: 11.2% CAGR
Largest Region
East Asia: 34% of 2025 global value
Market Leaders
Qualtrics, Medallia, NICE, Verint and Sprinklr lead on enterprise feedback management software subscription revenue. Source: MMA Analysis.
Primary Survey
n=3,800 procurement and R&D decision-makers, Q4 2025, six countries
Methodology
Demand-side build-up, cross-validated against public data, 47 expert interviews

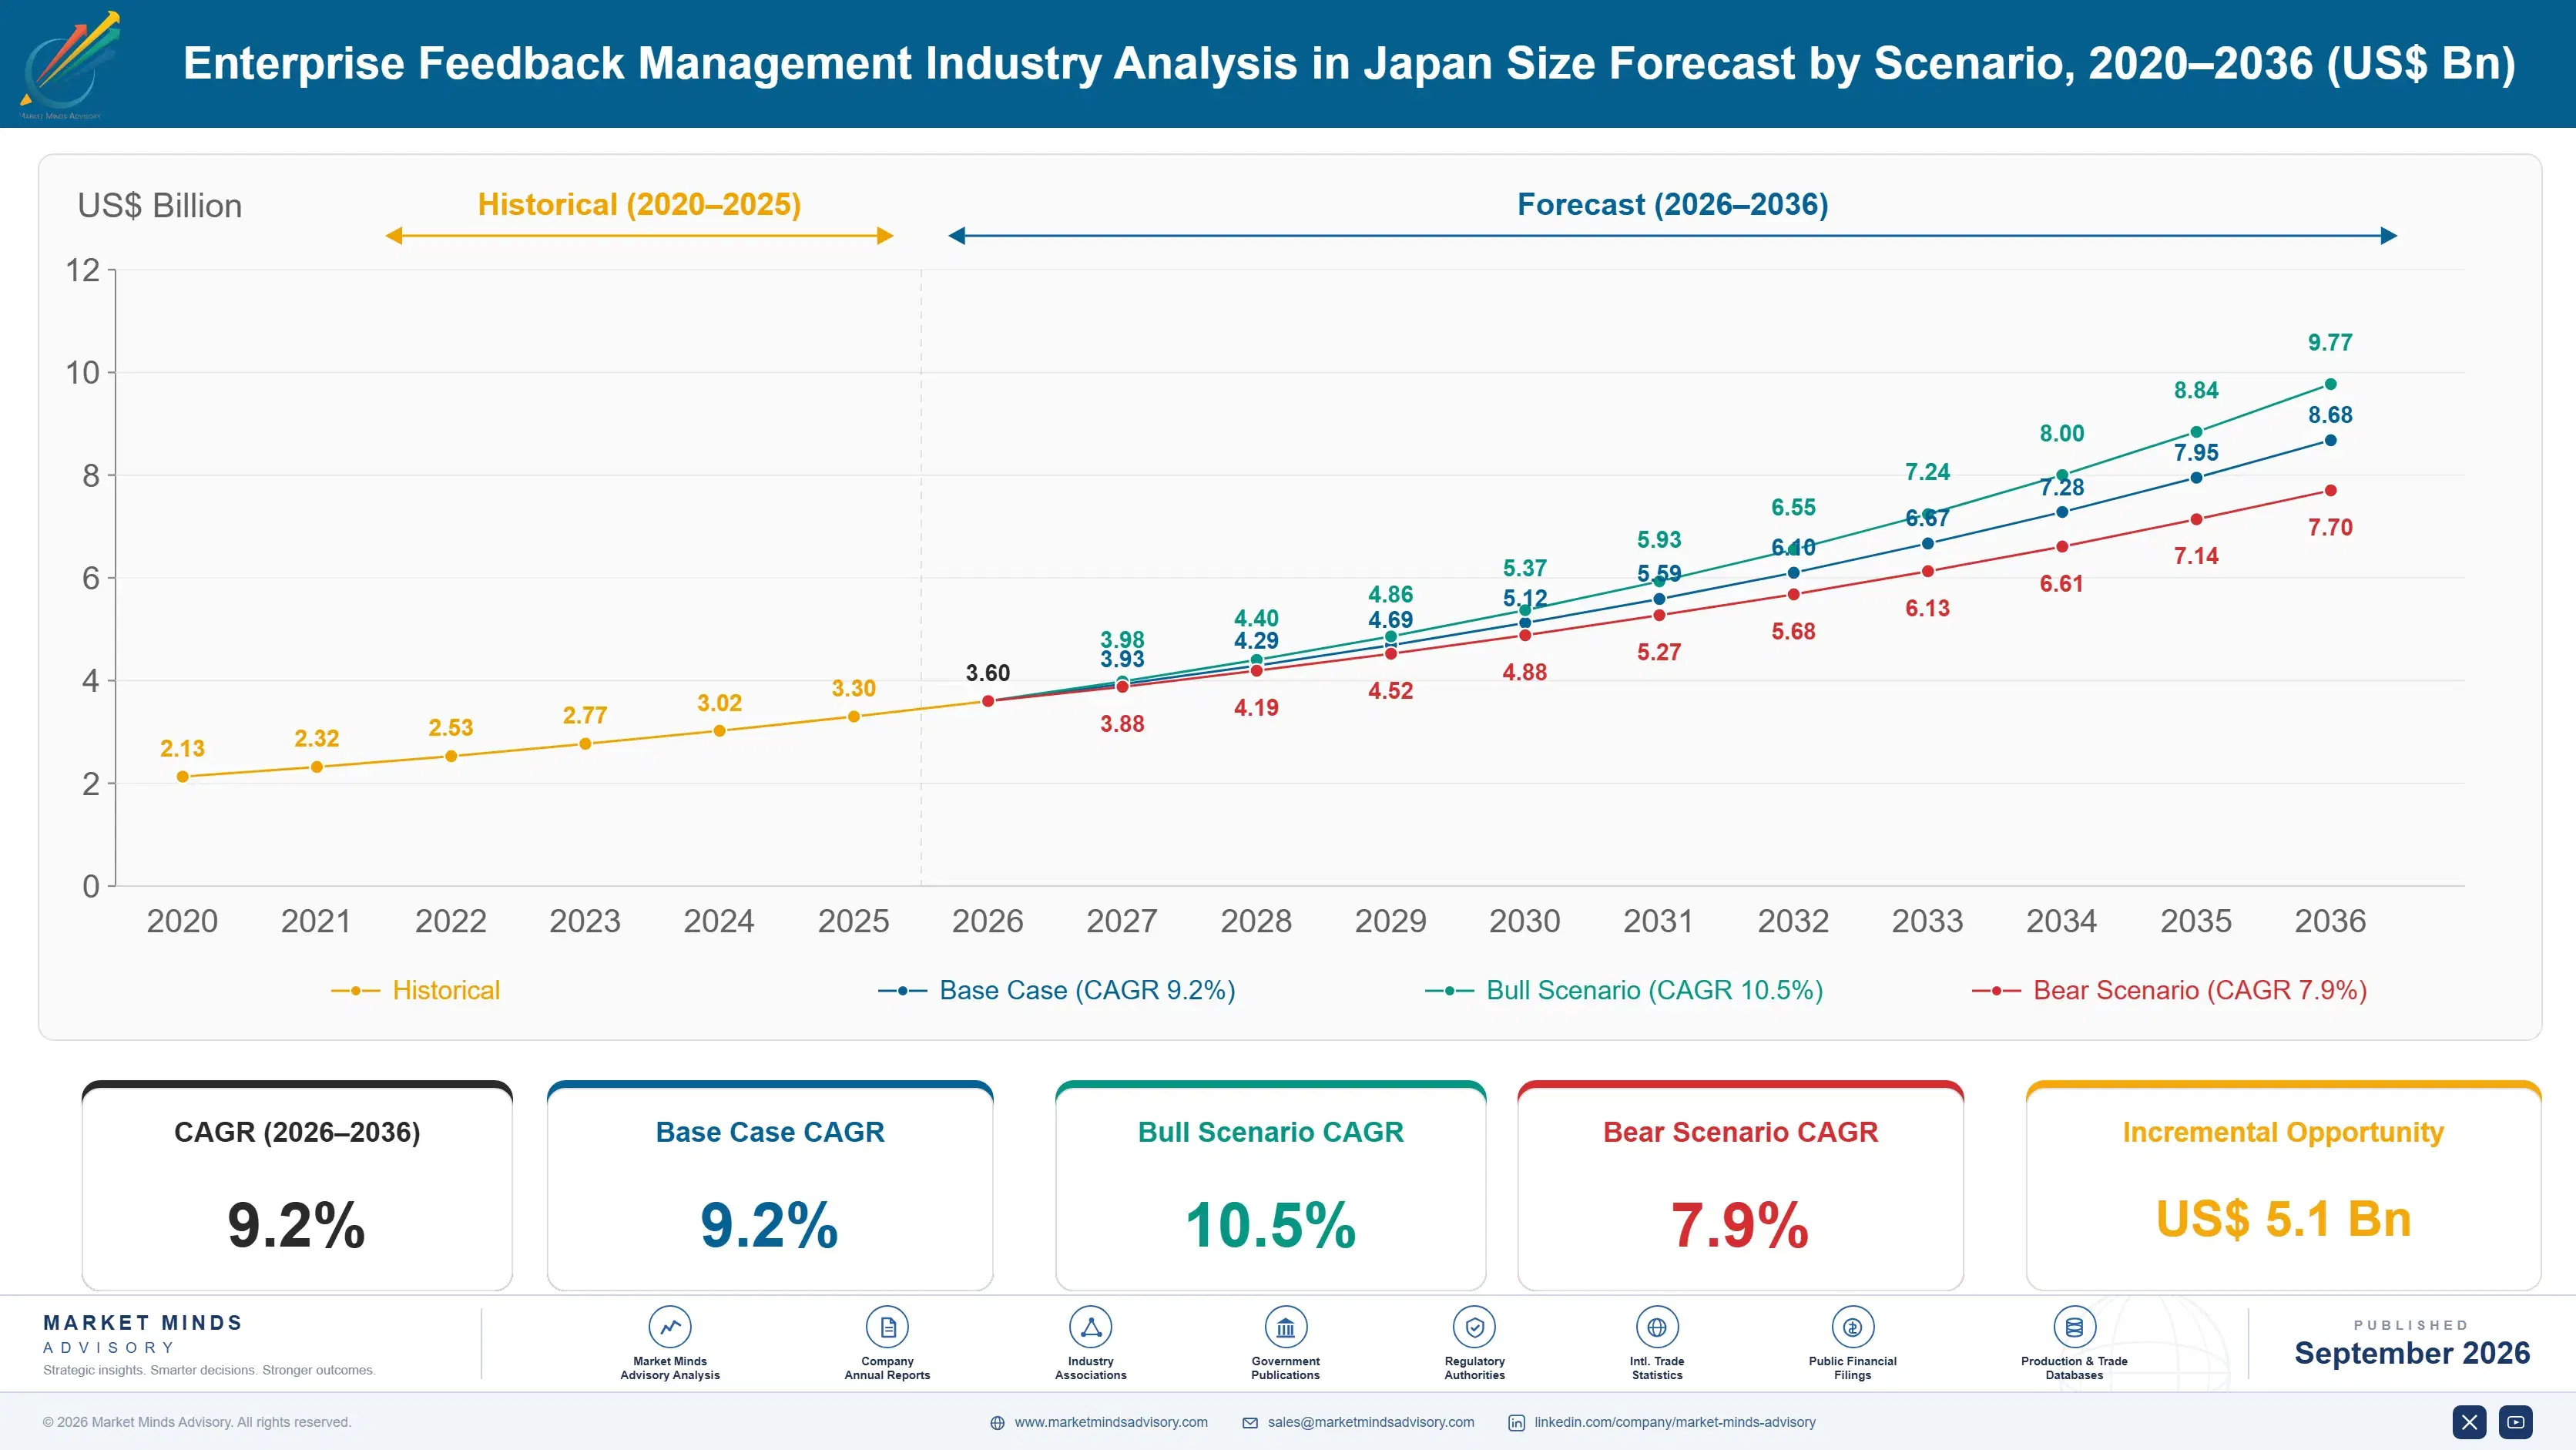
Enterprise Feedback Management Industry Analysis in Japan Market Forecast Scenarios

enterprise-feedback-management-industry-analysis-i-size-forecast-scenario-1789990596501
Between 2020 and 2025 the category compounded at 8.0%, while the measurement underneath it quietly stopped working. Emailed survey response rates fell year after year across every market as customers grew tired of being asked, and vendors reported programme volume rather than response quality. Japanese adoption began later than Western adoption and grew faster from a smaller base throughout the period.
The base case holds 9.2% on three mechanisms. Passive in-product and behavioural capture keeps replacing survey instruments that no longer return usable samples, which is a product migration rather than new spending. Japan's shrinking working age population makes employee experience an operational requirement rather than a preference, and employee programmes now outsell customer programmes there. And contact centre interaction analytics reads conversations that already happened rather than requesting new ones.
The bull case at 10.5% assumes behavioural capture reaches the credibility that survey scores once had with executives, which would restore programme budgets that have been questioned for several years. The bear case at 7.9% is buyers concluding the whole category measures something unreliable: with response rates near 7%, a chief executive who stops believing the number stops funding the programme entirely.

Asking People Who Stopped Answering

The instrument this industry was built on has degraded and almost nobody says so. Emailed customer surveys once returned a quarter of recipients and now return around 7%, which means every reported score comes from a self-selected minority that differs systematically from everyone else. Vendors report programme reach and response volume. Almost none report what the response rate implies about whether the number means anything at all.
TOP FIVE CONCENTRATION46%Fragmented between global platforms and Japanese research specialist vendors
SURVEY RESPONSE RATE7%Completion across emailed customer experience programmes at present
JAPANESE SCORE DISPERSION0.6 pointsStandard deviation on a five point satisfaction scale
EMPLOYEE PROGRAMME SHARE58%Japanese enterprise spending directed at workforce rather than customers
PROGRAMME RESPONSE LATENCY19 daysFrom feedback collection to any action reaching frontline staff
ANNUAL CONTRACT VALUEUSD 71,000Median across Japanese large enterprise programme subscriptions at present
Japan is the hardest market anywhere for this software and the most instructive. Japanese customers express dissatisfaction by not returning rather than by scoring low, and satisfaction responses cluster within roughly 0.6 points of standard deviation on a five point scale. An analytics engine calibrated for American variance reads that as noise and finds nothing. Vendors who rebuilt the instrument rather than translating it hold the installed base here.
The buyer inverted in Japan before anywhere else. A shrinking working age population means employers cannot replace people who leave, which turned employee experience from a human resources preference into an operational constraint on running the business. Around 58% of Japanese enterprise programme spending now goes to workforce measurement rather than customer measurement, which is the reverse of every Western market.
"A Japanese retailer showed me twelve months of satisfaction scores that never moved outside a range of half a point. Their Western platform reported stable performance. Their footfall had fallen eleven percent. The customers were answering politely and leaving anyway."
Principal, Experience Management and Customer Analytics Practice · MMA Technology Practice · September 2026

Market Trends

Response Collapse Pushed Measurement Toward Observed Behaviour

Emailed customer surveys returned around a quarter of recipients a decade ago and now return roughly 7%, and the remaining respondents skew toward the very satisfied and the very angry with almost nobody in between. That makes a reported score a measurement of who still answers rather than of what customers think. Digital and in-product capture observes what people actually do instead, and compounds at 13.8% against 9.2% for the market. The shift is a product migration rather than new spending, which vendors reporting growth rarely make clear. Programme reach is not response quality.
Market Impact: Employee work takes 58% of spending
Japanese Score Compression Defeats Western Analytics Engines

Japanese respondents cluster satisfaction answers within roughly 0.6 points of standard deviation on a five point scale, because expressing strong dissatisfaction to an organisation directly is culturally uncomfortable in ways Western instrument design never anticipated. An analytics engine tuned for American variance treats that compression as noise and reports stability while a business declines. Vendors who rebuilt scales, question construction and interpretation for the market hold Japanese installed bases that translated Western products have repeatedly failed to take from them. Rebuilding the instrument is product engineering rather than a translation exercise, and very few global vendors have funded it properly.
Market Impact: Interaction analytics compounds at 11.6%

Market Opportunities and Growth Drivers

Workforce Shortage Made Employee Measurement Operationally Necessary

Japan's working age population has been shrinking for two decades and employers genuinely cannot replace people who leave, particularly in logistics, retail, construction and care where the shortage is most acute. That converted employee experience measurement from a human resources activity into an operational constraint on whether a business can staff its shifts at all. Around 58% of Japanese enterprise programme spending now addresses the workforce rather than customers, and Japan compounds at 12.4% ahead of any other market largely on this single mechanism. No competing explanation comes close to that one.
Market Impact: Action reaches staff after 19 days

Contact Centre Analytics Reads Conversations Already Happening

Every recorded contact centre interaction is unsolicited feedback that somebody already gave, at length and without being asked, and speech analytics now reads it at scale rather than sampling calls manually. That sidesteps the response rate problem entirely, since nobody has to agree to participate in anything. Contact centre interaction analytics compounds at 11.6% on that logic, and the data volume dwarfs anything a survey programme collects. NICE and Verint reached experience management from this direction rather than from survey tooling. Nobody has to agree to participate in any of it, which sidesteps the category's central problem entirely.
Market Impact: Scores rest on 7% samples

Market Restraints and Challenges

Nothing Happens Between Collection And The Frontline

Feedback reaches the people who could act on it around 19 days after collection in a typical programme, by which time the customer has moved on and the employee has forgotten the shift in question. The root cause is that programmes are designed around reporting cycles serving executives rather than around operational response serving stores, branches and teams. Commercially this makes buyers question what they are funding. Mitigation runs through routing feedback directly to frontline managers, closing loops individually, and reporting action rates alongside scores rather than instead of them.
Market Impact: Response rates fell to about 7%

Executives Are Losing Faith In The Number

With response rates near 7%, a chief executive who understands sampling stops treating a satisfaction score as evidence, and several have. The root cause is that the industry kept reporting scores as though nothing changed while the underlying sample degraded steadily for a decade. Commercially this threatens programme budgets across the category rather than any individual vendor. Mitigation runs through honest confidence reporting, behavioural triangulation against actual customer actions, and abandoning single headline metrics that cannot bear the weight placed on them. Several chief executives have already stopped funding programmes on exactly this reasoning.
Market Impact: Dispersion sits near 0.6 points
3 additional market trends, 4 additional growth drivers, and 2 additional restraints and challenges are covered in the full report. Contact sales@marketmindsadvisory.com to access the complete intelligence.

Segment CAGR and Growth Architecture

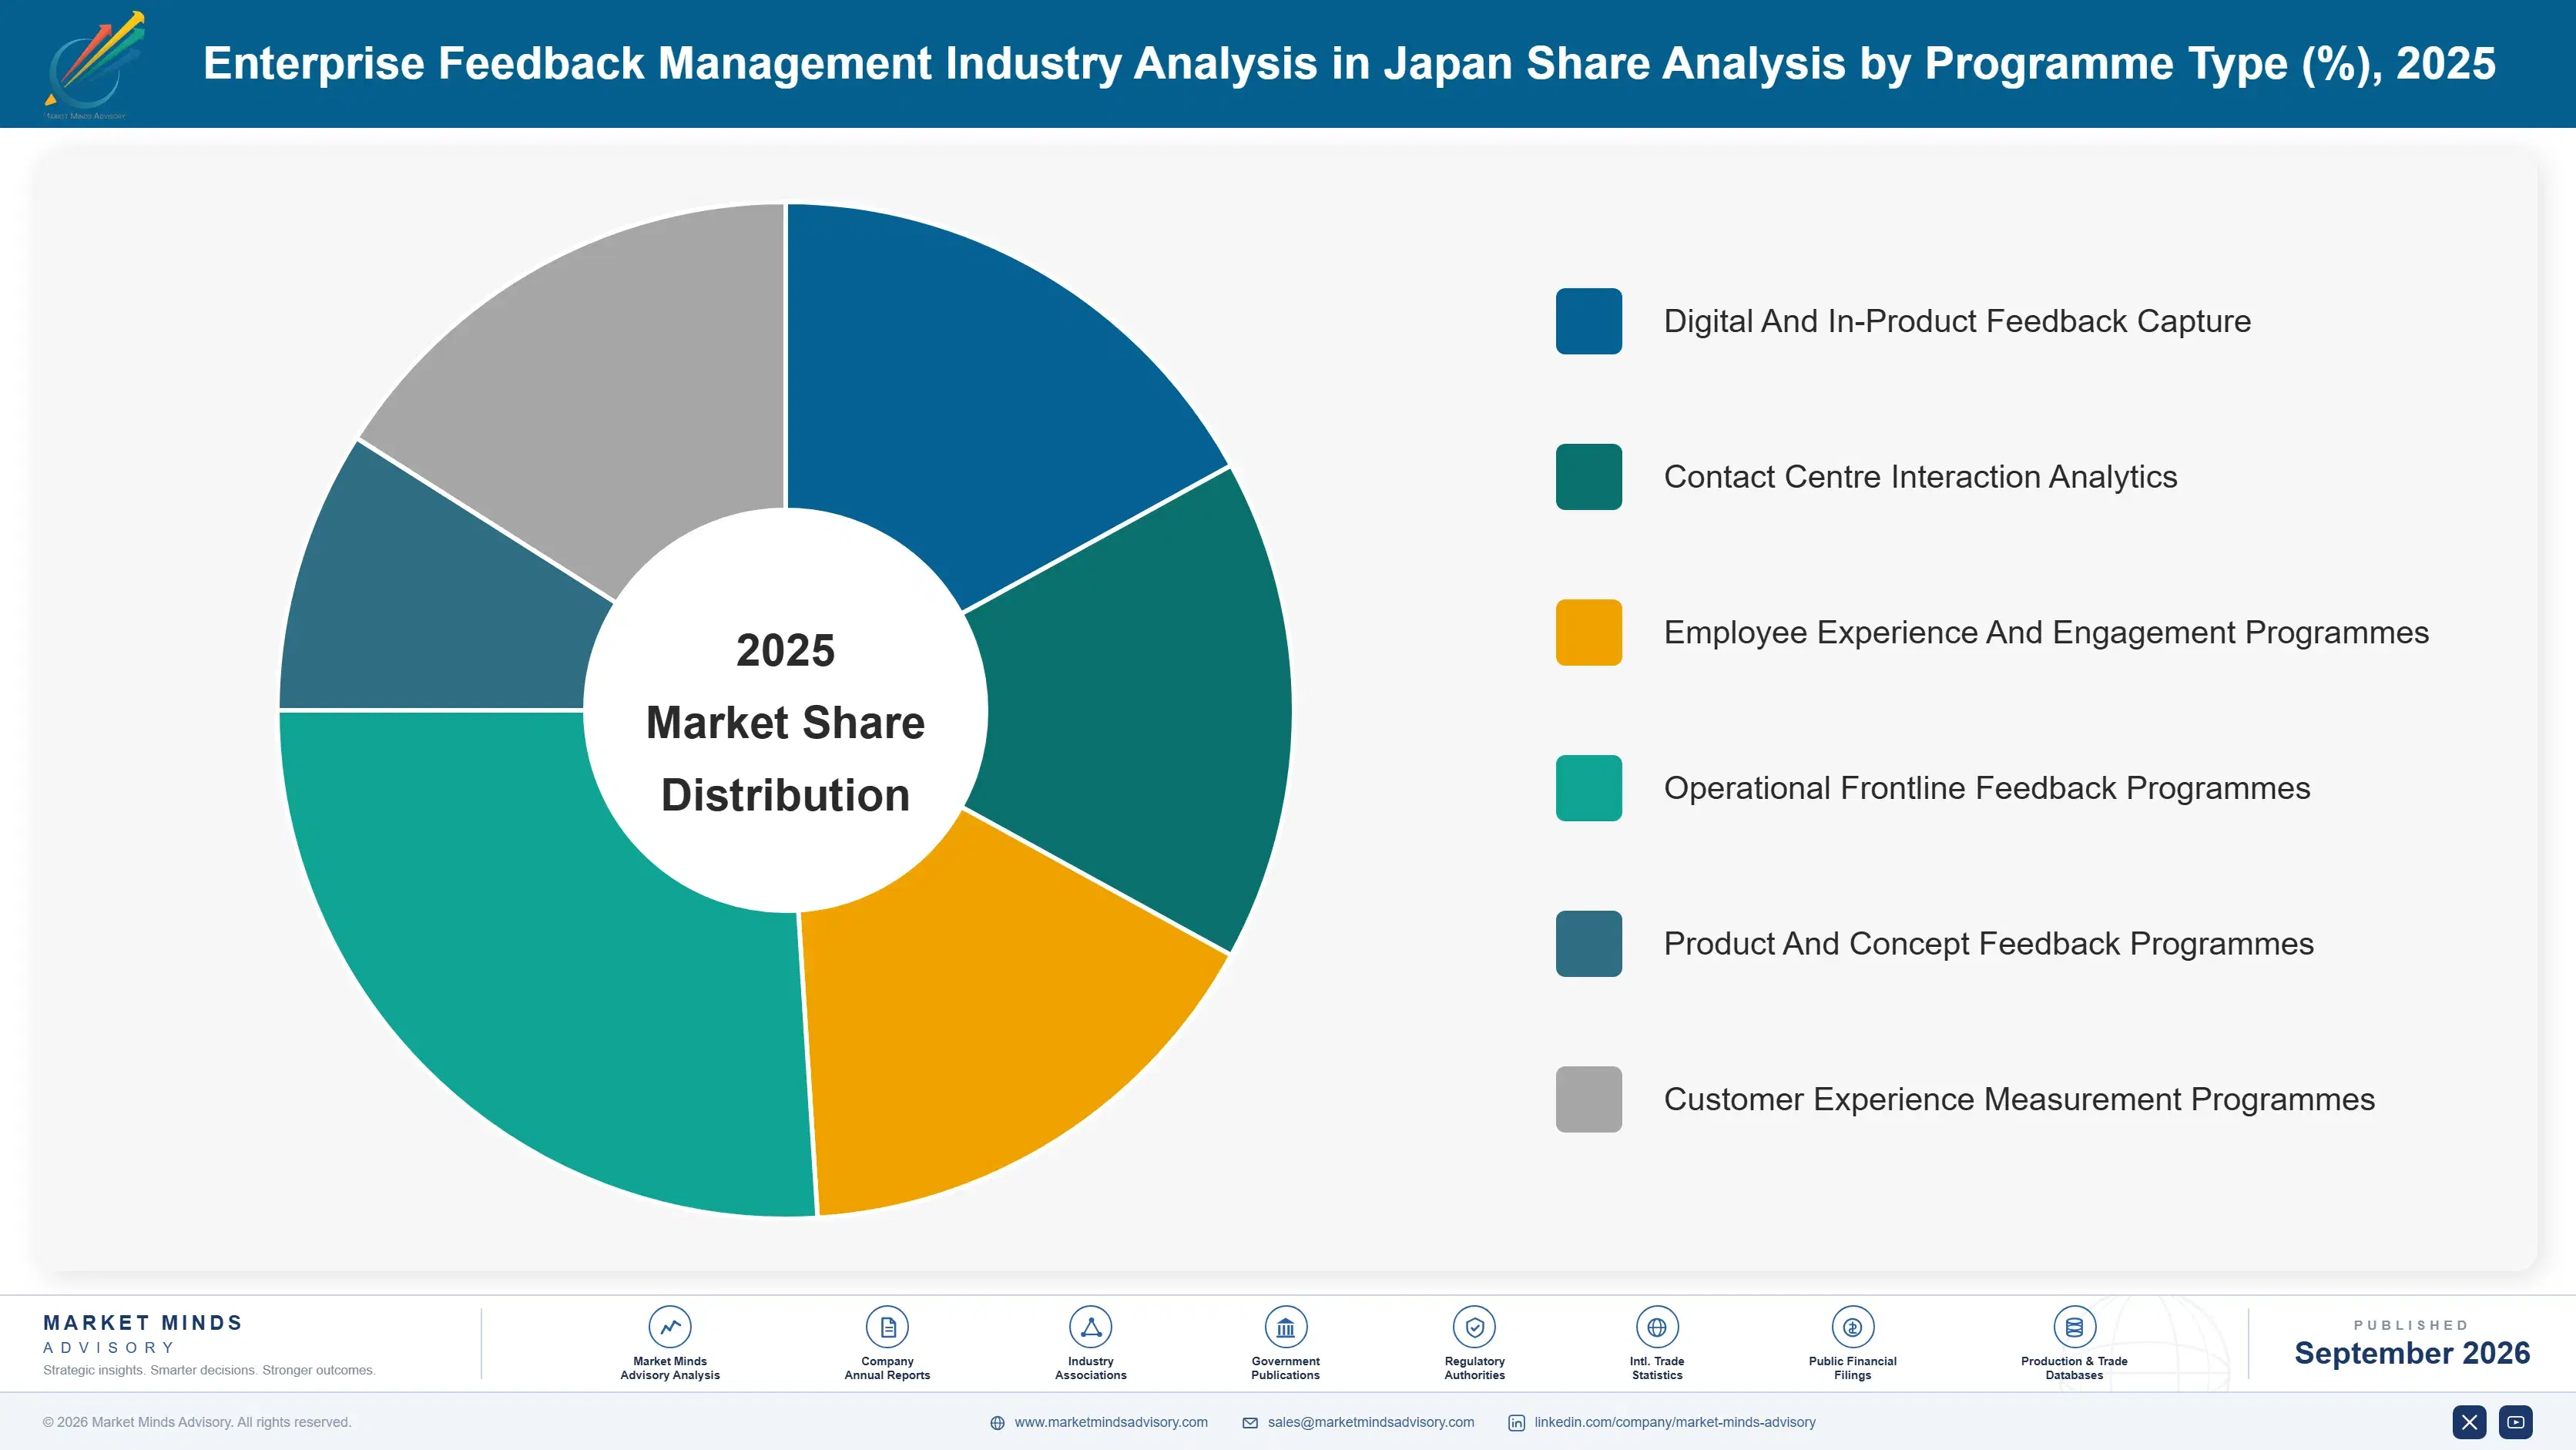
Segmentation follows programme type, since what an organisation measures determines who sponsors it, which budget funds it and whether the instrument still works. Six programme types cover the market: digital and in-product capture, contact centre interaction analytics, employee experience programmes, operational frontline feedback, product and concept feedback, and customer experience measurement. Industry vertical is a separate dimension entirely.
enterprise-feedback-management-industry-analysis-i-market-share-analysis-1789990597051

Digital And In-Product Feedback Capture

Digital and in-product capture grows at 13.8%, half again the market rate of 9.2%, because it stopped asking questions that people stopped answering. Emailed surveys return around 7% and the respondents skew heavily toward the delighted and the furious, which produces a score describing who replied rather than what customers experienced. In-product capture observes behaviour, hesitation, abandonment and micro-interactions without requesting participation from anybody. In Japan this matters even more than elsewhere, since customers who will not score a company low will still abandon a checkout flow, and the behaviour carries the signal the survey response deliberately withholds. Behaviour carries what the answer withholds, and Japanese buyers understood that before anybody else did.
CAGR 13.8%

Contact Centre Interaction Analytics

Contact centre interaction analytics compounds at 11.6% on feedback people already volunteered without being asked to. Every recorded call is unsolicited and detailed customer commentary, and speech analytics now reads all of it rather than the small sample a quality team could review manually. That removes the response rate problem completely, since participation was never requested. In Japanese contact centres the value is higher still, because customers who compress their survey answers into a narrow band speak far more freely on a call. NICE and Verint reached experience management from this direction and hold advantages the survey vendors cannot easily replicate. Volume of data here dwarfs anything a survey programme collects.
CAGR 11.6%
Full segment breakdown across 6 segments available in the complete report.

Regional Architecture and Country Demand Map

East Asia holds 34% of subscription revenue in this Japan-scoped analysis, reflecting the report's analytical centre. On a purely global basis the region would sit near 20% and North America would lead, so the regional figures here follow the scope rather than global spending patterns.

East Asia

East Asia holds 34% of subscription revenue, above the 30% band ceiling, and two things explain it. This analysis is scoped to Japan, which weights the regional figure toward the report's analytical centre rather than global spending; on a purely global basis the region would sit nearer 20%. The genuine mechanism underneath is that Japan compounds at 12.4% on a workforce shortage making employee measurement operationally necessary, with around 58% of enterprise programme spending directed at the workforce. Korean and Chinese enterprises adopt more slowly. Japanese score compression near 0.6 points defeats products that were merely translated. Rebuilding the instrument rather than translating it is what separates the vendors holding positions here.
Share: 34% | CAGR: 10.4% (2026 to 2036)

North America

North America takes 26% of subscription revenue and remains the largest market globally outside this report's Japanese scope. Qualtrics, Medallia and Momentive all originated here and the category's product conventions were written here, including the survey instruments and headline metrics whose reliability is now being questioned. Executive sponsorship for experience programmes runs deeper than anywhere, which is exactly why declining response rates threaten budgets here most directly. Contract values sit above the global median. Growth at 8.4% sits below the global rate on mature adoption and increasing scrutiny of what the numbers actually measure. The instruments and headline metrics whose reliability is now questioned were all designed here originally, which makes the reckoning uncomfortable.
Share: 26% | CAGR: 8.4% (2026 to 2036)
Regional intelligence for 5 additional markets available in the complete report: Western Europe, South Asia and Pacific, Latin America, Middle East and Africa, Eastern Europe. Contact sales@marketmindsadvisory.com.
enterprise-feedback-management-industry-analysis-i-country-cagr-analysis-1789990597595

How This Category Regains Credibility

The survey instrument that this entire industry was originally built upon now returns only around 7% of the recipients it reaches, executives have started noticing, and the fastest growing approaches ask nobody anything at all. Each of the four levers below responds to that erosion rather than defending a measurement approach the buyers already question.

Report Confidence Alongside Every Headline Score

Response rates near 7% mean a satisfaction score describes the minority who still answer rather than the customer base, and executives who understand sampling have started saying so out loud. Vendors reporting scores without confidence intervals or non-response analysis are asking buyers to trust a number the buyers have already begun to doubt. Publishing honest uncertainty is commercially uncomfortable and it is the only thing that keeps a programme funded once a chief executive has asked the question properly. Confidence reporting is uncomfortable and it is the only defence available.
Market Impact: Every reported score rests on 7% of responses

Move Measurement To Behaviour Nobody Has To Volunteer

Digital and in-product capture compounds at 13.8% and contact centre analytics at 11.6%, and neither requires anybody to agree to participate in anything. Behaviour, hesitation, abandonment and recorded conversation all carry signal that a declining survey sample no longer does. In Japan this matters more than anywhere, since a customer who will not score a company low will still abandon a checkout. Vendors defending survey tooling are protecting the part of the portfolio that grows at 4.6%. Survey tooling grows at 4.6%, and defending it protects the slowest part. Growth sits elsewhere entirely.
Market Impact: Behavioural capture compounds at 13.8% every single year

Rebuild The Instrument For Japanese Response Patterns

Japanese satisfaction responses cluster within roughly 0.6 points of standard deviation, because scoring an organisation harshly is culturally uncomfortable in ways Western instrument design never contemplated. An engine tuned for American variance reads that compression as noise and reports stability while a business loses customers steadily. Rebuilding scale construction, question wording and interpretation for the market is genuine product work rather than translation, and vendors who did it hold Japanese installed bases that translated competitors keep failing to take. Japanese specialists hold installed bases global platforms keep failing to take, and instrument design is the entire reason for it.
Market Impact: Compression at 0.6 points defeats any simple translation

Close The Loop Before Nineteen Days Elapse

Feedback reaches the people who could act on it around 19 days after collection, by which time the customer has moved on and the frontline manager has forgotten the shift entirely. Programmes designed around executive reporting cycles produce dashboards rather than changes, which is precisely why buyers question what they fund. Routing feedback directly to frontline managers within hours and reporting action rates alongside scores turns a measurement product into an operational one, and very few programmes in this category are built that way. Very few programmes anywhere are actually built that way.
Market Impact: Latency of 19 days destroys the whole value

Who Controls the Margin Pool

Five vendors hold 46% of enterprise feedback management subscription revenue, fragmented between global experience platforms and specialists who arrived from adjacent categories. Qualtrics, Medallia and Sprinklr lead internationally on survey and experience tooling. NICE and Verint reached the same buyers through contact centre interaction analytics instead. Japanese specialists hold local positions that global vendors have repeatedly failed to displace. All participants are assessed on software subscription revenue.
Competition in Japan runs on instrument design rather than on platform capability, which international vendors consistently underestimate. Score compression near 0.6 points means an analytics engine calibrated elsewhere finds nothing in Japanese data, and a translated questionnaire is not a localised instrument. Macromill, Cross Marketing and Emotion Tech built on that understanding, and global platforms keep arriving with product that reads Japanese responses as noise.

Rankings shift as behavioural and conversational capture displaces survey tooling, which favours vendors arriving from contact centre analytics over those built on questionnaires. The second pressure is executive scepticism: as response rates fall further, the vendors reporting honestly about sampling keep programmes funded, and those who do not lose them entirely rather than losing them to a competitor.
enterprise-feedback-management-industry-analysis-i-company-positioning-matrix-1789990598129

Competitive Moat and Risk Dimensions

QUALTRICS

Moat: Programme Breadth And Integration

Qualtrics covers customer, employee, product and brand programmes on one platform integrated into human resources and customer systems, so an enterprise runs every feedback programme through a single relationship rather than several. That breadth makes displacement an organisational project rather than a software swap. Assembling comparable coverage requires product investment across four distinct buyer groups simultaneously.
QUALTRICS

Risk: Survey Instrument Dependency

The platform was built around questionnaires at a moment when response rates have fallen to around 7% and executives have begun questioning what the resulting scores measure. Behavioural and conversational capture grow considerably faster and start from different technical foundations. Defending survey tooling protects the segment growing at 4.6% while the alternatives compound at more than three times that.
NICE

Moat: Conversational Data Access

NICE reads recorded contact centre interactions at scale, which is unsolicited and detailed feedback that nobody had to agree to provide. That data volume dwarfs any survey programme and sidesteps the response rate collapse entirely. Reaching it requires contact centre infrastructure relationships that survey vendors do not hold and cannot easily build from a questionnaire starting position.
NICE

Risk: Limited Employee Programme Reach

Employee experience takes around 58% of Japanese enterprise programme spending and is growing on workforce shortage pressure that shows no sign of easing anywhere. Contact centre analytics reaches customers rather than employees, and the buyer, the data and the sponsor all differ completely. Extending there means competing without the conversational data advantage that defines the position.

Players Tracked

Prominent Players

Qualtrics
Medallia
NICE
Verint
Sprinklr

Other Key Players

Momentive
InMoment
Alchemer
Forsta
UserTesting
Genesys
Zendesk
Macromill
Cross Marketing
Emotion Tech
NTT DATA
Recruit Holdings
Link and Motivation
PKSHA Technology
Rakuten Insight

Recent Developments

FEBRUARY 2025

Medallia Extends Behavioural Signal Capture Beyond Survey Programmes

Medallia extended behavioural and digital signal capture across its experience platform, an organic product development rather than an acquisition or joint venture. Emailed survey response rates near 7% mean reported scores describe the minority still answering, and behavioural observation requires no participation agreement from anybody at all.
Signal: Vendors are quietly migrating away from the instrument that their entire category was originally built upon.
SEPTEMBER 2024

Emotion Tech Expands Japanese Localised Experience Measurement Products

Emotion Tech expanded its experience measurement products designed specifically for Japanese response patterns, an organic expansion rather than any transaction. Japanese satisfaction answers cluster within roughly 0.6 points of standard deviation, which analytics engines calibrated for Western variance interpret as noise rather than as compressed signal.
Signal: Translating a questionnaire is not localising an instrument, and Japanese buyers have understood that for years.
JUNE 2025

Link and Motivation Expands Workforce Engagement Measurement Across Sectors

Link and Motivation expanded workforce engagement measurement across additional Japanese industry sectors, an organic expansion rather than a partnership or merger. A shrinking working age population means employers cannot replace departing staff, which makes engagement measurement an operational constraint rather than a human resources preference.
Signal: Employee programmes now outsell customer programmes in Japan, reversing the pattern found in every Western market.

What Running These Programmes Costs

Engineering salaries account for roughly 42% of platform cost, weighted toward natural language processing specialists as the category migrates from structured scores to unstructured text and speech. Cloud infrastructure carries around 17%, rising sharply where conversational analytics processes recorded audio at volume. Localisation and instrument research absorb about 11%, and customer success plus programme design services take the remaining balance.
Compensation for natural language processing engineers rose sharply through 2023 and 2024 as every software category competed for the same specialists simultaneously. Qualtrics Annual Report 2024 and NICE Annual Report 2024 both record technology staffing and cloud infrastructure as principal operating variables. Vendors on multi-year enterprise subscriptions absorbed those increases directly, since a contract priced against seat counts in 2022 does not reprice when engineering compensation moves upward.

The competitive disadvantage mechanism is localisation depth rather than any platform cost. Instrument research runs around 11% of cost and has to be repeated for each market where response patterns differ materially, which Japan demonstrates more sharply than anywhere. A global vendor amortising one instrument across many markets carries lower cost and reads Japanese data badly, while a specialist reads it well across a smaller market.
enterprise-feedback-management-industry-analysis-i-cost-volatility-analysis-1789990598326

Reuse Language Models Across Text And Speech

Engineering runs about 42% of platform cost and vendors frequently maintain separate language processing pipelines for survey verbatim comments and for recorded call transcription. The underlying models are substantially the same and only the input handling genuinely differs between them. Consolidating those pipelines removes duplication that product organisations rarely examine at all, since the two capabilities were built separately.

Process Audio Selectively Rather Than Comprehensively

Cloud infrastructure runs around 17% of platform cost and rises steeply where conversational analytics transcribes every recorded interaction regardless of whether anybody will ever review it. Selective processing driven by call outcome and routing metadata captures nearly all the value at a fraction of the compute. Vendors transcribe everything because it is simpler to explain.

Fund Instrument Research As A Product Investment

Localisation and instrument research run about 11% of cost and most vendors treat translation as sufficient, which is why Japanese score compression defeats products calibrated for Western variance. Building genuinely local scale construction and interpretation is product engineering rather than a language exercise. It costs more once, and it is why Japanese specialists retain bases global platforms cannot take.

Portfolio Architecture for Margin Defence

Margin architecture separates on whether the measurement still works. Customer experience measurement programmes earn least now, since response rates near 7% have made buyers question the output and price pressure follows scepticism directly. Product and operational frontline programmes sit in the middle. Digital capture, conversational analytics and employee programmes earn most, each because the data arrives without anybody having to agree to provide it.
The volume versus premium tension in Japan is a localisation decision with a small addressable market attached. Building genuine Japanese instrument capability costs real product investment against a market too small to justify it on its own arithmetic. Global vendors decline and read Japanese data badly. Japanese specialists invest and cannot fund comparable platform breadth, which has held both sides in place for a decade.

High-value pools concentrate in conversational analytics and in employee programmes, and neither is reached from survey tooling. Conversational analytics requires contact centre infrastructure relationships that questionnaire vendors do not hold. Employee programmes require credibility with a human resources buyer who evaluates differently from a marketing one. Both are access positions rather than product features, which is why the margin has settled where it has.

Volume / Commodity-Adjacent

Customer experience measurement programmes built on survey instruments returning around 7%, where buyers increasingly question what the resulting scores actually measure. The ten point spread separates vendors with deep enterprise integration from those selling survey tooling that many alternatives now replicate adequately.
Gross Margin: 58% to 68%

Premium / Certified

Product and concept feedback plus operational frontline programmes, sold to teams who act on the results rather than report them upward. The ten point spread tracks how quickly a programme routes feedback to people who can respond, against a category median running near nineteen days.
Gross Margin: 70% to 80%

Sustainability / Regulatory / Next-Generation

Digital and in-product capture, contact centre interaction analytics and employee experience programmes, where data arrives without participation being requested or the buyer sits outside the questioned budget. The ten point spread reflects localisation depth in markets where response patterns differ materially from Western norms.
Gross Margin: 80% to 90%
enterprise-feedback-management-industry-analysis-i-portfolio-architecture-1789990598838

High-value Sub-segments and Strategic Watch-out

Digital And In-Product Feedback Capture

Grows at 13.8% because it observes behaviour rather than asking questions that only 7% of recipients now answer at all. The ten point spread reflects localisation depth. A Japanese customer who will not score a company low will still abandon a checkout flow. Behaviour carries the withheld signal.
Gross Margin: 80% to 90%

Contact Centre Interaction Analytics

Grows at 11.6% on recorded conversations that customers volunteered at length without anybody requesting their participation. The ten point spread reflects transcription discipline. Japanese customers who compress survey answers into a narrow band speak far more freely on a telephone call. Nobody agreed to participate in it.
Gross Margin: 80% to 90%

Employee Experience And Engagement Programmes

Grows at 10.1% globally and considerably faster in Japan, where a shrinking workforce makes retention an operational constraint. The ten point spread reflects human resources system integration. Around 58% of Japanese enterprise programme spending now goes here rather than to customers. Staffing shifts depends on it directly.
Gross Margin: 80% to 90%

Customer Experience Measurement Programmes

Grows at 4.6%, slowest of the six programme types, as response rates near 7% erode executive confidence in what the headline scores actually represent. The ten point spread reflects enterprise integration depth. This category defined the whole industry a decade ago. Executive confidence is now visibly eroding.
Gross Margin: 58% to 68%

Why Programmes Persist Or Stop

The annuity is the historical trend line rather than the contract. A programme holding three years of scores against consistent question wording cannot be replaced without losing comparability, and every executive review compares against prior periods. Switching vendors means restarting that history and explaining a discontinuity nobody wants to present. The reverse is less comfortable: when an executive stops believing the numbers, the programme is cancelled outright.
Depth varies by who acts on the output. An employee programme wired into retention planning at a Japanese employer that cannot replace departing staff is embedded in an operational problem and effectively permanent. Conversational analytics feeding contact centre quality management is nearly as embedded. A customer survey producing a quarterly board slide is the shallowest, since removing it changes nothing operational and saves the subscription outright.

The sponsor shifted from marketing to operations and human resources, particularly in Japan. A marketing director funded customer experience measurement and defended it on brand grounds. An operations director funds frontline feedback because staffing depends on it, and a human resources director funds engagement measurement because the alternative is not filling shifts. Vendors organised around marketing sponsors call on the budget most likely to be cut.
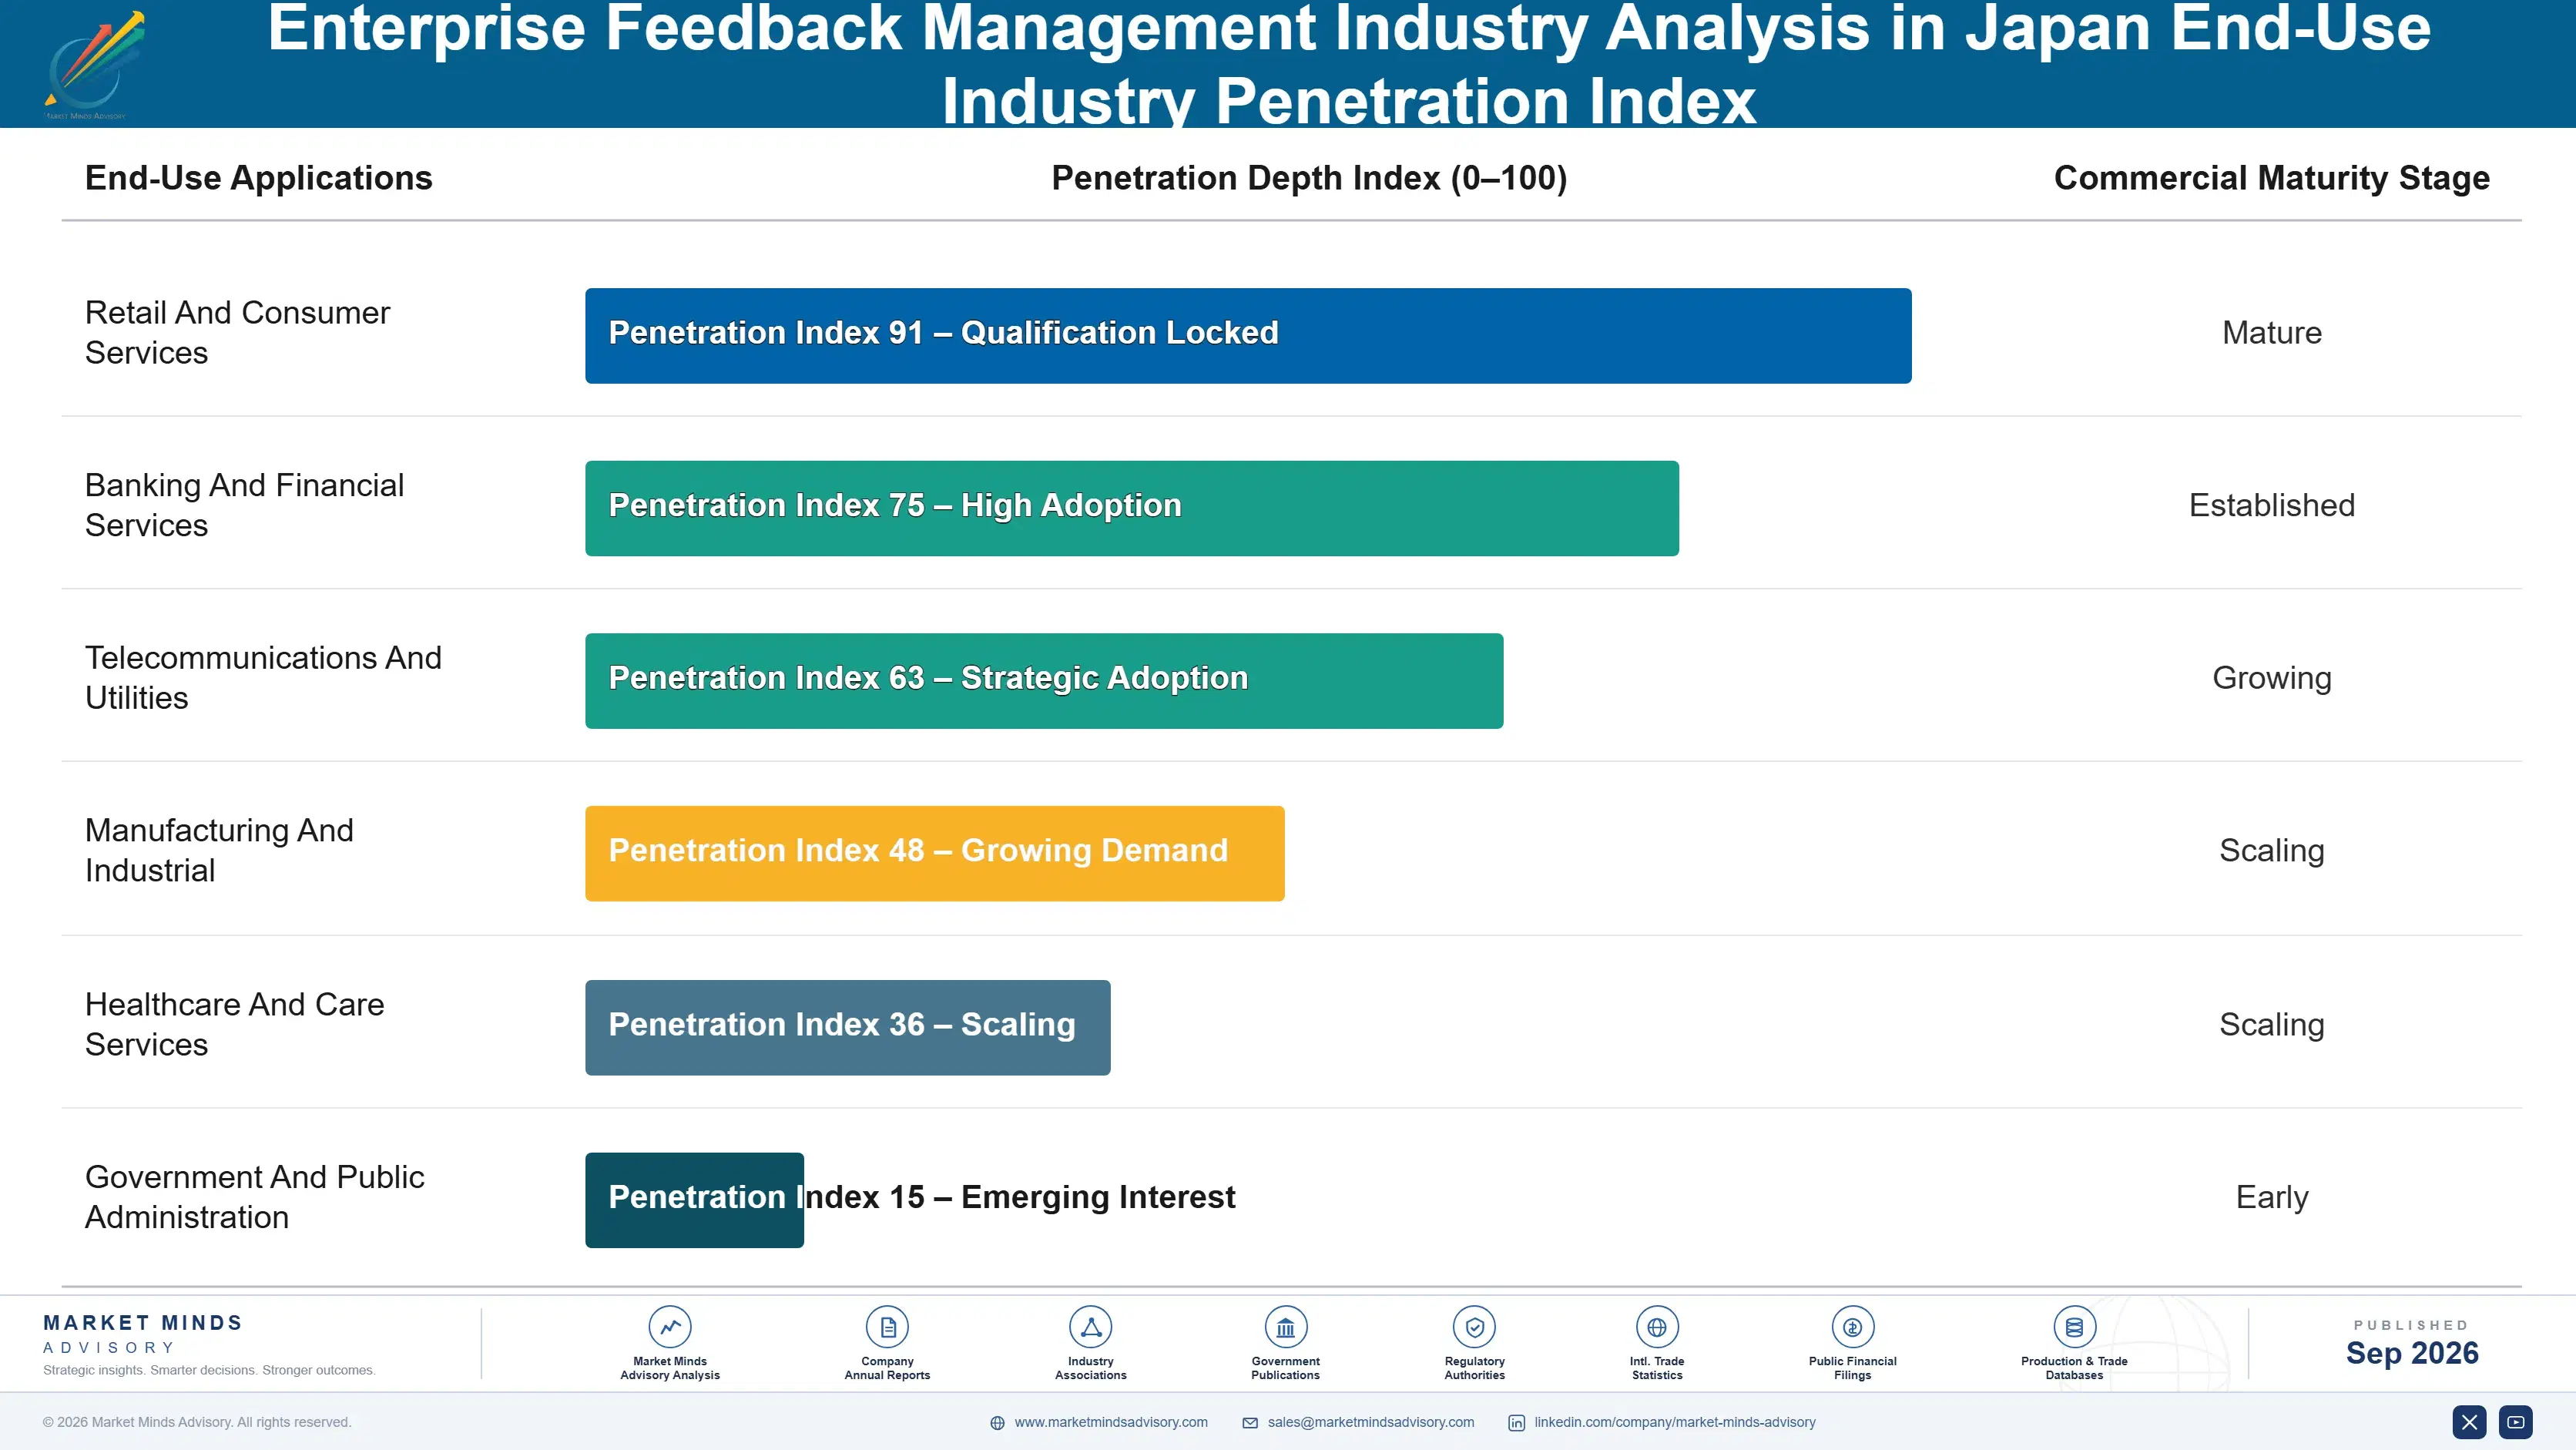
enterprise-feedback-management-industry-analysis-i-end-use-penetration-index-1789990599335

What Keeps Programmes Funded

These are among the four positions where our research anticipates prominent divergence between winners and laggards over the coming forecast period. Each is grounded in the demand model, the regulatory perimeter, and the announced capacity pipeline.
01 / SAMPLING HONESTY DISCIPLINE

Publish The Confidence, Not Just The Score

Emailed survey response rates near 7% mean a reported satisfaction score describes the small minority who still answer rather than the customer base it claims to represent. Executives who understand sampling have begun saying so directly, and several have cancelled programmes rather than continue funding numbers nobody could defend properly. Publishing confidence intervals and non-response analysis is commercially uncomfortable, and it is the only thing that keeps a programme funded once a chief executive has finally asked the question seriously and expects a real answer.
02 / PASSIVE SIGNAL MIGRATION

Stop Asking And Start Observing

Digital and in-product capture compounds at 13.8% and contact centre interaction analytics at 11.6%, and neither requires anybody to agree to participate in anything at all. Behaviour, hesitation, abandonment and recorded conversation all carry signal that a declining survey sample simply no longer provides. In Japan this matters more than anywhere, since a customer who will not score an organisation harshly will still abandon a checkout, and vendors defending survey tooling are protecting the one segment growing at only 4.6%.
03 / JAPANESE INSTRUMENT DESIGN

Rebuild The Scale, Do Not Translate It

Japanese satisfaction responses cluster within roughly 0.6 points of standard deviation, because scoring an organisation harshly is culturally uncomfortable in ways that Western instrument design never once contemplated. An analytics engine tuned for American variance reads that compression as noise and reports stability while a business steadily loses customers. Rebuilding scale construction, question wording and interpretation is genuine product engineering rather than translation, and the vendors who actually did it hold Japanese installed bases that nobody has managed to take.
04 / FRONTLINE LOOP CLOSURE

Deliver Feedback In Hours, Not Weeks

Feedback reaches the people who could actually act on it around 19 days after collection, by which point the customer has moved on entirely and the frontline manager has forgotten the shift in question. Programmes designed around executive reporting cycles produce dashboards rather than operational changes, which is exactly why buyers have started questioning what they are funding. Routing feedback to frontline managers within hours and reporting action rates alongside scores turns a measurement product into an operational one, which is what buyers were funding all along.

Engagement Snapshot From the Field

A live engagement with an industry participant carrying material or product regulatory and market exposure ahead of a defining policy shift, showing how our research translates into a defensible multi-year portfolio strategy.
MARKET MINDS ADVISORY · CLIENT ENGAGEMENT SUMMARY
Enterprise Feedback Management Industry Analysis in Japan Producer Strategic Portfolio Review and Transition Roadmap 2026·Investment Scenario on Enterprise Feedback Management Industry Analysis in Japan Exposure Evaluation 2025-26
CLIENT PROFILE
A Japanese retail group operating 1,180 stores nationally, running a customer satisfaction programme on a Western experience platform for four years. Reported scores had been stable throughout that period while same store footfall declined steadily. Executive sponsors were preparing to cancel the programme on the reasonable grounds that it had never once predicted anything that subsequently happened.
STRATEGIC CHALLENGE
Marketing defended the programme on the stability of the scores, which was technically accurate and analytically meaningless. Store operations had never received anything actionable from it. Nobody had examined whether a five point scale calibrated for Western response variance could detect change in Japanese answers at all, and the cancellation decision was scheduled for the following quarter.
MMA APPROACH
MMA analysed four years of Japanese response distributions against the platform's alerting thresholds, and compared score movement to actual footfall, basket size and repeat purchase behaviour by store. We tested a rebuilt instrument with wider effective discrimination on a store sample. The work drew on 47 expert interviews conducted in Q4 2025 with vendors, Japanese retailers and instrument design specialists.
KEY FINDINGS
  1. Japanese responses clustered within 0.6 points of standard deviation, well inside the platform's alerting threshold, so no store ever triggered an alert in four years.
  2. Stores with declining footfall showed no score movement at all, while abandonment and repeat purchase data separated them clearly from the rest.
  3. Feedback reached store managers around 22 days after collection, and 3 in 4 managers reported never having acted on any of it (client-reported, unverified by MMA).
  4. A rebuilt instrument tested on the trial stores produced roughly 3 times the effective discrimination of the original questionnaire across an identical customer base.
CLIENT PROFILE
A Japanese retail group operating 1,180 stores nationally, running a customer satisfaction programme on a Western experience platform for four years. Reported scores had been stable throughout that period while same store footfall declined steadily. Executive sponsors were preparing to cancel the programme on the reasonable grounds that it had never once predicted anything that subsequently happened.
STRATEGIC CHALLENGE
Marketing defended the programme on the stability of the scores, which was technically accurate and analytically meaningless. Store operations had never received anything actionable from it. Nobody had examined whether a five point scale calibrated for Western response variance could detect change in Japanese answers at all, and the cancellation decision was scheduled for the following quarter.
MMA APPROACH
MMA analysed four years of Japanese response distributions against the platform's alerting thresholds, and compared score movement to actual footfall, basket size and repeat purchase behaviour by store. We tested a rebuilt instrument with wider effective discrimination on a store sample. The work drew on 47 expert interviews conducted in Q4 2025 with vendors, Japanese retailers and instrument design specialists.
KEY FINDINGS
  1. Japanese responses clustered within 0.6 points of standard deviation, well inside the platform's alerting threshold, so no store ever triggered an alert in four years.
  2. Stores with declining footfall showed no score movement at all, while abandonment and repeat purchase data separated them clearly from the rest.
  3. Feedback reached store managers around 22 days after collection, and 3 in 4 managers reported never having acted on any of it (client-reported, unverified by MMA).
  4. A rebuilt instrument tested on the trial stores produced roughly 3 times the effective discrimination of the original questionnaire across an identical customer base.
RECOMMENDED STRATEGY
Phase 1: Phase one: rebuild the instrument for Japanese response patterns rather than cancelling the programme, since the measurement failed and the intent did not. Phase 2: Phase two: add behavioural signals from transaction and digital systems, which separated the declining stores when survey scores could not. Phase 3: Phase three: route store level feedback to managers within 48 hours and report action rates alongside scores at every executive review.
OUTCOME
The group rebuilt the instrument and added behavioural signals rather than cancelling (client-reported, unverified by MMA). Score discrimination improved substantially and declining stores became identifiable months earlier than before. Feedback now reaches store managers within two days and action rates are reported alongside scores, which is the change that outlasted the engagement.

Frequently Asked Questions

Foundational context covering the market sizes, CAGR, scope, country, region and competition that inform every finding below. This section is provided to cover basics and most often pre-purchase conversations, answered from the MMA Primary Research Dataset.

What is the current size of the Enterprise Feedback Management market?

Global value reaches USD 3.60 billion in 2026, measured as software subscription revenue across all six programme types. The 2025 base is USD 3.3 billion.

How large will the Enterprise Feedback Management market be by 2036?

Subscription revenue reaches USD 8.68 billion by 2036, an increase of USD 5.08 billion over the forecast period. That represents 2.41 times expansion from the 2026 base.

What is the CAGR for the Enterprise Feedback Management market 2026 to 2036?

The base case runs at 9.2% annually, with a bull case at 10.5% if behavioural capture gains executive credibility and a bear case at 7.9% if buyers conclude the category measures something unreliable.

Which segment is growing fastest?

Digital and in-product feedback capture grows at 13.8%, half again the market rate of 9.2%. It observes behaviour rather than asking questions that only around 7% of recipients now answer.

Who are the major companies in the Enterprise Feedback Management market?

Qualtrics, Medallia, NICE, Verint and Sprinklr lead on subscription revenue, together holding 46%. Macromill, Cross Marketing and Emotion Tech hold Japanese positions global vendors have not displaced.

Which country is growing fastest?

Japan leads at 12.4%, because a shrinking working age population made employee experience an operational constraint rather than a preference. India and Indonesia follow on similar attrition pressure.

Report Segmentation Architecture

The full report scope spans multiple orthogonal segmentation dimensions, with cross-tabulated demand data provided for each dimension pair. Coverage extends further to regional breakdowns, trend trajectories, and the competitive detail needed to support segment-level decision-making.

By Programme Type

  • Digital And In-Product Feedback Capture
  • Contact Centre Interaction Analytics
  • Employee Experience And Engagement Programmes
  • Operational Frontline Feedback Programmes
  • Product And Concept Feedback Programmes
  • Customer Experience Measurement Programmes

By End-Use Industry

  • Retail And Consumer Services
  • Banking And Financial Services
  • Telecommunications And Utilities
  • Manufacturing And Industrial
  • Healthcare And Care Services
  • Government And Public Administration

By Commercial Dimension

  • Direct Enterprise Subscription
  • Systems Integrator Implementation
  • Research Agency Delivered Programmes
  • Contact Centre Platform Bundling
  • Human Resources Platform Integration
  • Regional Reseller Distribution

By Region

  • North America
  • Western Europe
  • East Asia
  • South Asia and Pacific
  • Latin America
  • Middle East and Africa
  • Eastern Europe

Scope, Methodology, and Coverage

Every figure in this report is reproducible from documented input assumptions. The scope below maps the historical period, the forecast horizon, the segmentation dimensions, and the countries covered, alongside the underlying primary and qualitative methodology.
Historical Period
2020 to 2025
Forecast Period
2026 to 2036
Base Year
2025 (USD billions; MMA Primary Research Dataset, September 2026)
Market Definition
This report covers software for collecting, analysing and acting on structured customer and employee feedback: customer experience measurement programmes, employee experience and engagement programmes, product and concept feedback programmes, digital and in-product feedback capture, contact centre interaction analytics, and operational frontline feedback programmes. It excludes market research services sold as projects, social media monitoring, customer relationship management systems, human resources information systems, and general business intelligence tools.
Quantitative Units
USD millions, software subscription revenue basis; enrolled programme respondents; survey response rate as a percentage; score dispersion in scale points; feedback to action latency in days.
Segmentation Dimensions
Programme type; customer industry; commercial delivery route; geography across seven regions with Japan as the analytical centre.
Regions Covered
North America, Western Europe, East Asia, South Asia and Pacific, Latin America, Middle East and Africa, Eastern Europe
Countries Covered
Japan, South Korea, China, Taiwan, India, Indonesia, Australia, United States, Canada, Mexico, Brazil, United Kingdom, Germany, France, Netherlands, Sweden, Poland, Romania, United Arab Emirates, South Africa.
Key Companies Profiled
Qualtrics, Medallia, NICE, Verint, Sprinklr, Momentive, InMoment, Forsta, UserTesting, Genesys, Macromill, Cross Marketing, Emotion Tech, Link and Motivation, Rakuten Insight.
Quantitative Methodology
Primary survey, n=3,800 respondents, Q4 2025, six countries; demand-side model with trade association cross-validation
Qualitative Methodology
47 expert interviews, Q4 2025; applied to validate demand model assumptions, identify emerging dynamics, and assess competitive positioning
Report Format
PDF and XLSX data workbook (Word format preview document)
Publisher
Market Minds Advisory
Report Code
MMA-2026-TEC-541
Published
September 2026
Contact
sales@marketmindsadvisory.com | www.marketmindsadvisory.com

Purchase the full Enterprise Feedback Management Industry Analysis in Japan Report (2026 to 2036).

This report analyses enterprise feedback management with Japan as its analytical centre, sized from 2026 to 2036 across six programme types, six industries and seven regions. It explains why survey response rates near 7% have made executives question the entire category, how Japanese score compression at 0.6 points defeats analytics engines calibrated for Western variance, and why employee programmes now take 58% of Japanese enterprise spending. Cost composition is sourced to company annual reports, with instrument localisation analysed as the barrier global vendors keep failing to clear. Competitive assessment covers 20 named vendors.
Six programme types sized through to 2036
Japanese response compression analysed as a product problem
Localisation cost composition drawn from company annual filings
Twenty named vendors assessed on subscription revenue
Four revenue levers with quantified commercial impact
Anonymised Japanese retail programme redesign engagement included fully

Built For The People Who Decide

From boardroom strategy to bench-side execution, this report is read cover-to-cover by leaders shaping the next decade of their industry, turning demand scenarios, market dynamics and valuation benchmarks into decisions.
CXOs/ Presidents/ VPs/ Managers
M&A and Corporate Development
Strategy Teams and R&D Heads
Procurement and Product Directors
Regulatory and Compliance Leaders
Investor Relations and Equity Analysts