Market Minds Advisory
Engineering Service Outsourcing Market

Engineering Service Outsourcing Market: Engineering Service Outsourcing Market. AI-Assisted Design Tools Are Redefining What Counts as Billable Engineering Hours

Manufacturers cutting internal engineering headcount while racing to ship software-defined products are pushing far more design work to third-party providers, reshaping how those providers price and staff every programme. every major programme awarded.

Lead Analyst

Published

September 2026

Make Smarter Decisions with Customized Research Insights

Request a free sample report and evaluate market opportunities, growth trends, and competitive dynamics relevant to your business needs.

2025 MARKET VALUE$52.0BMarket Size 2025
2036 FORECAST VALUE$141.1BBase Case , 2026 to 2036
CAGR 2026 TO 20369.5 %Bull 10.7% / Bear 8.3%
INCREMENTAL OPPORTUNITY$84.2BNet 10- year value creation
EXPANSION MULTIPLE2.48x2036 value over 2026 base
Strategic Levers
M&A Pipeline
Regional Outlook
Country Rankings
Competitive Intelligence
Segmental Deep-dive
Call-Us : 91 93563 13602

Executive Snapshot and Market Trajectory.

Original equipment manufacturers cutting internal engineering headcount while racing to ship software-defined products are pushing far more design work than ever before to third-party engineering service providers, and that shift toward outsourced capacity is now the dominant force reshaping vendor pricing models and staffing strategy across the industry this year.
Demand concentrates among automotive, aerospace, and semiconductor manufacturers managing complex multi-domain programmes that internal teams cannot staff fast enough, while semiconductor and chip design engineering services are growing fastest as artificial intelligence hardware demand outpaces in-house design capacity at nearly every major chipmaker. South Asia and Pacific holds an outsized share of global delivery capacity, reflecting India's position as the world's dominant engineering services delivery hub built over two decades of domain expertise.
Competitive structure remains genuinely fragmented relative to other technology services categories, with large diversified information technology services firms, specialised engineering-only providers, and captive global capability centres all competing for the same client programmes. Clients increasingly expect providers to demonstrate artificial intelligence-assisted design tooling rather than pure headcount arbitrage, reshaping vendor evaluation criteria faster than several traditional providers anticipated when the category still competed primarily on labour cost differentials.
Market Definition
This market covers third-party engineering design, development, testing, and validation services provided to original equipment manufacturers across mechanical, electrical, software, and semiconductor domains, including both onshore and offshore delivery models. It excludes internal captive engineering centres wholly owned and staffed by the manufacturer itself, and general information technology outsourcing services that do not include dedicated product engineering deliverables.
Base Year Value
$52.0B in 2025 (MMA Primary Research Dataset, September 2026)
Forecast Period
2026 to 2036, eleven discrete annual values
CAGR
9.5% base case. Bull 10.7%. Bear 8.3%.
Fastest Growth Segment
Semiconductor and Chip Design Engineering Services: 15.0% CAGR
Fastest Growth Country
India: 13.5% CAGR
Fastest Growth Region
South Asia and Pacific: 11.5% CAGR
Largest Region
North America: 27% of 2025 global value
Market Leaders
Tata Technologies Limited, L&T Technology Services Limited, HCL Technologies Limited, Capgemini SE, Alten SA. Source: MMA Analysis based on company annual reports and investor filings.
Primary Survey
n=3,800 procurement and R&D decision-makers, Q4 2025, six countries
Methodology
Demand-side build-up, cross-validated against public data, 47 expert interviews

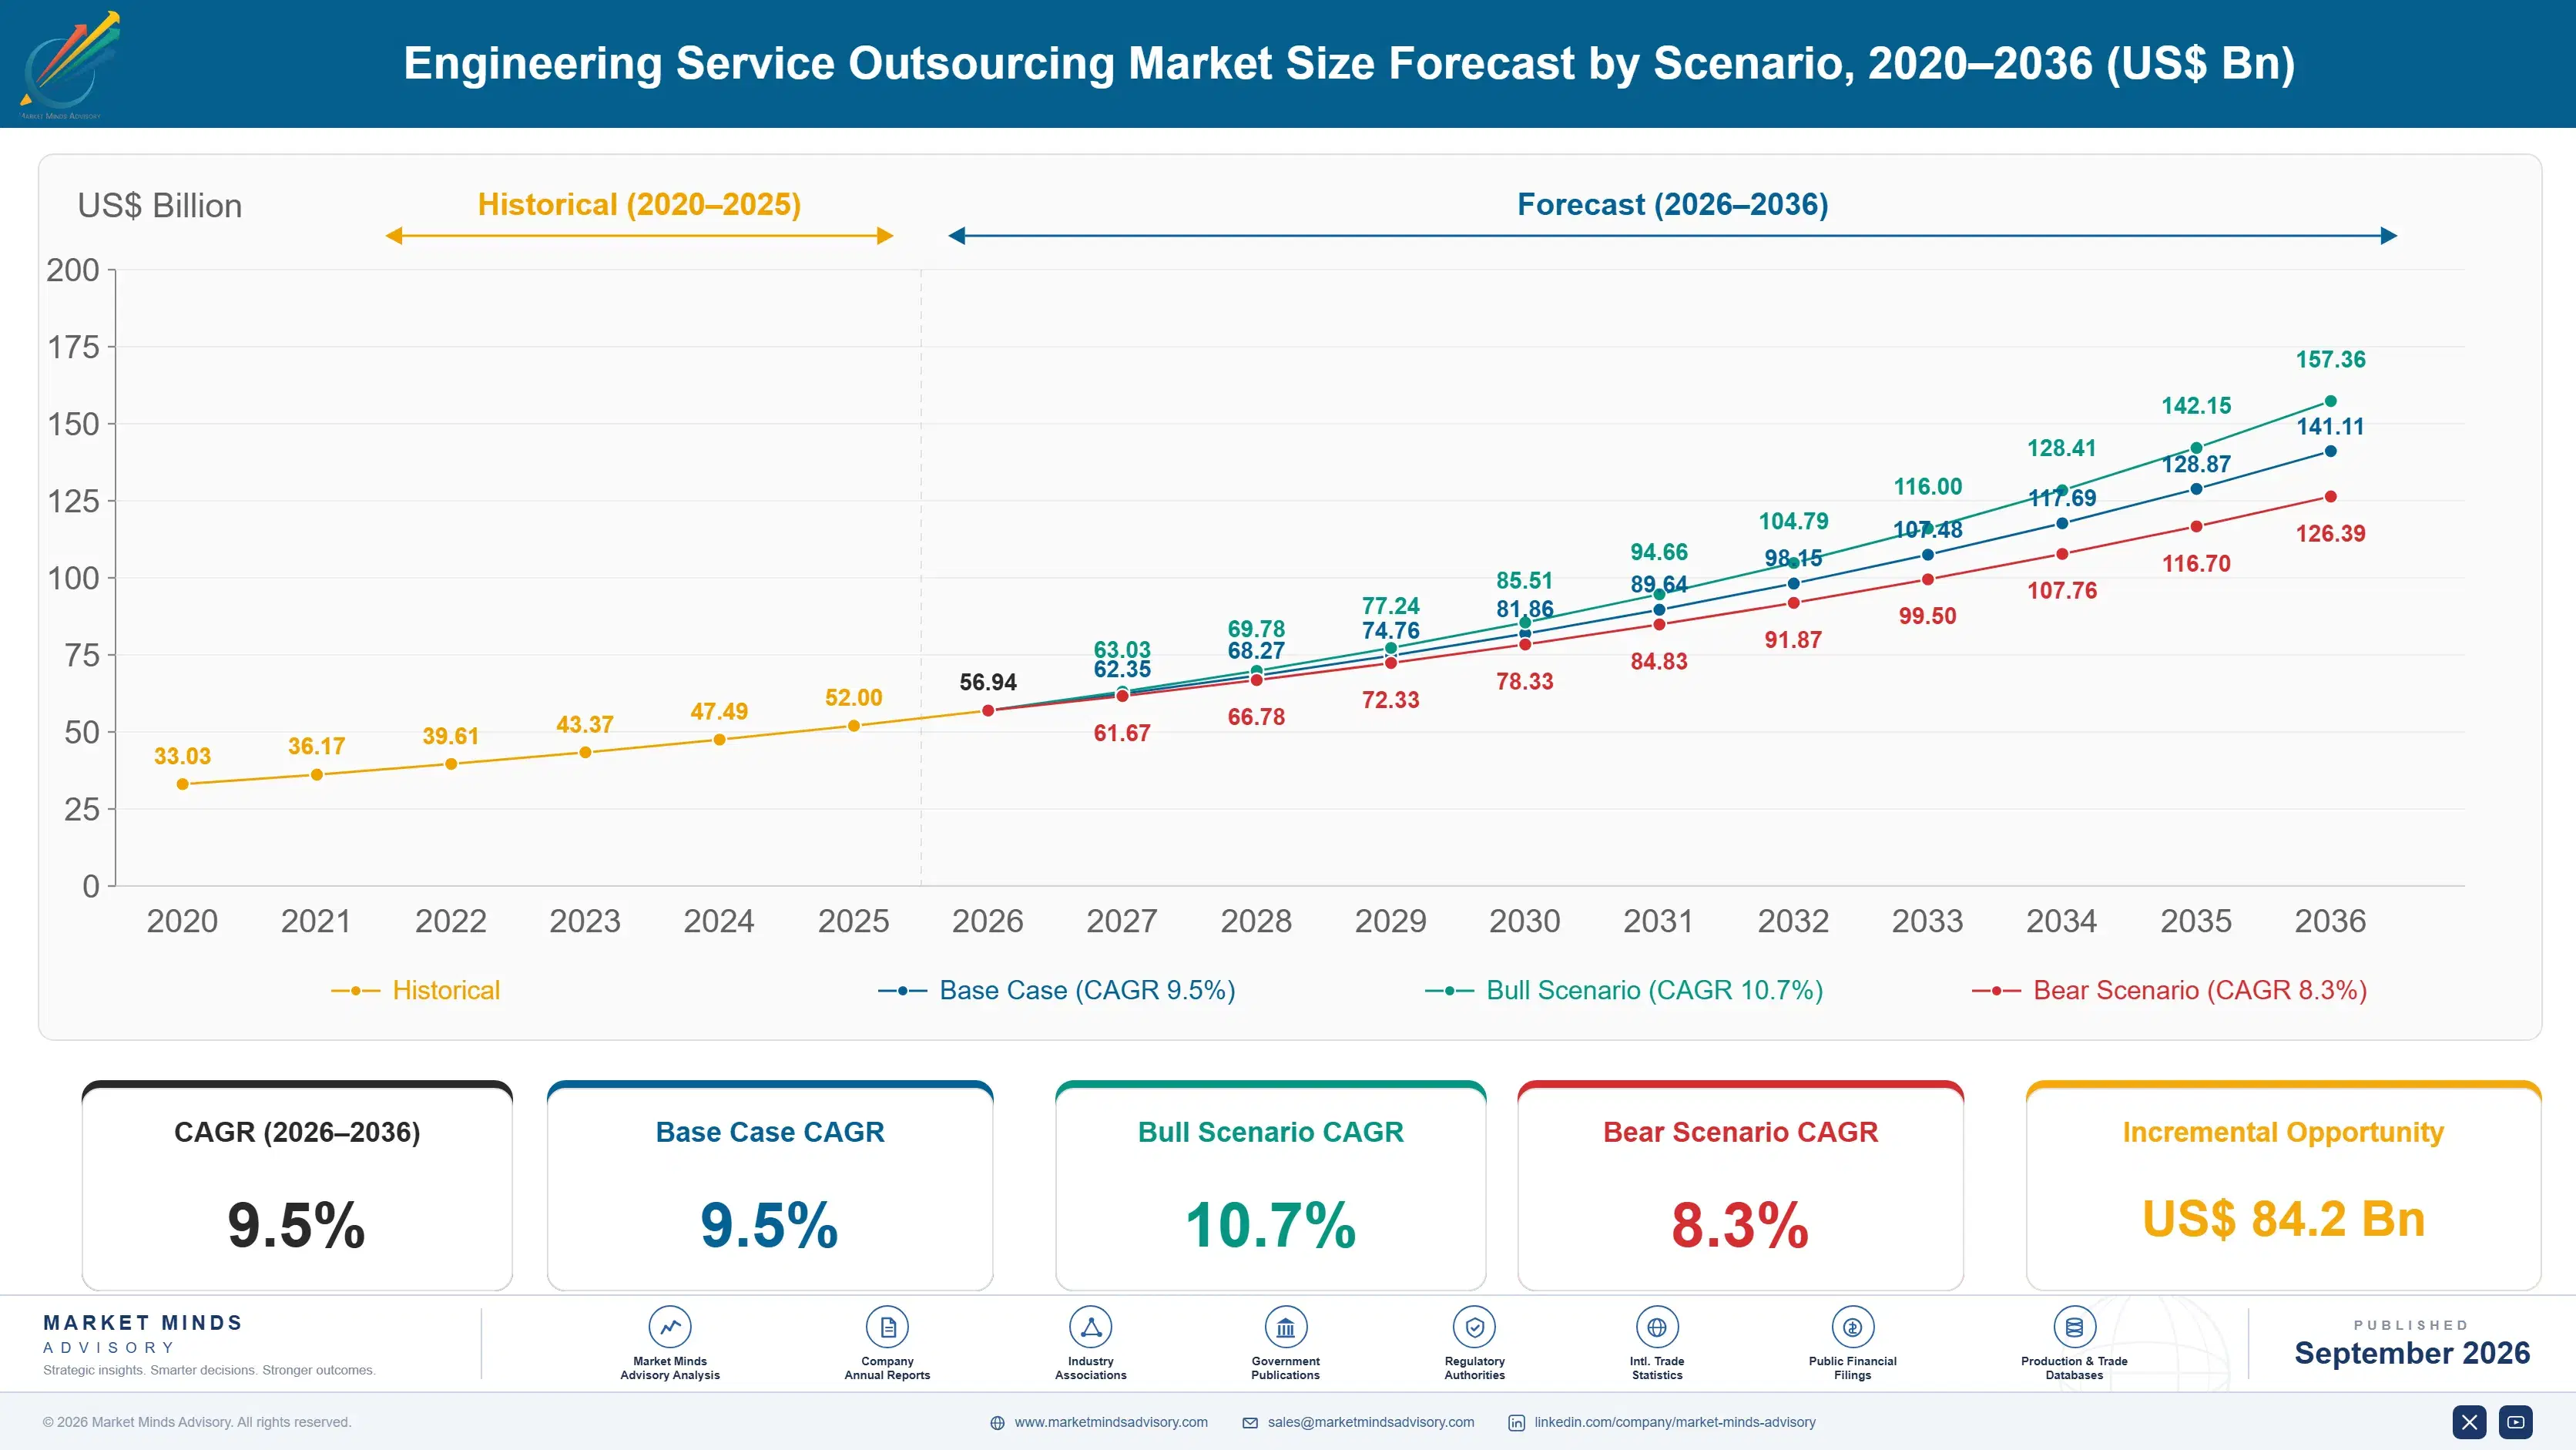
Engineering Service Outsourcing Market Forecast Scenarios

engineering-services-outsourcing-market-size-forecast-scenario-1788425027277
Between 2020 and 2025 the category grew steadily as manufacturers accelerated digital product development initiatives, with growth building further from 2023 onward as software-defined vehicle and artificial intelligence hardware programmes created engineering demand that internal teams at most manufacturers simply could not staff fast enough on their own. This momentum built gradually rather than in one sharp inflection point.
The base case assumes continued solid growth driven by three mechanisms: manufacturers permanently reducing internal engineering headcount while programme complexity keeps rising, semiconductor and artificial intelligence hardware design demand outpacing in-house capacity at nearly every major chipmaker, and growing provider investment in artificial intelligence-assisted design tooling that expands billable capacity without proportional headcount growth. These three mechanisms compound fastest among manufacturers running multiple simultaneous software-defined product programmes across mechanical, electrical, and software domains.
A bull scenario turns on artificial intelligence hardware demand accelerating faster than currently expected, pulling forward semiconductor design engineering spending across the industry broadly. The bear risk is a broader manufacturing capital expenditure downturn causing clients to pause discretionary engineering programmes, delaying outsourced spending regardless of the underlying internal capacity constraints driving the category's sustained growth.

From Labour Arbitrage to AI-Assisted Design Capacity

Two forces are reshaping this category at once: manufacturers permanently reducing internal engineering headcount even as programme complexity keeps rising, and providers embedding artificial intelligence-assisted design tooling into delivery models that expand billable engineering capacity without proportional headcount growth. Together these are pulling provider investment toward domain-specific artificial intelligence tooling and away from pure headcount-based staffing models that historically defined the category's commercial structure.
MARKET CONCENTRATIONCR5 32%Reflects a genuinely fragmented global engineering services category
AVERAGE BILLING RATEUSD 48 per engineering hourBlended across onshore and offshore delivery locations globally
TOP DELIVERY COUNTRY SHAREIndia 34%Reflects concentrated engineering talent pool and delivery infrastructure
OFFSHORE DELIVERY MIX58% of total billable hoursShare of engineering hours delivered from offshore locations
CLIENT REVENUE CONCENTRATIONTop ten clients 41%Reflects revenue dependence on largest automotive and aerospace accounts
AVERAGE ENGAGEMENT DURATION34 months per programmeTypical length of a multi-year outsourced engineering programme
Commercially, the market behaves like a maturing professional services category shifting from labour cost arbitrage toward genuine domain expertise and tooling differentiation. Clients increasingly evaluate providers on demonstrated artificial intelligence-assisted productivity gains and multi-domain programme management capability, creating real switching friction once a provider becomes embedded into a client's product development lifecycle across multiple concurrent programmes.
Over the next decade, expect artificial intelligence-assisted design tooling to become standard delivery infrastructure across nearly every engagement, while semiconductor and embedded software engineering increasingly account for a growing share of total category revenue relative to traditional mechanical design work. Providers that build genuine domain-specific artificial intelligence tooling alongside deep multi-domain programme management expertise will capture a growing share of category value beyond the traditional labour arbitrage positioning that long defined the category.
"Clients used to ask how many engineers you could staff. Now they ask how many billable hours your AI tooling can replace, and that is a completely different conversation."
Director, Engineering Services and Product Development Practice · MMA Technology Practice · September 2026

Market Trends

AI-Assisted Design Tooling Redefines Billable Engineering Capacity

Engineering service providers are embedding artificial intelligence-assisted design and simulation tooling directly into delivery models, expanding effective billable engineering capacity per engineer without proportional headcount growth, since generative design and automated simulation tools can complete certain routine design iteration tasks that previously required substantial manual engineering hours. MMA's Q4 2025 primary research found fifty eight percent of total billable engineering hours now delivered using some form of artificial intelligence-assisted tooling, up meaningfully from a much smaller share three years earlier, as providers completed tooling integration across major delivery centres. This is resetting how clients evaluate provider pricing claims.
Market Impact: Drives 48% of new outsourced engagements
Semiconductor Design Demand Outpaces In-House Chipmaker Capacity

Semiconductor companies racing to develop artificial intelligence hardware are increasingly outsourcing chip design engineering work that internal teams cannot staff fast enough given the compressed development timelines competitive pressure now demands across the industry. MMA's expert interview programme found chipmaker engineering leaders citing internal hiring constraints, not cost considerations, as the primary driver behind expanded outsourced chip design engagement over the past two years specifically. This shift favours providers with proven semiconductor domain expertise built over multiple prior chip design generations. Providers with established fabless semiconductor client relationships are best positioned to capture this expanding demand quickly.
Market Impact: Sustains demand across 62% of manufacturers

Market Opportunities and Growth Drivers

Software-Defined Product Transition Expands Multi-Domain Engineering Demand

The broad transition toward software-defined products across automotive, industrial, and consumer categories is expanding engineering demand across mechanical, electrical, and software domains simultaneously, creating multi-domain programme complexity that most internal engineering teams cannot staff entirely on their own without external support. Surveyed manufacturers linked forty eight percent of new outsourced engineering engagements directly to software-defined product programmes rather than traditional single-domain mechanical design work, according to MMA's Q4 2025 primary research programme covering manufacturer engineering leaders across six countries. This multi-domain complexity is sustaining outsourced demand even where traditional mechanical engineering headcount needs have moderated.
Market Impact: Limits outsourcing scope 20 points

Fixed-Cost Discipline Sustains Outsourced Capacity Demand

Continued manufacturer cost discipline around fixed internal engineering headcount is sustaining demand for variable, outsourced engineering capacity that can flex with programme volume without the long-term cost commitment permanent headcount requires. Announced engineering headcount reduction plans tracked in MMA's primary research programme remained elevated through 2025, sustaining outsourced demand across manufacturers treating engineering capacity as a variable cost input rather than a fixed internal capability. Providers structuring flexible capacity agreements are capturing a growing share of this variable-cost-oriented client spending across most manufacturer segments. This trend shows few signs of reversing given continued board-level cost scrutiny.
Market Impact: Extends hiring timelines 5 months

Market Restraints and Challenges

Intellectual Property Protection Concerns Limit Deep Design Outsourcing

Manufacturers remain cautious about outsourcing the most strategically sensitive design work to third-party providers, given persistent concerns about intellectual property protection and competitive knowledge leakage when core design expertise resides with an external provider rather than internal teams. The root cause is that some manufacturers experienced or heard about design knowledge migrating to competitor programmes through shared provider relationships, creating lasting institutional caution around outsourcing core differentiating technology. The commercial impact concentrates outsourcing toward less strategically sensitive design work while manufacturers retain core architecture decisions internally. Several providers are responding with dedicated, ring-fenced delivery teams and stronger contractual protection provisions.
Market Impact: Lifts AI-assisted delivery share 58 points

Domain Expertise Shortages Constrain Rapid Provider Capacity Scaling

Providers seeking to scale semiconductor and embedded software engineering capacity quickly face genuine domain expertise shortages, since the specialised engineering talent these domains require takes years to develop and cannot be trained as quickly as more generalist mechanical engineering capacity historically could be scaled. The root cause is that specialised domains like advanced chip design require accumulated experience across multiple prior product generations that a rapidly hired workforce simply has not had time to build. The commercial impact shows up as longer onboarding timelines and higher talent acquisition cost. Providers respond with academic partnerships built years ahead of demand.
Market Impact: Adds 15.0% segment CAGR versus category
4 additional market trends, 3 additional growth drivers, and 3 additional restraints and challenges are covered in the full report. Contact sales@marketmindsadvisory.com to access the complete intelligence.

Segment CAGR and Growth Architecture

Segmentation follows engineering domain and technology dimension, since that best explains both provider talent investment and client procurement behaviour, spanning traditional mechanical design services through to newer semiconductor and embedded software engineering categories across the industry. reflecting how clients actually organise procurement decisions and provider evaluation criteria across every domain. continuously. thoroughly. broadly. throughout.
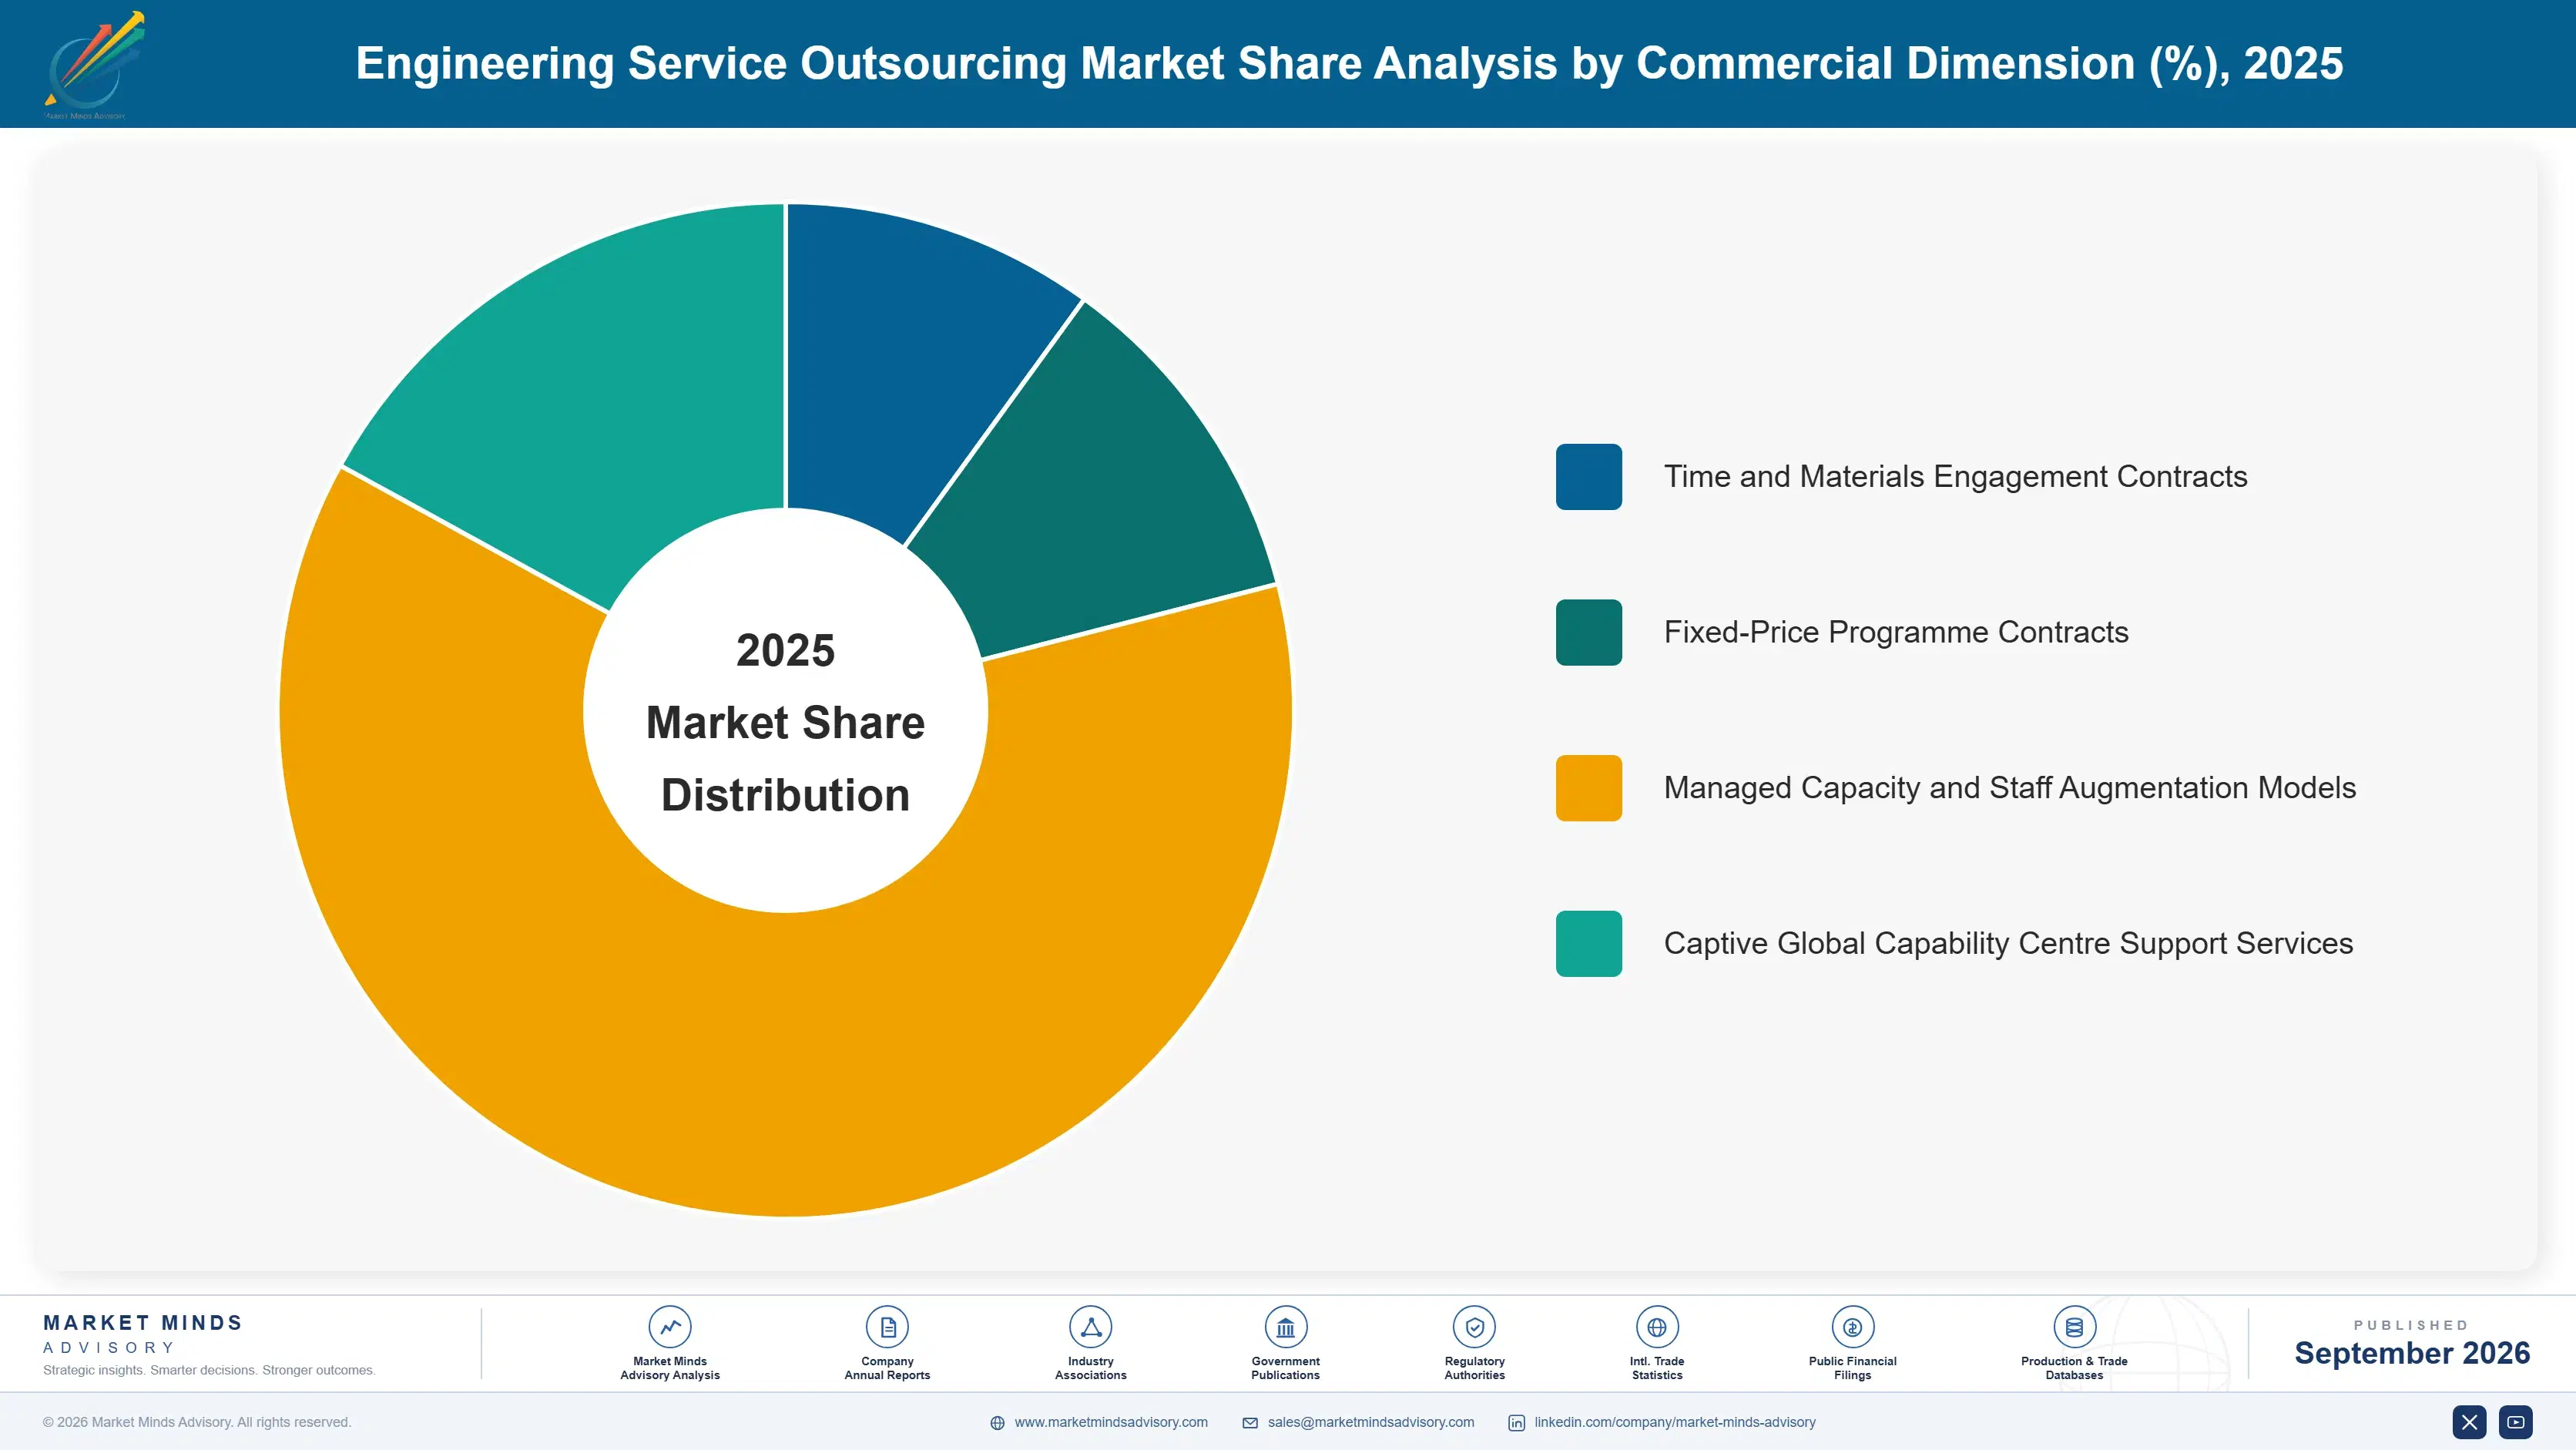
engineering-services-outsourcing-market-market-share-analysis-1788425027851

Semiconductor and Chip Design Engineering Services

This segment covers outsourced chip design, verification, and validation engineering services for semiconductor companies developing custom silicon, distinct from embedded software engineering services that develop software running on top of already-designed chips rather than the chip architecture itself. Adoption is concentrated among semiconductor companies racing to develop artificial intelligence hardware faster than internal teams can staff entirely on their own given intensely compressed competitive development timelines. Growth is outpacing every other segment in this report because artificial intelligence hardware demand is expanding chip design engineering need faster than any chipmaker's internal hiring can realistically keep pace with, creating urgent outsourced demand broadly. Fabless semiconductor clients increasingly ask providers directly about prior chip design programme experience.
CAGR 15.0%

Embedded Software and Electronics Engineering Services

This segment covers outsourced software and electronics engineering services for embedded systems across automotive, industrial, and consumer product categories, distinct from semiconductor chip design services that develop the underlying silicon architecture rather than software running on established chip platforms. Demand is rising as software-defined product transitions across multiple industries expand embedded software engineering need well beyond what internal teams historically required for hardware-centric product generations. Growth trails the semiconductor segment only because embedded software engineering outsourcing, while accelerating steadily, builds on an already larger existing installed base relative to the newer, faster-scaling chip design category specifically. Consumer electronics manufacturers are increasingly outsourcing similar embedded work too, extending demand beyond the segment's original automotive-centric base this year.
CAGR 13.0%
Full segment breakdown across 6 segments available in the complete report.

Regional Architecture and Country Demand Map

North America and Western Europe together anchor more than half of global client demand, reflecting concentrated automotive and aerospace manufacturer programme spending, while South Asia and Pacific carries an outsized share of global delivery capacity given India's established engineering services hub. across nearly every industry vertical and delivery model tracked.

North America

United States automotive, aerospace, and semiconductor manufacturers represent the overwhelming majority of regional demand, commissioning large-scale outsourced engineering programmes spanning software-defined vehicle development and artificial intelligence hardware design specifically. Canadian aerospace manufacturers contribute a smaller but steady share tied to comparable programme complexity across their own product portfolios. Growth here runs above the global base as artificial intelligence hardware design demand accelerates alongside continued steady programme activity across the region's largest manufacturer client relationships specifically this year and into the next forecast period. This concentration should persist through most of the remaining forecast period given sustained programme complexity. Client budgets here should keep expanding steadily. Provider hiring here should stay competitive as demand keeps climbing.
Share: 27% | CAGR: 10.0% (2026 to 2036)

Western Europe

German automotive manufacturers drive a meaningful share of regional demand, outsourcing software-defined vehicle engineering work tied to the industry's broader electrification and software platform transition across the country's largest original equipment manufacturers. French aerospace manufacturers show steady demand for outsourced engineering tied to comparable multi-year aircraft development programme cycles. Growth trails the global rate somewhat because several major European manufacturers maintain larger internal engineering teams than comparable United States peers, limiting the region's overall outsourcing propensity relative to markets with leaner internal engineering functions. This pattern should hold as long as internal engineering headcount remains comparatively larger than United States peers. Providers with leaner cost structures should gain share gradually here.
Share: 23% | CAGR: 8.0% (2026 to 2036)
Regional intelligence for 5 additional markets available in the complete report: East Asia, South Asia and Pacific, Latin America, Middle East and Africa, Eastern Europe. Contact sales@marketmindsadvisory.com.
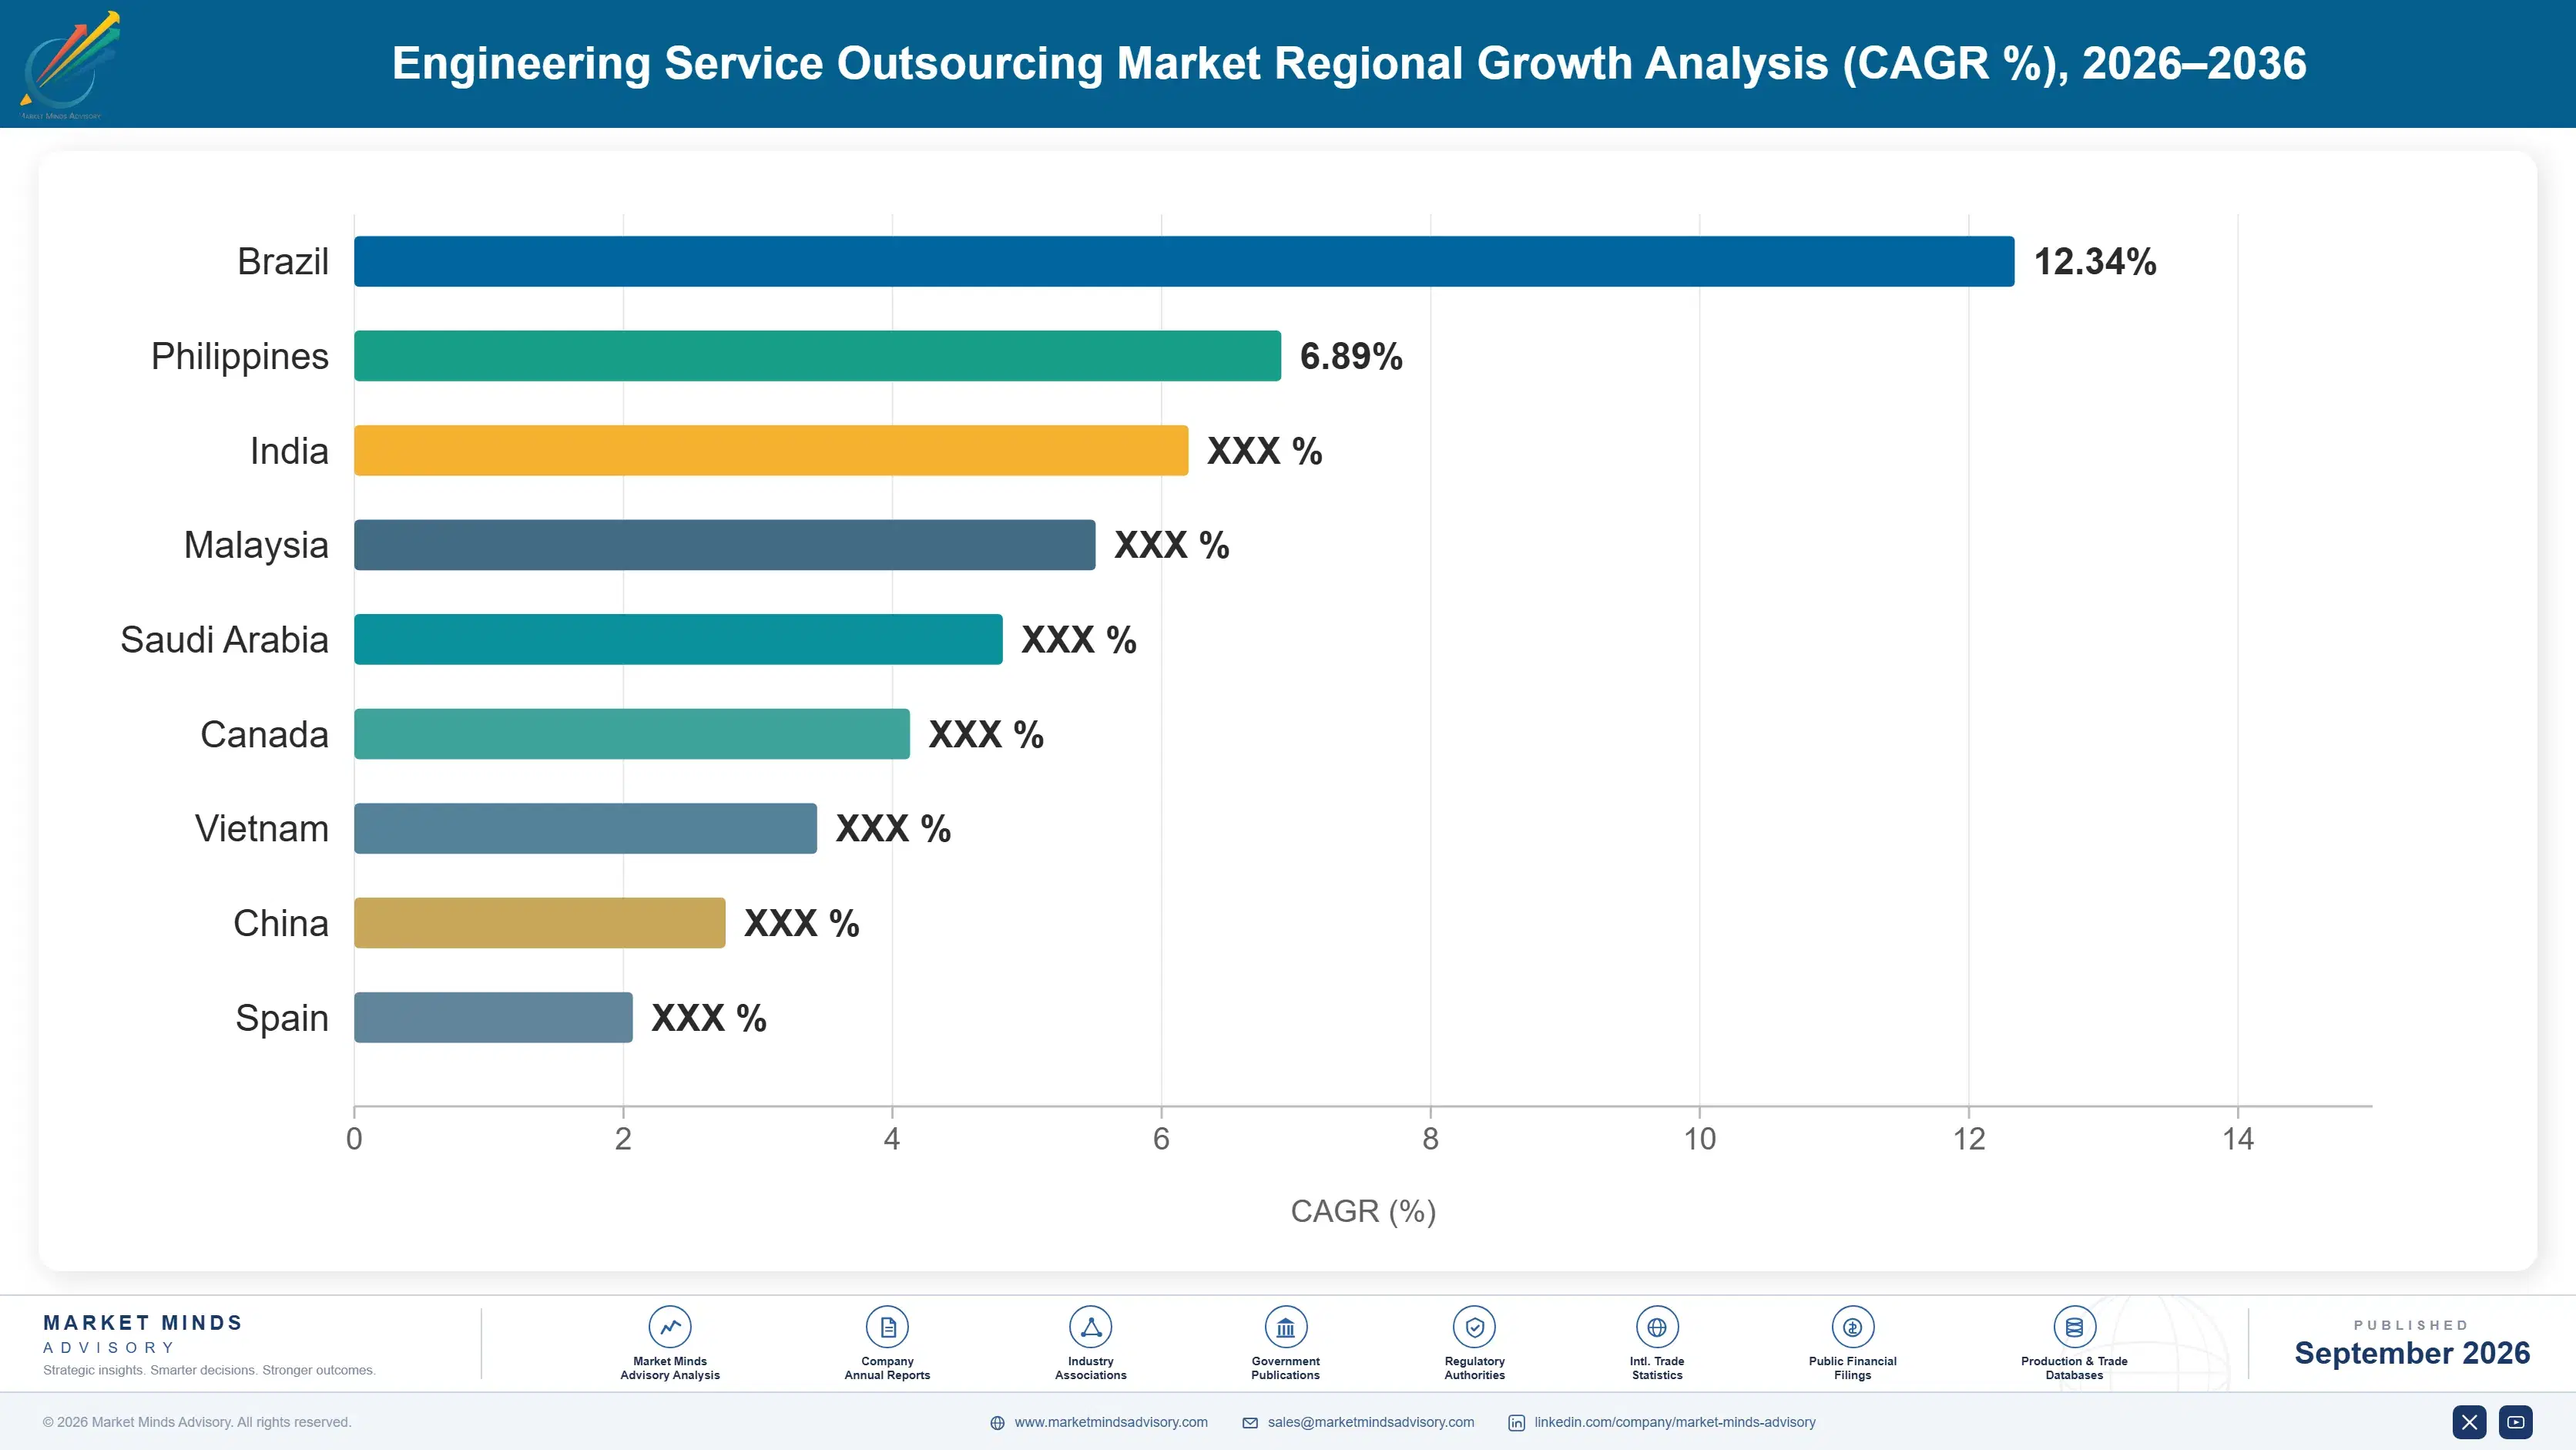
engineering-services-outsourcing-market-country-cagr-analysis-1788425028376

Where Engineering Providers Can Still Expand Margin

Four commercial levers separate providers capturing durable premium billing rates from those competing purely on headcount cost, spanning artificial intelligence-assisted tooling depth, semiconductor domain expertise, multi-domain programme management capability, and dedicated intellectual property protection assurance for sensitive engagements. so providers that master more than one dimension typically outperform single-lever competitors by a wide margin over multi-year contracts.

Building Proprietary AI-Assisted Design Tooling Depth

Providers that built proprietary artificial intelligence-assisted design and simulation tooling are winning a disproportionate share of new programme awards from clients seeking demonstrated productivity gains beyond simple headcount availability, since generative design tooling genuinely expands billable capacity per engineer in ways clients can measure directly. Providers with proprietary AI tooling reported win rates roughly 27 percent higher than providers offering only traditional headcount-based delivery models. The approach requires sustained software development investment that smaller providers sometimes cannot justify given their existing cost structure. Smaller providers attempting similar claims without comparable tooling investment often lose credibility once clients request supporting evidence.
Market Impact: Lifts win rate meaningfully by 27 points overall

Establishing Deep Chip Design Domain Expertise

Providers that established deep semiconductor and chip design domain expertise, built across multiple prior chip design generations, are winning premium engagements that generalist mechanical engineering providers cannot credibly compete for given the specialised technical depth required. This lever requires sustained investment in specialised talent acquisition and academic partnerships that generalist providers have often not developed internally. Providers with established semiconductor domain expertise reported average billing rates roughly 38 percent above comparable generalist mechanical engineering services of similar programme scope. This gap tends to widen further once clients directly compare delivery outcomes across providers.
Market Impact: Lifts billing rate meaningfully by 38 points overall

Deepening Cross-Domain Programme Management Depth Further

Providers that built genuine multi-domain programme management capability spanning mechanical, electrical, and software engineering simultaneously are winning larger, more integrated programme awards than providers offering only single-domain point services requiring separate client coordination across multiple vendors. This lever requires organisational and process investment that single-domain specialists sometimes have not prioritised given their narrower historical service scope. Providers with multi-domain programme management capability reported average contract values roughly 42 percent above comparable single-domain engagement scope. Single-domain specialists attempting to retrofit this breadth later often struggle against purpose-built multi-domain competitors already established.
Market Impact: Lifts contract value meaningfully by 42 points overall

Offering Dedicated Intellectual Property Protection Assurance

Providers that built dedicated, ring-fenced delivery team structures with enhanced intellectual property protection provisions are winning the most strategically sensitive engagements that clients would otherwise keep entirely in-house given competitive knowledge leakage concerns. This lever requires organisational structure and contractual investment that providers without established client trust sometimes cannot credibly offer regardless of technical capability. Providers offering dedicated ring-fenced delivery reported access to engagement categories roughly 3 to 4 times broader than providers without comparable protection assurance. Providers lacking this trust often struggle to compete for the same sensitive engagement categories regardless of technical capability.
Market Impact: Wins access to 3 to 4 times more engagements

Who Controls the Margin Pool

CR5 sits at thirty two percent, evaluated on disclosed engineering services segment revenue across the top providers, reflecting a genuinely fragmented category where large diversified information technology services firms, specialised engineering-only providers, and captive global capability centres all compete for the same client programmes. The gap between the largest providers and the long tail of smaller specialists is narrower here than in more consolidated technology services categories.
Current competitive activity centers on three fronts: building proprietary artificial intelligence-assisted design tooling to demonstrate productivity gains beyond headcount availability, establishing deep semiconductor domain expertise to win premium engagements, and deepening multi-domain programme management capability to win larger integrated programme awards. Price competition remains most intense among commodity mechanical design services while premium semiconductor and multi-domain engagements increasingly compete on demonstrated tooling and domain expertise.

Emerging pressure is building from two directions. Captive global capability centres that manufacturers establish internally are increasingly competing directly with third-party providers for the same engineering talent pool, particularly in India's deep talent market. At the innovation end, specialised artificial intelligence design tooling startups are attracting renewed investor interest, a dynamic that could meaningfully reorder segment rankings as tooling differentiation becomes a larger share of competitive positioning.
engineering-services-outsourcing-market-company-positioning-matrix-1788425028910

Competitive Moat and Risk Dimensions

TATA TECHNOLOGIES LIMITED

Moat: Deep Automotive Domain Relationships

Tata Technologies' decades-long automotive engineering relationships across major global manufacturers give it a domain credibility and account continuity advantage that newer entrants cannot easily replicate without comparable automotive programme history built consistently over multiple vehicle generations. This history is difficult for newer entrants to replicate quickly regardless of available capital.
TATA TECHNOLOGIES LIMITED

Risk: Automotive Client Concentration Exposure

Tata Technologies faces meaningful revenue concentration risk tied to automotive industry cyclicality, since a broader automotive sector downturn would disproportionately affect its revenue relative to more diversified competitors with stronger presence across aerospace and semiconductor domains specifically. This exposure could compress margins meaningfully during the next industry downturn cycle.
L&T TECHNOLOGY SERVICES LIMITED

Moat: Broad Multi-Domain Engineering Breadth

L&T Technology Services' genuine multi-domain engineering capability spanning mechanical, electrical, software, and semiconductor domains gives it an integrated programme advantage that single-domain specialist competitors cannot easily replicate without comparable organisational breadth built over many years. This breadth is difficult for single-domain specialists to replicate quickly regardless of investment.
L&T TECHNOLOGY SERVICES LIMITED

Risk: Margin Pressure From Diversified Competitors

L&T Technology Services faces margin pressure from larger diversified information technology services firms bundling engineering services into broader technology services contracts at competitive pricing, particularly among clients prioritising vendor consolidation over specialised engineering domain depth. This pressure intensifies further as diversified competitors expand their own engineering capability.

Players Tracked

Prominent Players

Tata Technologies Limited
L&T Technology Services Limited
HCL Technologies Limited
Capgemini SE
Alten SA

Other Key Players

Cyient Limited
Akkodis Inc.
Bertrandt AG
EDAG Engineering Group AG
Segula Technologies SAS
Ricardo plc
AVL List GmbH
Belcan LLC
QuEST Global Services Pte Ltd
Infosys Limited
Wipro Limited
Tech Mahindra Limited
GlobalLogic Inc.
Luxoft Holding Inc.
KPIT Technologies Limited

Recent Developments

JANUARY 2026

L&T Technology Services Launches Proprietary Generative Design Platform

L&T Technology Services launched a proprietary generative design and simulation platform intended to expand billable engineering capacity per engineer across mechanical and electrical design engagements, extending its existing multi-domain service portfolio ahead of increasing client demand for demonstrated artificial intelligence-assisted productivity gains. across most delivery centres broadly.
Signal: Confirms established providers racing to build proprietary AI tooling as a core competitive differentiator. across the industry going forward.
OCTOBER 2025

Tata Technologies Acquires Semiconductor Design Specialist ChipCraft Engineering

Tata Technologies completed the acquisition of semiconductor design specialist ChipCraft Engineering, adding chip design and verification engineering capability intended to strengthen its position in the fastest-growing segment ahead of increasing client demand for artificial intelligence hardware design support. across semiconductor accounts. This reflects continued industry consolidation.
Signal: Indicates semiconductor domain acquisition activity accelerating among established engineering service providers. across the broader engineering services landscape.
JUNE 2025

HCLTech Signs Multi-Year Programme Agreement With Global Aerospace Manufacturer

HCLTech signed a multi-year programme agreement with a global aerospace manufacturer covering multi-domain engineering support across several concurrent aircraft development programmes, securing long-term revenue commitment tied to the manufacturer's phased development schedule through the remainder of the decade. across the manufacturer's footprint. This reflects continued reliance on large programme agreements.
Signal: Signals large multi-domain programme agreements remaining a key competitive lever for scaled providers. going forward across comparable client accounts.

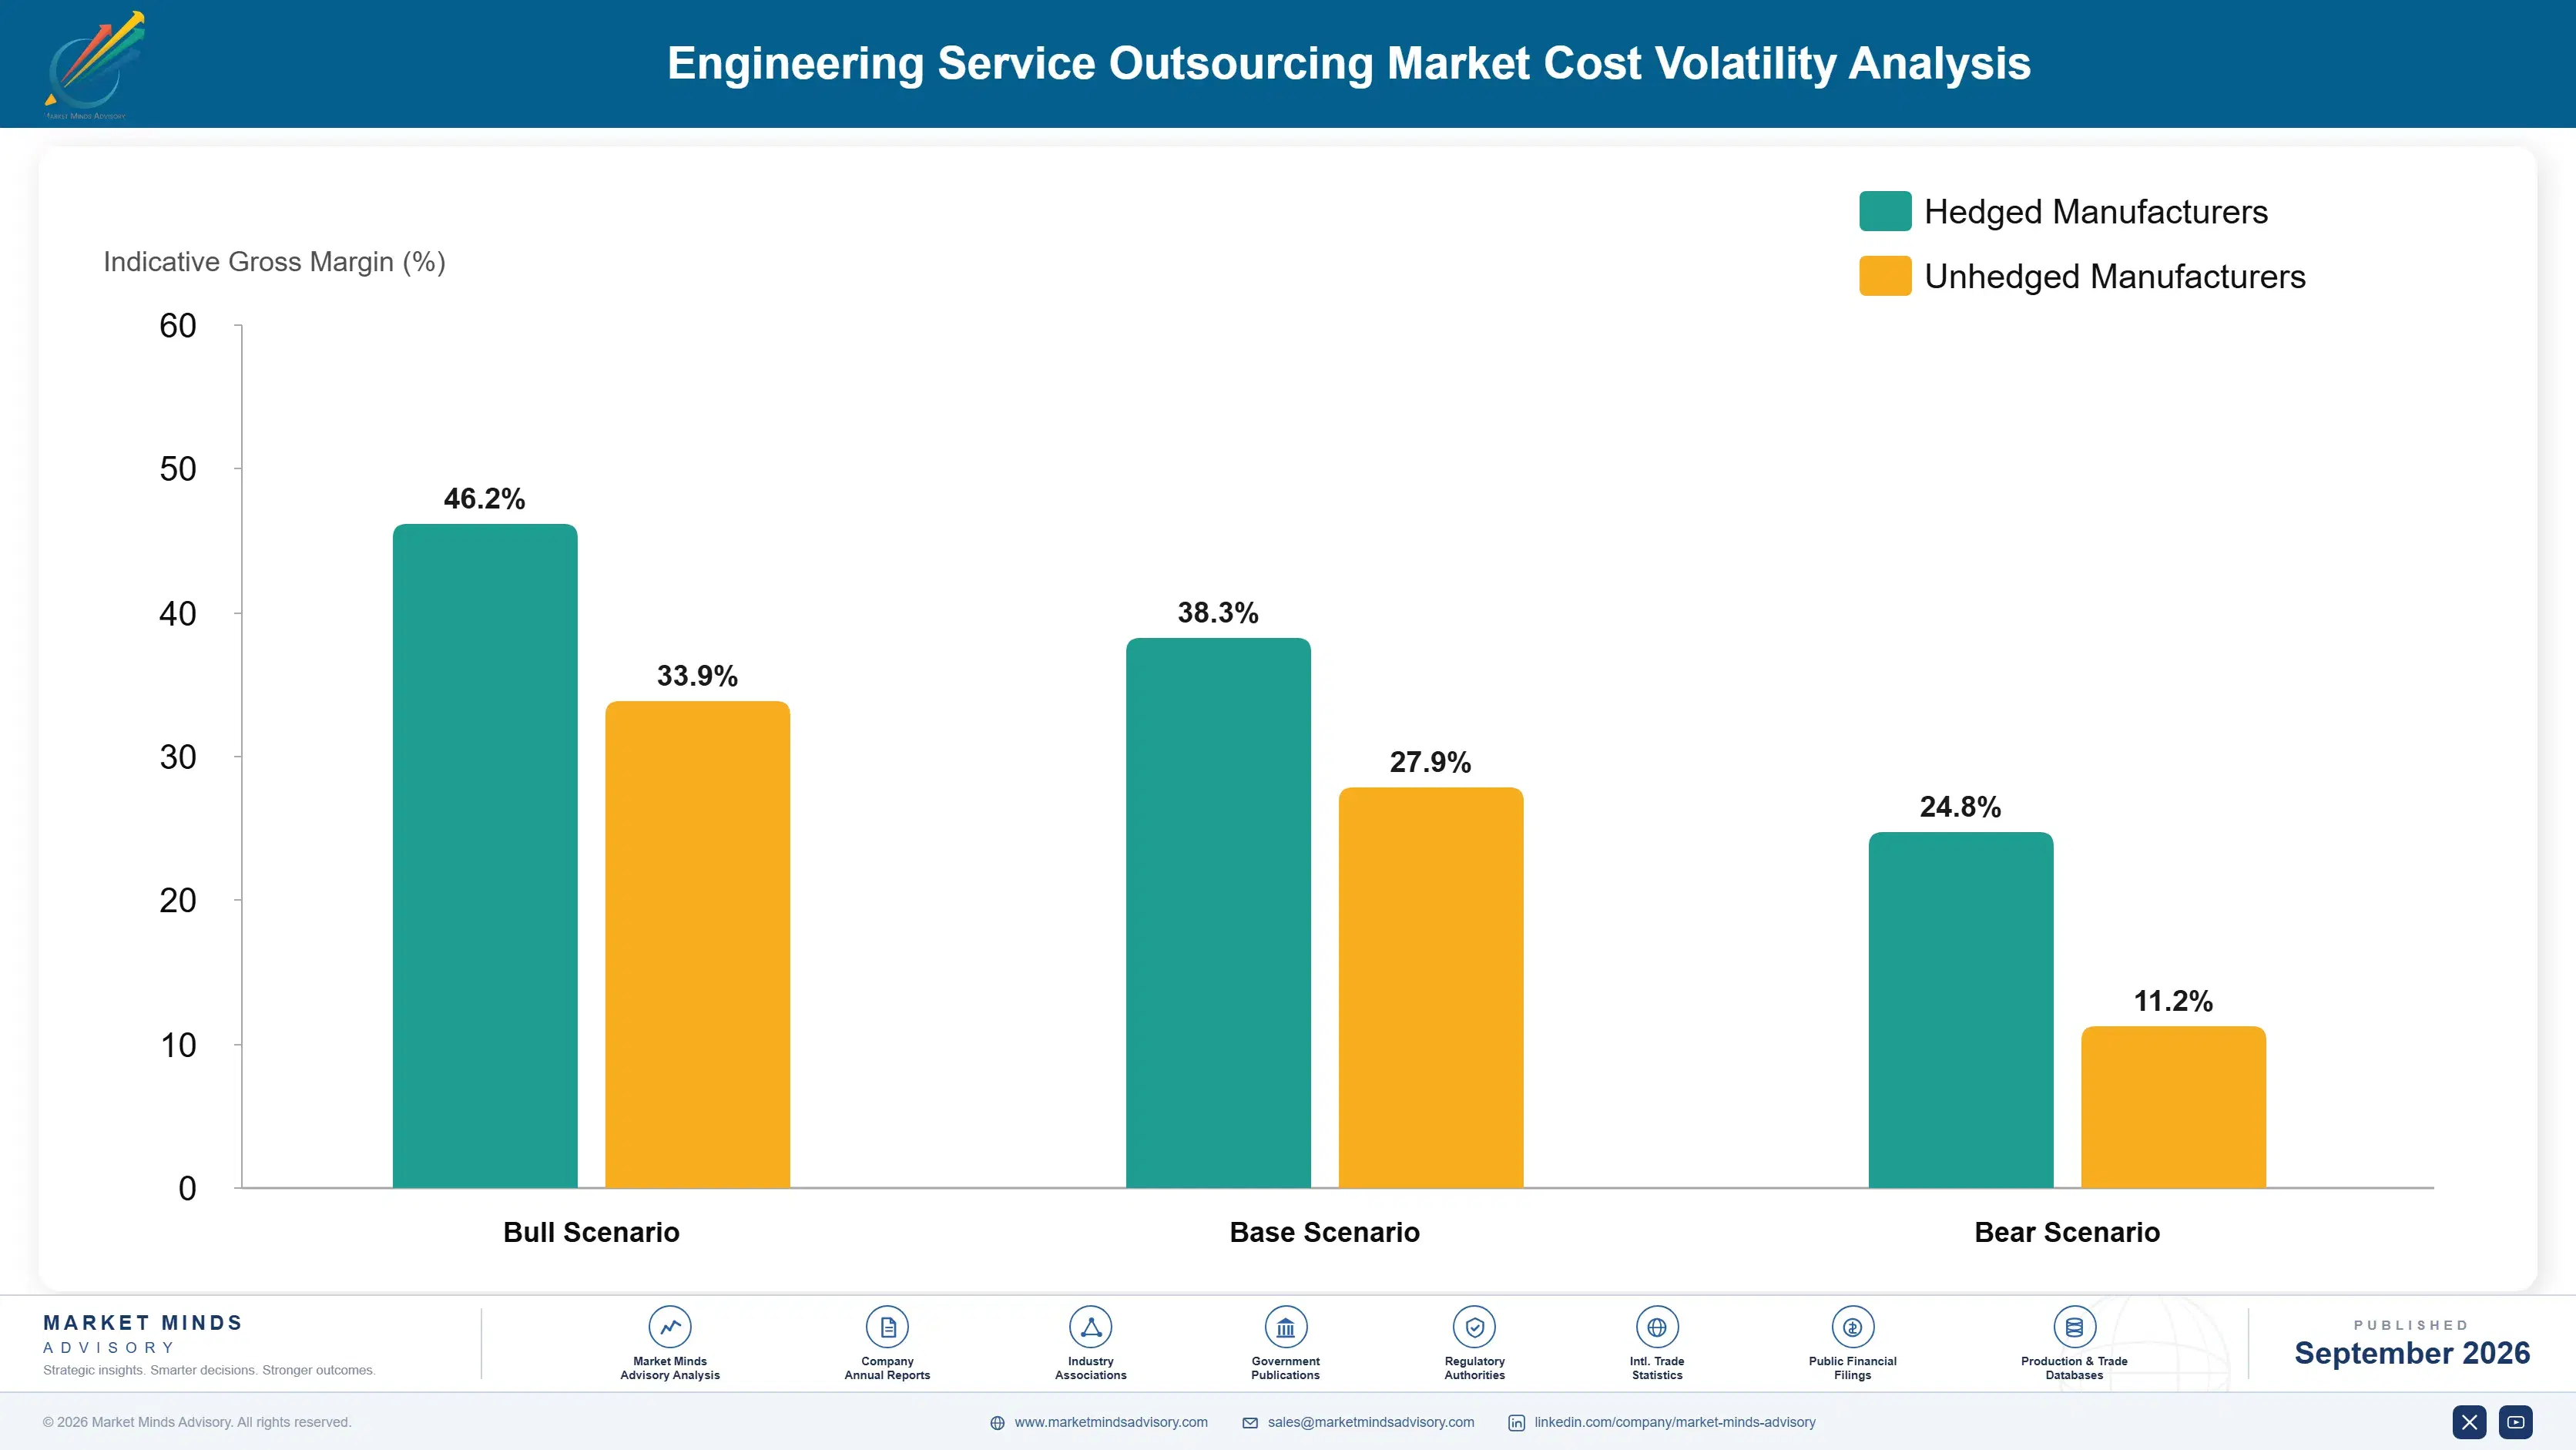
Specialised Engineering Talent and Tooling License Exposure

Specialised engineering talent compensation and design tooling software licensing together represent the largest cost input for engineering service providers, running an estimated 62 to 70 percent of cost of goods sold, sourced primarily from a competitive global engineering labour market and a small number of dominant computer-aided design and simulation software vendors. Facilities costs add a smaller but meaningful share across most operations.
Specialised semiconductor and embedded software engineering talent compensation rose meaningfully across the broader technology sector during 2023 and 2024 as artificial intelligence hardware demand outpaced qualified talent supply industry-wide, a pattern consistent with technology sector compensation trends tracked across multiple provider annual reports and public disclosures reviewed for this analysis. Providers without established specialised talent pipelines faced longer client onboarding delays than those with existing domain scale.

The competitive disadvantage falls hardest on smaller providers without the balance sheet to compete for scarce specialised talent against larger, better-capitalised competitors and adjacent technology sectors offering comparable compensation. Exposure varies by domain too, since providers building semiconductor and artificial intelligence hardware capability face materially greater talent cost exposure than providers offering primarily traditional mechanical engineering services built on more widely available skill sets.
engineering-services-outsourcing-market-cost-volatility-analysis-1788425029104

Building Distributed Delivery Centres Across Lower-Cost Regions

Larger providers are building distributed delivery centres across secondary cities with lower compensation benchmarks than primary talent hubs, reducing talent cost exposure while maintaining access to a broader qualified candidate pool than a single-location hiring strategy would realistically allow. This approach has become standard practice among the largest engineering service providers tracked in this report.

Investing in Academic Partnerships for Specialised Talent Pipelines

Several providers are building dedicated academic partnership programmes targeting semiconductor and embedded software engineering talent years ahead of anticipated demand, reducing reliance on costly lateral hiring from a limited pool of already-experienced specialised engineers. This approach has become increasingly common among providers competing in the fastest-growing specialised domains. This reduces reliance on costly lateral hiring considerably.

Standardising on Fewer Design Tooling Software Vendors

Providers are consolidating design tooling software licensing onto fewer vendor relationships to negotiate better enterprise pricing terms, accepting somewhat reduced tooling flexibility in exchange for materially lower overall software licensing cost across delivery centres. This approach has become standard among providers managing delivery centres across multiple regions. This also improves overall cost predictability for smaller providers.

Portfolio Architecture for Margin Defence

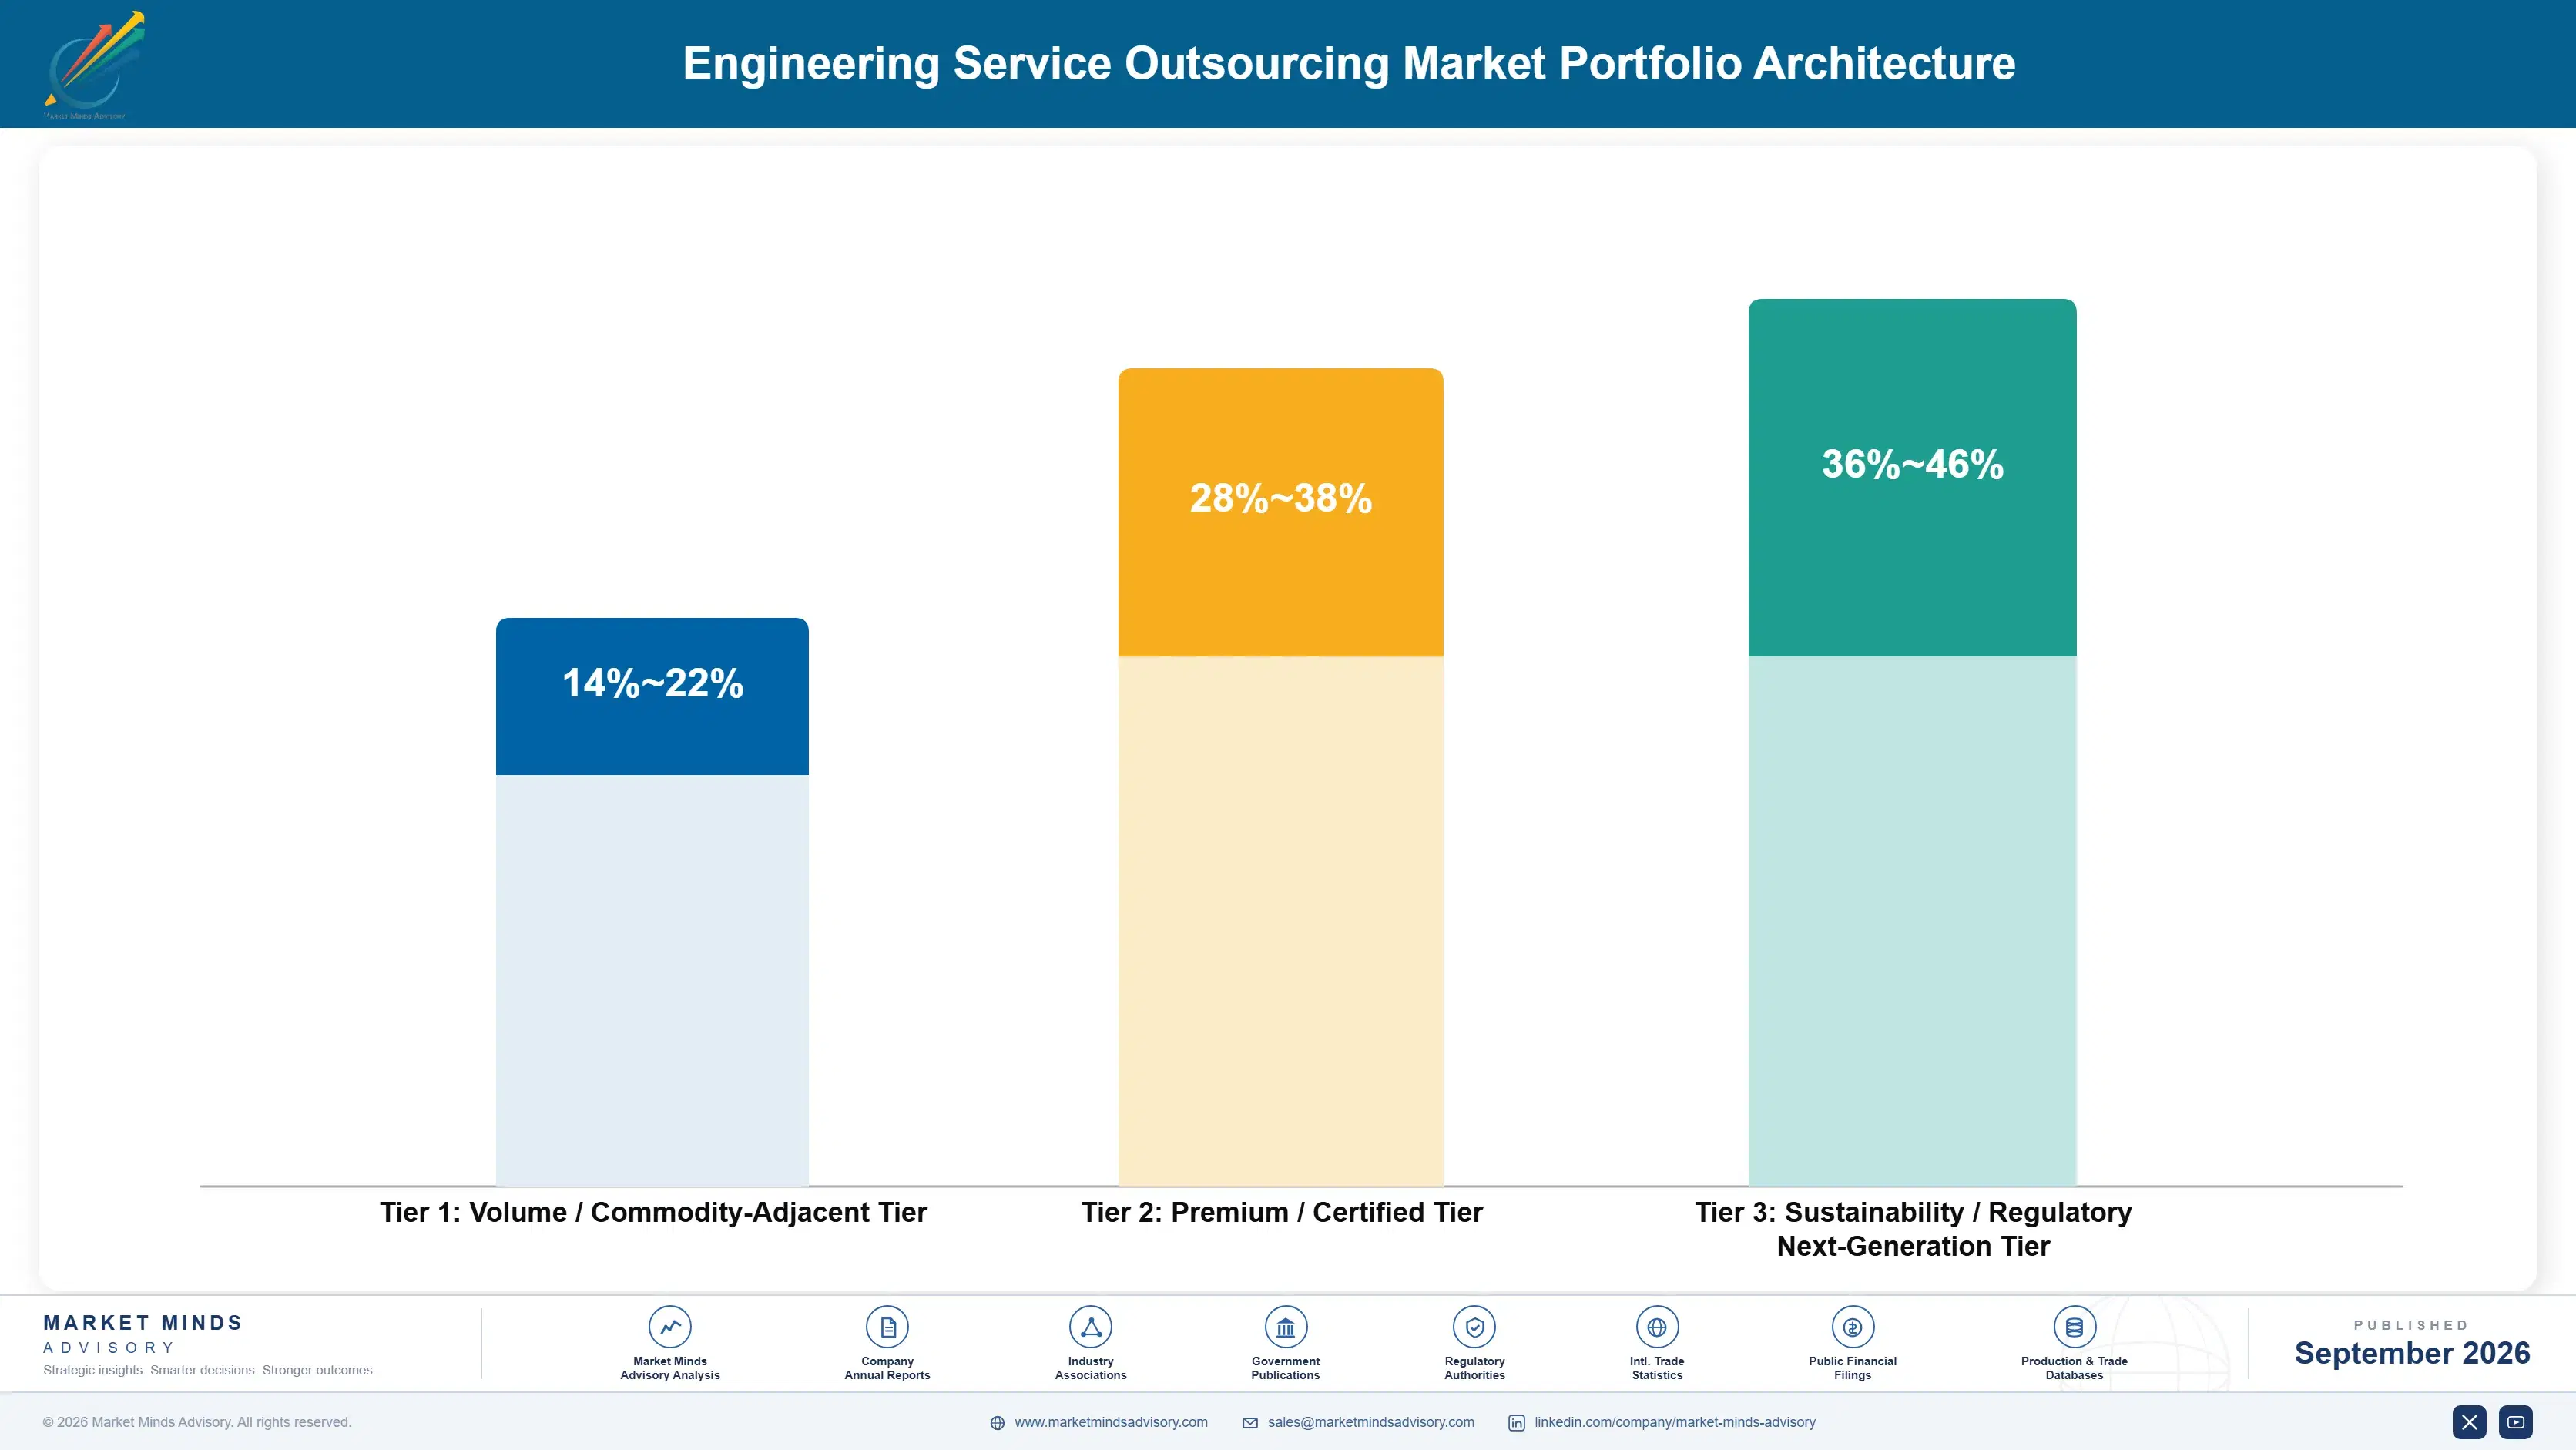
Portfolio economics split into three tiers. Volume tier commodity mechanical design services carry thinner margins under continued price competition from lower-cost regional providers and captive capability centres, while premium certified multi-domain programmes bundling artificial intelligence-assisted tooling carry meaningfully higher margins tied to demonstrated productivity gains and domain expertise. The sustainability and next-generation tier, built around semiconductor and artificial intelligence hardware design engineering, currently carries the strongest margins given genuine technical differentiation and acute talent scarcity.
The volume versus premium tension shows up clearly in provider talent allocation. Investment devoted to defending commodity mechanical design margin against captive centre competition competes directly against investment needed for artificial intelligence tooling depth and semiconductor domain expertise, and providers that under-invest in either risk losing ground to a competitor optimised specifically for that segment of the market.

High-value margin pools concentrate in semiconductor and artificial intelligence hardware design engineering and in artificial intelligence-assisted multi-domain programmes, where technical differentiation and talent scarcity still command premium billing rates before broader commoditisation eventually sets in. The volume commodity mechanical design tier remains essential for market reach and client relationship entry but contributes a shrinking share of blended gross margin across the category overall.

Volume / Commodity-Adjacent Tier

Commodity mechanical design services facing continued price competition from lower-cost regional providers and captive capability centres across most standard engagements broadly. and price-sensitive customer segments across most standard engagements and client sizes broadly.
Gross Margin: 14-22%

Premium / Certified Tier

Multi-domain programmes bundling artificial intelligence-assisted tooling carrying margins tied to demonstrated productivity gains and domain expertise across accounts. reflecting the pricing power that productivity gains and domain expertise still command today.
Gross Margin: 28-38%

Sustainability / Regulatory / Next-Generation Tier

Semiconductor and artificial intelligence hardware design engineering commanding the strongest current margins given genuine technical differentiation and acute talent scarcity. reflecting genuinely limited competition in this differentiated, talent-scarce engineering capability overall.
Gross Margin: 36-46%
engineering-services-outsourcing-market-portfolio-architecture-1788425029599

High-value Sub-segments and Strategic Watch-out

Semiconductor and AI Hardware Design Engagements

The fastest-growing segment in this report, combining strong current margins with accelerating client demand for scarce specialised chip design expertise this decade and beyond. Providers positioned early here are likely to retain premium pricing well into the next several years. Client demand here shows no sign of slowing.
Gross Margin: 36-46%

AI-Assisted Multi-Domain Programme Engagements

Premium integrated offerings tied to client demand for demonstrated productivity gains, offering strong margins and durable revenue visibility across large manufacturer accounts broadly. This window will likely narrow once AI tooling becomes a standard category expectation broadly. Providers should invest here while it still commands a premium.
Gross Margin: 28-38%

Standard Mechanical and Electrical Design Services

The largest existing revenue base, standard services facing steady price competition but funding most providers' ongoing tooling investment across the wider portfolio. Providers serving this tier depend heavily on volume rather than technical differentiation consistently. Execution discipline matters more here than added features. here. consistently.
Gross Margin: 18-26%

Captive Capability Centre Competitive Exposure

A shrinking strategic watch-out segment as manufacturers building internal captive centres continue displacing third-party providers across some commodity engagements tracked here. Providers still exposed here should actively diversify before captive competition accelerates further erosion. Waiting too long risks losing share to captive centres. now. quickly.
Gross Margin: 8-16%

Programme Lock-In and Domain Depth Economics

Revenue behaves like a multi-year annuity once a provider becomes embedded into a client's product development lifecycle across a specific programme, since switching engineering providers mid-programme means losing accumulated domain and product-specific knowledge that took months to build, and that switching cost explains most of this category's meaningful revenue visibility once an engagement moves past initial onboarding into steady-state delivery.
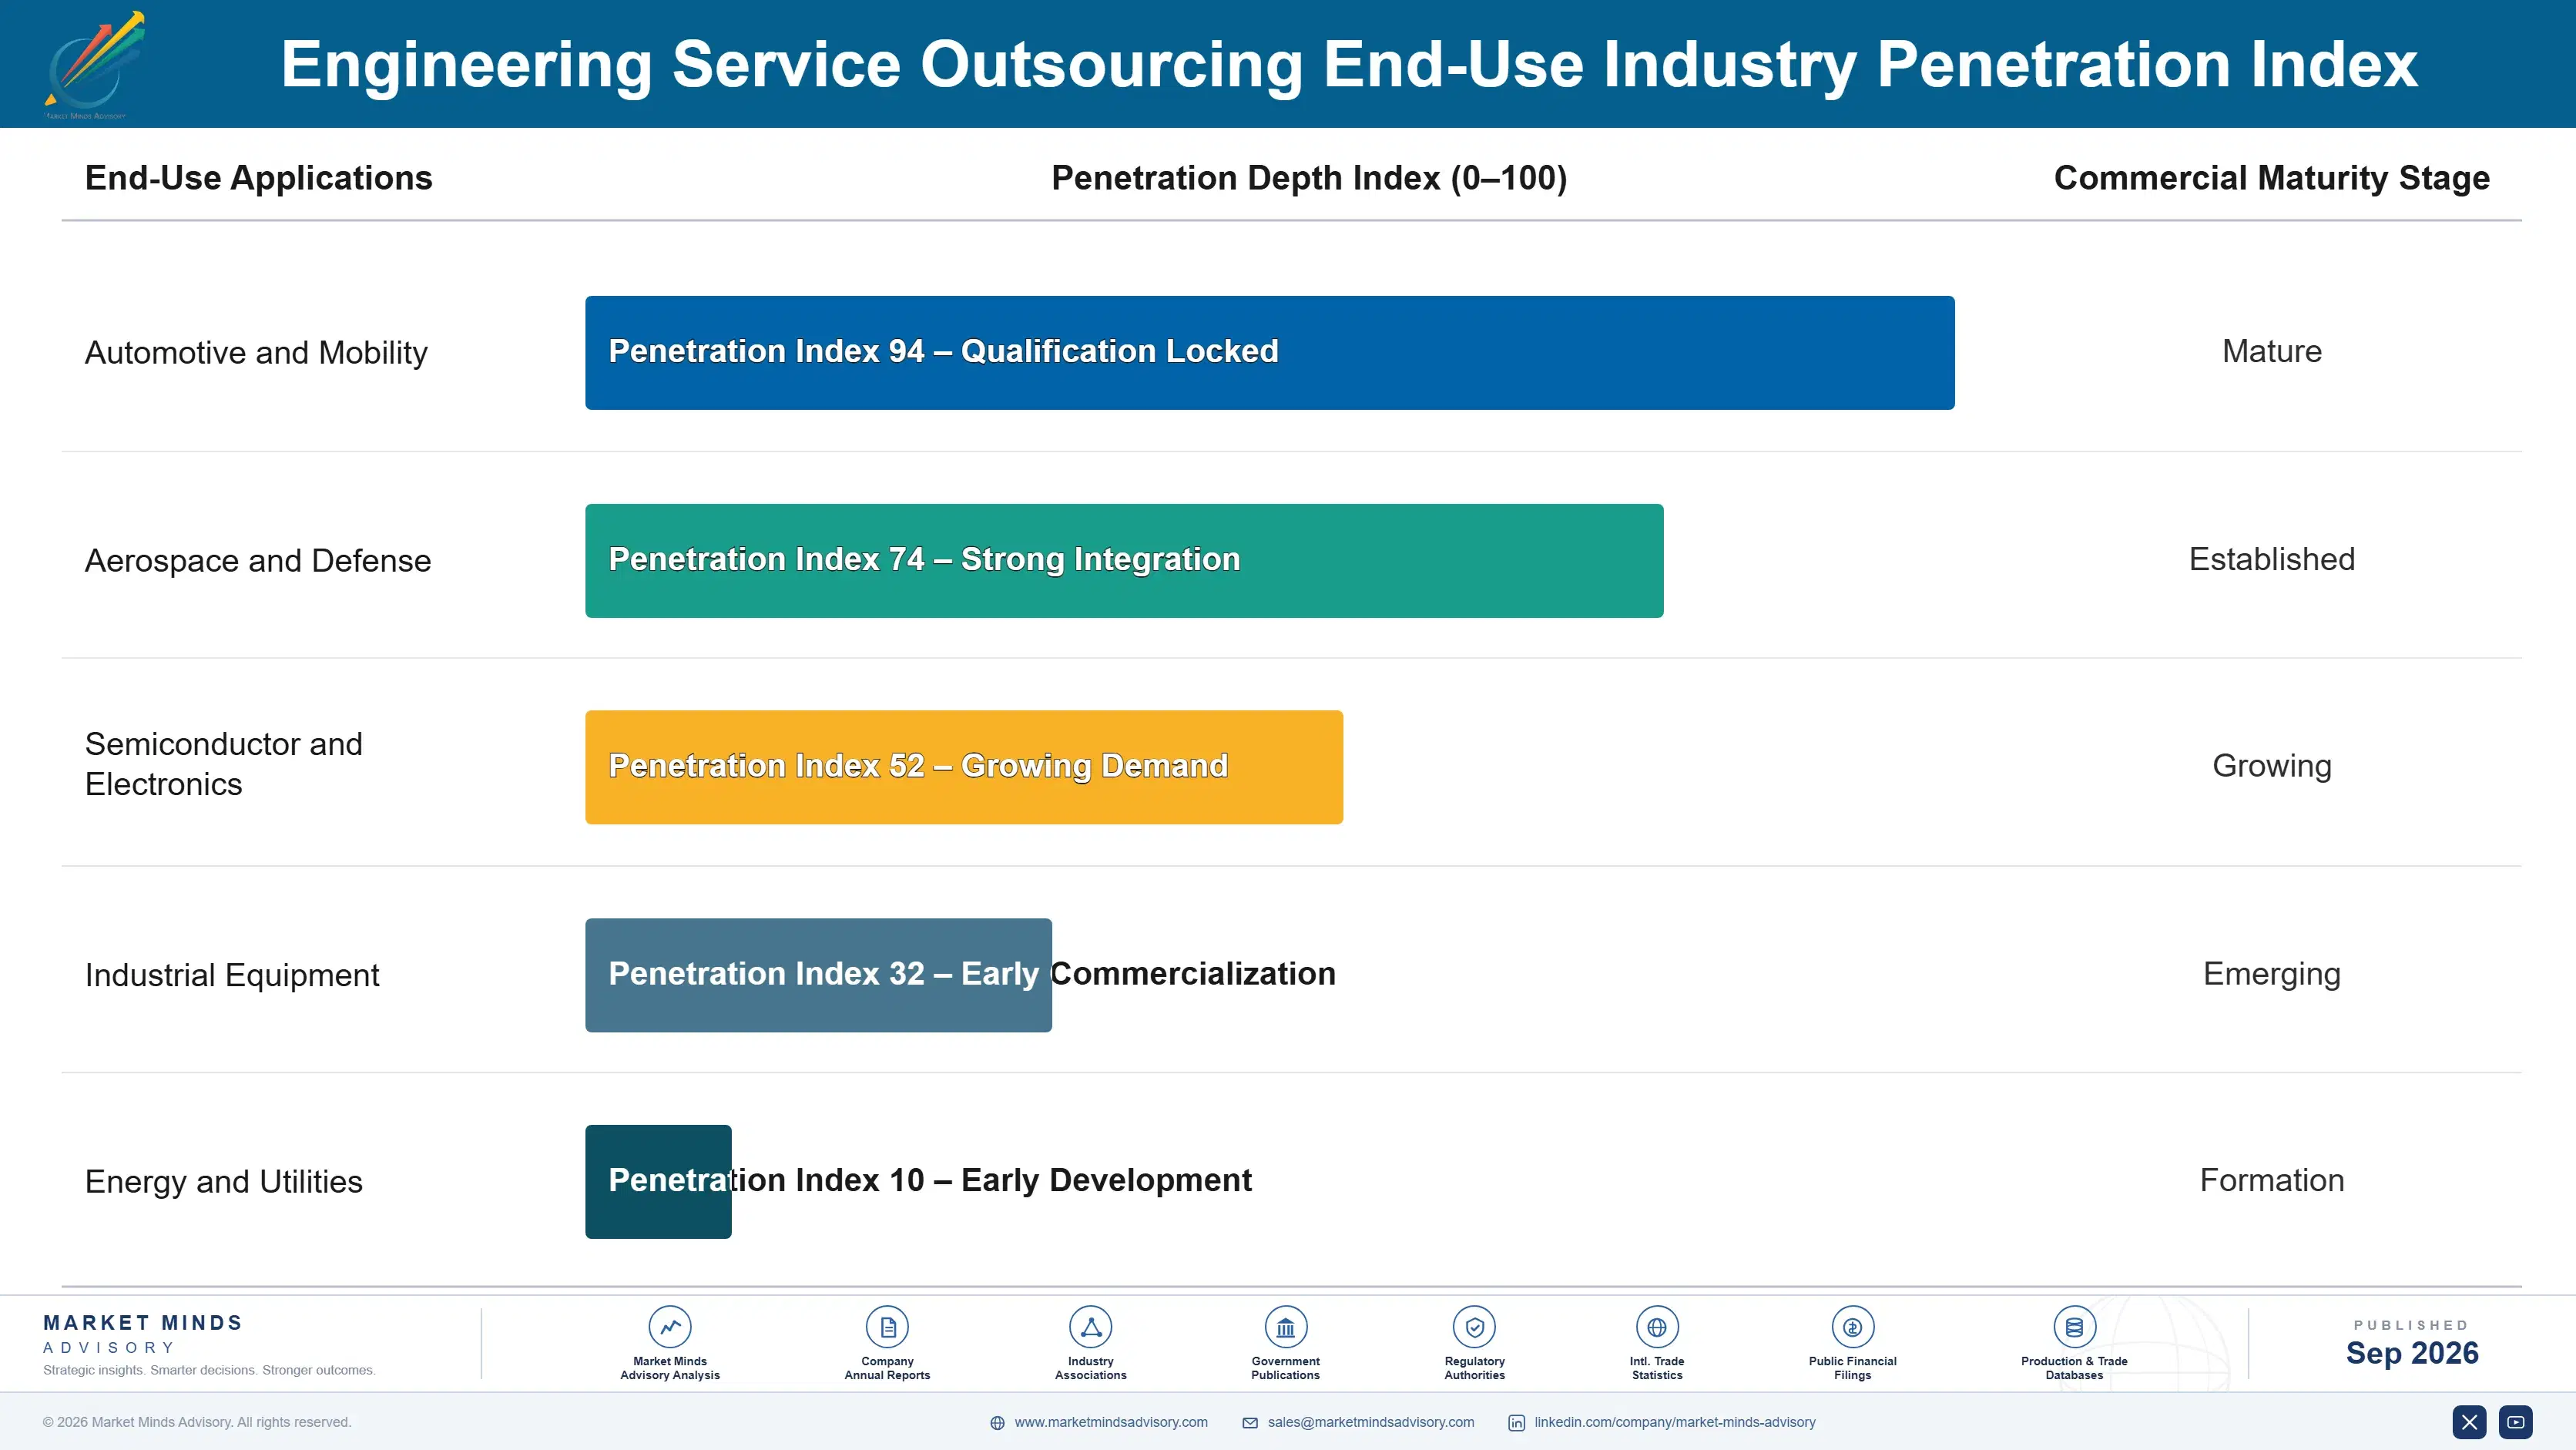
Adoption depth varies sharply by end-use vertical. Automotive and aerospace manufacturers integrate outsourced engineering deeply into broader multi-year product development programmes spanning several concurrent vehicle or aircraft generations, creating durable multi-year provider relationships, while industrial equipment manufacturers with shorter product cycles treat engineering outsourcing more transactionally around individual projects, creating shallower provider loyalty and greater exposure to competitive switching at each new project procurement cycle.

Buyer profiles are shifting generationally too. Engineering leaders who came up through the labour arbitrage era still favour proven, cost-focused vendor relationships even when tooling differentiation might justify a premium, while newer engineering leaders increasingly default to evaluating artificial intelligence-assisted productivity and domain expertise as standard procurement considerations, a difference in buying philosophy that is already shaping which providers win newly launched programmes versus established legacy engagement renewals.
engineering-services-outsourcing-market-end-use-penetration-index-1788425030087

Where the Category Reorders Next

These are among the four positions where our research anticipates prominent divergence between winners and laggards over the coming forecast period. Each is grounded in the demand model, the regulatory perimeter, and the announced capacity pipeline.
01 / AI TOOLING INVESTMENT STRATEGY

Proprietary tooling depth is separating category leaders from headcount vendors

Providers that built proprietary artificial intelligence-assisted design tooling are capturing a disproportionate share of new programme awards as clients increasingly demand demonstrated productivity gains beyond simple headcount availability. Providers without proprietary tooling risk being relegated to commodity headcount positioning carrying materially lower billing rates than tooling leaders currently command. Building this capability now, while clients actively reassess vendor evaluation criteria, looks like the more urgent investment priority for most providers in this category, since delaying investment risks ceding ground to tooling-forward competitors already gaining share.
02 / SEMICONDUCTOR DOMAIN STRATEGY

Chip design expertise is compounding into durable premium billing advantage

Providers that established deep semiconductor domain expertise are capturing a disproportionate share of premium engagements as artificial intelligence hardware demand continues outpacing internal chipmaker hiring capacity across the industry. This dynamic rewards providers willing to invest in specialised talent acquisition well ahead of confirmed long-term demand visibility. Providers without established semiconductor credentials should prioritise smaller pilot engagements to build track record, since pilot programmes with two or three chipmakers tend to reveal most recurring domain-specific technical requirements, since this approach reduces the risk of costly early missteps considerably.
03 / INTELLECTUAL PROPERTY PROTECTION POSITIONING

Dedicated protection assurance remains a genuinely underexploited advantage

Dedicated, ring-fenced delivery structures with enhanced intellectual property protection remain underexploited relative to their clear value potential as clients continue withholding the most strategically sensitive design work from providers lacking demonstrated protection credibility. Providers building genuine protection infrastructure now are positioning for meaningful access advantage as adoption continues broadening across sensitive engagement categories. Treating protection assurance as a secondary contractual afterthought rather than a distinct strategic asset risks underinvesting in an important competitive moat, since early movers tend to lock in the most valuable sensitive engagements first.
04 / COMMODITY HEADCOUNT EXPOSURE

Providers without tooling depth face continued margin erosion pressure

Providers remaining concentrated in commodity headcount-based mechanical design positioning without artificial intelligence tooling or domain differentiation face continued margin erosion as client procurement criteria shift decisively toward demonstrated productivity and specialised expertise across most accounts tracked in this report. Providers should actively diversify toward AI tooling, semiconductor domain expertise, or multi-domain programme management rather than defending headcount-only positioning alone. Treating headcount-only positioning as a stable long-term stance rather than a declining one risks meaningfully understating the category's ongoing competitive transition,

Engagement Snapshot From the Field

A live engagement with an industry participant carrying material or product regulatory and market exposure ahead of a defining policy shift, showing how our research translates into a defensible multi-year portfolio strategy.
MARKET MINDS ADVISORY · CLIENT ENGAGEMENT SUMMARY
Engineering Service Outsourcing Producer Strategic Portfolio Review and Transition Roadmap 2026·Investment Scenario on Engineering Service Outsourcing Exposure Evaluation 2025-26
CLIENT PROFILE
The client is a global automotive tier-one supplier generating approximately eight hundred forty million dollars in annual revenue (client-reported, unverified by MMA), historically working with seven separate engineering service providers across different regional business units without a unified view of programme cost or quality performance across the combined organisation. The supplier's programmes span passenger vehicle, commercial vehicle, and off-highway equipment platforms.
STRATEGIC CHALLENGE
Leadership needed to consolidate onto a smaller number of strategic engineering partners capable of supporting multi-domain software-defined vehicle programmes without the internal expertise to independently assess competing providers' actual artificial intelligence tooling maturity claims against demonstrated delivery performance. Board-level attention to programme cost overruns added further urgency to the consolidation timeline.
MMA APPROACH
MMA benchmarked candidate providers against disclosed AI tooling deployment evidence and existing client references in comparable multi-domain automotive programmes, prioritising providers demonstrating genuine productivity gains over marketing claims alone. The engagement included structured interviews with the client's regional engineering leadership to validate realistic consolidation timelines and risk factors involved. MMA also modelled realistic transition costs to support the client's internal budget approval process.
KEY FINDINGS
  1. Three of the seven incumbent providers had materially overlapping capability, suggesting genuine consolidation savings were achievable without losing meaningful domain coverage across regions.
  2. Several providers claiming mature AI tooling in marketing materials had not actually deployed it across comparable automotive programmes of similar scale and complexity before the engagement began.
  3. A phased consolidation sequence starting with the client's highest-spend programme reduced transition risk considerably compared to a simultaneous global provider consolidation. Change management support proved essential throughout the transition.
  4. Engineering team adoption of the retained providers' new AI-assisted workflows exceeded initial expectations once early pilot results were shared transparently across regional teams.
CLIENT PROFILE
The client is a global automotive tier-one supplier generating approximately eight hundred forty million dollars in annual revenue (client-reported, unverified by MMA), historically working with seven separate engineering service providers across different regional business units without a unified view of programme cost or quality performance across the combined organisation. The supplier's programmes span passenger vehicle, commercial vehicle, and off-highway equipment platforms.
STRATEGIC CHALLENGE
Leadership needed to consolidate onto a smaller number of strategic engineering partners capable of supporting multi-domain software-defined vehicle programmes without the internal expertise to independently assess competing providers' actual artificial intelligence tooling maturity claims against demonstrated delivery performance. Board-level attention to programme cost overruns added further urgency to the consolidation timeline.
MMA APPROACH
MMA benchmarked candidate providers against disclosed AI tooling deployment evidence and existing client references in comparable multi-domain automotive programmes, prioritising providers demonstrating genuine productivity gains over marketing claims alone. The engagement included structured interviews with the client's regional engineering leadership to validate realistic consolidation timelines and risk factors involved. MMA also modelled realistic transition costs to support the client's internal budget approval process.
KEY FINDINGS
  1. Three of the seven incumbent providers had materially overlapping capability, suggesting genuine consolidation savings were achievable without losing meaningful domain coverage across regions.
  2. Several providers claiming mature AI tooling in marketing materials had not actually deployed it across comparable automotive programmes of similar scale and complexity before the engagement began.
  3. A phased consolidation sequence starting with the client's highest-spend programme reduced transition risk considerably compared to a simultaneous global provider consolidation. Change management support proved essential throughout the transition.
  4. Engineering team adoption of the retained providers' new AI-assisted workflows exceeded initial expectations once early pilot results were shared transparently across regional teams.
RECOMMENDED STRATEGY
Phase 1: Phase 1 (Months 1 to 2): Benchmark providers against verified AI tooling deployment evidence and comparable references. Include client reference calls in comparable automotive programmes. Phase 2: Phase 2 (Months 3 to 7): Consolidate the highest-spend programme first to validate the retained provider set. Document lessons learned before extending consolidation further. Phase 3: Phase 3 (Months 8 to 12): Extend consolidation across remaining programmes based on initial transition performance and feedback. Formalise ongoing governance across the retained provider set.
OUTCOME
Twelve months after the engagement began, the client successfully consolidated onto three strategic engineering partners, reporting measurably improved programme cost visibility and moderately reduced overall engineering spend relative to the seven-provider baseline (client-reported, unverified by MMA). Leadership also reported improved confidence in managing artificial intelligence tooling adoption consistently across programmes.

Frequently Asked Questions

Foundational context covering the market sizes, CAGR, scope, country, region and competition that inform every finding below. This section is provided to cover basics and most often pre-purchase conversations, answered from the MMA Primary Research Dataset.

What is the current size of the Engineering Service Outsourcing Market?

The Engineering Service Outsourcing Market reached an estimated USD 52.0 billion in global revenue in 2025, according to MMA Analysis based on primary research and company disclosures. This base year figure anchors the forecast period beginning in 2026.

How large will the Engineering Service Outsourcing Market be by 2036?

MMA projects the market will reach approximately USD 141.1 billion by 2036 under the base case scenario. That represents roughly a 2.48 times expansion from the 2026 starting value of USD 56.9 billion.

What is the CAGR for the Engineering Service Outsourcing Market 2026 to 2036?

The base case compound annual growth rate is 9.5% across the 2026 to 2036 forecast window. Bull and bear scenarios range from 8.3% to 10.7% depending on artificial intelligence hardware demand and manufacturing capital spending trends.

Which segment is growing fastest?

Semiconductor and Chip Design Engineering Services lead all segments at a 15.0% CAGR, roughly 1.58 times the overall market rate. This segment benefits from artificial intelligence hardware demand outpacing internal chipmaker hiring capacity.

Who are the major companies in the Engineering Service Outsourcing Market?

Leading providers include Tata Technologies Limited, L&T Technology Services Limited, HCL Technologies Limited, Capgemini SE, and Alten SA. Together these five hold an estimated 32% combined share on a disclosed segment revenue basis.

Which country is growing fastest?

India leads national growth at an estimated 13.5% CAGR, driven by its established position as the world's dominant engineering services delivery hub. China and Vietnam follow within their respective regions.

Report Segmentation Architecture

The full report scope spans multiple orthogonal segmentation dimensions, with cross-tabulated demand data provided for each dimension pair. Coverage extends further to regional breakdowns, trend trajectories, and the competitive detail needed to support segment-level decision-making.

By Primary Market Dimension

  • Mechanical and Product Engineering Services
  • Embedded Software and Electronics Engineering Services
  • Automotive and Mobility Engineering Services
  • Aerospace and Defense Engineering Services
  • Semiconductor and Chip Design Engineering Services
  • Industrial and Plant Engineering Services

By End-Use Industry

  • Automotive and Mobility
  • Aerospace and Defense
  • Semiconductor and Electronics
  • Industrial Equipment
  • Energy and Utilities

By Commercial Dimension

  • Time and Materials Engagement Contracts
  • Fixed-Price Programme Contracts
  • Managed Capacity and Staff Augmentation Models
  • Captive Global Capability Centre Support Services

By Region

  • North America
  • Western Europe
  • East Asia
  • South Asia and Pacific
  • Latin America
  • Middle East and Africa
  • Eastern Europe

Scope, Methodology, and Coverage

Every figure in this report is reproducible from documented input assumptions. The scope below maps the historical period, the forecast horizon, the segmentation dimensions, and the countries covered, alongside the underlying primary and qualitative methodology.
Historical Period
2020 to 2025
Forecast Period
2026 to 2036
Base Year
2025 (USD billions; MMA Primary Research Dataset, September 2026)
Market Definition
This report covers third-party engineering design, development, testing, and validation services provided to original equipment manufacturers across mechanical, electrical, software, and semiconductor domains, including both onshore and offshore delivery models. It excludes internal captive engineering centres wholly owned and staffed by the manufacturer itself, and general information technology outsourcing services that do not include dedicated product engineering deliverables.
Quantitative Units
USD billions (current prices); billable engineering hours; average billing rate per hour
Segmentation Dimensions
By Primary Market Dimension; By End-Use Industry; By Commercial Dimension; By Region
Regions Covered
North America, Western Europe, East Asia, South Asia and Pacific, Latin America, Middle East and Africa, Eastern Europe
Countries Covered
USA, Canada, Germany, France, UK, China, Japan, South Korea, India, Australia, Vietnam, Brazil, Mexico, UAE, Saudi Arabia, South Africa, Nigeria, Poland, Romania, Netherlands, Italy, Spain, Sweden, Switzerland, Argentina, Colombia, Indonesia, Thailand, Turkey, and additional markets relevant to this sector
Key Companies Profiled
Tata Technologies Limited; L&T Technology Services Limited; HCL Technologies Limited; Capgemini SE; Alten SA; Cyient Limited; Akkodis Inc.; Bertrandt AG; EDAG Engineering Group AG; Segula Technologies SAS; Ricardo plc; AVL List GmbH; Belcan LLC; QuEST Global Services Pte Ltd; Infosys Limited; Wipro Limited; Tech Mahindra Limited; GlobalLogic Inc.; Luxoft Holding Inc.; KPIT Technologies Limited
Quantitative Methodology
Primary survey, n=3,800 respondents, Q4 2025, six countries; demand-side model with trade association cross-validation
Qualitative Methodology
47 expert interviews, Q4 2025; applied to validate demand model assumptions, identify emerging dynamics, and assess competitive positioning
Report Format
PDF and XLSX data workbook (Word format preview document)
Publisher
Market Minds Advisory
Report Code
MMA-2026-TEC-459
Published
September 2026
Contact
sales@marketmindsadvisory.com | www.marketmindsadvisory.com

Purchase the full Engineering Service Outsourcing Market Report (2026 to 2036).

The full report delivers complete segmentation data across all six engineering domain segments, all seven regional markets, and detailed competitive profiles for all twenty companies named in this summary. It includes the underlying primary survey dataset of three thousand eight hundred respondents and forty seven expert interviews conducted during the fourth quarter of 2025. Buyers also receive downloadable data tables covering historical 2020 to 2025 figures alongside the full 2026 to 2036 annual forecast. A dedicated appendix addresses AI-assisted tooling productivity benchmarks across three provider scenarios.
Full Seven-Region Regional Data Tables and Charts
All Twenty Company Competitive Profiles and Rankings
Ten-Year Annual Forecast Model With Scenarios
Primary Survey Raw Data Access and Tables
AI-Assisted Tooling Productivity Benchmark Appendix and Guide
Quarterly Update Subscription Option for Buyers

Built For The People Who Decide

From boardroom strategy to bench-side execution, this report is read cover-to-cover by leaders shaping the next decade of their industry, turning demand scenarios, market dynamics and valuation benchmarks into decisions.
CXOs/ Presidents/ VPs/ Managers
M&A and Corporate Development
Strategy Teams and R&D Heads
Procurement and Product Directors
Regulatory and Compliance Leaders
Investor Relations and Equity Analysts