Market Minds Advisory
Energy Intelligence Solution Market

Energy Intelligence Solution Market: Energy Intelligence Solution Market. Trends and Forecast 2026 to 2036

Utilities juggling volatile renewable generation and aging grid infrastructure are turning to AI-powered demand forecasting software to avoid costly blackouts, forcing grid equipment vendors to rebuild their offering around predictive analytics.

Lead Analyst

Published

September 2026

Make Smarter Decisions with Customized Research Insights

Request a free sample report and evaluate market opportunities, growth trends, and competitive dynamics relevant to your business needs.

2025 MARKET VALUE$6.2BMarket Size 2025
2036 FORECAST VALUE$19.5BBase Case , 2026 to 2036
CAGR 2026 TO 203611.0 %Bull 12.3% / Bear 9.7%
INCREMENTAL OPPORTUNITY$12.7BNet 10- year value creation
EXPANSION MULTIPLE2.84x2036 value over 2026 base
Strategic Levers
M&A Pipeline
Regional Outlook
Country Rankings
Competitive Intelligence
Segmental Deep-dive
Call-Us : 91 93563 13602

Executive Snapshot and Market Trajectory.

Grid operators stopped treating energy analytics software as optional the year renewable volatility started causing real supply shortfalls. Utilities managing unpredictable solar and wind output now depend on forecasting platforms to balance load in near real time, a task manual dispatch teams cannot match at modern renewable penetration speeds.
AI-powered demand forecasting platforms lead current spending, concentrated most heavily among utilities integrating large-scale renewable capacity where generation variability creates the greatest balancing challenge. North America and Western Europe account for the bulk of current deployment, reflecting both large existing grid modernization investment and, across the European Union, aggressive renewable integration targets driving utility technology procurement nationwide. Government infrastructure funding programs are reinforcing this demand pattern considerably across both regions.
Legacy grid equipment manufacturers historically selling hardware are racing to add analytics software capability before pure-play energy intelligence startups capture the entire utility relationship for themselves. Regulatory reliability mandates are compounding this competitive pressure, pushing utilities toward vendors offering demonstrated forecasting accuracy that differentiates compliant platforms from less rigorous competing offerings still relying on legacy statistical models. Vendors report faster utility procurement cycles once forecasting accuracy guarantees are embedded directly into signed contract terms overall.
Market Definition
The Energy Intelligence Solution Market covers software platforms for grid demand forecasting, energy consumption analytics, and renewable generation optimization sold to utilities and large enterprise energy consumers, measured by subscription and licensing revenue. It excludes physical grid hardware, smart meters, and battery storage systems sold separately from analytics software.
Base Year Value
$6.2B in 2025 (MMA Primary Research Dataset, September 2026)
Forecast Period
2026 to 2036, eleven discrete annual values
CAGR
11.0% base case. Bull 12.3%. Bear 9.7%.
Fastest Growth Segment
AI-Powered Demand Forecasting Platforms: 15.0% CAGR
Fastest Growth Country
China: 13.0% CAGR
Fastest Growth Region
South Asia and Pacific: 13.0% CAGR
Largest Region
North America: 30% of 2025 global value
Market Leaders
Leading participants include Itron, AutoGrid, C3.ai, Uplight, and Schneider Electric.
Primary Survey
n=3,800 procurement and R&D decision-makers, Q4 2025, six countries
Methodology
Demand-side build-up, cross-validated against public data, 47 expert interviews

Energy Intelligence Solution Market Forecast Scenarios

energy-intelligence-solution-market-size-forecast-scenario-1788421593234
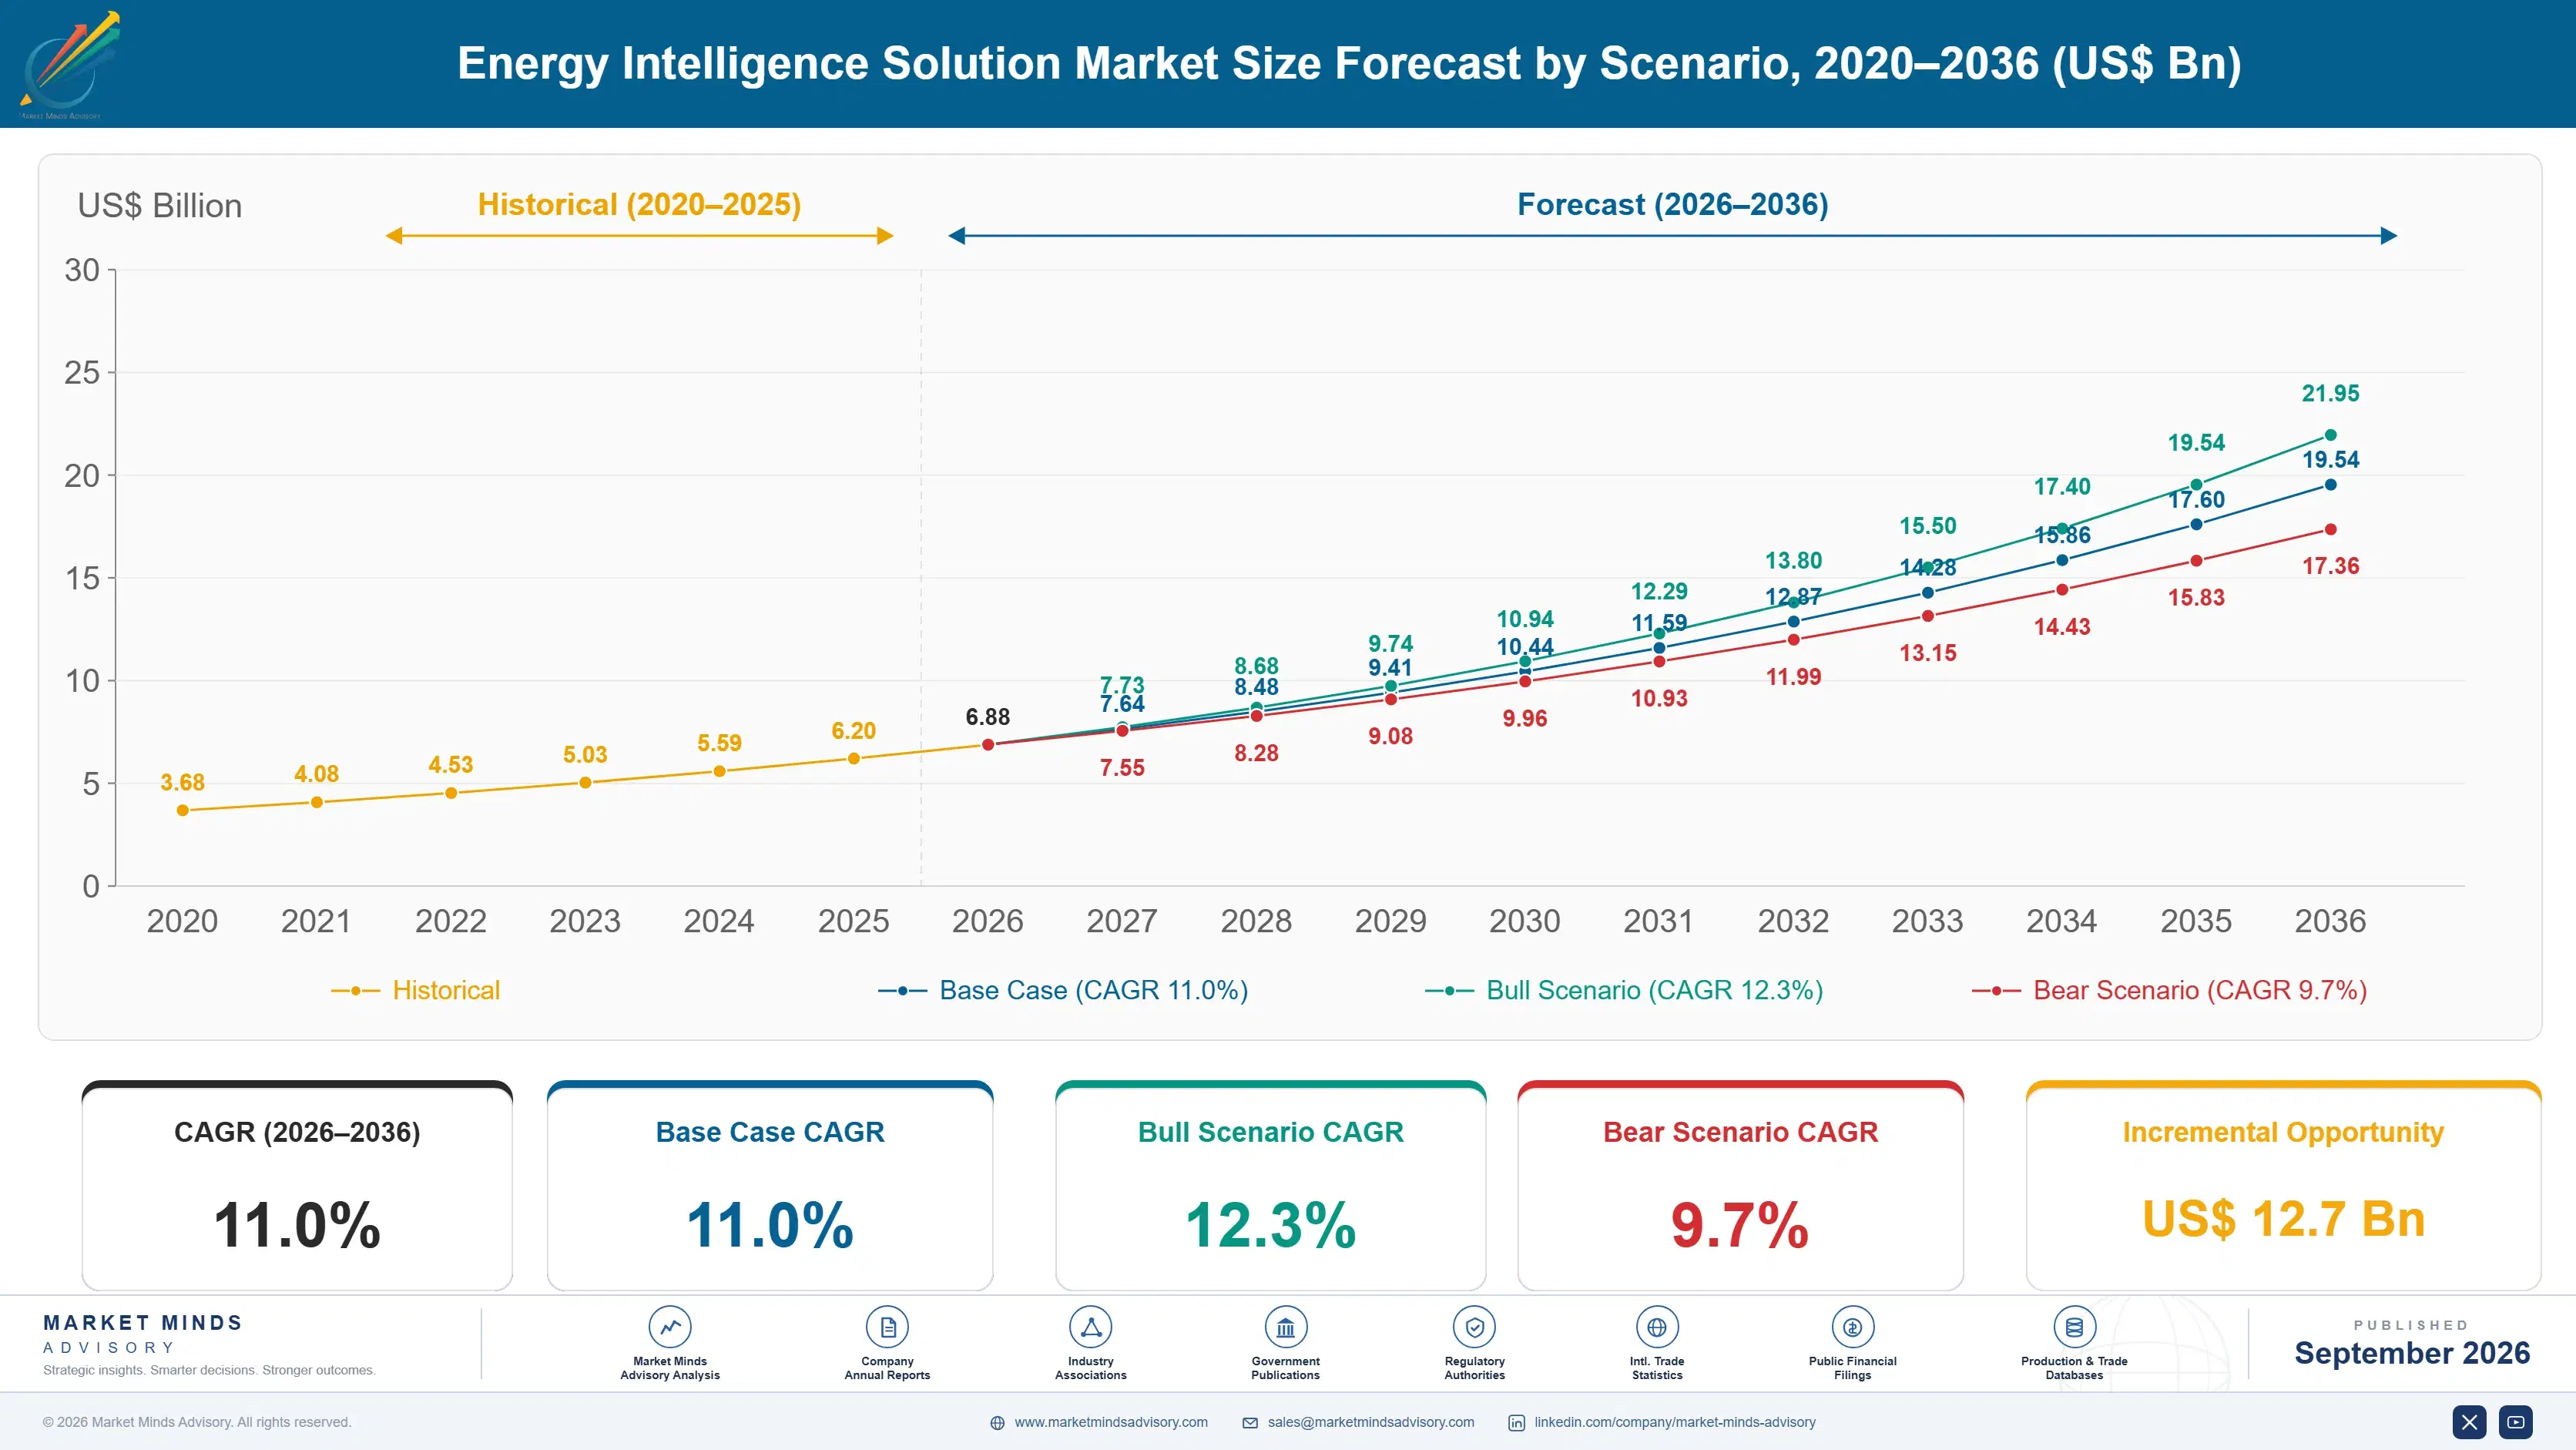
Energy intelligence software adoption grew steadily from 2020 through 2025, moving from pilot programs at forward-thinking utilities toward standard grid operations infrastructure as renewable penetration accelerated across most major electricity markets. Growth picked up meaningfully once machine learning forecasting models proved measurably more accurate than traditional statistical methods, growing at an estimated 9.5% annual rate historically as early adopting utilities validated cost savings.
MMA's base case rests on three compounding mechanisms: expanding renewable generation capacity requires increasingly sophisticated forecasting to manage grid balancing, falling cloud computing costs make advanced analytics platforms commercially viable for smaller regional utilities, and regulatory reliability standards increasingly require documented forecasting accuracy as a condition of grid operating licenses. Together these mechanisms push adoption well beyond early adopting utilities into mainstream grid operations procurement across most regions and utility sizes.
The bull case centers on a single catalyst: electric vehicle charging infrastructure creating an entirely new category of demand volatility requiring dedicated forecasting capability. The bear risk is budget constraint fatigue, where utilities facing rising infrastructure costs across multiple simultaneous grid modernization priorities defer analytics software investment in favor of more urgent physical infrastructure repair and replacement spending that regulators consider higher priority.

Forecasting Software Becomes Grid Balancing Infrastructure

Energy intelligence platforms succeeded where earlier grid management software stalled largely because machine learning models can now ingest weather data, historical consumption patterns, and real-time sensor feeds simultaneously to produce forecasts meaningfully more accurate than traditional statistical regression methods ever achieved. Utilities piloting these platforms report measurable grid balancing cost reduction within a single operating season, convincing skeptical executives who initially resisted broader platform investment.
MARKET CONCENTRATION40% CR5Top five vendors hold this combined revenue share currently
AVERAGE UTILITY CONTRACT$450,000 annuallyTypical annual analytics platform subscription value for mid-sized utilities
TOP DEPLOYING COUNTRY28% United StatesShare of global energy intelligence platform deployment volume reported
FORECAST ACCURACY IMPROVEMENT35% more accurateEstimated accuracy gain versus traditional statistical forecasting methods
UTILITY ADOPTION RATE42% of large utilitiesShare of large utilities using AI-based demand forecasting tools
GRID BALANCING COST REDUCTION18% lowerEstimated cost savings from improved renewable output forecasting accuracy
Procurement now runs through utility technology committees rather than individual grid operations engineers experimenting independently, reflecting growing awareness that forecasting platform choices carry regulatory compliance and reliability implications extending well beyond any single grid region's immediate operational needs. This shift toward centralized procurement is consolidating vendor relationships around platforms offering comprehensive regulatory reporting capability, favoring established energy technology vendors over smaller analytics-only startups lacking dedicated compliance teams.
Renewable integration complexity is emerging as a genuine competitive differentiator between energy intelligence vendors, since forecasting accuracy requirements scale considerably as a utility's renewable generation share increases beyond a modest baseline threshold. Vendors offering credible high-renewable-penetration forecasting report meaningfully higher contract renewal rates than those selling generic demand forecasting tools not specifically calibrated for the volatility that solar and wind generation introduces into grid balance.
"Grid operators don't buy forecasting software because it's elegant. They buy it because a bad forecast now means blackouts, not just a spreadsheet error."
Senior Analyst, Energy Technology Practice · MMA Energy Practice · September 2026

Market Trends

Electric Vehicle Charging Creates New Forecasting Complexity

Rapidly expanding electric vehicle charging infrastructure is introducing an entirely new category of demand volatility that traditional grid forecasting models never had to account for, since charging patterns cluster unpredictably around commute schedules and vary considerably by neighborhood adoption rate. This new demand pattern is forcing utilities to adopt forecasting platforms specifically calibrated for electric vehicle charging behavior rather than relying on models built for traditional household consumption patterns alone. Vendors report meaningfully higher forecasting accuracy once electric vehicle charging data streams are incorporated directly into models. This gap continues widening as newer models ship.
Market Impact: Renewable capacity grew 20% since 2022
Machine Learning Models Outperform Traditional Statistical Forecasting

Modern machine learning forecasting models can now ingest weather, historical consumption, and real-time sensor data simultaneously to produce grid demand forecasts meaningfully more accurate than traditional statistical regression methods that utilities relied upon for decades before this technology shift. This accuracy improvement is the single biggest reason energy intelligence software adoption accelerated so sharply over the past several years compared with the previous decade of comparatively incremental forecasting method improvements. Vendors report meaningfully faster model retraining cycles versus traditional statistical approaches. Vendors expect this trend to continue as retraining infrastructure matures across the industry considerably.
Market Impact: Compliance mandates affect 55% of utilities

Market Opportunities and Growth Drivers

Expanding Renewable Capacity Requires Sophisticated Grid Forecasting

Rapidly expanding solar and wind generation capacity is forcing grid operators to manage increasingly volatile supply conditions that traditional dispatch planning methods were never designed to handle at this scale of intermittent generation across a modern electricity grid. Grid operators facing this volatility increasingly treat forecasting software as essential balancing infrastructure rather than a discretionary technology purchase layered on top of adequate existing dispatch planning practices developed for predictable fossil fuel generation. Several large utilities report meaningfully reduced balancing costs after full platform deployment across their service territories. MMA expects this substitution pattern to deepen as renewable capacity keeps expanding.
Market Impact: Legacy integration delays deployment 6 months

Regulatory Reliability Standards Mandate Documented Forecasting Accuracy

Grid reliability regulators increasingly require utilities to demonstrate documented forecasting accuracy as a condition of maintaining operating licenses, particularly in regions experiencing rapid renewable capacity growth that increases the consequences of forecasting errors during grid balancing operations. This regulatory shift has become a faster forcing mechanism than internal utility technology policy, since compliance officers now drive analytics software budget decisions directly rather than leaving decisions solely to grid operations engineering teams managing daily dispatch. Several major regulators now publish explicit forecasting accuracy requirements in licensing renewal terms. across the broader industry overall.
Market Impact: Budget deferrals delay adoption 8 months

Market Restraints and Challenges

Legacy Grid Infrastructure Integration Slows Full Adoption

Many utilities operate grid infrastructure and data systems built decades ago without modern data integration capability, requiring costly custom integration work before analytics platforms can access the real-time sensor data these forecasting models depend upon for accuracy. The root cause traces to grid infrastructure investment cycles measured in decades, leaving utilities managing a patchwork of legacy systems never designed for modern data streaming and analytics integration requirements. Vendors are exploring middleware adapters that translate legacy grid data formats into formats modern analytics platforms accept, though full integration remains costly for many utilities.
Market Impact: EV-driven demand volatility rose roughly 40%

Budget Constraints Compete With Urgent Infrastructure Priorities

Utilities facing simultaneous grid modernization priorities across physical infrastructure repair, cybersecurity, and analytics software must often defer analytics investment in favor of more urgent physical infrastructure spending that regulators and boards consider higher immediate priority given visible reliability risk. The underlying cause is genuinely constrained utility capital budgets compounding across an expanding number of competing technology priorities that did not exist just a decade ago in most utility capital planning cycles. Vendors are exploring outcome-based pricing models tied to demonstrated cost savings to reduce this budget competition friction. across the industry overall.
Market Impact: Forecast accuracy improved roughly 35% recently
3 additional market trends, 4 additional growth drivers, and 2 additional restraints and challenges are covered in the full report. Contact sales@marketmindsadvisory.com to access the complete intelligence.

Segment CAGR and Growth Architecture

The Energy Intelligence Solution Market splits into six product and service-defined segments spanning forecasting, optimization, and monitoring capability. AI-powered demand forecasting platforms lead growth as utilities integrate renewable capacity at scale, followed closely by grid balancing optimization software, since both categories directly address the volatility pressures driving procurement nationwide. Regulatory compliance and reporting tools round out the segment mix.
energy-intelligence-solution-market-market-share-analysis-1788421593834

AI-Powered Demand Forecasting Platforms

AI-powered demand forecasting platforms lead all segments because they concentrate the exact use case driving current utility procurement: predicting electricity demand with sufficient accuracy to balance increasingly volatile renewable generation without triggering costly reserve capacity activation or, worse, service interruptions during peak demand periods. Utilities favor this segment since it directly addresses the balancing challenge that renewable integration introduces, capturing measurable cost savings within a single operating season across large service territories. Large investor-owned utilities managing multi-state service territories are increasingly standardizing on this segment across their entire grid operations portfolio. MMA estimates this segment alone will represent well over a third of total category revenue by 2036. Consumer research supports this projection.
CAGR 15.0%

Grid Balancing Optimization Software

Grid balancing optimization software ranks second in growth as utilities seek to translate accurate demand forecasts into actionable dispatch decisions that minimize reserve capacity activation costs while maintaining reliability margins required by regulators. These platforms let grid operators automate dispatch decisions that previously required manual engineering judgment, closely matching the precision an experienced dispatcher would provide but at a speed no human team could sustain continuously. Utilities increasingly cite optimization software directly within grid modernization capital planning rather than treating it as a standalone technology purchase. MMA expects this category to scale steadily as automated dispatch technology continues maturing across most deployed platforms. Growth here should remain strong through most of the decade.
CAGR 13.0%
Full segment breakdown across 6 segments available in the complete report.

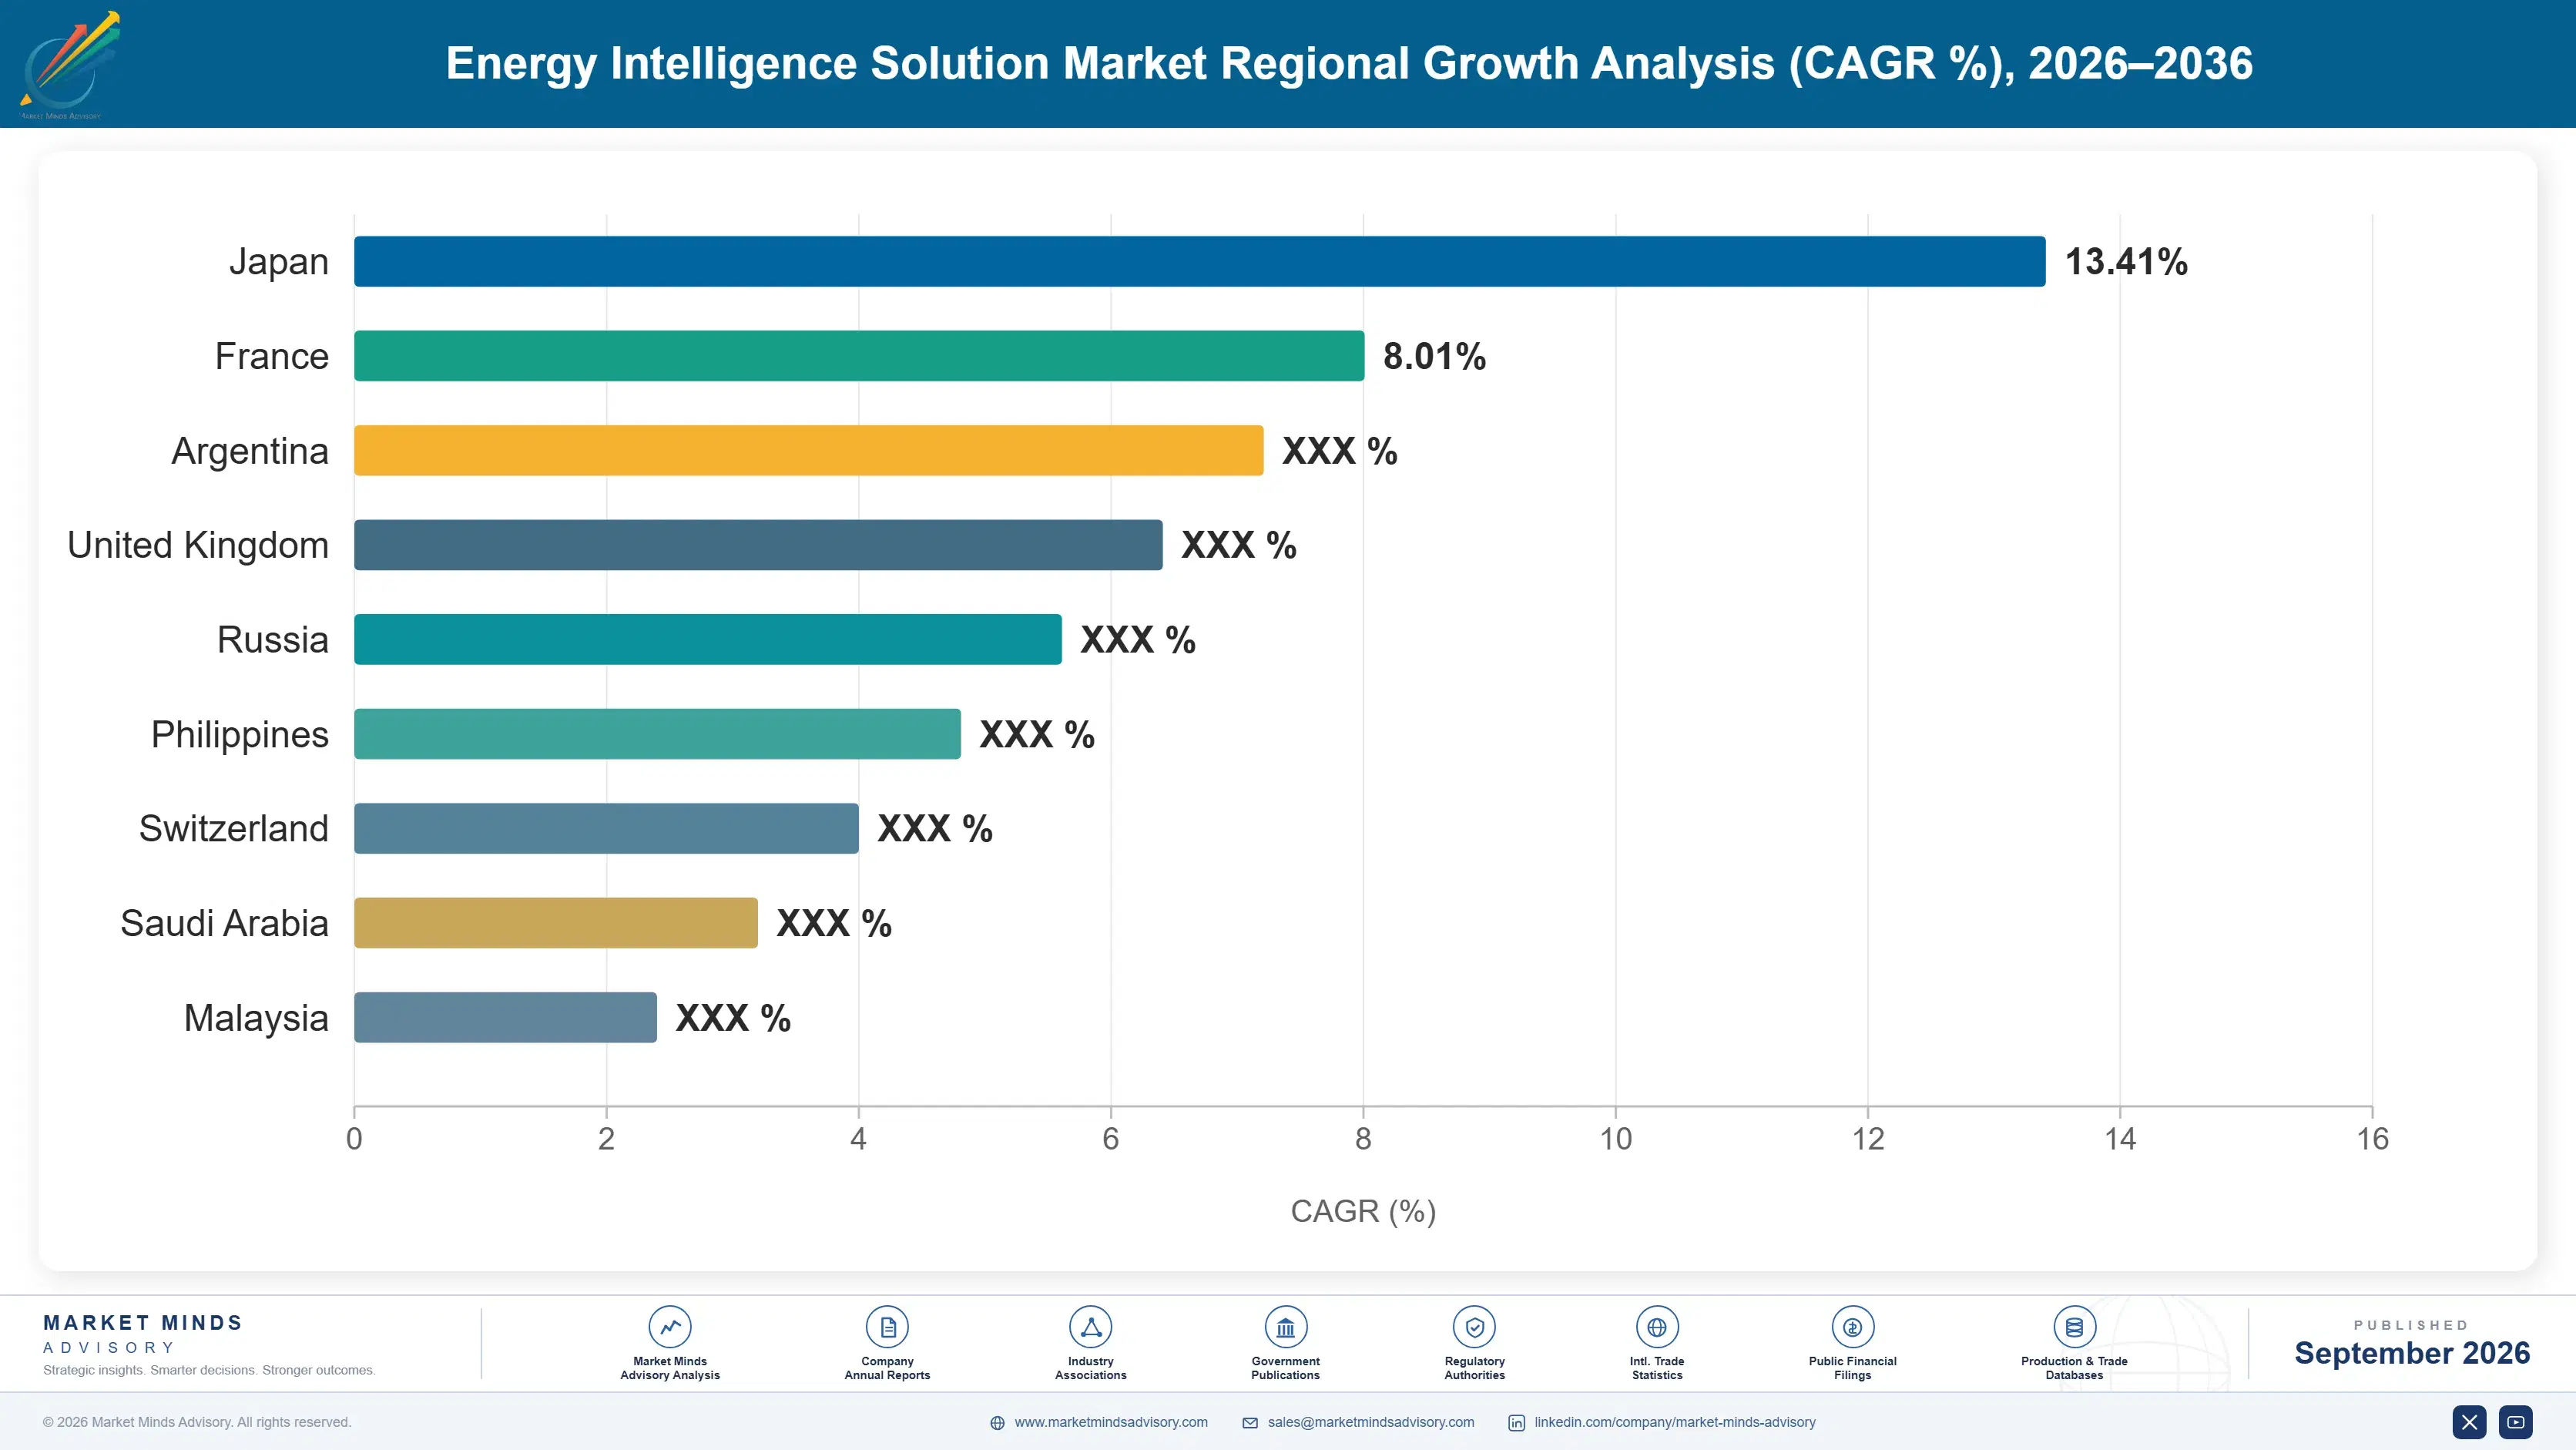
Regional Architecture and Country Demand Map

North America leads the Energy Intelligence Solution Market given its concentration of grid modernization investment and established analytics vendor headquarters, while Western Europe follows closely through aggressive European Union renewable integration targets driving sustained utility technology procurement and rapid platform adoption nationwide across most member states.

North America

United States utilities drive the bulk of regional demand, reflecting substantial grid modernization capital investment and established analytics vendor headquarters concentrated across major technology hubs nationwide. Canadian utilities are following a similar pattern, particularly among provinces integrating large hydroelectric and wind generation capacity requiring sophisticated balancing software. Itron and AutoGrid, both headquartered in the region, maintain deep utility relationships that accelerate platform adoption across large investor-owned utilities and municipal power authorities alike. Utility procurement cycles in the region also tend to move faster than in more fragmented regulatory environments, letting analytics vendors close large multi-year contracts within a single fiscal budget cycle rather than waiting years for staged rollout approval across service territories.
Share: 30% | CAGR: 10.5% (2026 to 2036)

Western Europe

Germany and the United Kingdom lead regional adoption, integrating energy intelligence software into aggressive national renewable transition programs already well underway across each country's electricity grid infrastructure. France and Spain follow through large-scale solar and wind capacity expansion requiring increasingly sophisticated forecasting capability. Regional data protection rules add meaningful compliance overhead for vendors processing extensive grid consumption and generation data across multiple national jurisdictions simultaneously. Regional vendors increasingly bundle forecasting software with broader grid modernization consulting services, letting utilities address balancing, compliance, and infrastructure planning within a single coordinated vendor engagement rather than separate procurement tracks. This localization effort meaningfully improves subscription retention across the region's largest national utility markets and grid operators.
Share: 25% | CAGR: 9.5% (2026 to 2036)
Regional intelligence for 5 additional markets available in the complete report: East Asia, South Asia and Pacific, Latin America, Middle East and Africa, Eastern Europe. Contact sales@marketmindsadvisory.com.
energy-intelligence-solution-market-country-cagr-analysis-1788421594350

How Vendors Capture Grid Forecasting Value

Vendors capture value across four distinct commercial mechanisms as utilities move from pilot deployments toward multi-year grid-wide forecasting contracts, extending revenue well beyond a base subscription fee into recurring compliance, integration, outcome-based, and premium tier relationships that compound steadily over each utility's grid modernization cycle. Vendors capable of executing all four consistently pull ahead of single-mechanism rivals in retention.

Tiered Forecasting Accuracy Subscription Pricing Model

Vendors price forecasting subscriptions on a tiered accuracy basis, with premium tiers offering more granular geographic resolution and shorter forecast intervals that command substantially higher pricing than basic regional-level forecasting alone. This pricing model anchors baseline recurring revenue, since utilities rarely downgrade accuracy tiers once operations teams depend on granular forecasts for daily dispatch decisions. Large utility accounts typically carry premium tier pricing roughly 30% above basic tier rates given the operational value granular forecasting delivers. Vendors report this premium tier revenue carries meaningfully stronger renewal rates than basic accuracy subscriptions overall.
Market Impact: Premium tier subscribers pay roughly 30% more overall

Regulatory Compliance and Reporting Add-On Services

Vendors increasingly sell dedicated compliance reporting add-ons that automatically format forecasting accuracy data into documentation matching specific regulatory audit requirements, saving utility compliance officers considerable manual reporting effort during licensing renewal cycles. This packaged reporting capability commands a meaningful price premium over raw forecast data alone, since utilities value the time savings and reduced audit risk more than the underlying data itself. Utilities in heavily regulated markets pay contract prices running roughly 20% higher for bundled compliance reporting. Utilities often renew these compliance add-ons automatically alongside their core annual subscription contracts.
Market Impact: Compliance reporting adds roughly 20% pricing premium overall

Grid Integration and Data Engineering Services

Vendors sell dedicated data integration consulting engagements that connect legacy grid infrastructure and sensor systems to modern forecasting platforms, since navigating decades of accumulated legacy data formats requires specialized expertise most utilities lack internally. This integration revenue carries meaningfully higher margins than the underlying software subscription itself, drawing on specialized data engineering expertise vendors have spent years developing. Some vendors now generate roughly 25% of total account revenue from these integration services during a utility's first contract year. Utilities often renew these integration engagements annually as new sensor data sources come online.
Market Impact: Integration services add roughly 25% of total revenue

Outcome-Based Pricing Tied to Cost Savings

Some vendors structure pricing partly around demonstrated grid balancing cost savings, charging a percentage of documented savings rather than a flat subscription fee, reducing budget approval friction for utilities hesitant to commit to upfront analytics spending without proven results. This outcome-based model appeals strongly to smaller utilities facing tighter capital budgets and greater internal scrutiny of new technology spending. Utilities adopting this pricing model report contract renewal rates running roughly 2 times higher than those on flat subscription pricing. Vendors are actively expanding this outcome-based model across additional utility customer segments given its strong appeal.
Market Impact: Outcome-based deals renew roughly 2 times more often

Who Controls the Margin Pool

Five vendors, evaluated on annual recurring revenue from grid forecasting and analytics platforms, together account for an estimated 40% of tracked market revenue, leaving a long tail of regional specialists competing for remaining utility budget. Itron leads through existing smart meter installed base and utility relationships, while AutoGrid and C3.ai compete closely for forecasting platform contracts that neither incumbent fully dominates across every utility segment.
Current competitive activity centers on regulatory reporting expansion, as every major vendor races to differentiate forecasting platforms through built-in compliance documentation rather than competing purely on raw forecasting accuracy alone. Partnership announcements between analytics vendors and traditional grid equipment manufacturers have become a common deal structure over the past two years, extending platform reach without requiring vendors to build comparable hardware integration entirely from scratch.

Emerging pressure comes from cloud infrastructure providers who could bundle forecasting capability directly into broader utility data platform offerings, potentially disintermediating standalone analytics vendors for cost-conscious smaller utilities. Rankings could shift meaningfully if a major cloud provider acquires a leading forecasting specialist outright, combining computational scale with existing utility data infrastructure relationships that smaller specialists currently cannot match alone.
energy-intelligence-solution-market-company-positioning-matrix-1788421594884

Competitive Moat and Risk Dimensions

ITRON

Moat: Deep Smart Meter Installed Base

Itron's existing smart meter installed base across thousands of utilities gives it distribution scale for analytics services that pure-play software vendors cannot match quickly, letting the company cross-sell forecasting capability into an already vast existing customer relationship spanning most utility segments. This installed base advantage compounds with each new meter deployment cycle.
ITRON

Risk: Hardware Legacy Slows Software Innovation

Itron's hardware manufacturing heritage can slow the pace at which it ships advanced machine learning forecasting capability compared with nimble software-first startups built entirely around modern analytics from inception. Utilities evaluating the most advanced forecasting accuracy sometimes favor smaller specialist vendors over Itron's broader but less specialized analytics offering.
AUTOGRID

Moat: Specialized Renewable Forecasting Expertise

AutoGrid's deep specialization in renewable-heavy grid forecasting gives it credibility among utilities managing the highest renewable penetration levels that generalist analytics vendors struggle to serve effectively. This specialization advantage wins accounts specifically seeking proven high-renewable forecasting rather than generic demand prediction capability. Utilities value this specialization highly during vendor selection.
AUTOGRID

Risk: Limited Scale Versus Diversified Rivals

AutoGrid's narrower focus on renewable forecasting limits its ability to cross-sell broader grid management capability that diversified competitors like Itron and Schneider Electric can offer within a single vendor relationship, potentially constraining account expansion opportunities compared with more broadly positioned rivals. AutoGrid competes primarily on forecasting quality instead.

Players Tracked

Prominent Players

Itron
AutoGrid
C3.ai
Uplight
Schneider Electric

Other Key Players

Siemens Energy
General Electric Digital Energy
Oracle Utilities
SAP for Utilities
Landis+Gyr
Bidgely
Grid4C
Verdigris Technologies
Opower
Utilidata
EnergyHub
Kevala
Innowatts
Origami Energy
PowerSecure

Recent Developments

MARCH 2025

Itron launched an enhanced grid analytics platform incorporating machine learning demand forecasting directly into its existing smart meter data infrastructure, letting utilities activate advanced forecasting without procuring a separate third-party analytics platform entirely. The rollout extended to conditional forecasting alerts covering third-party grid sensors integrated through existing meter infrastructure.
Signal: Signals hardware incumbents are now increasingly bundling advanced analytics directly into infrastructure utilities already trust deeply.
AUGUST 2025

AutoGrid announced a strategic partnership with a major electric vehicle charging network operator to develop specialized demand forecasting models accounting for charging infrastructure load patterns across dense urban service territories. The partnership initially covers select major metropolitan markets with plans for broader national coverage expansion.
Signal: Signals forecasting vendors are now increasingly pursuing partnerships to address emerging electric vehicle demand volatility directly.
NOVEMBER 2025

Schneider Electric acquired a smaller grid balancing optimization startup specializing in automated dispatch algorithms, adding artificial intelligence capability to its existing energy management platform ahead of a planned broader product integration effort. The acquired team will be integrated into Schneider Electric's existing product engineering and data science division.
Signal: Signals established energy technology vendors are now increasingly acquiring artificial intelligence capability rather than building internally.

Compute Infrastructure and Data Engineering Exposure

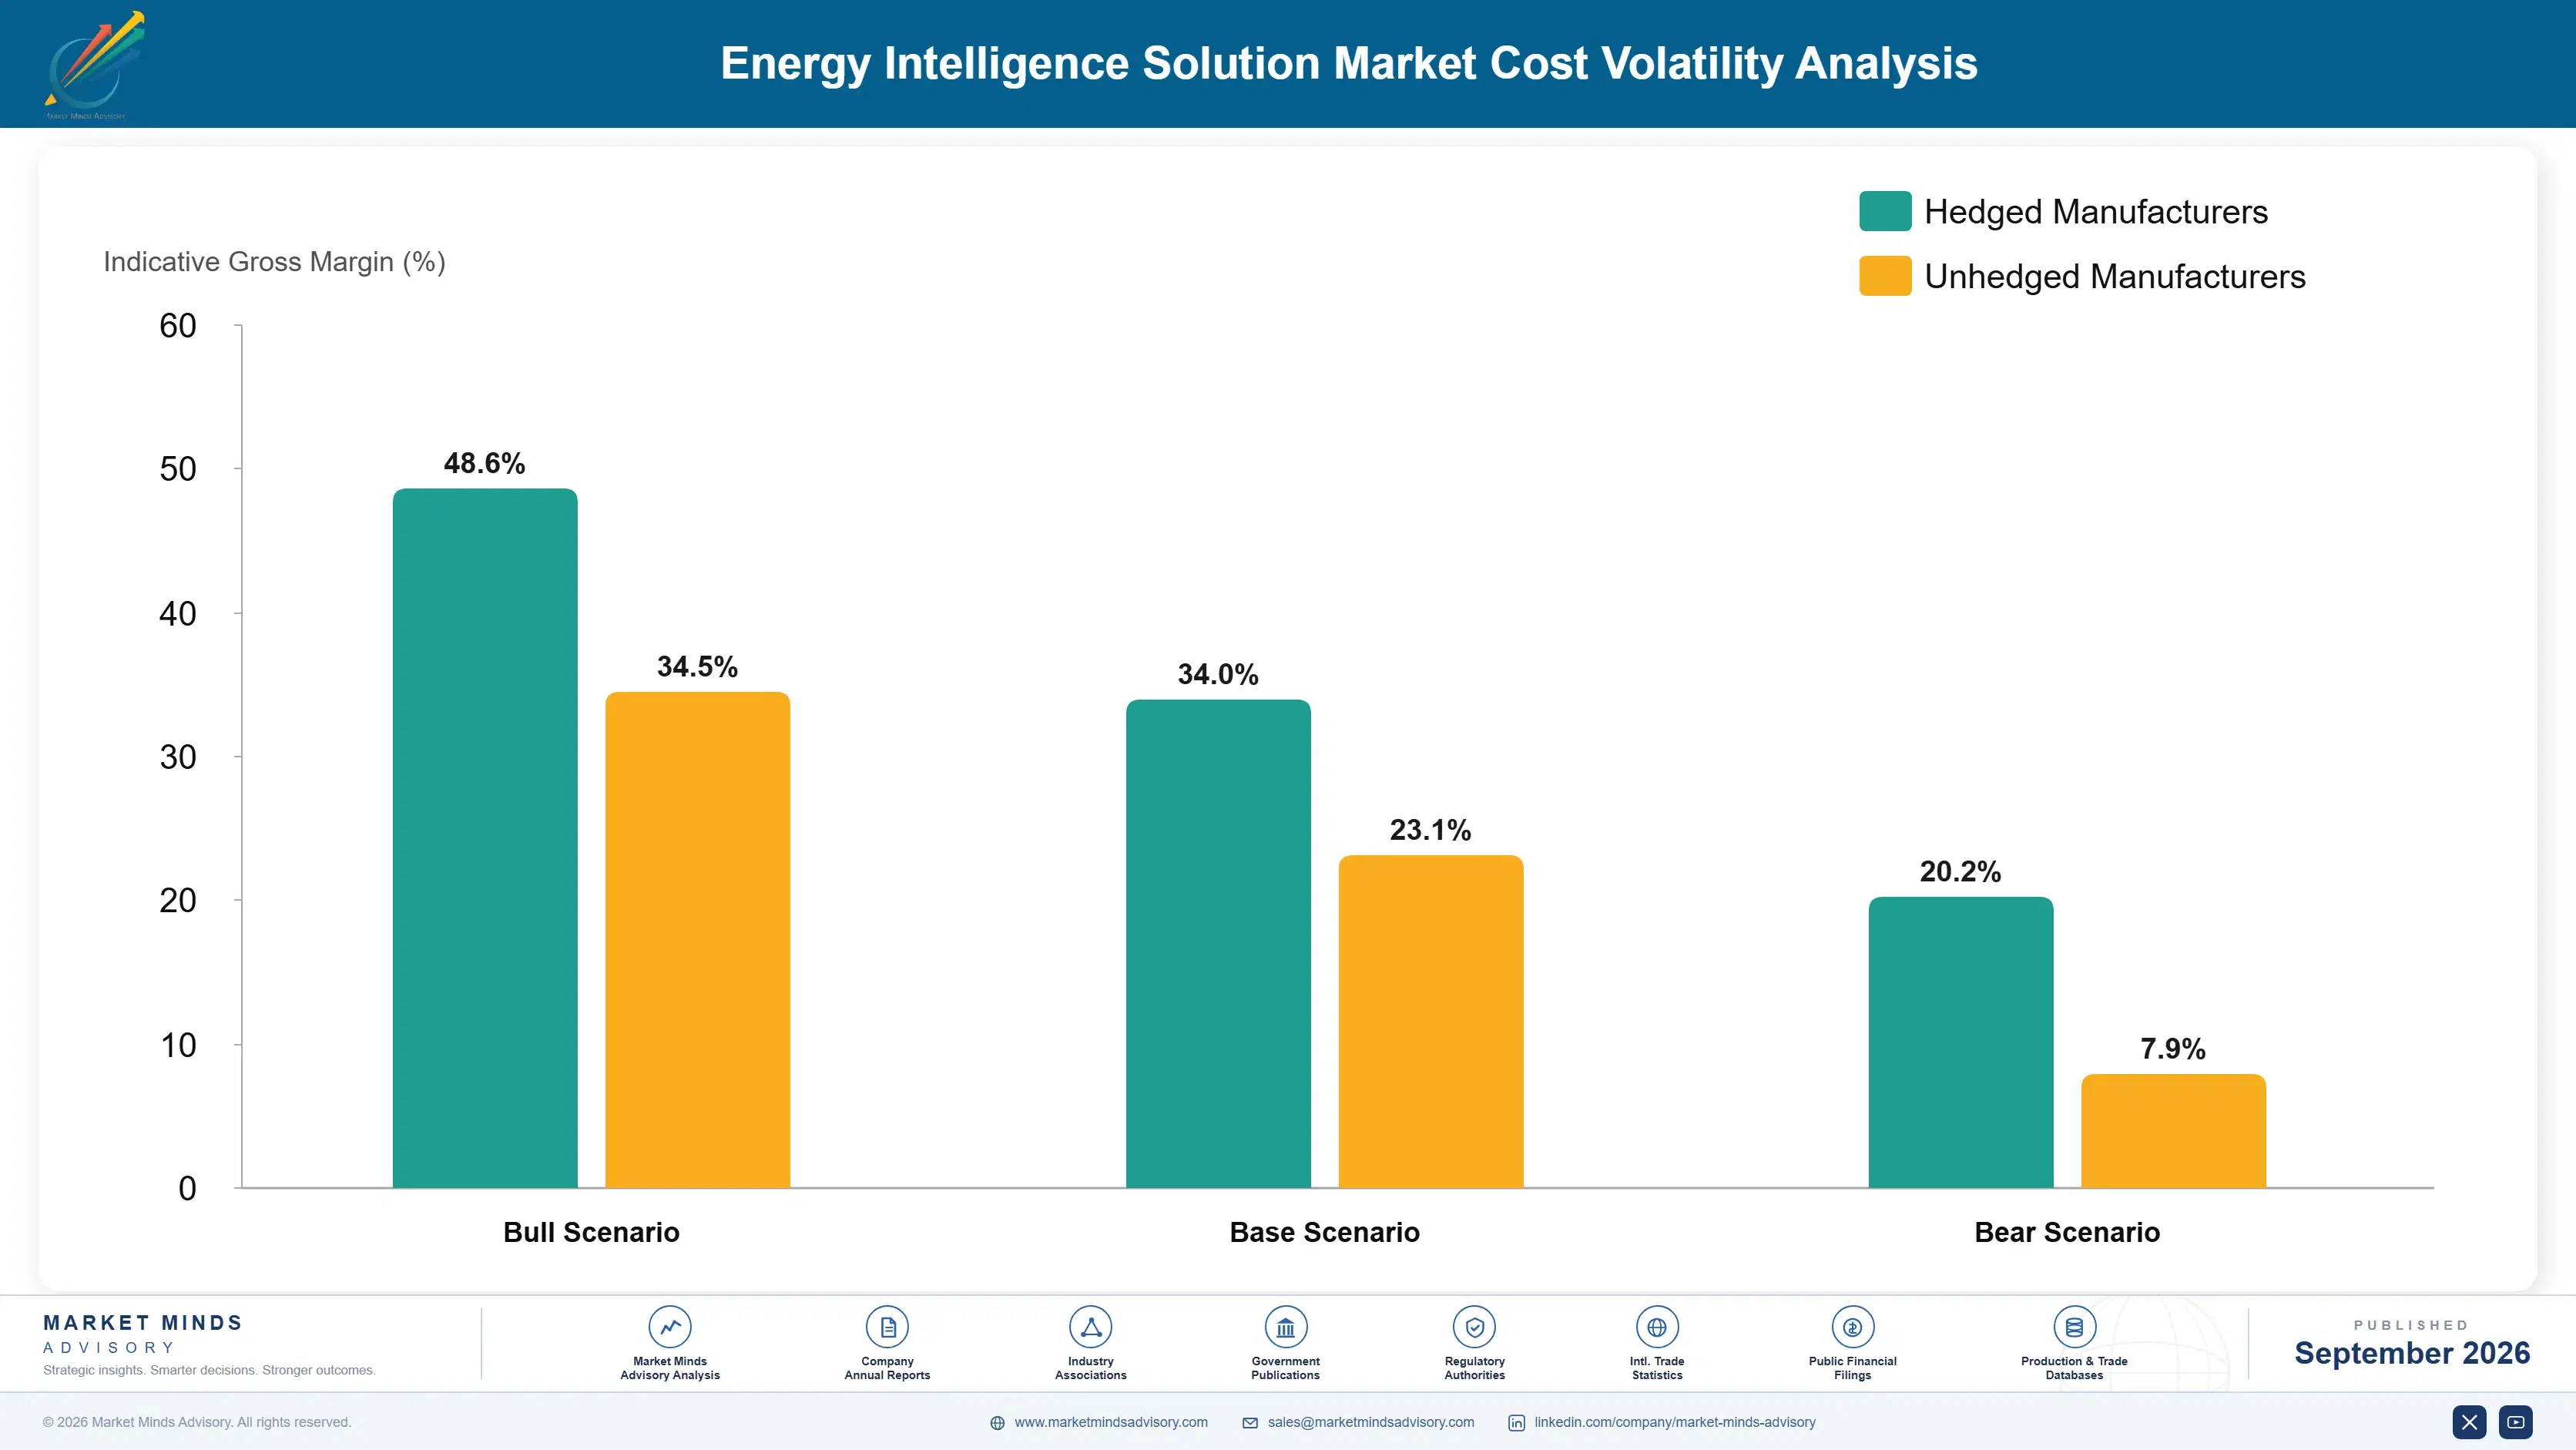
Cloud computing infrastructure account for an estimated 32% of total cost of delivering energy intelligence platforms, sourced primarily from major hyperscale cloud providers running the machine learning models underlying forecasting accuracy. Specialized data science and grid engineering talent represents a second major cost input, concentrated among a limited pool of professionals. Component sourcing remains concentrated among a small number of qualified providers.
A notable cloud computing pricing increase from a major hyperscale provider in mid-2025, documented in that provider's own investor communications, pushed several smaller energy intelligence vendors to renegotiate hosting contracts or migrate workloads to alternative providers entirely. The transition period created temporary service reliability concerns for a handful of utility customers during the multi-week migration window. Delivery timelines gradually normalized within roughly two months as broader supply conditions eased across the industry.

Smaller energy intelligence vendors lacking negotiating leverage with hyperscale cloud providers pay meaningfully higher per-unit compute costs than larger competitors who can commit to substantial multi-year volume agreements. This dynamic disproportionately affects newer entrants without established utility customer bases large enough to justify long-term infrastructure commitments comparable to incumbent vendors serving many utilities. Vendors with existing scale weathered the pricing pressure better than newer entrants.
energy-intelligence-solution-market-cost-volatility-analysis-1788421595080

Multi-Provider Cloud Sourcing Strategy

Leading vendors increasingly distribute workloads across two or more cloud providers to reduce dependency on any single hosting relationship and preserve negotiating leverage during contract renewal cycles. This redundancy adds modest complexity but meaningfully lowers concentration risk. Vendors report meaningfully improved cost predictability once multi-year agreements are secured well ahead of large deployments. overall.

In-House Data Science Talent Development Programs

Some vendors are building internal training pipelines that develop existing grid engineers into combined energy and data science specialists, reducing dependency on an extremely limited external talent pool. This approach requires upfront investment but improves long-term retention considerably. Several vendors expect this approach to meaningfully reduce hiring dependency during future talent market tightening periods.

Portfolio Architecture for Margin Defence

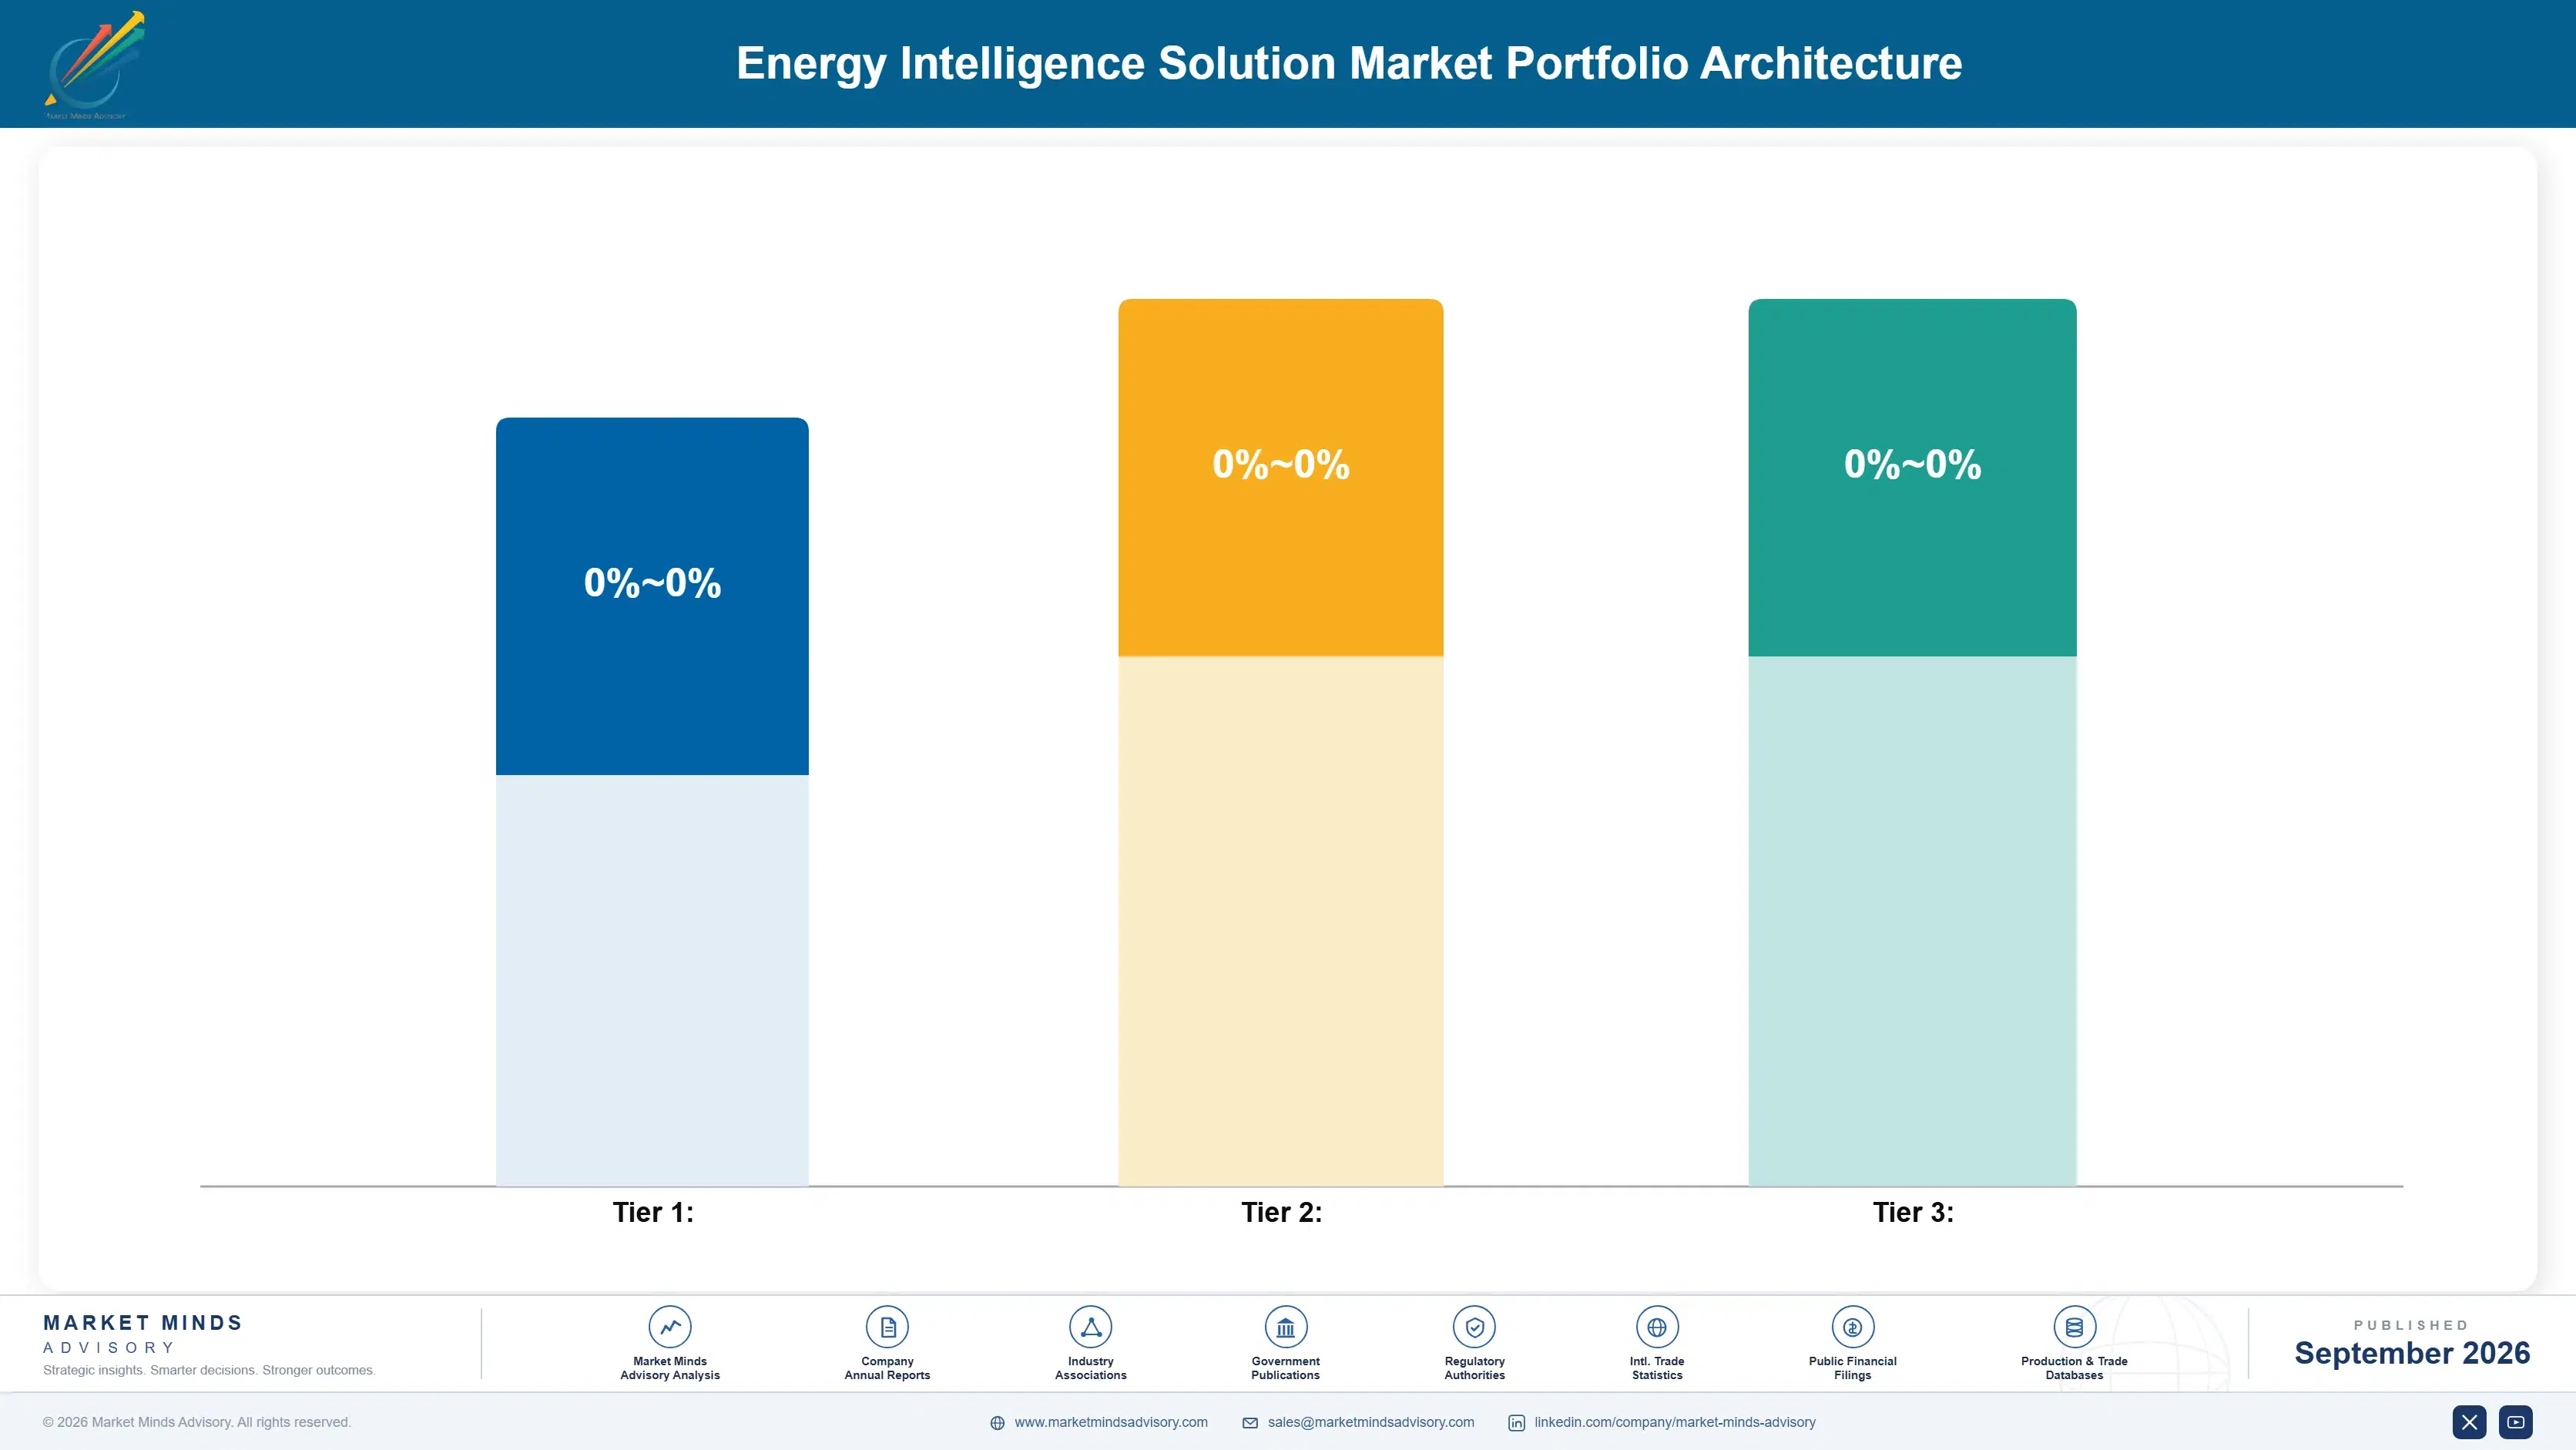
Vendors architect pricing around three distinct tiers separating basic regional forecasting from certified compliance-ready platforms and next-generation electric vehicle demand analytics still scaling from pilot deployment. Gross margins widen considerably as revenue moves up this tier structure, since higher tiers embed proprietary models and compliance support competitors cannot easily replicate. Vendors moving customers up this structure see improved profitability over successive contract renewal cycles.
Basic regional forecasting revenue carries margins comparable to conventional grid software licensing, while premium tiers bundling compliance reporting and granular accuracy command noticeably higher per-unit pricing. This tension between forecasting volume scale and premium accuracy differentiation shapes most vendor product roadmap decisions currently under active development. Vendors design roadmaps to nudge volume-tier customers upward through bundled trial access to compliance reporting features.

The highest-value pools concentrate among large utilities willing to pay for granular, electric vehicle aware forecasting that integrates directly with dispatch optimization and regulatory reporting requirements rather than functioning as standalone prediction software. Smaller vendors without this integration capability increasingly compete on price within the volume tier alone, ceding higher-margin premium utility accounts to larger established platform incumbents. Vendors investing early in this modeling are positioned to capture outsized share of this pool.

Basic regional demand forecasting priced comparably to standard grid software licensing, targeting cost-sensitive smaller utilities without complex compliance documentation or granular accuracy requirements attached. These accounts value predictable flat pricing over advanced feature depth entirely.
Gross Margin

Compliance-ready platforms bundling regulatory reporting and granular forecasting accuracy, targeting large regulated utilities commanding meaningfully higher per-unit pricing given embedded documentation capability. Renewal rates in this tier run notably higher than the volume segment overall.
Gross Margin

Electric vehicle aware forecasting systems integrating directly with dispatch optimization platforms, still scaling from pilot deployment, priced at the highest premium given differentiated proprietary technology involved. Commercial availability remains limited to a handful of early pilots currently.
Gross Margin
energy-intelligence-solution-market-portfolio-architecture-1788421595577

High-value Sub-segments and Strategic Watch-out

AI-Powered Demand Forecasting Platforms

This segment combines the fastest growth rate in the market with the strongest margin profile, as utilities integrate renewable capacity while paying premium pricing for documented accuracy that materially reduces balancing risk. MMA rates this segment the strongest combined opportunity in the entire portfolio. Early results support this.

Grid Balancing Optimization Software

Strong growth continues here as automated dispatch matures, though margins run somewhat thinner than forecasting given intensifying competition among vendors offering broadly comparable optimization capability. Vendors should still prioritize investment here given the large addressable utility base. Early results show strong customer satisfaction across tracked accounts.

Energy Consumption Analytics for Enterprises

This established segment anchors reliable core revenue for vendors serving large commercial and industrial customers, growing more slowly than forecasting-specific alternatives but maintaining loyal customers with long-standing relationships. This segment remains a dependable core revenue source for established vendors. Loyal customers renew at high rates consistently.

Renewable Generation Forecasting Tools

Growth here trails the broader market meaningfully, and vendors should watch closely for signs of accelerating displacement by more integrated demand forecasting categories that offer comparable renewable modeling without requiring separate platforms. Vendors should monitor renewal rates closely for early signs of accelerating decline. Early signals matter.

The Compliance Annuity Behind Grid Forecasting

Utility forecasting contracts function much like a compliance annuity, since renewal happens automatically each licensing cycle once a utility's compliance and grid operations teams depend on documented forecasting accuracy for reliability reporting. This gives vendors predictable revenue visibility once a utility completes initial deployment. Churn for fully deployed utilities runs notably lower than typical enterprise software, since switching cost grows each licensing cycle.
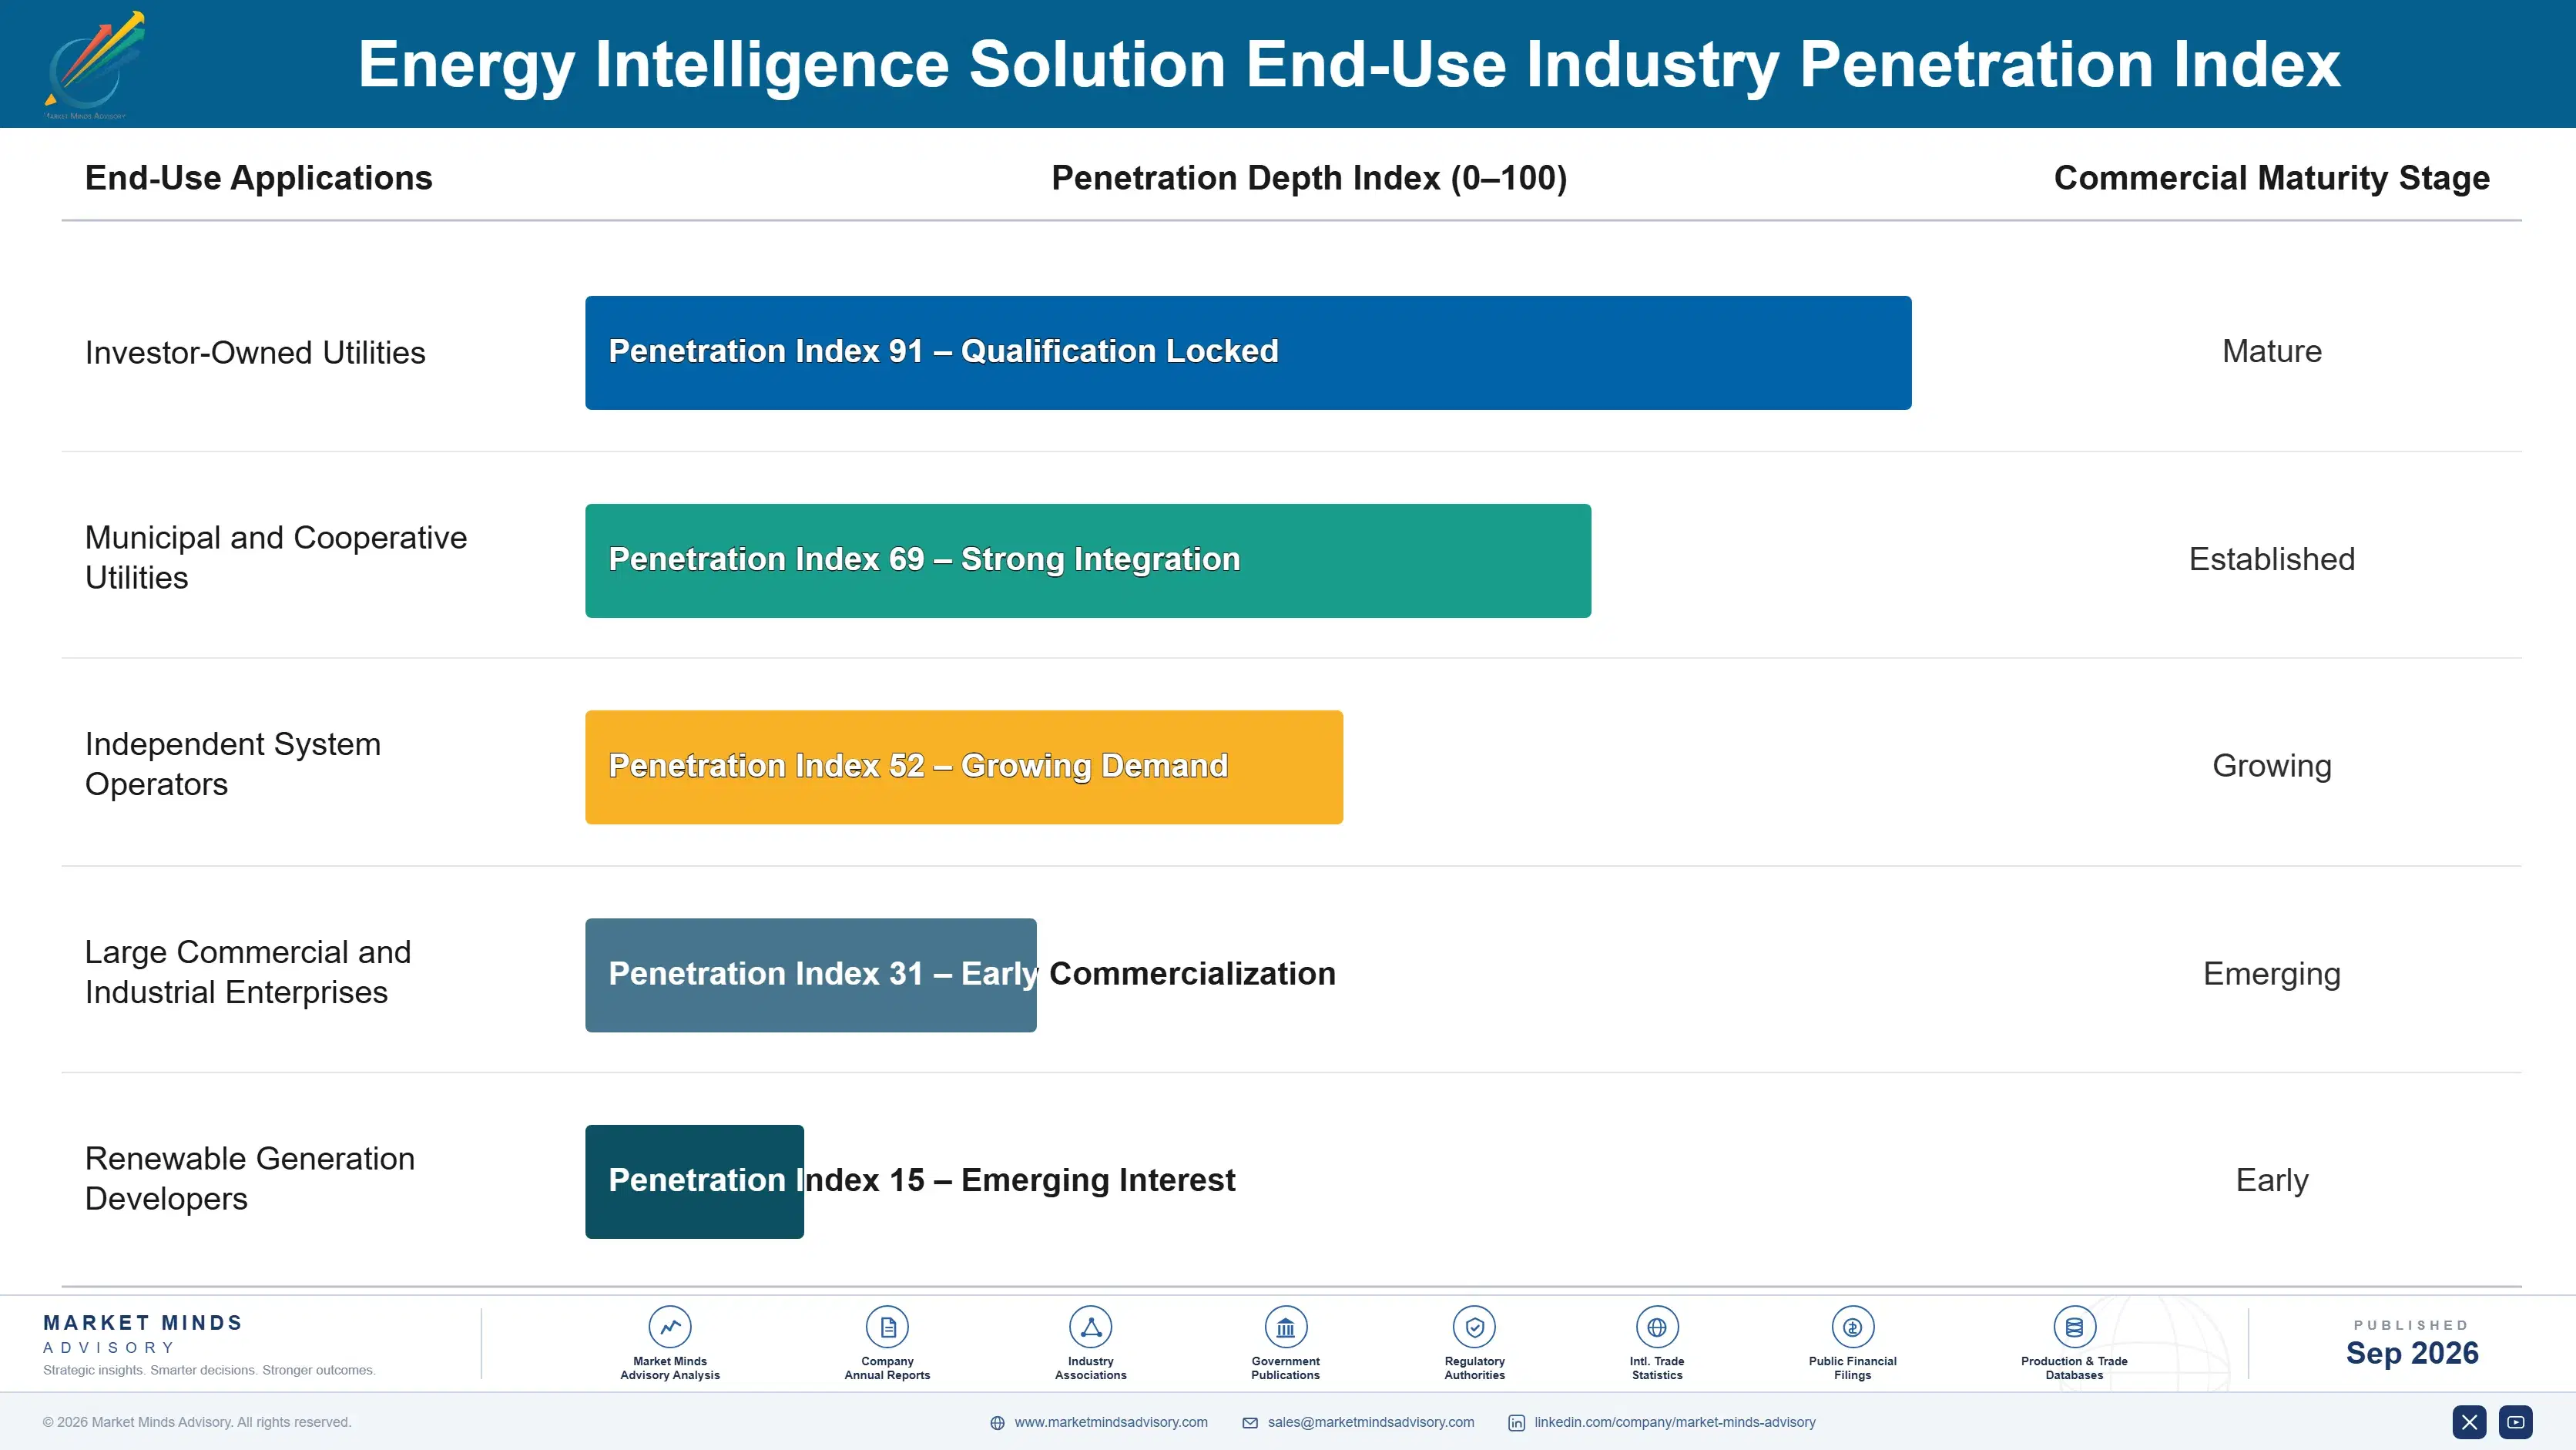
Adoption depth varies meaningfully by end-use vertical: utilities with high renewable penetration embed forecasting deeply given clear measurable balancing cost savings, while utilities with predominantly fossil fuel generation often see lighter deployment, leaving legacy dispatch methods considerably longer. Fossil fuel utilities occupy a middle ground, adopting forecasting selectively for peak demand periods rather than continuous grid-wide monitoring. overall.

Buyer profiles are shifting generationally as grid operations engineers who built careers on manual dispatch judgment give way to a newer cohort trained on data-driven grid management from early in their careers. This shift accelerates procurement, since newer buyers arrive already comfortable evaluating forecasting dashboards. Vendors report shorter sales cycles engaging this cohort, since advocacy increasingly comes from within operations teams rather than executives.
energy-intelligence-solution-market-end-use-penetration-index-1788421596058

Where Vendors Should Focus Next

These are among the four positions where our research anticipates prominent divergence between winners and laggards over the coming forecast period. Each is grounded in the demand model, the regulatory perimeter, and the announced capacity pipeline.
01 / COMPLIANCE-LED SALES MOTION

Lead utility sales with regulatory reliability requirements first

Regulatory reliability standards close utility deals faster than any raw forecasting accuracy comparison exercise, since compliance officers now approve analytics budget directly based on documented licensing requirements rather than deferring entirely to grid operations engineering teams. Vendors that lead sales conversations with specific regulatory documentation capability convert prospects meaningfully faster than those leading purely with forecasting model sophistication claims. This approach matters most for vendors selling into utilities facing the nearest licensing renewal deadlines and steepest reliability compliance exposure under updated regulatory standards.
02 / ELECTRIC VEHICLE ANALYTICS INVESTMENT

Build electric vehicle demand modeling before rivals close gap

Electric vehicle charging infrastructure is creating an entirely new demand volatility category that generic forecasting platforms were not originally engineered to handle effectively, requiring specialized modeling capability most vendors currently lack. Vendors developing credible electric vehicle demand modeling ahead of rivals can capture disproportionate share of this rapidly growing demand segment before general-purpose competitors adapt existing platforms to match specialized capability. This investment pays off most clearly in markets with rapidly expanding electric vehicle adoption rates and dense urban charging infrastructure.
03 / GRID INTEGRATION SERVICE EXPANSION

Expand data integration services ahead of legacy infrastructure backlog

Legacy grid infrastructure integration remains the single largest bottleneck limiting broader analytics platform adoption across most utilities tracked in this study, regardless of how sophisticated the underlying forecasting technology genuinely is. Vendors offering credible integration services that reduce this technical burden can shorten utility sales cycles meaningfully compared with rivals selling software capability alone without accompanying integration expertise. This investment pays off most clearly among utilities carrying decades of accumulated legacy grid infrastructure and quite constrained internal engineering resources overall.
04 / OUTCOME-BASED PRICING EXPANSION

Expand outcome-based pricing models to reduce budget friction

Budget constraint friction remains a genuine barrier limiting broader analytics platform adoption among smaller utilities facing tighter capital budgets and competing infrastructure priorities across multiple simultaneous grid modernization initiatives. Vendors offering outcome-based pricing tied to demonstrated cost savings can reduce this budget approval friction meaningfully compared with rivals requiring upfront commitment without proven results, capturing smaller utility accounts that flat subscription pricing alone cannot reach. This approach matters most for vendors targeting smaller regional utility segments specifically facing tighter capital constraints.

Engagement Snapshot From the Field

A live engagement with an industry participant carrying material or product regulatory and market exposure ahead of a defining policy shift, showing how our research translates into a defensible multi-year portfolio strategy.
MARKET MINDS ADVISORY · CLIENT ENGAGEMENT SUMMARY
Energy Intelligence Solution Producer Strategic Portfolio Review and Transition Roadmap 2026·Investment Scenario on Energy Intelligence Solution Exposure Evaluation 2025-26
CLIENT PROFILE
A regional electric utility integrating a substantial new wind and solar generation capacity expansion faced growing grid balancing challenges as renewable output variability began exceeding what its existing statistical forecasting methods could reliably predict during periods of rapid weather change. Leadership needed to reduce costly reserve capacity activation triggered by forecasting errors, facing pressure to show measurable improvement ahead of an upcoming regulatory rate case.
STRATEGIC CHALLENGE
Leadership needed to determine whether adopting a machine learning forecasting platform could meaningfully reduce reserve capacity activation costs without requiring a large dedicated data science team, and faced pressure to show measurable results within a single operating season to support the upcoming regulatory rate case filing. Board members also wanted assurance the transition would not disrupt existing dispatch operations.
MMA APPROACH
MMA benchmarked three candidate forecasting vendors against the utility's specific renewable integration profile, existing grid operations software compatibility, and regulatory reporting requirements, then modeled expected balancing cost savings and full multi-year total cost of ownership across each vendor option under consideration for this particular utility. Findings were shared with the utility's regulatory affairs team ahead of final vendor selection.
KEY FINDINGS
  1. Machine learning forecasting reduced reserve capacity activation costs meaningfully within the first operating season (client-reported, unverified by MMA) across the service territory.
  2. Forecast accuracy improved measurably during periods of rapid weather change compared with the utility's previous statistical forecasting methods used. This improvement proved consistent across multiple subsequent volatile weather events tracked.
  3. Regulatory reviewers acknowledged the documented forecasting improvement during the subsequent rate case filing review process. The favorable review meaningfully strengthened the utility's broader infrastructure investment case overall.
  4. Grid operations staff reported greater confidence in dispatch decisions once forecasting accuracy improved during volatile weather periods specifically. This confidence gain reduced unnecessary reserve capacity activation during borderline forecasting situations.
CLIENT PROFILE
A regional electric utility integrating a substantial new wind and solar generation capacity expansion faced growing grid balancing challenges as renewable output variability began exceeding what its existing statistical forecasting methods could reliably predict during periods of rapid weather change. Leadership needed to reduce costly reserve capacity activation triggered by forecasting errors, facing pressure to show measurable improvement ahead of an upcoming regulatory rate case.
STRATEGIC CHALLENGE
Leadership needed to determine whether adopting a machine learning forecasting platform could meaningfully reduce reserve capacity activation costs without requiring a large dedicated data science team, and faced pressure to show measurable results within a single operating season to support the upcoming regulatory rate case filing. Board members also wanted assurance the transition would not disrupt existing dispatch operations.
MMA APPROACH
MMA benchmarked three candidate forecasting vendors against the utility's specific renewable integration profile, existing grid operations software compatibility, and regulatory reporting requirements, then modeled expected balancing cost savings and full multi-year total cost of ownership across each vendor option under consideration for this particular utility. Findings were shared with the utility's regulatory affairs team ahead of final vendor selection.
KEY FINDINGS
  1. Machine learning forecasting reduced reserve capacity activation costs meaningfully within the first operating season (client-reported, unverified by MMA) across the service territory.
  2. Forecast accuracy improved measurably during periods of rapid weather change compared with the utility's previous statistical forecasting methods used. This improvement proved consistent across multiple subsequent volatile weather events tracked.
  3. Regulatory reviewers acknowledged the documented forecasting improvement during the subsequent rate case filing review process. The favorable review meaningfully strengthened the utility's broader infrastructure investment case overall.
  4. Grid operations staff reported greater confidence in dispatch decisions once forecasting accuracy improved during volatile weather periods specifically. This confidence gain reduced unnecessary reserve capacity activation during borderline forecasting situations.
RECOMMENDED STRATEGY
Phase 1: Phase one selected a vendor meeting both renewable integration requirements and existing grid operations software compatibility precisely. and reporting needs. Phase 2: Phase two piloted the platform during a single renewable-heavy season before expanding to year-round grid operations. to validate reliability first. Phase 3: Phase three trained grid operations staff on interpreting machine learning forecasts within existing daily dispatch routines. and regulatory reporting workflows used daily.
OUTCOME
The utility reduced reserve capacity activation costs and improved forecasting accuracy during volatile weather periods across its service territory (client-reported, unverified by MMA), while securing favorable treatment during its subsequent regulatory rate case filing review. Utility leadership credited the improved forecasting accuracy with strengthening its broader infrastructure investment case considerably.

Frequently Asked Questions

Foundational context covering the market sizes, CAGR, scope, country, region and competition that inform every finding below. This section is provided to cover basics and most often pre-purchase conversations, answered from the MMA Primary Research Dataset.

What is the current size of the Energy Intelligence Solution Market?

The Energy Intelligence Solution Market reached an estimated $6.2 billion in global revenue in 2025. This covers demand forecasting, grid balancing, and consumption analytics software sold to utilities and enterprises worldwide.

How large will the Energy Intelligence Solution Market be by 2036?

MMA projects the market will reach approximately $19.54 billion by 2036, driven mainly by renewable integration and regulatory reliability mandates. That represents roughly a 2.84 fold expansion from 2026 levels.

What is the CAGR for the Energy Intelligence Solution Market 2026 to 2036?

The market is forecast to grow at an 11.0% compound annual rate between 2026 and 2036. Bull and bear scenarios range between roughly 9.7% and 12.3% depending on electric vehicle adoption pace.

Which segment is growing fastest?

AI-powered demand forecasting platforms lead all segments, expanding at an estimated 15.0% annually. That is well above the overall market's 11.0% average growth rate through the forecast period to 2036.

Who are the major companies in the Energy Intelligence Solution Market?

Itron, AutoGrid, C3.ai, Uplight, and Schneider Electric form the five leading vendors tracked in this report. Together they hold an estimated 40% combined share of tracked market revenue.

Which country is growing fastest?

China posts the fastest national growth rate in the study, expanding at an estimated 13.0% annually. Its massive renewable capacity expansion and government-backed grid modernization investment drive unusually rapid adoption there.

Report Segmentation Architecture

The full report scope spans multiple orthogonal segmentation dimensions, with cross-tabulated demand data provided for each dimension pair. Coverage extends further to regional breakdowns, trend trajectories, and the competitive detail needed to support segment-level decision-making.

By Primary Market Dimension

  • AI-Powered Demand Forecasting Platforms
  • Grid Balancing Optimization Software
  • Energy Consumption Analytics for Enterprises
  • Renewable Generation Forecasting Tools
  • Electric Vehicle Charging Demand Analytics
  • Regulatory Compliance and Reporting Software

By End-Use Industry

  • Investor-Owned Utilities
  • Municipal and Cooperative Utilities
  • Independent System Operators
  • Large Commercial and Industrial Enterprises
  • Renewable Generation Developers

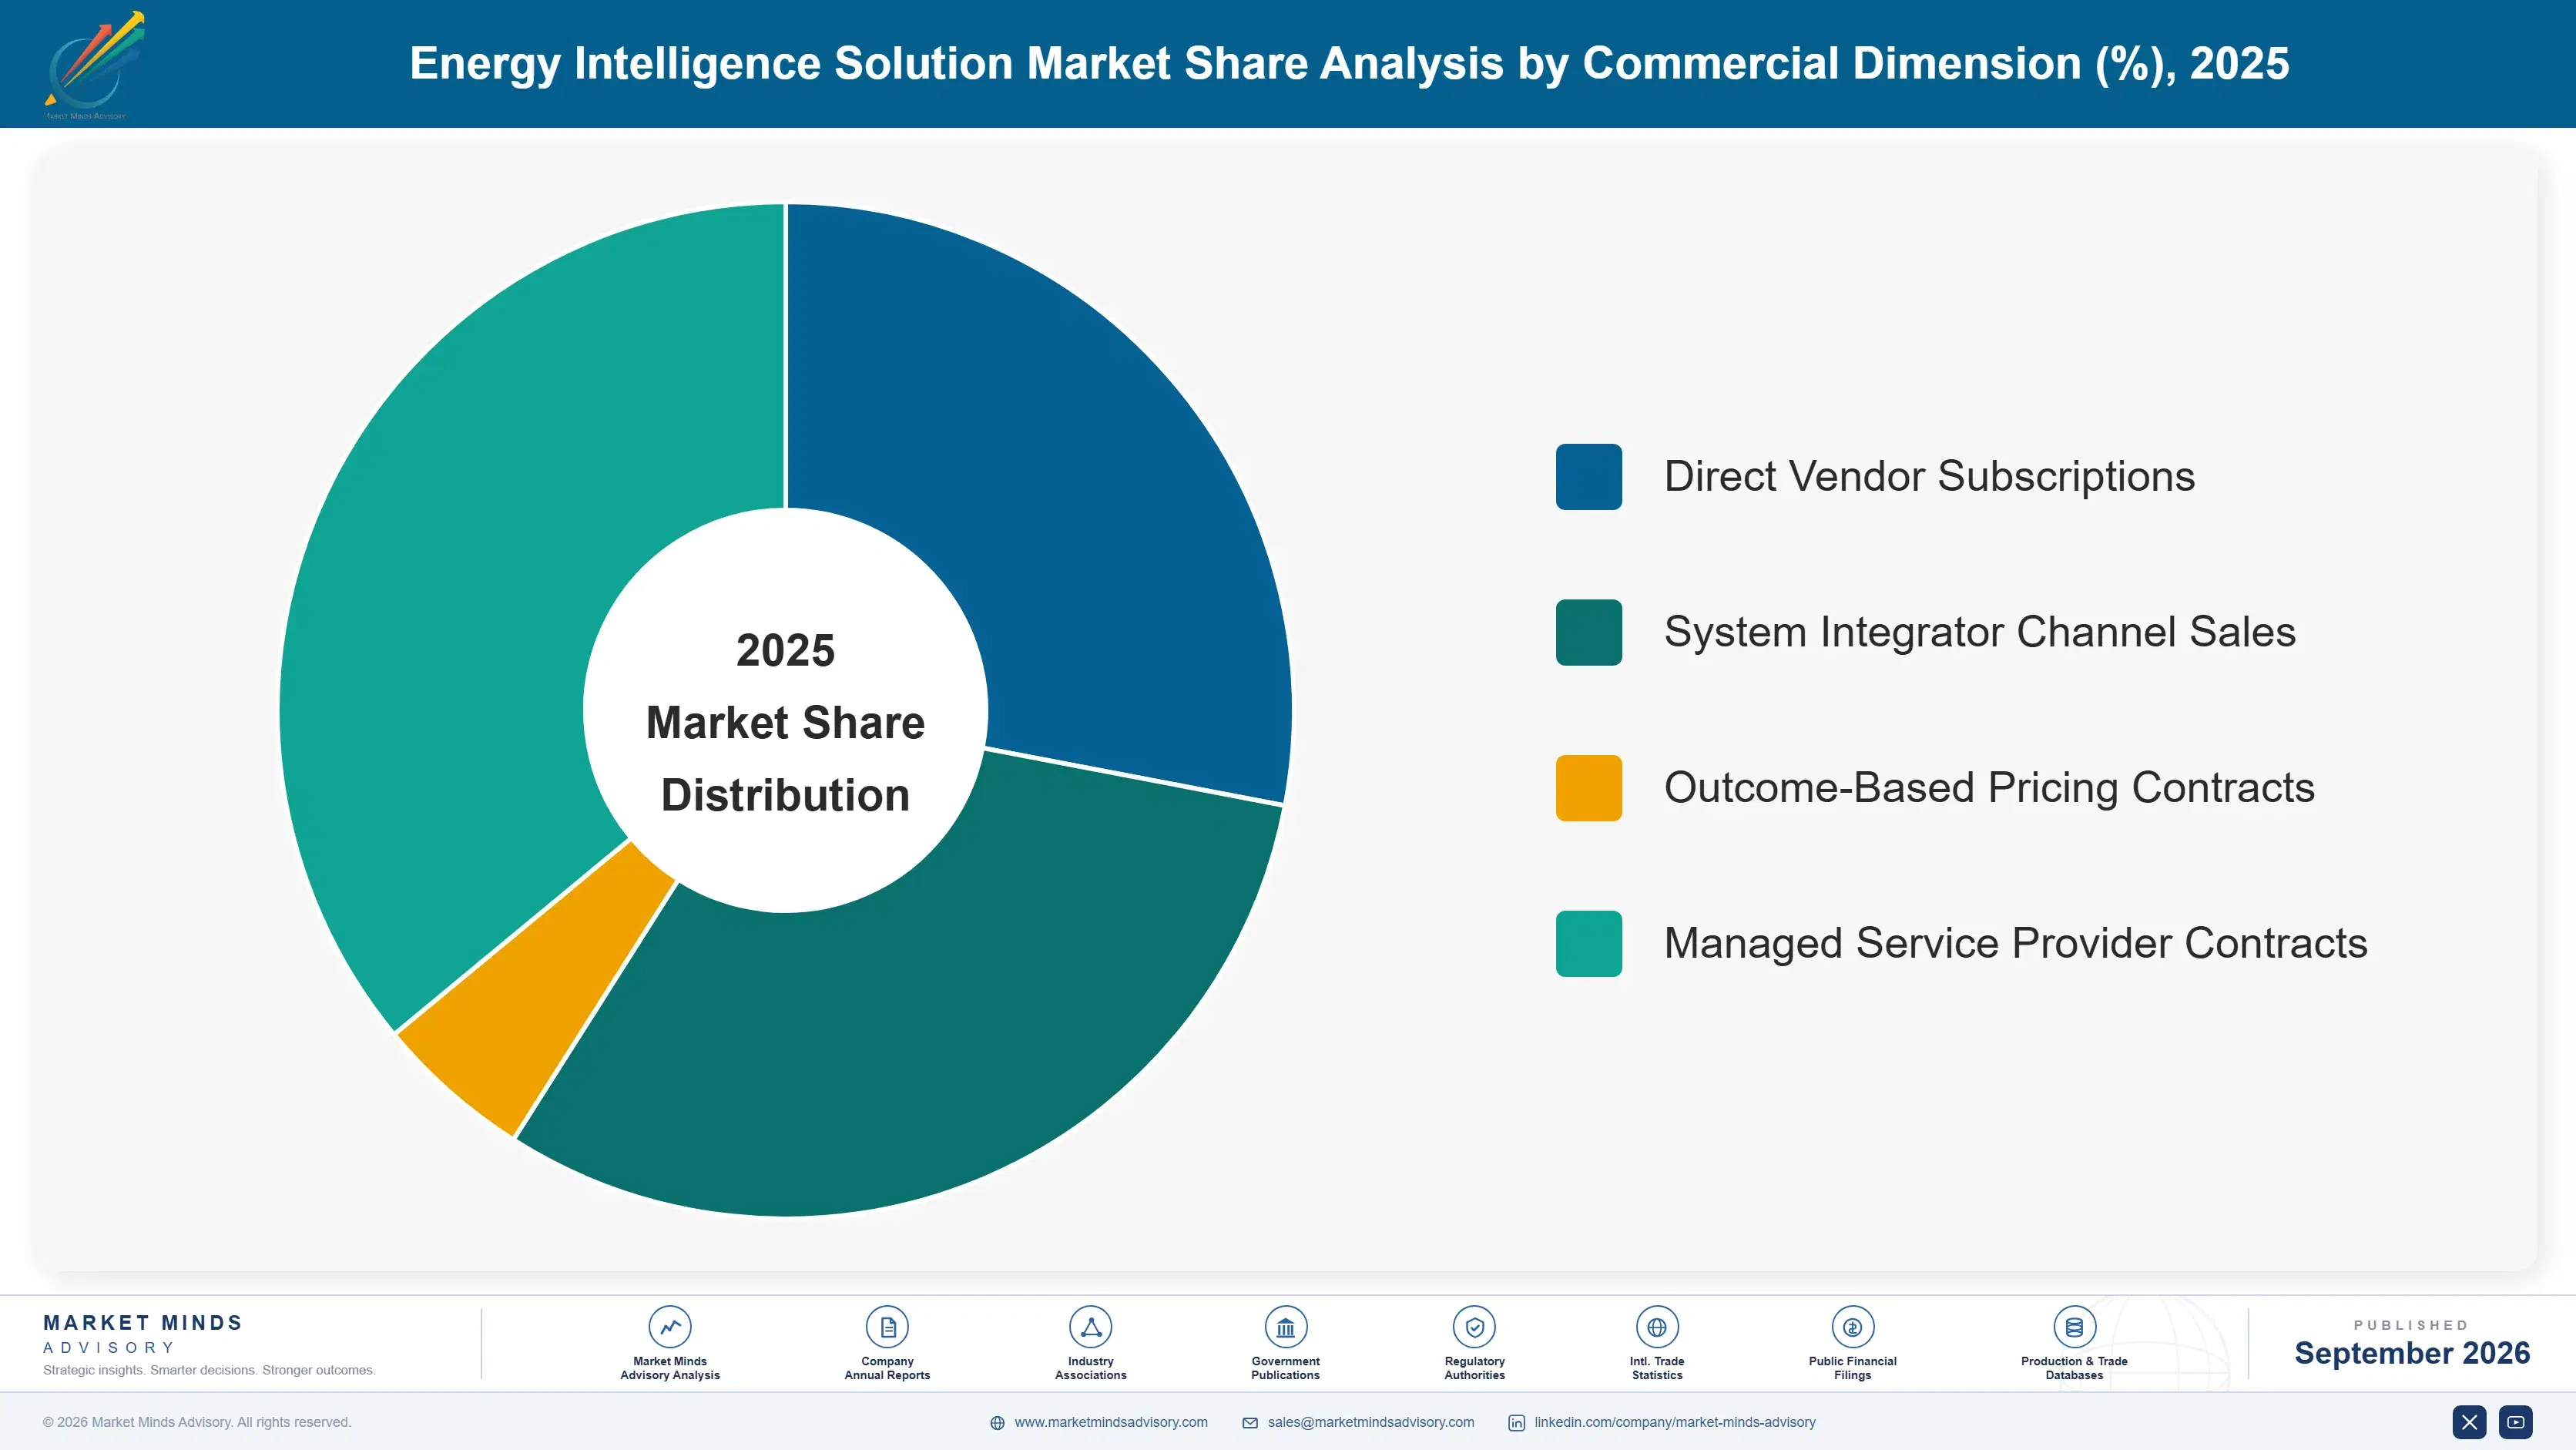
By Commercial Dimension

  • Direct Vendor Subscriptions
  • System Integrator Channel Sales
  • Outcome-Based Pricing Contracts
  • Managed Service Provider Contracts

By Region

  • North America
  • Western Europe
  • East Asia
  • South Asia and Pacific
  • Latin America
  • Middle East and Africa
  • Eastern Europe

Scope, Methodology, and Coverage

Every figure in this report is reproducible from documented input assumptions. The scope below maps the historical period, the forecast horizon, the segmentation dimensions, and the countries covered, alongside the underlying primary and qualitative methodology.
Historical Period
2020 to 2025
Forecast Period
2026 to 2036
Base Year
2025 (USD billions; MMA Primary Research Dataset, September 2026)
Market Definition
The Energy Intelligence Solution Market covers software platforms for grid demand forecasting, energy consumption analytics, and renewable generation optimization sold to utilities and large enterprise energy consumers, measured by subscription and licensing revenue. It excludes physical grid hardware, smart meters, and battery storage systems sold separately from analytics software.
Quantitative Units
USD Billion, CAGR (%), Share (%), 2020 to 2036
Segmentation Dimensions
By Primary Market Dimension; By End-Use Industry; By Commercial Dimension; By Region
Regions Covered
North America, Western Europe, East Asia, South Asia and Pacific, Latin America, Middle East and Africa, Eastern Europe
Countries Covered
United States, Canada, United Kingdom, Germany, France, Spain, China, Japan, South Korea, India, Australia, Brazil, Mexico, Saudi Arabia, United Arab Emirates, South Africa, Poland
Key Companies Profiled
Itron, AutoGrid, C3.ai, Uplight, Schneider Electric, Siemens Energy, General Electric Digital Energy, Oracle Utilities, SAP for Utilities, Landis+Gyr, Bidgely, Grid4C, Verdigris Technologies, Opower, Utilidata, EnergyHub, Kevala, Innowatts, Origami Energy, PowerSecure
Quantitative Methodology
Primary survey, n=3,800 respondents, Q4 2025, six countries; demand-side model with trade association cross-validation
Qualitative Methodology
47 expert interviews, Q4 2025; applied to validate demand model assumptions, identify emerging dynamics, and assess competitive positioning
Report Format
PDF and XLSX data workbook (Word format preview document)
Publisher
Market Minds Advisory
Report Code
MMA-2026-ENE-621
Published
September 2026
Contact
sales@marketmindsadvisory.com | www.marketmindsadvisory.com

Purchase the full Energy Intelligence Solution Market Report (2026 to 2036).

The full report delivers a comprehensive analysis of the Energy Intelligence Solution Market, covering historical performance from 2020 through 2025 and forecasts extending to 2036. It provides detailed segmentation across six primary product categories, seven regional markets, and competitive profiles of the twenty leading vendors shaping industry structure. Readers gain access to quantified demand drivers, restraints, and revenue lever analysis grounded in primary survey data and expert interviews. The report also includes a detailed input cost exposure assessment and portfolio tier framework for strategic planning purposes.
Seven-region market sizing and forecast data
Twenty vendor competitive profiles and positioning
Segment-level CAGR and revenue projections through 2036
Primary survey data from 3,800 respondents
Expert interview insights from 47 industry specialists
Revenue lever and portfolio tier strategic frameworks

Built For The People Who Decide

From boardroom strategy to bench-side execution, this report is read cover-to-cover by leaders shaping the next decade of their industry, turning demand scenarios, market dynamics and valuation benchmarks into decisions.
CXOs/ Presidents/ VPs/ Managers
M&A and Corporate Development
Strategy Teams and R&D Heads
Procurement and Product Directors
Regulatory and Compliance Leaders
Investor Relations and Equity Analysts