Market Minds Advisory
Energy Efficiency Gamification Market

Energy Efficiency Gamification Market: Energy Efficiency Gamification Market: Behavioural Engagement, Flexibility Enrolment and Programme Evidence, 2026 to 2036

Behavioural savings are genuine, small, and they fade within months of the messages stopping. The category grew anyway because regulators let utilities count them, and it is now pivoting from saving kilowatt-hours toward shifting them.

Lead Analyst

Published

September 2026

Make Smarter Decisions with Customized Research Insights

Request a free sample report and evaluate market opportunities, growth trends, and competitive dynamics relevant to your business needs.

2025 MARKET VALUE$0.6BMarket Size 2025
2036 FORECAST VALUE$2.5BBase Case , 2026 to 2036
CAGR 2026 TO 203613.6 %Bull 14.9% / Bear 12.3%
INCREMENTAL OPPORTUNITY$1.8BNet 10- year value creation
EXPANSION MULTIPLE3.57x2036 value over 2026 base
Strategic Levers
M&A Pipeline
Regional Outlook
Country Rankings
Competitive Intelligence
Segmental Deep-dive
Call-Us : 91 93563 13602

Executive Snapshot and Market Trajectory.

Behavioural energy programmes save about 2.1% of household consumption, and the effect decays within roughly seven months once contact stops. Everyone in the industry knows this. The category grew regardless, because regulators permitted utilities to count those savings toward statutory targets. That is the honest starting point here.
That accounting basis is now being joined by something with harder economics. Capacity has a price and conservation mostly does not, so shifting a kilowatt-hour is worth more than saving one. Demand flexibility enrolment and event gamification grows at 20.4%, half again the market rate of 13.6%, and North America holds 34% of platform spend because behavioural savings count toward efficiency obligations in more than twenty states.
Five vendors hold 44% of platform spend, with the leader carrying an installed base built through a decade of home energy report contracts that regulators effectively guaranteed. Challengers are attacking from the flexibility side instead, where no incumbent position exists. Smart meter penetration determines what is even possible, which is why the fastest growth sits in markets completing large-scale meter deployment now. Meter data availability, not household appetite, sets the ceiling on addressable demand.
Market Definition
The energy efficiency gamification market covers software platforms applying game mechanics, social comparison, and reward structures to residential and commercial energy behaviour, including home energy reports and peer comparison, challenge and competition platforms, reward and incentive redemption engines, demand flexibility enrolment and event gamification, workplace and tenant engagement, and programme measurement. It excludes metering hardware, in-home display devices, building management systems, and distributed energy resource control platforms.
Base Year Value
$0.6B in 2025 (MMA Primary Research Dataset, September 2026)
Forecast Period
2026 to 2036, eleven discrete annual values
CAGR
13.6% base case. Bull 14.9%. Bear 12.3%.
Fastest Growth Segment
Demand Flexibility Enrolment And Event Gamification: 20.4% CAGR
Fastest Growth Country
India: 18.9% CAGR
Fastest Growth Region
South Asia and Pacific: 15.8% CAGR
Largest Region
North America: 34% of 2025 global value
Market Leaders
Oracle, Uplight, Bidgely, EnergyHub, and Schneider Electric lead the field. Source: MMA Primary Research Dataset, July 2026.
Primary Survey
n=3,800 procurement and R&D decision-makers, Q4 2025, six countries
Methodology
Demand-side build-up, cross-validated against public data, 47 expert interviews

Energy Efficiency Gamification Market Forecast Scenarios

energy-efficiency-gamification-market-size-forecast-scenario-1790005581967
Growth between 2020 and 2025 came almost entirely from regulatory permission rather than from customer enthusiasm. Utilities under efficiency resource standards bought home energy report programmes because measured savings counted toward obligations they had to meet anyway, at a cost that compared well against equipment rebates. Historical growth of 12.4% reflects that steady regulatory demand, concentrated in a few North American jurisdictions.
The base case at 13.6% rests on three mechanisms. Smart meter deployment at scale, particularly India's national programme, creates the interval data without which none of these platforms function. Flexibility markets now pay for shifted load in ways that conservation was never paid for, which changes the value per enrolled household sharply. And building disclosure requirements push tenant engagement from voluntary activity into a reporting obligation with named accountability. Each mechanism is independent of the others.
The bull case at 14.9% depends on flexibility enrolment becoming a default option at electricity supply signup rather than a separate campaign, which would raise participation several times over. The bear case at 12.3% is regulatory: if efficiency resource standards drop behavioural savings from counted measures, citing persistence evidence, demand disappears faster than flexibility can replace it.

Regulators Bought This, Not Households

The buyer has never been the household. It is a utility meeting a statutory savings obligation, and the product it is buying is counted kilowatt-hours at an acceptable cost. Behavioural programmes deliver those at roughly USD 14 per household per year, which competes well against equipment rebates, and that comparison is the entire commercial foundation of the category. Household enthusiasm was never the mechanism.
TOP FIVE CONCENTRATION44%Share of platform spend held by the leading vendors
MEDIAN HOUSEHOLD SAVING2.1%Annual consumption reduction attributed to behavioural programme participation
SAVINGS PERSISTENCE7 monthsPeriod before measured savings decay without continued programme contact
COST PER ENROLLED HOUSEHOLDUSD 14Annual platform cost carried by the sponsoring utility
FLEXIBILITY ENROLMENT RATE9%Share of contacted households joining a demand flexibility programme
PROGRAMME RENEWAL RATE81%Utility contracts renewed at the end of a regulatory cycle
The awkward part is persistence. Measured savings of about 2.1% decay within seven months of contact ending, so the programme has to keep running to keep counting. Vendors present this as recurring revenue and regulators increasingly present it as a question. Several evaluation frameworks now discount behavioural savings on persistence grounds, which is the single largest risk anyone in this market carries. Nobody disputes the finding.
Flexibility changes the argument entirely. A household that shifts consumption during a system peak is worth something a market will actually pay for, measured in avoided capacity rather than in estimated conservation. Enrolment currently runs at 9% of contacted households, low enough that the growth headroom is obvious, and vendors are repositioning toward it as fast as their utility contracts permit. Utility contracts are the constraint, not customer willingness.
"The persistence problem is not a secret and it is not a scandal. It is simply the thing everyone in this market has agreed not to lead with, and the vendors moving fastest into flexibility are the ones who worked out that the argument was going to run out."
Practice Director, Utility Customer and Demand-Side Programmes · MMA Energy Practice · September 2026

Market Trends

Flexibility Payments Replace Conservation As The Value Argument

Capacity markets, flexibility auctions, and distribution deferral programmes all pay for load moved out of a peak. Conservation, outside jurisdictions with efficiency obligations, mostly pays nothing. The consequence is that a household enrolled in event-based flexibility is worth roughly six times more per year to a utility than the same household receiving efficiency messaging, and vendors have noticed. Platform roadmaps have shifted accordingly, with enrolment mechanics, event notification, and post-event feedback receiving development attention that home comparison reports no longer get. Around 37% of new platform contracts now include a flexibility scope alongside the efficiency one.
Market Impact: Operates across 20 jurisdictions

Smart Meter Deployment Determines Where Platforms Can Operate

None of this works without interval consumption data, so platform demand tracks meter deployment with a lag of about two years. India's national programme, targeting some 250 million meters, is the largest single expansion of addressable households anywhere and explains why Indian growth of 18.9% leads every country covered. European deployment is uneven, with completed rollouts in Scandinavia and Spain sitting alongside markets that have barely started. Vendors increasingly plan market entry against published meter deployment schedules rather than against population or electricity consumption, which produces a very different priority list.
Market Impact: Drives 16.9% segment growth

Market Opportunities and Growth Drivers

Efficiency Resource Standards Permit Counting Behavioural Savings

More than twenty United States jurisdictions allow utilities to count measured behavioural savings toward statutory efficiency targets, which converts a customer engagement expense into a compliance asset that can be recovered through rates. No other regulatory framework in the world does this at comparable scale, and it is why North America holds 34% of platform spend on a household base far smaller than Asia's. The mechanism is unusually clean: the utility buys counted kilowatt-hours, the regulator verifies them through evaluation, and the cost enters the rate base like any other efficiency measure.
Market Impact: Savings fade after 7 months

Commercial Building Disclosure Creates Named Tenant Accountability

Building performance standards and disclosure requirements in several major cities and jurisdictions now attach consequences to measured building energy intensity, and landlords cannot reach tenant-controlled consumption through equipment alone. That turns occupant engagement from a voluntary sustainability activity into a reporting obligation with somebody's name against it. Workplace and tenant modules grow at 16.9% on that basis, and the buyer is a property owner or facilities director rather than a utility, which opens a second commercial channel with different procurement rules and materially better willingness to pay per participant. Utility incumbency counts for nothing here.
Market Impact: Locks portfolios 3 to 5 years

Market Restraints and Challenges

Measured Savings Decay Within Seven Months Of Contact

Behavioural savings of about 2.1% fade to statistical insignificance roughly seven months after messaging stops. The root cause is attention rather than capability: households adjust habits under prompting and drift back once prompting ends, which is well documented and not disputed by anyone serious. Commercially this caps claimable persistence, forces continuous programme spend to sustain counted savings, and invites regulatory discounting that several evaluation frameworks have already applied. Vendors are responding by shifting toward equipment and tariff actions that persist without contact, and by repositioning around flexibility events where the measurement window is hours rather than years.
Market Impact: Included in 37% of new contracts

Utility Procurement Follows Multi-Year Regulatory Cycles

Efficiency programme portfolios are approved in regulatory filings covering three to five years, so a vendor that misses a cycle waits until the next one regardless of product merit. The root cause is rate case procedure rather than any purchasing preference. This produces long sales cycles, lumpy revenue, and a renewal rate of 81% that reflects procedural inertia more than satisfaction. Vendors work around it through subcontracting to programme implementers already inside approved portfolios, through pilot scopes funded outside the main filing, and by entering on the flexibility side where procurement rules differ.
Market Impact: Targets 250 million new meters
4 additional market trends, 3 additional growth drivers, and 2 additional restraints and challenges are covered in the full report. Contact sales@marketmindsadvisory.com to access the complete intelligence.

Segment CAGR and Growth Architecture

Segmentation follows platform function. Six functional segments cover what the software does: home energy reports and peer comparison, challenge and competition platforms, reward and incentive redemption engines, demand flexibility enrolment and event gamification, workplace and tenant engagement modules, and measurement and programme evaluation. Utilities typically buy three together; property owners buy differently. Flexibility scope increasingly arrives alongside.
energy-efficiency-gamification-market-market-share-analysis-1790005582558

Demand Flexibility Enrolment And Event Gamification

Flexibility grows at 20.4%, half again the market rate of 13.6%, and the reason is that somebody actually pays for the outcome. Capacity avoided during a system peak has a market price; conservation outside an obligation jurisdiction generally does not. An enrolled household is worth roughly six times more per year than one receiving efficiency messaging, which reorders every vendor's development priorities. Measurement is also cleaner, since an event lasts hours and the counterfactual is a same-day baseline rather than a year-long regression. Enrolment sits at 9% of contacted households, and the vendors treating that number as the whole opportunity are the ones growing fastest. Incumbency from efficiency work confers very little advantage here.
CAGR 20.4%

Workplace And Tenant Engagement Modules

Tenant engagement grows at 16.9% on a buyer that did not exist commercially five years ago. Building performance standards attach consequences to measured energy intensity, and a landlord cannot reach tenant-controlled consumption through plant upgrades alone, so occupant behaviour becomes a compliance problem with an owner's name attached. Procurement runs through property and facilities budgets rather than regulated utility portfolios, which means shorter cycles, no rate case dependency, and materially better willingness to pay per participant. The competitive field here is different too, populated by workplace engagement specialists rather than by utility platform incumbents, and consolidation between the two groups has started. Facilities budgets fund it, entirely outside any rate case process.
CAGR 16.9%
Full segment breakdown across 6 segments available in the complete report.

Regional Architecture and Country Demand Map

Regional shares track where a regulatory framework pays for behavioural savings or flexibility, not where households consume the most electricity. Smart meter penetration sets the ceiling on what is technically possible, and the two constraints rarely align neatly within the same market. Where they do align, growth follows quickly.

North America

At 34% North America sits above the standard band, and the justification is regulatory rather than demographic: more than twenty states permit utilities to count measured behavioural savings toward statutory efficiency targets and recover the cost through rates, which exists nowhere else at this scale. That single mechanism created the category and still funds most of it. Canadian provincial programmes operate on similar logic with smaller portfolios. Growth of 12.6% is moderate because penetration among obligated utilities is already high, and because several evaluation frameworks have begun discounting behavioural savings on persistence grounds, which pressures the counted-kilowatt-hour argument the whole region rests on. Flexibility scopes are being added to defend those relationships.
Share: 34% | CAGR: 12.6% (2026 to 2036)

Western Europe

Flexibility rather than conservation drives European purchasing. Markets with high renewable penetration need residential load shifting, and suppliers in Britain, the Netherlands, and the Nordic countries compete on engagement quality because tariff differentiation alone has stopped distinguishing them. Retail competition matters here in a way it does not in regulated North American markets: an engaged customer churns less, and that argument funds platform spend without any regulatory permission at all. Smart meter deployment is uneven, with Scandinavia and Spain complete while other markets lag badly. Growth of 12.2% is the slowest of the seven regions, held down by that deployment unevenness rather than by demand. Churn reduction funds what regulation does not.
Share: 25% | CAGR: 12.2% (2026 to 2036)
Regional intelligence for 5 additional markets available in the complete report: East Asia, South Asia and Pacific, Latin America, Middle East and Africa, Eastern Europe. Contact sales@marketmindsadvisory.com.
energy-efficiency-gamification-market-country-cagr-analysis-1790005583083

Where Platform Vendors Actually Earn

Four commercial moves separate vendors building durable revenue from vendors riding a regulatory permission that may not last. Each moves value away from counted conservation, which regulators are increasingly willing to discount, and toward outcomes that a market prices directly and that persist without continuous messaging. Regulatory permission is not a durable commercial position on its own.

Convert Efficiency Contracts Into Flexibility Enrolment Channels

A utility already running a behavioural programme has an engaged household list, notification consent, and a working delivery channel. Adding flexibility enrolment to that scope requires no new customer acquisition and lifts annual value per enrolled household by roughly six times, because avoided capacity has a market price that conservation does not. Vendors running this conversion systematically report contract values rising 55% to 80% at renewal without competing for the account again. It also insulates the relationship against evaluation frameworks that discount behavioural persistence. The channel already exists and is already consented.
Market Impact: Lifts contract value by 55% to 80% overall

Sell Into Property Owners Outside Regulated Portfolios

Building performance standards created a buyer with compliance exposure, a facilities budget, and no rate case dependency at all. Procurement takes weeks rather than the three to five year regulatory cycle that governs utility portfolios, and willingness to pay per participant runs several times higher because the alternative is a disclosed non-compliance. Vendors with a credible tenant engagement offer close roughly 2.7 times as many contracts per year as those confined to utility channels, and the revenue arrives outside the cycle that makes utility income so lumpy. Revenue also arrives outside the utility filing cycle.
Market Impact: Closes about 2.7 times more contracts each year

Subcontract Through Implementers Inside Approved Portfolios

Missing a regulatory filing cycle means waiting years, whatever the product is worth. Programme implementers already sitting inside approved portfolios can add a platform to an existing scope without a new filing, which turns a three year wait into a single quarter. Vendors using this route report entering roughly 40% of new utility accounts without ever appearing in a competitive procurement. The trade is margin shared with the implementer and a weaker direct relationship, and for a challenger with no incumbent position it is straightforwardly worth both. Timing matters more than margin for a challenger.
Market Impact: Enters roughly 40% of new accounts indirectly today

Prioritise Markets By Meter Deployment Schedule

Platform demand follows interval data availability with a lag of about two years, so published smart meter rollout schedules forecast addressable households more accurately than population or consumption ever will. India's programme alone adds some 250 million metered households to the technically addressable base. Vendors planning entry against deployment timetables rather than market size arrive with local partnerships already built, and win early utility relationships at roughly 2.1 times the rate of later entrants. The analysis costs almost nothing and very few vendors do it properly. Deployment schedules are published and freely available.
Market Impact: Wins 2.1 times more early utility relationships overall

Who Controls the Margin Pool

Concentration is moderate. Five vendors hold 44% of contracted platform spend, measured on that basis consistently across every participant, and the leader's position rests on a decade of home energy report contracts written when the regulatory permission was new and few alternatives existed. The gap between the leader and the fifth participant is substantial, but it was built in a segment that is now the slowest growing in the category.
Competition currently turns on three things: flexibility enrolment capability, evaluation credibility with programme regulators, and access to property owners outside utility portfolios. Price competition is limited within regulated procurement, because cost per counted kilowatt-hour is compared against equipment rebates rather than against other platforms. Retail suppliers in competitive European markets buy on churn reduction instead, which is an entirely different argument.

Pressure is building from two directions. Flexibility specialists with no efficiency heritage are winning enrolment scopes where incumbency counts for nothing. Meanwhile workplace engagement vendors are reaching property owners that utility platforms cannot easily serve. Rankings will shift toward whoever holds the flexibility enrolment relationship, since that is where value per household is concentrating.
energy-efficiency-gamification-market-company-positioning-matrix-1790005583616

Competitive Moat and Risk Dimensions

ORACLE

Moat: Regulator Accepted Evaluation Methodology

A decade of programme evaluations accepted by efficiency regulators gives the company an evidence position competitors cannot assemble quickly, since credibility here comes from accumulated verified results rather than from product capability. Utilities facing an evaluation they must pass treat that record as risk reduction, and it wins renewals with very little competitive process attached.
ORACLE

Risk: Heritage Sits In Conservation

The installed base was built on home energy reports, the slowest growing segment in the category and the one most exposed to regulators discounting behavioural persistence. Converting those relationships into flexibility scopes is possible but requires competing against specialists whose entire product was designed for event-based enrolment rather than for periodic comparison messaging.
UPLIGHT

Moat: Breadth Across Programme Types

Holding efficiency, rebate, marketplace, and flexibility capability in one platform lets a utility consolidate several vendor relationships, which matters because programme administration staffing is thin and each additional supplier carries real management cost. That breadth wins portfolio-level decisions that a single-function specialist cannot compete for at all.
UPLIGHT

Risk: Depth Versus Flexibility Specialists

Enrolment mechanics, event notification, and settlement-grade measurement are areas where dedicated flexibility vendors hold genuine advantage, and those capabilities are exactly what the fastest growing scopes require. Competing there demands investment that pulls development capacity away from the breadth argument the company currently wins on.

Players Tracked

Prominent Players

Oracle
Uplight
Bidgely
EnergyHub
Schneider Electric

Other Key Players

Itron
Landis+Gyr
Aclara
Enervee
WeSpire
OhmConnect
Voltus
GridPoint
Sense
Budderfly
Enel X
Octopus Energy
Tantalus Systems
Franklin Energy
CLEAResult

Recent Developments

MARCH 2026

Uplight Releases Flexibility Enrolment Module For Existing Programmes

Uplight released an enrolment and event gamification module designed to be added to utility behavioural programmes already running, reusing existing notification consent and household engagement lists rather than requiring separate customer acquisition or a new regulatory filing. Existing programme scopes can absorb it without a fresh approval.
Signal: Vendors are converting conservation relationships into flexibility ones because value per household differs by several times.
SEPTEMBER 2025

Bidgely Awarded Behavioural Programme Contract By Indian Distributor

Bidgely was selected by an Indian distribution utility to deliver behavioural engagement across households newly covered by the national smart meter programme, with scope tied explicitly to demand-side management obligations rather than to any voluntary sustainability commitment. Contract value per household sits well below comparable Western programmes.
Signal: Meter deployment schedules now predict platform demand better than population or electricity consumption figures ever did.
JUNE 2025

WeSpire Expands Tenant Engagement Offer For Building Standards

WeSpire extended its workplace engagement platform to address building performance standard reporting, targeting property owners who cannot reach tenant-controlled consumption through plant upgrades and who now carry disclosed accountability for measured building energy intensity. Reporting output is aligned to disclosed building energy intensity metrics rather than to utility savings claims.
Signal: Property owners represent a second commercial channel with shorter procurement and materially better willingness to pay.

What Running These Programmes Costs

Delivery cost splits three ways. Cloud infrastructure for ingesting and processing interval meter data runs 19% to 25% of cost of goods sold, utility integration and programme delivery staff take 28% to 35%, and incentive fulfilment, where the vendor carries rather than passes through the reward cost, adds a further 12% to 18%. Meter data arrives through utility systems, concentrating dependency on a few head-end providers.
Retail electricity price increases through 2024 and 2025, documented by the EIA in its electricity data, changed programme economics in an unexpected direction. Higher prices improved the value of each saved kilowatt-hour but also raised the incentive levels households expected before participating, and several vendors disclosed margin pressure on fulfilment cost in their annual reports for that period. Fixed-price programme contracts absorbed the difference entirely.

The competitive disadvantage mechanism runs through utility integration. A vendor requiring bespoke data integration per account carries setup cost that a vendor with pre-built head-end connectors does not, and cannot recover it inside a regulated cost per counted kilowatt-hour. Exposure varies by player type. Large platforms amortise connectors across many utilities. Single-market specialists rebuild integration each time, and those entering new meter deployment markets carry the heaviest burden.
energy-efficiency-gamification-market-cost-volatility-analysis-1790005583812

Pre-Built Connectors To Major Meter Head-End Systems

A small number of head-end platforms cover most metered households worldwide, so building and certifying connectors once removes the largest per-account setup cost in the business. Vendors with complete connector coverage report onboarding effort falling by roughly half, which matters most when entering markets completing meter deployment at national scale. Coverage compounds with each market entered.

Pass Incentive Fulfilment Cost To The Programme Sponsor

Carrying reward cost on the vendor balance sheet exposes margin to household expectations that move with electricity prices and general retail inflation. Structuring contracts so the sponsor funds fulfilment directly removes that exposure, and utilities generally accept it because the incentive is a programme cost they already recover through approved rates. Margin then tracks delivery rather than retail prices.

Standardise Evaluation Methodology Across Jurisdictions

Programme evaluation is expensive when it is designed for each regulator separately. A standardised measurement approach accepted across multiple jurisdictions spreads that cost across the portfolio and, more valuably, builds the accumulated evidence record that wins renewals without competitive process in regulated efficiency procurement. That record is what competitors cannot simply purchase or replicate quickly.

Portfolio Architecture for Margin Defence

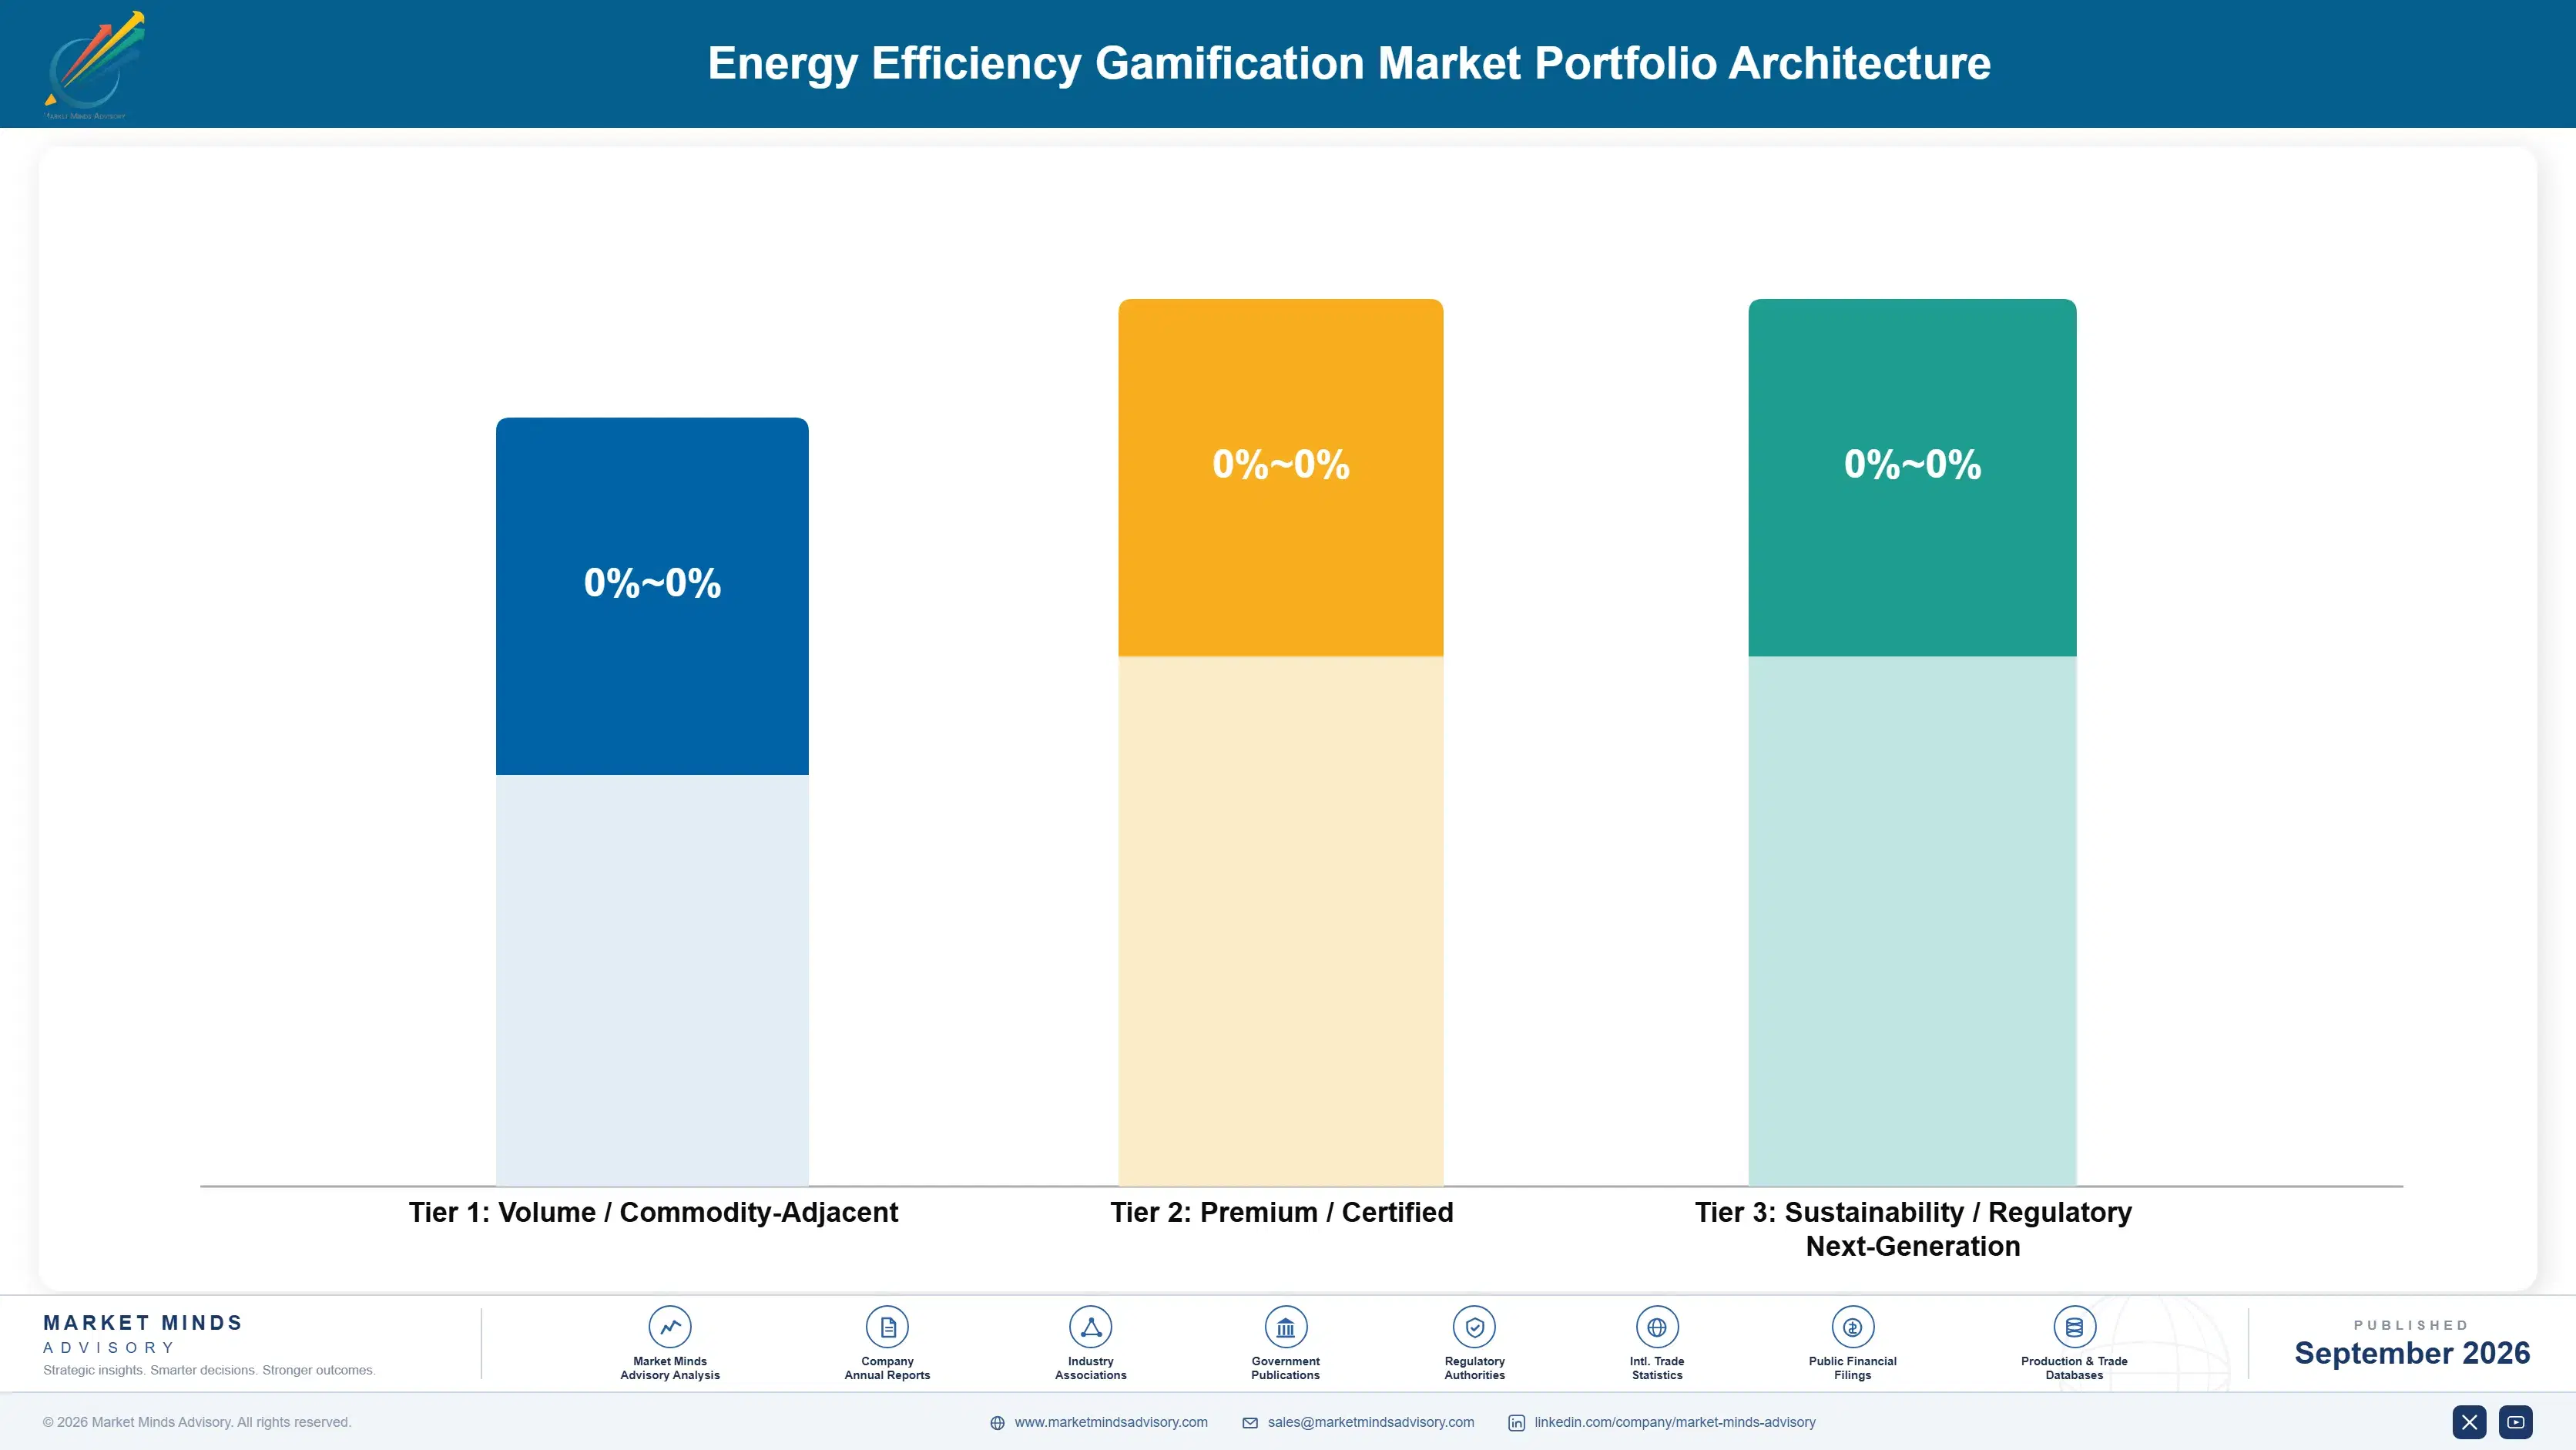
Margin follows how directly the outcome is paid for by a market rather than estimated by a regression. Home energy report delivery is close to commodity, priced against equipment rebates on cost per counted kilowatt-hour with several adequate suppliers. Flexibility enrolment and settlement earn considerably more. Evaluation and evidence work earns most of all, because regulatory acceptance rests on an accumulated record no competitor can buy.
The tension between volume and premium plays out through integration cost. High-volume, low-value deployments in markets with weak willingness to pay only work where head-end connectors already exist, and vendors entering with bespoke integration lose money on every household. Premium flexibility and tenant scopes carry far better economics but scale only with the number of accounts where a regulator or a building standard has created the obligation.

High-value pools concentrate where somebody pays a market price for the outcome: flexibility enrolment in capacity-constrained networks, tenant engagement under building performance standards, and Gulf peak cooling programmes with generous incentive budgets. What these share is that the buyer faces a priced consequence rather than an estimated benefit. Where the benefit is only estimated, procurement compares cost per counted kilowatt-hour and pays accordingly.

Volume / Commodity-Adjacent

Home energy report delivery, peer comparison messaging, and basic challenge mechanics. Priced against equipment rebates on cost per counted kilowatt-hour with several adequate suppliers available. The nine-point range reflects wide variation in whether integration connectors already exist.
Gross Margin: 48% to 57%

Premium / Certified

Flexibility enrolment, event notification, and settlement-grade measurement for capacity market participation. Outcomes carry a market price rather than an estimate, and measurement windows are hours. The eight-point range separates vendors with settlement capability from those delivering enrolment alone.
Gross Margin: 66% to 74%

Sustainability / Regulatory / Next-Generation

Programme evaluation, regulatory evidence, and building performance standard reporting. Credibility rests on an accumulated record of accepted evaluations rather than on product features. The nine-point range reflects how few vendors hold multi-jurisdiction acceptance across both utility and property channels.
Gross Margin: 73% to 82%
energy-efficiency-gamification-market-portfolio-architecture-1790005584313

High-value Sub-segments and Strategic Watch-out

Demand Flexibility Enrolment And Settlement

Highest value and fastest growth at 20.4%, because avoided capacity carries a market price that conservation generally does not. Enrolment at 9% of contacted households leaves obvious headroom. The ten-point range reflects the gap between settlement-grade vendors and those handling enrolment only. Settlement capability decides awards.
Gross Margin: 70% to 80%

Tenant Engagement Under Building Standards

High value with strong growth at 16.9%, sold to property owners with compliance exposure and no rate case dependency. Procurement runs in weeks rather than regulatory cycles, and willingness to pay per participant is several times the utility channel. Competitive field remains fragmented. Consolidation has already started.
Gross Margin: 68% to 76%

Utility Behavioural Programme Delivery

The volume core, funded by efficiency obligations across more than twenty jurisdictions and renewed at 81% on procedural inertia. Growth trails the market rate and evaluation frameworks are beginning to discount persistence. Competitive access depends on appearing inside an approved multi-year portfolio filing. Persistence discounting is the risk.
Gross Margin: 50% to 58%

Low Willingness Markets Without Connectors

The strategic watch-out. High household counts in newly metered markets look attractive until bespoke integration cost meets contract values a fraction of the global median. The fourteen-point range reflects the difference between entering with existing head-end connectors and rebuilding integration each time. Entry sequencing decides viability.
Gross Margin: 31% to 45%

How This Revenue Actually Repeats

Revenue recurs for a reason that should make vendors uncomfortable: savings decay, so the programme must keep running to keep counting. That produces an 81% renewal rate which looks like satisfaction and is closer to procedural necessity, reinforced by multi-year portfolio filings that make switching mid-cycle administratively awkward. Expansion comes through added scopes at filing renewal rather than through growth inside an existing programme.
Stickiness varies sharply by buyer type. Obligated utilities in efficiency resource standard jurisdictions renew almost automatically, since the counted savings are already built into a compliance plan. Competitive retail suppliers in Europe behave differently, judging platforms on churn reduction and switching when the numbers disappoint. Property owners under building standards are stickier than expected, because disclosed performance creates continuity pressure that a voluntary programme never had.

The buyer profile has shifted meaningfully. Utility customer experience teams drove early purchasing and bought on engagement quality and brand. Programme compliance managers and, increasingly, flexibility trading desks now lead evaluations, and they ask about evaluation acceptance, settlement accuracy, and enrolment conversion. Vendors still presenting customer satisfaction scores as the primary evidence are losing scopes to those presenting verified megawatts.
energy-efficiency-gamification-market-end-use-penetration-index-1790005584804

Where This Market Rewards

These are among the four positions where our research anticipates prominent divergence between winners and laggards over the coming forecast period. Each is grounded in the demand model, the regulatory perimeter, and the announced capacity pipeline.
01 / FLEXIBILITY VALUE CAPTURE

Shifting a kilowatt-hour beats saving one commercially

Avoided capacity carries a market price and conservation outside an obligation jurisdiction generally carries none, which makes an enrolled flexibility household worth roughly six times more per year than one receiving efficiency messaging. Demand flexibility enrolment grows at 20.4%, half again the market rate of 13.6%, faster than anything else in the category. Vendors converting existing behavioural contracts into enrolment channels report contract values rising 55% to 80% at renewal without competing again for the account at all or defending it again.
02 / PERSISTENCE EVIDENCE EXPOSURE

The savings argument is running out of road

Measured behavioural savings of about 2.1% decay within roughly seven months of contact ending, and several evaluation frameworks have already begun discounting them on that basis rather than accepting claimed persistence. Any vendor whose revenue rests entirely on counted conservation carries a regulatory risk that no product improvement addresses. The defensible responses are equipment and tariff actions that persist without contact, and flexibility events measured across hours rather than years, and both are measurable in ways regulators already accept without further argument.
03 / PORTFOLIO CYCLE ACCESS

Missing a filing cycle costs three to five years

Utility efficiency portfolios are approved in regulatory filings covering three to five years, so product merit is irrelevant to a vendor who arrives after the filing has closed and must simply wait. Subcontracting through programme implementers already inside approved portfolios collapses that wait into a single quarter, and vendors using the route enter roughly 40% of new utility accounts without any competitive procurement. Shared margin is a small price for the timing, particularly for a vendor with no incumbent position to protect.
04 / PROPERTY CHANNEL DEVELOPMENT

Building standards created a buyer utilities cannot reach

Building performance standards attach disclosed consequences to measured energy intensity, and landlords cannot reach tenant-controlled consumption through plant upgrades alone, which creates a compliance buyer with a facilities budget. Procurement takes weeks rather than a multi-year regulatory cycle, and willingness to pay per participant runs several times the utility channel. Vendors with a credible tenant offer close about 2.7 times as many contracts annually as those confined to utilities, and the field remains fragmented enough to enter at reasonable cost.

Engagement Snapshot From the Field

A live engagement with an industry participant carrying material or product regulatory and market exposure ahead of a defining policy shift, showing how our research translates into a defensible multi-year portfolio strategy.
MARKET MINDS ADVISORY · CLIENT ENGAGEMENT SUMMARY
Energy Efficiency Gamification Producer Strategic Portfolio Review and Transition Roadmap 2026·Investment Scenario on Energy Efficiency Gamification Exposure Evaluation 2025-26
CLIENT PROFILE
An investor-owned electric utility serving 2.4 million residential customers across two states, operating under an efficiency resource standard in one and without any obligation in the other. Annual demand-side programme spend was approximately USD 78 million (client-reported, unverified by MMA). Behavioural programmes had run continuously for nine years and were approaching a new multi-year regulatory filing.
STRATEGIC CHALLENGE
The state evaluator had signalled it would discount behavioural savings on persistence grounds in the coming cycle, which would remove a substantial block of counted savings from the compliance plan. Simultaneously the utility faced summer capacity constraints in two distribution areas. Programme staff had no basis for deciding whether to defend behavioural spend or redirect it.
MMA APPROACH
MMA modelled counted savings under three plausible evaluator persistence assumptions, valued flexibility enrolment against avoided capacity in the two constrained distribution areas, and compared cost per outcome across both. Vendor capability was assessed on settlement-grade measurement and enrolment conversion rather than on engagement features, with reference interviews testing claimed conversion rates against delivered results.
KEY FINDINGS
  1. Under the evaluator's likely persistence assumption, counted behavioural savings would fall by 44%, removing roughly a fifth of the compliance plan and requiring replacement from somewhere.
  2. Flexibility enrolment in the two constrained distribution areas delivered avoided capacity value per household at about six times the counted conservation value of the same household.
  3. Only three of eight candidate vendors could deliver settlement-grade event measurement rather than enrolment alone, and two of those were not incumbent in either state.
  4. Adding flexibility scope to the existing behavioural vendor's contract avoided a competitive procurement and would have reached households roughly eleven months sooner than a new award.
CLIENT PROFILE
An investor-owned electric utility serving 2.4 million residential customers across two states, operating under an efficiency resource standard in one and without any obligation in the other. Annual demand-side programme spend was approximately USD 78 million (client-reported, unverified by MMA). Behavioural programmes had run continuously for nine years and were approaching a new multi-year regulatory filing.
STRATEGIC CHALLENGE
The state evaluator had signalled it would discount behavioural savings on persistence grounds in the coming cycle, which would remove a substantial block of counted savings from the compliance plan. Simultaneously the utility faced summer capacity constraints in two distribution areas. Programme staff had no basis for deciding whether to defend behavioural spend or redirect it.
MMA APPROACH
MMA modelled counted savings under three plausible evaluator persistence assumptions, valued flexibility enrolment against avoided capacity in the two constrained distribution areas, and compared cost per outcome across both. Vendor capability was assessed on settlement-grade measurement and enrolment conversion rather than on engagement features, with reference interviews testing claimed conversion rates against delivered results.
KEY FINDINGS
  1. Under the evaluator's likely persistence assumption, counted behavioural savings would fall by 44%, removing roughly a fifth of the compliance plan and requiring replacement from somewhere.
  2. Flexibility enrolment in the two constrained distribution areas delivered avoided capacity value per household at about six times the counted conservation value of the same household.
  3. Only three of eight candidate vendors could deliver settlement-grade event measurement rather than enrolment alone, and two of those were not incumbent in either state.
  4. Adding flexibility scope to the existing behavioural vendor's contract avoided a competitive procurement and would have reached households roughly eleven months sooner than a new award.
RECOMMENDED STRATEGY
Phase 1: Phase one: add flexibility enrolment scope to the incumbent behavioural contract, targeting the two capacity-constrained distribution areas ahead of the coming summer season. Phase 2: Phase two: file the new portfolio with behavioural savings claimed at the discounted persistence assumption, replacing the shortfall with verified flexibility and equipment measures. Phase 3: Phase three: procure settlement-grade measurement competitively at the following cycle, once enrolment volume justifies separating measurement from the engagement platform itself.
OUTCOME
Flexibility enrolment reached 12% of contacted households in the constrained areas against a 9% category benchmark, and the utility avoided a capacity upgrade in one of the two areas entirely. The filed portfolio was approved without contest despite the discounted behavioural assumption. Programme cost per verified outcome fell by 23% (client-reported, unverified by MMA).

Frequently Asked Questions

Foundational context covering the market sizes, CAGR, scope, country, region and competition that inform every finding below. This section is provided to cover basics and most often pre-purchase conversations, answered from the MMA Primary Research Dataset.

What is the current size of the Energy Efficiency Gamification Market?

The market was worth USD 0.6 billion in 2025 and reaches USD 0.7 billion in 2026. Value is measured on contracted platform spend across utility and property buyers.

How large will the Energy Efficiency Gamification Market be by 2036?

MMA forecasts USD 2.5 billion by 2036, an increase of USD 1.8 billion across the forecast period. That represents 3.57 times the 2026 base of USD 0.7 billion.

What is the CAGR for the Energy Efficiency Gamification Market 2026 to 2036?

The base case compound annual growth rate is 13.6%, with a bull case at 14.9% and a bear case at 12.3%. Historical growth from 2020 to 2025 ran at 12.4%.

Which segment is growing fastest?

Demand flexibility enrolment and event gamification grows at 20.4%, half again the market rate of 13.6%. Avoided capacity carries a market price that conservation generally does not.

Who are the major companies in the Energy Efficiency Gamification Market?

Oracle, Uplight, Bidgely, EnergyHub, and Schneider Electric lead, holding 44% of contracted platform spend between them. Flexibility specialists with no efficiency heritage are the most active challengers.

Which country is growing fastest?

India grows at 18.9%, driven by a national smart meter programme targeting roughly 250 million meters. Contract values there sit far below the global median.

Report Segmentation Architecture

The full report scope spans multiple orthogonal segmentation dimensions, with cross-tabulated demand data provided for each dimension pair. Coverage extends further to regional breakdowns, trend trajectories, and the competitive detail needed to support segment-level decision-making.

By Platform Function

  • Home Energy Reports and Peer Comparison
  • Challenge and Competition Platforms
  • Reward and Incentive Redemption Engines
  • Demand Flexibility Enrolment and Event Gamification
  • Workplace and Tenant Engagement Modules
  • Measurement and Programme Evaluation

By End-Use Industry

  • Regulated Electric Utilities
  • Competitive Retail Energy Suppliers
  • Gas and Multi-Fuel Utilities
  • Commercial Property Owners and Landlords
  • Municipal and Cooperative Utilities
  • Corporate Workplace Sustainability Programmes

By Commercial Dimension

  • Direct Utility Contract
  • Programme Implementer Subcontract
  • Regulated Portfolio Funded
  • Flexibility Market Revenue Shared
  • Property Owner Subscription
  • Development Institution Funded Pilot

By Region

  • North America
  • Western Europe
  • East Asia
  • South Asia and Pacific
  • Latin America
  • Middle East and Africa
  • Eastern Europe

Scope, Methodology, and Coverage

Every figure in this report is reproducible from documented input assumptions. The scope below maps the historical period, the forecast horizon, the segmentation dimensions, and the countries covered, alongside the underlying primary and qualitative methodology.
Historical Period
2020 to 2025
Forecast Period
2026 to 2036
Base Year
2025 (USD billions; MMA Primary Research Dataset, September 2026)
Market Definition
The energy efficiency gamification market covers software platforms applying game mechanics, social comparison, and reward structures to residential and commercial energy behaviour, including home energy reports and peer comparison, challenge platforms, reward and incentive redemption, demand flexibility enrolment and event gamification, workplace and tenant engagement, and programme measurement and evaluation. It excludes metering hardware, in-home display devices, building management systems, and distributed energy resource control platforms.
Quantitative Units
USD billions, contracted platform value
Segmentation Dimensions
Platform function, end-use industry, commercial dimension, region
Regions Covered
North America, Western Europe, East Asia, South Asia and Pacific, Latin America, Middle East and Africa, Eastern Europe
Countries Covered
United States, Canada, United Kingdom, Germany, France, Netherlands, Spain, Sweden, Denmark, Japan, South Korea, China, India, Australia, New Zealand, Brazil, Chile, Colombia, Mexico, Saudi Arabia, United Arab Emirates, South Africa, Poland, Romania
Key Companies Profiled
Oracle, Uplight, Bidgely, EnergyHub, Schneider Electric, Itron, Landis+Gyr, Aclara, Enervee, WeSpire, OhmConnect, Voltus, GridPoint, Sense, Budderfly, Enel X, Octopus Energy, Tantalus Systems, Franklin Energy, CLEAResult
Quantitative Methodology
Primary survey, n=3,800 respondents, Q4 2025, six countries; demand-side model with trade association cross-validation
Qualitative Methodology
47 expert interviews, Q4 2025; applied to validate demand model assumptions, identify emerging dynamics, and assess competitive positioning
Report Format
PDF and XLSX data workbook (Word format preview document)
Publisher
Market Minds Advisory
Report Code
MMA-2026-ENE-371
Published
September 2026
Contact
sales@marketmindsadvisory.com | www.marketmindsadvisory.com

Purchase the full Energy Efficiency Gamification Market Report (2026 to 2036).

The full report sizes the energy efficiency gamification market across six platform functions, seven regions, and twenty-four countries, with forecasts to 2036 under base, bull, and bear cases. It examines why behavioural savings decay within roughly seven months, how regulators are responding, and what the pivot toward flexibility means for vendor economics. Competitive analysis covers twenty participants evaluated consistently on contracted platform spend, with detailed treatment of regulatory portfolio access and the property owner channel. Cost structure, margin architecture by function, and regional regulatory and meter deployment drivers are analysed in full. Primary research includes 3,800 survey responses and 47 expert interviews.
Six platform functions sized and forecast separately
Twenty participants evaluated on contracted platform spend
Regional regulatory and meter deployment drivers assessed
Margin architecture by platform function and channel
Savings persistence evidence and evaluation framework analysis
Flexibility enrolment conversion benchmarks by programme type

Built For The People Who Decide

From boardroom strategy to bench-side execution, this report is read cover-to-cover by leaders shaping the next decade of their industry, turning demand scenarios, market dynamics and valuation benchmarks into decisions.
CXOs/ Presidents/ VPs/ Managers
M&A and Corporate Development
Strategy Teams and R&D Heads
Procurement and Product Directors
Regulatory and Compliance Leaders
Investor Relations and Equity Analysts