Market Minds Advisory
Emotion Detection and Recognition Market

Emotion Detection and Recognition Market: Emotion Detection and Recognition Market: Affective Sensing, Outcome Validation and Regulatory Contraction, 2026 to 2036

European rules removed workplace and education deployment outright in 2025, and the science behind facial inference has been contested for years. The category kept growing anyway, by measuring something else.

Lead Analyst

Published

September 2026

Make Smarter Decisions with Customized Research Insights

Request a free sample report and evaluate market opportunities, growth trends, and competitive dynamics relevant to your business needs.

2025 MARKET VALUE$1.6BMarket Size 2025
2036 FORECAST VALUE$6.3BBase Case , 2026 to 2036
CAGR 2026 TO 203613.4 %Bull 14.6% / Bear 12.2%
INCREMENTAL OPPORTUNITY$4.5BNet 10- year value creation
EXPANSION MULTIPLE3.50x2036 value over 2026 base
Strategic Levers
M&A Pipeline
Regional Outlook
Country Rankings
Competitive Intelligence
Segmental Deep-dive
Call-Us : 91 93563 13602

Executive Snapshot and Market Trajectory.

The category stopped selling emotion and started selling measurable proxies, which is why it survived. Buyers no longer ask whether a model detects sadness. They ask whether it predicts the call that escalates, the driver who stops watching the road, or the shopper who leaves.
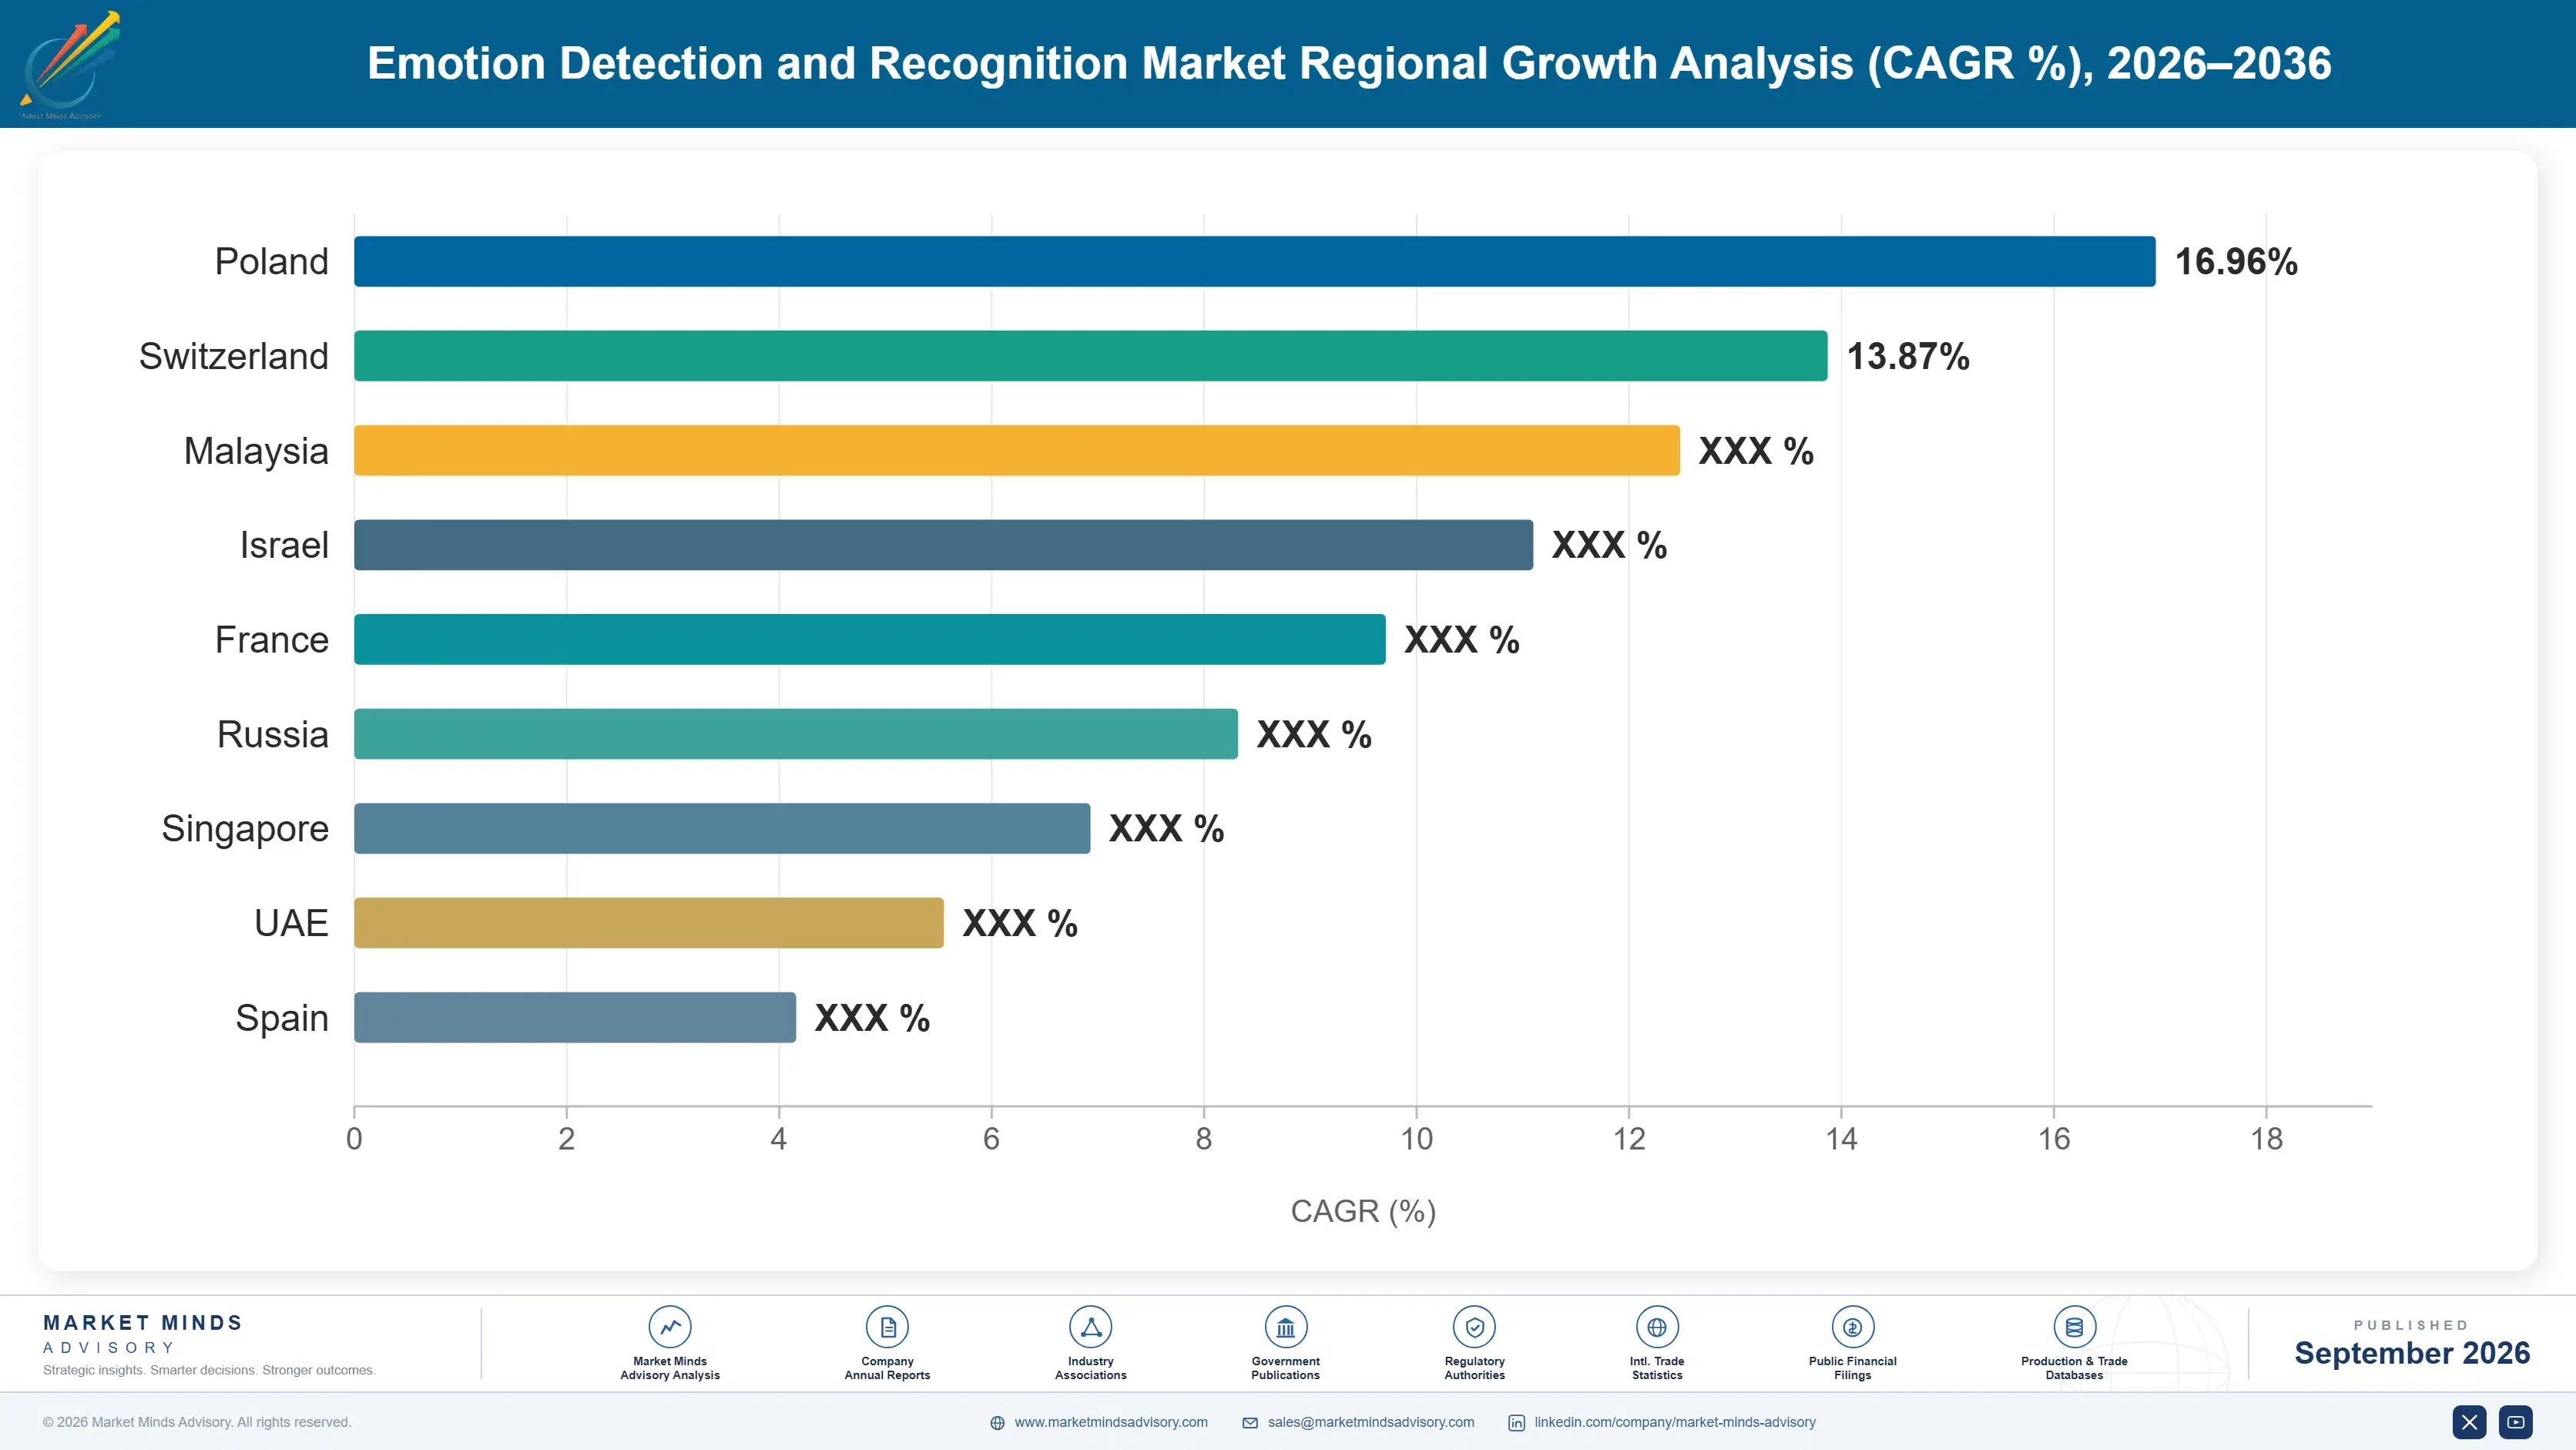
Physiological sensing grows at 20.1%, half again the market rate of 13.4%, because measuring a signal avoids the inference problem that has troubled facial classification for a decade. East Asia holds 32% of software revenue, above the usual band, since European rules removed two entire application areas while East Asian deployment continued without equivalent restriction. India grows fastest of the countries covered at 18.6%. Automotive supplies 38% of category revenue.
Concentration is low at 34%, and automotive now supplies 38% of revenue after driver monitoring requirements made in-cabin sensing a compliance item rather than a feature. Around 41% of deployments are validated against business outcomes rather than emotion labels, and that proportion is the clearest indicator of which vendors will still be selling in five years. The rest are still presenting benchmark classification numbers to procurement teams who know what those numbers do not establish.
Market Definition
This market covers software and integrated systems that infer affective or behavioural state from human signals, including facial expression analysis, voice and speech prosody analysis, text and conversational sentiment, physiological signal sensing, multimodal fusion systems, and body posture and movement analysis. It excludes general computer vision and speech recognition, biometric identity verification, medical diagnostic devices with regulatory clearance, general customer feedback survey platforms, and the camera, microphone, and radar hardware these systems run on.
Base Year Value
$1.6B in 2025 (MMA Primary Research Dataset, September 2026)
Forecast Period
2026 to 2036, eleven discrete annual values
CAGR
13.4% base case. Bull 14.6%. Bear 12.2%.
Fastest Growth Segment
Physiological Signal Sensing: 20.1% CAGR
Fastest Growth Country
India: 18.6% CAGR
Fastest Growth Region
South Asia and Pacific: 15.6% CAGR
Largest Region
East Asia: 32% of 2025 global value
Market Leaders
Smart Eye, Seeing Machines, Uniphore, Xperi, and Tobii lead the field. Source: MMA Primary Research Dataset, July 2026.
Primary Survey
n=3,800 procurement and R&D decision-makers, Q4 2025, six countries
Methodology
Demand-side build-up, cross-validated against public data, 47 expert interviews

Emotion Detection and Recognition Market Forecast Scenarios

emotion-detection-and-recognition-market-size-forecast-scenario-1790010149655
The 2020 to 2025 period reshaped the category twice. Peer-reviewed work challenging the claim that discrete emotions read reliably from facial expression removed the scientific foundation many vendors had marketed against, and buyers noticed. Then vehicle safety requirements made in-cabin monitoring a compliance item. Historical growth of 12.0% conceals a genuine collapse in some applications alongside rapid expansion in others, which averages out misleadingly.
The base case at 13.4% rests on three mechanisms. Vehicle driver and occupant monitoring requirements oblige in-cabin sensing across major production regions, which is why automotive already supplies 38% of revenue. Contact centre deployment continues where models are validated against escalation and resolution outcomes rather than against emotion labels. And physiological sensing grows fastest because it measures rather than infers, which is a considerably easier claim to defend under scrutiny.
The bull case at 14.6% depends on occupant monitoring requirements extending beyond the driver to child presence and cabin state, which would enlarge per-vehicle content materially. The bear case at 12.2% is regulatory contagion: European prohibition of workplace and education use removed roughly 19% of prior revenue in affected applications, and comparable rules adopted in two or three further large markets would do it again.

Selling Proxies, Not Feelings

The scientific position is uncomfortable and the commercial position is fine, which is an unusual combination. Peer-reviewed work has challenged for years the assumption that discrete emotional states read reliably from facial expression across cultures and contexts. Vendors who built their marketing on that assumption have had a difficult decade. Vendors who quietly rebuilt around observable state and outcome prediction have done well. The difference between the two groups is what they claim, not what they build.
TOP FIVE CONCENTRATION34%Share of software revenue held by the leading vendors
OUTCOME VALIDATED DEPLOYMENTS41%Deployments validated against business outcomes rather than emotion labels
AUTOMOTIVE SHARE OF REVENUE38%Revenue arising from in-cabin driver and occupant monitoring
CROSS-POPULATION ACCURACY DROP22 pointsAccuracy lost when models meet populations outside training data
AVERAGE CONTRACT VALUEUSD 84,000Annual contract value averaged across enterprise software deployments
PROHIBITED USE EXPOSURE19%Prior revenue from applications now barred across European markets
Automotive is the reason the numbers look healthy. Driver monitoring requirements turned in-cabin sensing into a compliance item rather than a differentiating feature, and automotive now supplies 38% of revenue. What those systems actually measure is gaze direction, eyelid closure, and head pose. None of that requires anybody to name an emotion, which is precisely why the claims survive engineering review.
Regulation cuts the other way in Europe. Rules prohibiting emotion recognition in workplaces and educational institutions took effect in 2025 and removed roughly 19% of prior revenue in the affected applications outright. Vendors did not adapt those products; they withdrew them. Western Europe consequently holds 17% of revenue, below where the region's economic weight would otherwise place it.
"The vendors still describing seven universal emotions on a slide are the ones we expect to disappear. The buyers moved years ago. A contact centre director does not care whether the caller is angry in any scientific sense; they care whether this call is heading for an escalation, and that is a question you can actually validate."
Practice Director, Applied Artificial Intelligence and Sensing · MMA Technology Practice · September 2026

Market Trends

Validation Moves From Emotion Labels To Outcomes

Claiming a model identifies an emotional state invites a scientific argument the vendor generally loses. Claiming it predicts call escalation, driver inattention, or basket abandonment invites a measurement the vendor can win, because the outcome is observable and the customer already records it. Around 41% of deployments are now validated that way, and the proportion rises every year. It also changes procurement entirely, since the buyer evaluates a business metric rather than adjudicating a contested psychological claim they are not equipped to assess. Vendors who resisted the shift are the ones now losing renewals.
Market Impact: Automotive supplies 38% of revenue

Physiological Sensing Sidesteps The Inference Problem

Heart rate variability, skin conductance, and respiration derived from radar or contact sensors are measurements rather than interpretations, and that distinction matters enormously once a claim is scrutinised. Physiological sensing grows at 20.1%, the fastest of any modality here. In-cabin radar has made it practical without contact, which removed the adoption barrier that confined it to laboratories. Vendors combining physiological signals with behavioural observation report accuracy that holds across populations where facial models lose about 22 points. Seat-integrated and wearable sensing add a second route, though contactless capture is where the volume sits. Automotive drives most of it.
Market Impact: Country grows at 18.6%

Market Opportunities and Growth Drivers

Vehicle Monitoring Requirements Make Sensing A Compliance Item

Driver attention and drowsiness warning requirements across major vehicle production regions turned in-cabin sensing from an optional feature into something a model cannot be certified without, and compliance demand does not negotiate on price the way feature demand does. Automotive now supplies 38% of category revenue. What the systems measure is gaze, eyelid closure, and head pose rather than any named emotion, which is why the claims survive engineering review comfortably. Volume is visible years ahead of delivery, which no enterprise software relationship offers, and qualification takes long enough that the position holds once won.
Market Impact: Removed 19% of prior revenue

Contact Centre Scale Rewards Outcome Prediction Directly

A contact centre operator running thousands of concurrent conversations can measure whether a model predicted escalation, and can price the software against calls deflected rather than against any claim about caller feeling. Indian growth of 18.6% leads every country covered, driven by the largest contact centre workforce anywhere applying voice analysis at scale. Average contract values around USD 84,000 reflect deployment breadth rather than seat count, since these operators buy across whole sites at once. Procurement here evaluates a measured business result rather than adjudicating a contested psychological claim it has no way to assess.
Market Impact: Accuracy falls 22 points

Market Restraints and Challenges

European Rules Removed Two Application Areas Outright

Emotion recognition in workplaces and educational institutions is prohibited across European markets, and the root cause is a legislative judgement that inference about mental state in relationships with a power imbalance is unacceptable regardless of accuracy. Commercially this removed roughly 19% of prior revenue in affected applications, and vendors withdrew rather than adapting. Participants respond by concentrating on automotive and consented consumer research, by separating product lines geographically, and by moving claims toward observable behaviour instead. Western Europe now holds 17% of revenue, well below where economic weight alone would place it.
Market Impact: Covers 41% of deployments

Models Degrade Sharply Outside Their Training Populations

Facial and vocal models lose around 22 accuracy points when applied to populations unlike their training data, and the root cause is that expression and prosody conventions vary by culture, age, and context far more than early datasets assumed. Commercially this produces deployments that pass a pilot and fail at rollout, which damages the vendor severely. Participants respond with regionally collected datasets, physiological signals that vary less across populations, and honest reporting of where a model was validated. A public rollout failure closes that market to the vendor for years afterwards, which is a heavier penalty than the lost contract.
Market Impact: Segment grows at 20.1%
3 additional market trends, 4 additional growth drivers, and 2 additional restraints and challenges are covered in the full report. Contact sales@marketmindsadvisory.com to access the complete intelligence.

Segment CAGR and Growth Architecture

Segmentation follows sensing modality. Six categories cover the market: facial expression analysis, voice and speech prosody analysis, text and conversational sentiment, physiological signal sensing, multimodal fusion systems, and body posture and movement analysis. Model development, validation, and deployment services are counted within the modality they support rather than separately. Consent administration is counted within the modality it serves.
emotion-detection-and-recognition-market-market-share-analysis-1790010150255

Physiological Signal Sensing

Physiological sensing grows at 20.1%, half again the market rate of 13.4%, because it measures rather than infers and that distinction survives scrutiny in a way facial classification does not. Heart rate variability, skin conductance, and respiration are physical quantities with established measurement methods behind them. In-cabin radar made contactless capture practical and removed the barrier that had confined the approach to laboratories with electrodes. Accuracy holds across populations where facial models lose about 22 points, which matters enormously for any vendor deploying beyond the region their training data came from. Seat-integrated and wearable capture add a second route, though contactless radar carries most of the volume. Automotive programmes drive most demand.
CAGR 20.1%

Multimodal Fusion Systems

Fusion systems grow at 17.4% by combining signals that fail independently but rarely fail together, which is the practical answer to a decade of single-modality disappointment. A model reading voice prosody, gaze, and physiological signal at once tolerates the loss of any one of them and produces confidence estimates a buyer can act on. Automotive occupant monitoring drives most of the volume, since vehicles already carry the cameras and radar these systems require. Integration effort is considerable, which favours vendors with automotive engineering depth over pure software participants. Confidence estimates rather than categorical outputs are what buyers increasingly ask for, and fusion is the only approach that produces them credibly.
CAGR 17.4%
Full segment breakdown across 6 segments available in the complete report.

Regional Architecture and Country Demand Map

Regional shares here reflect where deployment is permitted as much as where it is wanted, which is unusual. Three regions sit outside the standard bands for reasons named in their paragraphs below, and regulation rather than economic weight explains all three. Deployment permission decides more than demand does.

East Asia

At 32% this region sits above the standard band, and the justification is regulatory rather than commercial: no equivalent prohibition on workplace or education deployment exists, so applications withdrawn from Europe continue here. Chinese, Japanese, and Korean vehicle production is the largest anywhere and in-cabin monitoring is fitted accordingly. Retail and contact centre deployment runs at scale without the consent frictions found elsewhere. Growth of 14.4% exceeds the world rate. Domestic vendors hold most of the commercial volume, with imported systems concentrated in vehicle programmes. Contact centre and retail operators here validate against operational outcomes much as elsewhere, but they adopted the technology earlier and with considerably lighter consent administration attached to it.
Share: 32% | CAGR: 14.4% (2026 to 2036)

North America

Automotive programmes and contact centre deployment account for most revenue, with vehicle monitoring content growing fastest as manufacturers standardise interior sensing across model ranges. Biometric privacy statutes in several states impose consent and record-keeping requirements that raise deployment cost without prohibiting the application outright. Growth of 12.6% is close to the world rate. Enterprise buyers here moved earliest toward outcome validation, and vendors still presenting emotion classification claims lose procurement processes to those presenting measured business results. Automotive qualification cycles run long enough that current programme awards determine content well into the next decade, which makes the region's revenue considerably more predictable than its enterprise half suggests. Enterprise renewals are re-argued annually against measured results.
Share: 24% | CAGR: 12.6% (2026 to 2036)
Regional intelligence for 5 additional markets available in the complete report: Western Europe, South Asia and Pacific, Latin America, Middle East and Africa, Eastern Europe. Contact sales@marketmindsadvisory.com.
emotion-detection-and-recognition-market-country-cagr-analysis-1790010150786

Where Vendors Build Defensible Positions

Four commercial moves separate vendors with durable positions from those defending claims that procurement has learned to test. Each accepts that the buyer will validate against something measurable, and that a contested psychological assertion is a liability rather than a differentiator in any serious evaluation. Procurement has become considerably better at testing claims than it was five years ago.

Validate Against Business Outcomes The Customer Records

A claim about emotional state invites an argument the vendor loses; a claim about escalation, inattention, or abandonment invites a measurement against data the customer already holds. Vendors validating this way win 3.4 times more enterprise evaluations than those presenting classification accuracy, and they retain accounts through renewal at far higher rates because the value is visible in numbers the customer owns. Around 41% of deployments now work this way, and procurement increasingly requires it. The vendor gives up a marketing claim and gains an argument it can win repeatedly. That trade is heavily favourable.
Market Impact: Wins 3.4 times more evaluations at enterprise buyers

Separate Product Lines By Regulatory Territory

European rules removed workplace and education applications outright, taking roughly 19% of prior revenue in those areas, while no equivalent prohibition applies across East Asia. Vendors maintaining one global product forced compliance constraints onto markets that did not require them and lost ground to local competitors. Those running separated lines by territory preserved deployment in permitted markets while withdrawing cleanly where required. It costs engineering effort and it is considerably cheaper than the alternative. Maintaining two lines is a known engineering cost with a known benefit, which is rare in a regulatory response.
Market Impact: Protects 19% of the revenue exposed to prohibition

Collect Regional Datasets Before Deploying There

Models lose about 22 accuracy points against populations unlike their training data, and the failure appears at rollout rather than during a pilot, which is the worst possible moment for it. Vendors collecting regional data before entering a market report deployment success rates 2.7 times those of vendors extending an existing model. The cost is substantial and the alternative is a public failure that closes the market to that vendor for years afterwards. Collection has to begin before the first sales conversation rather than after a contract is signed, which most vendors discover too late.
Market Impact: Raises deployment success 2.7 times at full rollout

Follow Vehicle Programmes Into Occupant Sensing

Driver monitoring is already required and automotive supplies 38% of revenue, but the sensors fitted for it can address child presence detection, seat occupancy, and cabin state with modest additional engineering. Vendors extending into those functions raise per-vehicle content by 40 to 65% on programmes already won. Automotive qualification takes years, so the position holds once established, and it is the only part of this market where a vendor can count on volume years in advance. No enterprise software relationship offers anything comparable to that visibility. Content decisions made now determine revenue through the next decade.
Market Impact: Raises per-vehicle sensing content by 40 to 65%

Who Controls the Margin Pool

Concentration is low. Five vendors hold 34% of software revenue, measured consistently on that basis across all participants, and the field divides sharply between automotive-qualified suppliers and enterprise software vendors who rarely compete with one another directly. Below them sit many small specialists, several of which are research spin-outs still selling on classification claims that larger buyers no longer accept.
Competition currently turns on three things: automotive qualification and programme track record, evidence that a model was validated against outcomes the customer measures, and regional dataset coverage that prevents the rollout failure a pilot never reveals. Classification accuracy on public benchmarks decides almost nothing in serious enterprise procurement now. Price matters least in automotive, where a programme award covers years of volume, and matters most in consumer research, where general purpose providers set expectations at no incremental charge.

Pressure comes from two directions. General purpose speech and vision model providers absorb capability that specialists once sold separately. Meanwhile regulation keeps narrowing where the technology may be applied at all. Rankings will shift toward vendors anchored in automotive programmes and outcome-validated enterprise deployment, since both are defensible against those pressures. Classification specialists hold the weakest position of anyone here.
emotion-detection-and-recognition-market-company-positioning-matrix-1790010151315

Competitive Moat and Risk Dimensions

SMART EYE

Moat: Automotive Programme Qualification Depth

Qualified positions on vehicle programmes take years to establish and lock in volume across a model's production life, which no enterprise software relationship offers. The company's interior sensing work spans multiple manufacturers, and the engineering evidence accumulated across those programmes is what subsequent awards are decided on rather than any demonstration.
SMART EYE

Risk: Automotive Cycle Concentration Exposure

Revenue tied closely to vehicle programme volumes rises and falls with production decisions the company does not influence, and a delayed or cancelled programme removes years of expected content at once. Diversifying into enterprise applications means competing against software vendors with faster sales cycles and no qualification overhead to carry.
UNIPHORE

Moat: Outcome Validated Contact Deployment

Deployments measured against escalation, resolution, and handling time give the company evidence in the customer's own numbers, which survives procurement scrutiny that classification claims do not. Contact centre operators renew on demonstrated results rather than on capability descriptions, and accumulated deployment evidence compounds into a reference base competitors cannot assert.
UNIPHORE

Risk: General Model Provider Encroachment

Large language and speech model providers now supply conversational analysis capability as a general service, absorbing functions specialists previously sold separately and at considerably lower marginal cost. Defending the position requires demonstrating outcome improvement beyond what a general model achieves, which becomes harder as those models improve each year.

Players Tracked

Prominent Players

Smart Eye
Seeing Machines
Uniphore
Xperi
Tobii

Other Key Players

Cipia
Cogito
Realeyes
Behavioral Signals
audEERING
NVISO
iMotions
Noldus
Entropik
Symanto
Receptiviti
Eyeris
Emotibot
Valeo
OmniVision

Recent Developments

FEBRUARY 2026

Smart Eye Wins Interior Sensing Award Across Vehicle Manufacturer Platform

Smart Eye received an award decision covering interior sensing across a vehicle manufacturer's platform, extending beyond driver attention into occupant detection and cabin state using sensors already fitted for the monitoring requirement. No additional hardware was specified, which is what made the extension commercially straightforward for the manufacturer to approve.
Signal: Occupant functions are being added to sensors already justified by driver monitoring, which raises content without new hardware.
AUGUST 2025

Uniphore Acquires Conversational Analytics Developer For Outcome Modelling

Uniphore completed an acquisition of a conversational analytics developer, adding models validated against escalation and resolution outcomes rather than emotional classification, alongside deployment references across large contact centre operations in several markets. The acquired reference base had taken several years to accumulate and could not realistically have been built internally.
Signal: Outcome validation capability is being bought because building the reference base takes years vendors do not have.
MARCH 2025

NVISO Refocuses European Offering Toward Automotive After Prohibition

NVISO withdrew workplace and education products across European markets following the prohibition that took effect, redirecting engineering toward automotive interior sensing rather than attempting to adapt the affected applications for compliance. The company said the rules permitted no compliant version of the affected products in any form.
Signal: Vendors abandoned prohibited applications rather than adapting them, which tells you the rules permitted no workaround.

What This Software Costs To Build

Three input groups dominate cost. Model development and validation engineering run 34% to 42% of cost of revenue, concentrated in Europe, North America, and increasingly India. Dataset collection, annotation, and consent administration take 18% to 26%, and that range widened as consent-based collection replaced scraped material. Inference compute adds 16% to 24%, split between vehicle-embedded processors and cloud capacity depending on the deployment.
Accelerator availability and pricing tightened through 2024 and into 2025 as demand across the wider field absorbed supply, and several vendors described the effect on model development cost in their annual reports for those years. SEMI equipment data showed capacity additions arriving later than the shortage required. Vendors training regional model variants felt it most, since each additional population requires its own development cycle rather than a shared one.

The competitive disadvantage mechanism runs through dataset rights rather than through engineering capability. A vendor without consented regional data cannot enter a market safely, faces the 22-point accuracy loss on rollout, and cannot buy its way out quickly because collection with proper consent takes quarters rather than weeks. Exposure varies by vendor type, and enterprise software vendors must fund collection alone.
emotion-detection-and-recognition-market-cost-volatility-analysis-1790010151509

Collect Consented Regional Data Ahead Of Market Entry

Models lose roughly 22 accuracy points against unfamiliar populations, and the failure surfaces at rollout rather than in a pilot, which is when it does maximum commercial damage. Collection with proper consent takes quarters, so it has to begin well before the first sales conversation in a territory rather than after a contract has been signed.

Share Development Across Modalities Rather Than Duplicating It

Regional variants multiply development cycles, and each cycle carries its own annotation, validation, and compute cost at a time when accelerator capacity is expensive. Architectures sharing representation across voice, facial, and physiological inputs let one regional collection effort support several modalities, which is the practical route to affordable coverage. Duplicated pipelines are what make coverage unaffordable.

Push Inference Onto Embedded Processors Where Possible

Cloud inference cost scales directly with deployment volume and never stops, while embedded processing in a vehicle or device is paid once by whoever buys the hardware. Vendors moving inference to the edge remove a recurring cost from their own accounts and address the consent concerns that cloud transmission of behavioural data raises. Vehicle programmes assume it already.

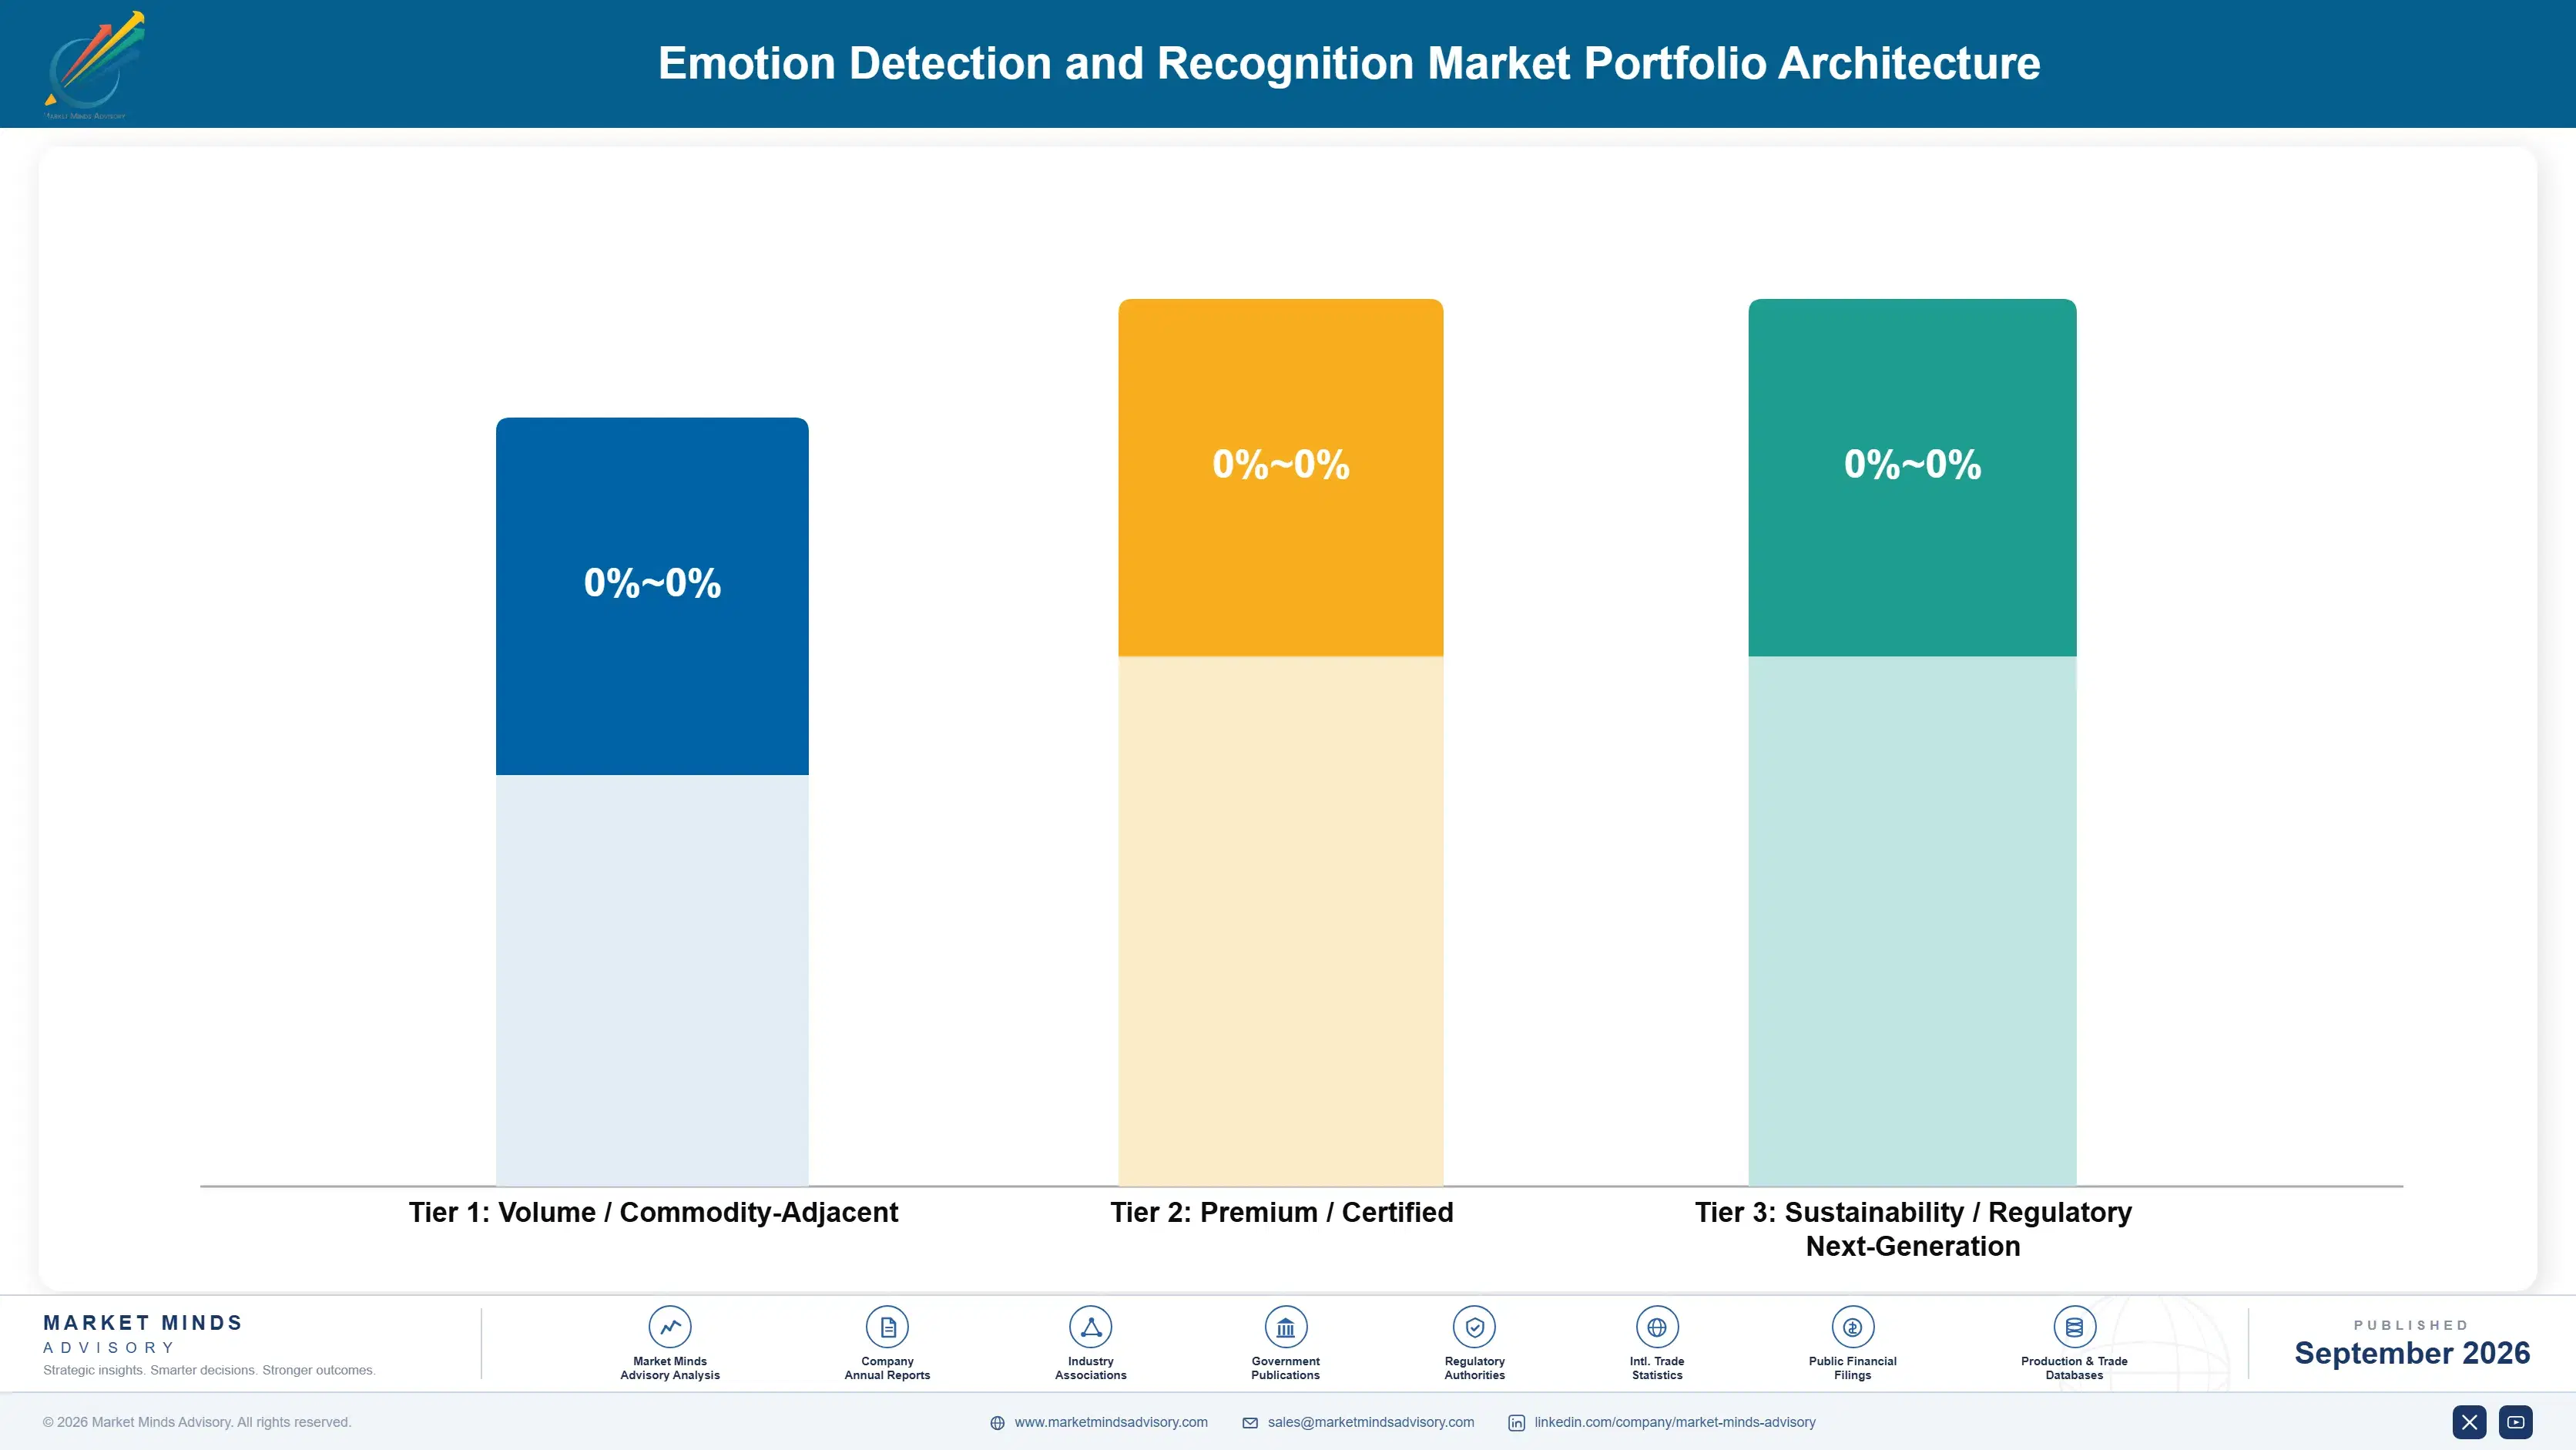
Portfolio Architecture for Margin Defence

Margin follows how defensible the claim is. Classification software sold on benchmark accuracy is losing pricing power steadily, since general model providers supply comparable capability as part of something broader. Outcome-validated enterprise deployment earns better, because the evidence sits in the customer's own numbers. Automotive qualified content earns most reliably, with volume visible years ahead and no annual renewal risk attached. That hierarchy has inverted once already and could again if requirements widen.
The tension between volume and premium runs through validation burden. Consumer research and retail analytics buyers accept lighter evidence, generate reasonable volume, and switch on price. Automotive programmes and large contact centre operators demand extensive validation, take years to win, and then stay for the life of the deployment. The two populations require different companies, and few vendors serve both well.

High-value pools concentrate where the deployment carries consequence: vehicle safety compliance, contact centre operations measured on resolution, and clinical research under proper protocol. None of these buyers accept a contested claim. Where the application is exploratory or discretionary, budgets are small, procurement is casual, and general purpose model providers are steadily absorbing the work at no incremental charge. Budgets there are small and getting smaller.

Volume / Commodity-Adjacent

Classification software sold on benchmark accuracy into consumer research and retail analytics, where general purpose model providers increasingly supply comparable capability. The twelve-point range reflects how much regional dataset investment a vendor carries against the revenue that volume produces.
Gross Margin: 48% to 60%

Premium / Certified

Outcome-validated enterprise deployment in contact centres and operations measured on resolution, escalation, and handling. Evidence sits in the customer's own numbers rather than in vendor claims. The ten-point range separates vendors with deployment reference bases from those without.
Gross Margin: 64% to 74%

Sustainability / Regulatory / Next-Generation

Automotive qualified interior sensing content with volume visible years ahead and no annual renewal exposure. Qualification takes years, which is exactly why the position holds. The twelve-point range reflects differences in programme scope and per-vehicle content across manufacturers.
Gross Margin: 70% to 82%
emotion-detection-and-recognition-market-portfolio-architecture-1790010152013

High-value Sub-segments and Strategic Watch-out

Automotive Interior Sensing Content

Highest value in the category, supplying 38% of revenue with volume visible years ahead and no annual renewal risk attached. Occupant functions extend it further. The twelve-point range reflects programme scope differences across vehicle manufacturers and content levels. Awards decided now set revenue through the next decade.
Gross Margin: 72% to 84%

Physiological Sensing Systems

Fastest growth at 20.1%, measuring physical quantities rather than inferring states, which is the only claim in this category that survives scrutiny cleanly. The twelve-point range separates contactless radar approaches from contact sensing built into wearables and seats. Population accuracy loss is far smaller here than elsewhere.
Gross Margin: 62% to 74%

Outcome Validated Contact Deployment

Volume core among operators measuring escalation and resolution, where evidence in the customer's own numbers survives procurement that classification claims fail. The twelve-point range reflects reference base depth, which decides renewal far more than capability does. Renewals are re-argued annually against results the customer owns.
Gross Margin: 60% to 72%

Benchmark Classification Licensing

The strategic watch-out. General purpose model providers supply comparable capability inside broader offerings, buyers have learned to test the claims, and regulation keeps narrowing where it may be applied. The fourteen-point range reflects dataset investment carried against declining prices. Very little here remains commercially defensible.
Gross Margin: 38% to 52%

How Revenue Recurs Here

Two revenue shapes coexist and they behave nothing alike. Automotive content is won once, then paid per vehicle across a production run visible years in advance, with no renewal decision and no annual negotiation. Enterprise software renews annually against demonstrated results, which means every account is re-argued each year. Vendors holding both have a stability that pure enterprise participants cannot manufacture.
Attachment depth follows validation evidence rather than product capability. A contact centre operator whose escalation model was tuned against its own historical outcomes will not switch without redoing that work and accepting a period of worse performance meanwhile. A buyer running a general classification tool has no attachment whatever and drops it the moment a general purpose provider includes something adequate at no extra cost.

The buyer has moved from innovation functions toward operations and safety engineering. Early deployments were bought by research and marketing teams testing an idea, with small budgets and casual procurement. Vehicle programmes are now specified by safety engineering, and contact centre deployments by operations directors measured on resolution. Both demand validation evidence, and both are considerably harder to sell to and considerably more valuable once won.
emotion-detection-and-recognition-market-end-use-penetration-index-1790010152504

Where This Market Rewards

These are among the four positions where our research anticipates prominent divergence between winners and laggards over the coming forecast period. Each is grounded in the demand model, the regulatory perimeter, and the announced capacity pipeline.
01 / OUTCOME VALIDATION DISCIPLINE

Claim what the customer can already measure

A claim about emotional state invites a scientific argument the vendor loses, while a claim about escalation or inattention invites a measurement against records the customer already holds. Vendors validating that way win 3.4 times more enterprise evaluations and renew at far higher rates, because the evidence belongs to the buyer rather than the seller. Around 41% of deployments now work this way and procurement increasingly requires nothing less, and the vendors resisting that shift are the ones losing renewals now.
02 / TERRITORIAL PRODUCT SEPARATION

One global product now costs more than two

European prohibition removed workplace and education applications outright, taking roughly 19% of prior revenue in those areas, while no equivalent restriction applies across East Asia or most of the Gulf. Vendors maintaining a single global product imposed compliance constraints on markets that never required them and lost ground to local competitors. Separated lines cost engineering effort and cost considerably less than the ground surrendered by the alternative, which is an unusually clear trade for a regulatory response, and few responses to regulation are this straightforward.
03 / REGIONAL DATASET INVESTMENT

Pilots pass where rollouts quietly fall apart

Models lose about 22 accuracy points against populations unlike their training data, and that failure appears at rollout rather than during evaluation, which is the most damaging possible moment for any vendor. Those collecting consented regional data before entering a market report deployment success 2.7 times more often than vendors extending an existing model. Collection takes quarters, so it must begin before the first sales conversation happens, and a failed rollout closes that market for years afterwards, which is why timing matters more than budget.
04 / AUTOMOTIVE CONTENT EXTENSION

The sensor is fitted, so use it further

Driver monitoring requirements already justified the cameras and radar, and automotive supplies 38% of category revenue on that basis alone. Extending into child presence detection, seat occupancy, and cabin state raises per-vehicle content by 40 to 65% on programmes a vendor has already won. Qualification takes years, which makes the position defensible, and it is the only revenue here visible years ahead of delivery, and no enterprise relationship offers anything comparable to it, and the awards decided this year set revenue through the next decade.

Engagement Snapshot From the Field

A live engagement with an industry participant carrying material or product regulatory and market exposure ahead of a defining policy shift, showing how our research translates into a defensible multi-year portfolio strategy.
MARKET MINDS ADVISORY · CLIENT ENGAGEMENT SUMMARY
Emotion Detection and Recognition Producer Strategic Portfolio Review and Transition Roadmap 2026·Investment Scenario on Emotion Detection and Recognition Exposure Evaluation 2025-26
CLIENT PROFILE
A business process operator running contact centre services from fourteen sites across three countries, handling roughly 41 million customer conversations annually for financial services and telecommunications clients. The group had deployed voice-based emotion analysis across four sites at an annual cost of approximately USD 2.6 million (client-reported, unverified by MMA). Nobody internally had checked what the analysis demonstrated.
STRATEGIC CHALLENGE
Two clients had begun asking what the analysis actually demonstrated, and the operator could not answer. The vendor reported classification accuracy against a public benchmark, but nobody had established whether flagged conversations differed in outcome from unflagged ones, and a contract renewal worth several million was approaching. Neither side possessed evidence to settle it.
MMA APPROACH
MMA matched six months of model outputs against recorded conversation outcomes, comparing escalation, repeat contact, and resolution rates between flagged and unflagged calls. Performance was assessed separately by site and by agent language group, and the model was tested against outcomes it had never been tuned toward. Agent response to live prompts was observed directly.
KEY FINDINGS
  1. Flagged conversations escalated 2.3 times more often than unflagged ones, which established genuine predictive value the vendor had never claimed or measured.
  2. Performance varied severely by site: two locations showed strong separation while a third, serving a different language group, showed almost none at all.
  3. Agents ignored 71% of live prompts, because the interface interrupted at the moment of highest conversational load rather than before it. Timing rather than content was the problem.
  4. Classification accuracy against the public benchmark correlated poorly with escalation prediction, which meant the vendor's headline metric measured the wrong thing entirely.
CLIENT PROFILE
A business process operator running contact centre services from fourteen sites across three countries, handling roughly 41 million customer conversations annually for financial services and telecommunications clients. The group had deployed voice-based emotion analysis across four sites at an annual cost of approximately USD 2.6 million (client-reported, unverified by MMA). Nobody internally had checked what the analysis demonstrated.
STRATEGIC CHALLENGE
Two clients had begun asking what the analysis actually demonstrated, and the operator could not answer. The vendor reported classification accuracy against a public benchmark, but nobody had established whether flagged conversations differed in outcome from unflagged ones, and a contract renewal worth several million was approaching. Neither side possessed evidence to settle it.
MMA APPROACH
MMA matched six months of model outputs against recorded conversation outcomes, comparing escalation, repeat contact, and resolution rates between flagged and unflagged calls. Performance was assessed separately by site and by agent language group, and the model was tested against outcomes it had never been tuned toward. Agent response to live prompts was observed directly.
KEY FINDINGS
  1. Flagged conversations escalated 2.3 times more often than unflagged ones, which established genuine predictive value the vendor had never claimed or measured.
  2. Performance varied severely by site: two locations showed strong separation while a third, serving a different language group, showed almost none at all.
  3. Agents ignored 71% of live prompts, because the interface interrupted at the moment of highest conversational load rather than before it. Timing rather than content was the problem.
  4. Classification accuracy against the public benchmark correlated poorly with escalation prediction, which meant the vendor's headline metric measured the wrong thing entirely.
RECOMMENDED STRATEGY
Phase 1: Phase one: renegotiate the contract around escalation prediction measured on the operator's own records rather than around benchmark classification accuracy. Phase 2: Phase two: withdraw deployment at the underperforming site pending regional data collection, rather than accepting results the evidence does not support. Phase 3: Phase three: move prompts from live interruption to post-call coaching, where agents can act on them without conversational load. Coaching sessions already exist for this.
OUTCOME
Escalations fell 17% across the two validated sites within two quarters (client-reported, unverified by MMA). Contract value was renegotiated down 22% while coverage widened, since pricing moved onto measured outcomes. Both clients accepted the revised evidence basis without further challenge. The underperforming site resumed after regional collection completed.

Frequently Asked Questions

Foundational context covering the market sizes, CAGR, scope, country, region and competition that inform every finding below. This section is provided to cover basics and most often pre-purchase conversations, answered from the MMA Primary Research Dataset.

What is the current size of the Emotion Detection and Recognition Market?

The market was worth USD 1.6 billion in 2025 and reaches USD 1.8 billion in 2026. Value covers affective sensing software and integrated systems, excluding the underlying hardware.

How large will the Emotion Detection and Recognition Market be by 2036?

MMA forecasts USD 6.3 billion by 2036, an increase of USD 4.5 billion across the forecast period. That represents 3.50 times the 2026 base of USD 1.8 billion.

What is the CAGR for the Emotion Detection and Recognition Market 2026 to 2036?

The base case compound annual growth rate is 13.4%, with a bull case at 14.6% and a bear case at 12.2%. Historical growth from 2020 to 2025 ran at 12.0%.

Which segment is growing fastest?

Physiological signal sensing grows at 20.1%, half again the market rate of 13.4%. It measures physical quantities rather than inferring states, which is a considerably more defensible claim.

Who are the major companies in the Emotion Detection and Recognition Market?

Smart Eye, Seeing Machines, Uniphore, Xperi, and Tobii lead, together holding 34% of software revenue. Automotive suppliers and enterprise vendors rarely compete against each other directly.

Which country is growing fastest?

India grows at 18.6%, driven by the largest contact centre workforce anywhere applying voice analysis validated against the escalation and resolution outcomes operators already record.

Report Segmentation Architecture

The full report scope spans multiple orthogonal segmentation dimensions, with cross-tabulated demand data provided for each dimension pair. Coverage extends further to regional breakdowns, trend trajectories, and the competitive detail needed to support segment-level decision-making.

By Sensing Modality

  • Facial Expression Analysis
  • Voice and Speech Prosody Analysis
  • Text and Conversational Sentiment
  • Physiological Signal Sensing
  • Multimodal Fusion Systems
  • Body Posture and Movement Analysis

By End-Use Industry

  • Automotive and Mobility
  • Contact Centres and Customer Operations
  • Consumer Research and Advertising
  • Healthcare and Clinical Research
  • Retail and Consumer Experience
  • Gaming, Media and Entertainment

By Commercial Dimension

  • Automotive Programme Supply
  • Enterprise Software Subscription
  • Embedded Licensing to Device Makers
  • Research Platform and Instrument Sale
  • Cloud Application Programming Interface
  • Professional Services and Validation

By Region

  • East Asia
  • North America
  • Western Europe
  • South Asia and Pacific
  • Latin America
  • Middle East and Africa
  • Eastern Europe

Scope, Methodology, and Coverage

Every figure in this report is reproducible from documented input assumptions. The scope below maps the historical period, the forecast horizon, the segmentation dimensions, and the countries covered, alongside the underlying primary and qualitative methodology.
Historical Period
2020 to 2025
Forecast Period
2026 to 2036
Base Year
2025 (USD billions; MMA Primary Research Dataset, September 2026)
Market Definition
This market covers software and integrated systems that infer affective or behavioural state from human signals, including facial expression analysis, voice and speech prosody analysis, text and conversational sentiment, physiological signal sensing, multimodal fusion systems, and body posture and movement analysis. It excludes general computer vision and speech recognition, biometric identity verification, medical diagnostic devices holding regulatory clearance, customer feedback survey platforms, and the camera, microphone, and radar hardware involved.
Quantitative Units
USD billions, software and integrated system revenue
Segmentation Dimensions
Sensing modality, end-use industry, commercial dimension, region
Regions Covered
East Asia, North America, Western Europe, South Asia and Pacific, Latin America, Middle East and Africa, Eastern Europe
Countries Covered
China, Japan, South Korea, Taiwan, United States, Canada, Mexico, Germany, United Kingdom, France, Sweden, Netherlands, Switzerland, Spain, Italy, India, Philippines, Indonesia, Vietnam, Australia, Brazil, Mexico, Colombia, Chile, Saudi Arabia, United Arab Emirates, Israel, South Africa, Poland, Romania
Key Companies Profiled
Smart Eye, Seeing Machines, Uniphore, Xperi, Tobii, Cipia, Cogito, Realeyes, Behavioral Signals, audEERING, NVISO, iMotions, Noldus, Entropik, Symanto, Receptiviti, Eyeris, Emotibot, Valeo, OmniVision
Quantitative Methodology
Primary survey, n=3,800 respondents, Q4 2025, six countries; demand-side model with trade association cross-validation
Qualitative Methodology
47 expert interviews, Q4 2025; applied to validate demand model assumptions, identify emerging dynamics, and assess competitive positioning
Report Format
PDF and XLSX data workbook (Word format preview document)
Publisher
Market Minds Advisory
Report Code
MMA-2026-TEC-701
Published
September 2026
Contact
sales@marketmindsadvisory.com | www.marketmindsadvisory.com

Purchase the full Emotion Detection and Recognition Market Report (2026 to 2036).

The full report sizes the emotion detection and recognition market across six sensing modalities, seven regions, and thirty countries, with forecasts to 2036 under base, bull, and bear cases. It examines why the category migrated from emotional classification toward outcome prediction, what European prohibition removed from the addressable market, and how models degrade against populations outside their training data. Competitive analysis covers twenty participants evaluated consistently on software revenue, with detailed treatment of automotive qualification and validation evidence. Cost structure, margin architecture, and regional regulatory drivers are analysed throughout. Primary research includes 3,800 survey responses and 47 expert interviews.
Six sensing modalities sized and forecast separately
Twenty participants evaluated on software and system revenue
Regional regulatory permissions mapped across seven distinct geographies
Margin architecture by modality and validation basis
Outcome validation benchmarking across enterprise deployment references
Automotive content extension economics across interior sensing programmes

Built For The People Who Decide

From boardroom strategy to bench-side execution, this report is read cover-to-cover by leaders shaping the next decade of their industry, turning demand scenarios, market dynamics and valuation benchmarks into decisions.
CXOs/ Presidents/ VPs/ Managers
M&A and Corporate Development
Strategy Teams and R&D Heads
Procurement and Product Directors
Regulatory and Compliance Leaders
Investor Relations and Equity Analysts