Market Minds Advisory
Embedded Smart Cameras Market

Embedded Smart Cameras Market: Embedded Smart Cameras Market: On-Device Vision for Industrial, Robotic and Analytics Applications, 2026 to 2036

The camera is about a quarter of what a deployment costs and none of what makes it work. Training data for the specific thing being inspected belongs to the customer and transfers nowhere.

Lead Analyst

Published

September 2026

Make Smarter Decisions with Customized Research Insights

Request a free sample report and evaluate market opportunities, growth trends, and competitive dynamics relevant to your business needs.

2025 MARKET VALUE$5.2BMarket Size 2025
2036 FORECAST VALUE$22.3BBase Case , 2026 to 2036
CAGR 2026 TO 203614.2 %Bull 15.5% / Bear 12.9%
INCREMENTAL OPPORTUNITY$16.4BNet 10- year value creation
EXPANSION MULTIPLE3.78x2036 value over 2026 base
Strategic Levers
M&A Pipeline
Regional Outlook
Country Rankings
Competitive Intelligence
Segmental Deep-dive
Call-Us : 91 93563 13602

Executive Snapshot and Market Trajectory.

Buyers evaluate embedded smart cameras on detection accuracy and discover afterwards that the camera is 27% of deployment cost and none of the difficulty. Lighting and mounting take 34%. What decides success is training data for the specific defect being examined, and it helps no other deployment.
Robotics and autonomous machine vision grows at 21.3%, half again the market rate of 14.2%, because a machine that moves needs to interpret what it sees on board rather than sending frames somewhere. Automotive interior and auxiliary vision follows behind. East Asia holds 39% of shipment value, on industrial automation deployment and camera module manufacture together. Fixed inspection products are frequently unsuitable rather than merely uncompetitive there. Motion changes every requirement.
Retrofit is what limits this market. Installing embedded vision on an existing production line costs about 4.6 times what specifying it on a new one does, because mounting, lighting, and integration dominate and none was designed for. Growth therefore follows new capacity construction, which is why Vietnamese deployment grows at 19.6% and mature market installed bases barely move. Suppliers forecasting from sector size overestimate what is available. Mature market installed bases barely move at all.
Market Definition
This market covers camera devices with integrated processing that output decisions or structured data rather than raw video, including industrial machine vision cameras, security and access edge cameras, retail and space analytics cameras, robotics and autonomous machine vision, automotive interior and auxiliary vision, and agricultural and field inspection cameras. It excludes conventional video surveillance cameras without on-device analysis, image sensors sold as components, consumer devices, and centralised video analytics software.
Base Year Value
$5.2B in 2025 (MMA Primary Research Dataset, September 2026)
Forecast Period
2026 to 2036, eleven discrete annual values
CAGR
14.2% base case. Bull 15.5%. Bear 12.9%.
Fastest Growth Segment
Robotics And Autonomous Machine Vision: 21.3% CAGR
Fastest Growth Country
Vietnam: 19.6% CAGR
Fastest Growth Region
South Asia and Pacific: 16.3% CAGR
Largest Region
East Asia: 39% of 2025 global value
Market Leaders
Basler, Cognex, Keyence, Teledyne, and Hikvision lead the field. Source: MMA Primary Research Dataset, July 2026.
Primary Survey
n=3,800 procurement and R&D decision-makers, Q4 2025, six countries
Methodology
Demand-side build-up, cross-validated against public data, 47 expert interviews

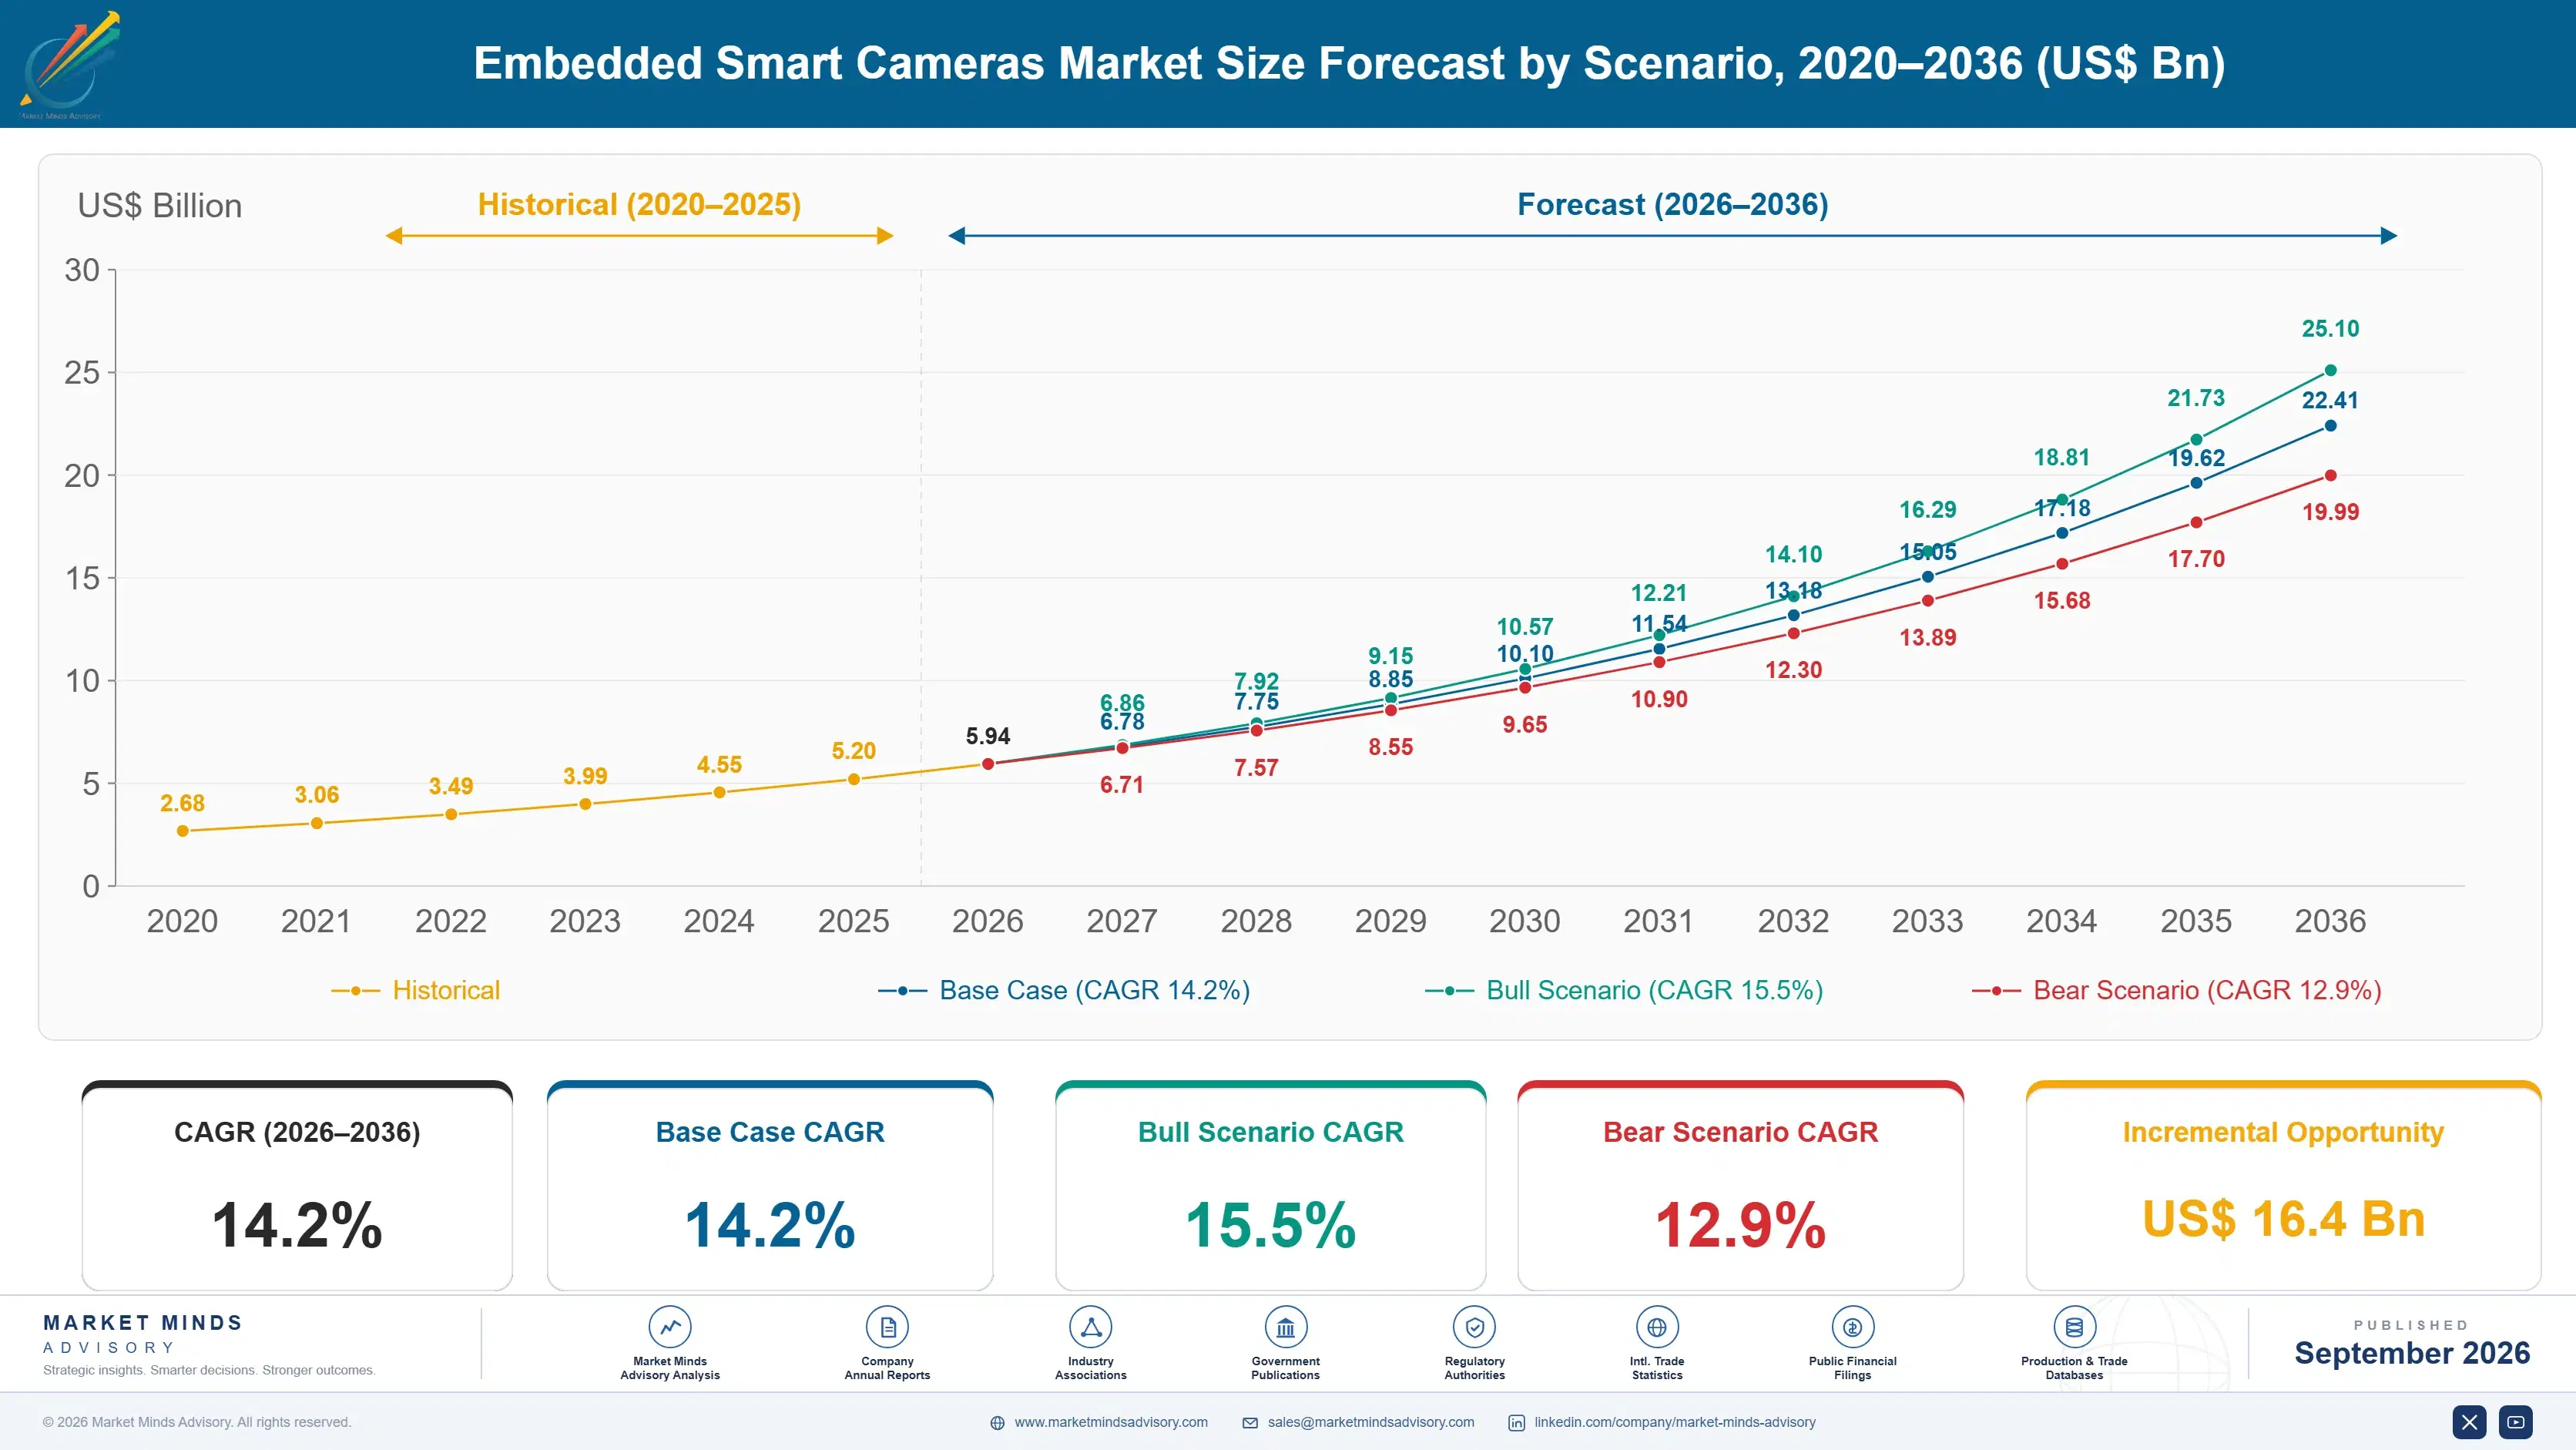
Embedded Smart Cameras Market Forecast Scenarios

embedded-smart-cameras-market-size-forecast-scenario-1790008884787
Growth between 2020 and 2025 followed processing capability rather than demand. Vision processors capable of running useful models within an industrial power and thermal budget only became available at sensible prices during the period, which converted a laboratory proposition into a deployable one. Historical growth of 12.8% reflects that transition, concentrated in new production capacity where specification happened at design rather than as a retrofit.
The base case at 14.2% rests on three mechanisms. Manufacturing capacity relocation into Southeast Asia and India installs new lines that specify embedded vision at design, where the cost premium over conventional cameras is small. Mobile robots in warehouses, agriculture, and construction require on-board interpretation because latency and connectivity make anything else unworkable. And driver and occupant monitoring obligations attach vision requirements to vehicle interiors that manufacturers must satisfy regardless of preference.
The bull case at 15.5% depends on on-device model updating becoming reliable enough that deployments improve after installation rather than degrading, which would remove the largest source of buyer disappointment. The bear case at 12.9% is manufacturing investment slowing: nearly all growth here follows new line construction, and a capital spending pause in electronics or automotive removes it almost immediately.

The Camera Is Not The Problem

Procurement in this category consistently examines the wrong thing. The camera accounts for 27% of what a deployment costs, lighting and mounting take another 34%, and integration, calibration, and commissioning make up most of the rest. Buyers negotiate the camera hard, accept whatever the integrator quotes for illumination, and are surprised when the budget lands where it does. The camera is the smallest line they examined.
TOP FIVE CONCENTRATION38%Share of shipment value held by the leading suppliers
CAMERA SHARE OF DEPLOYMENT27%Portion of installation cost represented by the camera itself
LIGHTING AND MOUNTING COST34%Deployment spend on illumination and physical positioning work
TRAINING DATA DEFICIENCY3.1%Cases failing because no comparable examples existed anywhere
RETROFIT COST MULTIPLE4.6Installation expense against equivalent new line specification cost
AVERAGE SELLING PRICEUSD 214Delivered price across all embedded smart camera types
Detection performance is decided before any camera is chosen. A system inspecting a specific part for a specific defect needs examples of that defect, and roughly 3.1% of production cases fail because nobody had comparable examples to train against. That data belongs to the customer, accumulates slowly, and transfers to no other deployment, which is why laboratory demonstrations predict field performance so poorly. Laboratory demonstrations predict field performance very poorly.
Retrofit economics explain the geographic pattern. Adding embedded vision to an existing line costs about 4.6 times what specifying it on a new one does, since mounting positions, lighting, and machine interfaces were never designed to accommodate it. Growth therefore concentrates wherever new production capacity is being built rather than wherever manufacturing already exists. Manufacturing sector size predicts nothing useful here.
"Every failed deployment we reviewed passed its laboratory demonstration comfortably. They failed on the small proportion of real cases nobody had pictures of, months later, in production. The camera was never the variable, and almost every procurement process treats it as though it were the only one."
Practice Director, Industrial Automation and Machine Vision · MMA Technology Practice · September 2026

Market Trends

Mobile Machines Require Interpretation On Board

A robot moving through a warehouse, field, or construction site cannot send frames somewhere and wait for an answer, because latency and connectivity both fail at exactly the moment the answer matters. On-board interpretation is therefore a requirement rather than an optimisation, and robotics vision grows at 21.3% on that basis. The specification differs sharply from fixed industrial inspection, with power budget, vibration tolerance, and dynamic scene handling taking priority over the resolution and repeatability that stationary applications optimise for. Suppliers built around stationary inspection frequently find their products unsuitable rather than merely uncompetitive here.
Market Impact: Segment grows at 18.2%
New Capacity Specifies Vision Where Retrofit Cannot Justify It

Adding embedded vision to a running production line costs roughly 4.6 times what designing it into a new one does, because mounting, lighting, and machine interfaces have to be created rather than specified. Manufacturing relocation into Southeast Asia and India is therefore where deployment concentrates, and Vietnamese growth of 19.6% leads every country covered. Mature market installed bases barely move by comparison, which means this market grows with construction rather than with the size of the manufacturing sector. This market therefore grows with construction rather than with the size of any manufacturing sector.
Market Impact: Enables USD 214 price points

Market Opportunities and Growth Drivers

Occupant Monitoring Obligations Attach Vision To Vehicles

Driver attention and occupant detection requirements across several major markets oblige manufacturers to fit interior vision regardless of whether they see commercial value in it, which converts an optional feature into a specification line on every relevant platform. Automotive interior vision grows at 18.2% as a result. The commercial character resembles a component award rather than a technology sale, with long qualification, high volume, and pricing that reflects an obligated buyer who would not have purchased voluntarily. Quality systems and functional safety documentation close the segment to most industrial suppliers entirely.
Market Impact: Fails on 3.1% of cases

Vision Processors Reached Industrial Power Budgets

Running a useful model within the power and thermal envelope an industrial camera housing allows only became practical at sensible cost during the past few years, which is what moved this category from demonstration to deployment. Average delivered prices near USD 214 reflect processors that would have been impossible at that price a short time ago. The commercial consequence is that camera makers now compete partly on which processor they selected, and that choice determines what models will run for the product's whole life. Processor choice therefore decides product lifetime.
Market Impact: Consumes 34% of cost

Market Restraints and Challenges

Training Data Belongs To The Customer And Transfers Nowhere

Roughly 3.1% of production cases fail because no comparable examples existed to train against, and the root cause is that the data describing a specific part, defect, or behaviour exists only where that thing is made. It accumulates slowly and helps no other deployment. Commercially this makes laboratory demonstrations poor predictors of field performance and produces disappointment months after purchase. Participants respond with on-device retraining, staged deployment that accumulates examples before full commitment, and explicit contractual treatment of the data gathering period. Buyers accept a slower start once the reason is explained properly.
Market Impact: Segment grows at 21.3%

Lighting And Mounting Dominate Installation Economics

Illumination and physical positioning consume 34% of deployment cost against 27% for the camera, and the root cause is that machine vision depends far more on controlled lighting than on sensor quality. Commercially this means buyers optimising camera price are addressing a minority of the budget, and integrators quoting the remainder face almost no scrutiny. Participants respond by supplying integrated lighting and mounting alongside the camera, by publishing installation guidance that reduces integrator variability, and by pricing complete deployments rather than devices. Integrator variability is the largest uncontrolled factor. Complete deployments rather than devices.
Market Impact: Costs 4.6 times to retrofit
3 additional market trends, 4 additional growth drivers, and 2 additional restraints and challenges are covered in the full report. Contact sales@marketmindsadvisory.com to access the complete intelligence.

Segment CAGR and Growth Architecture

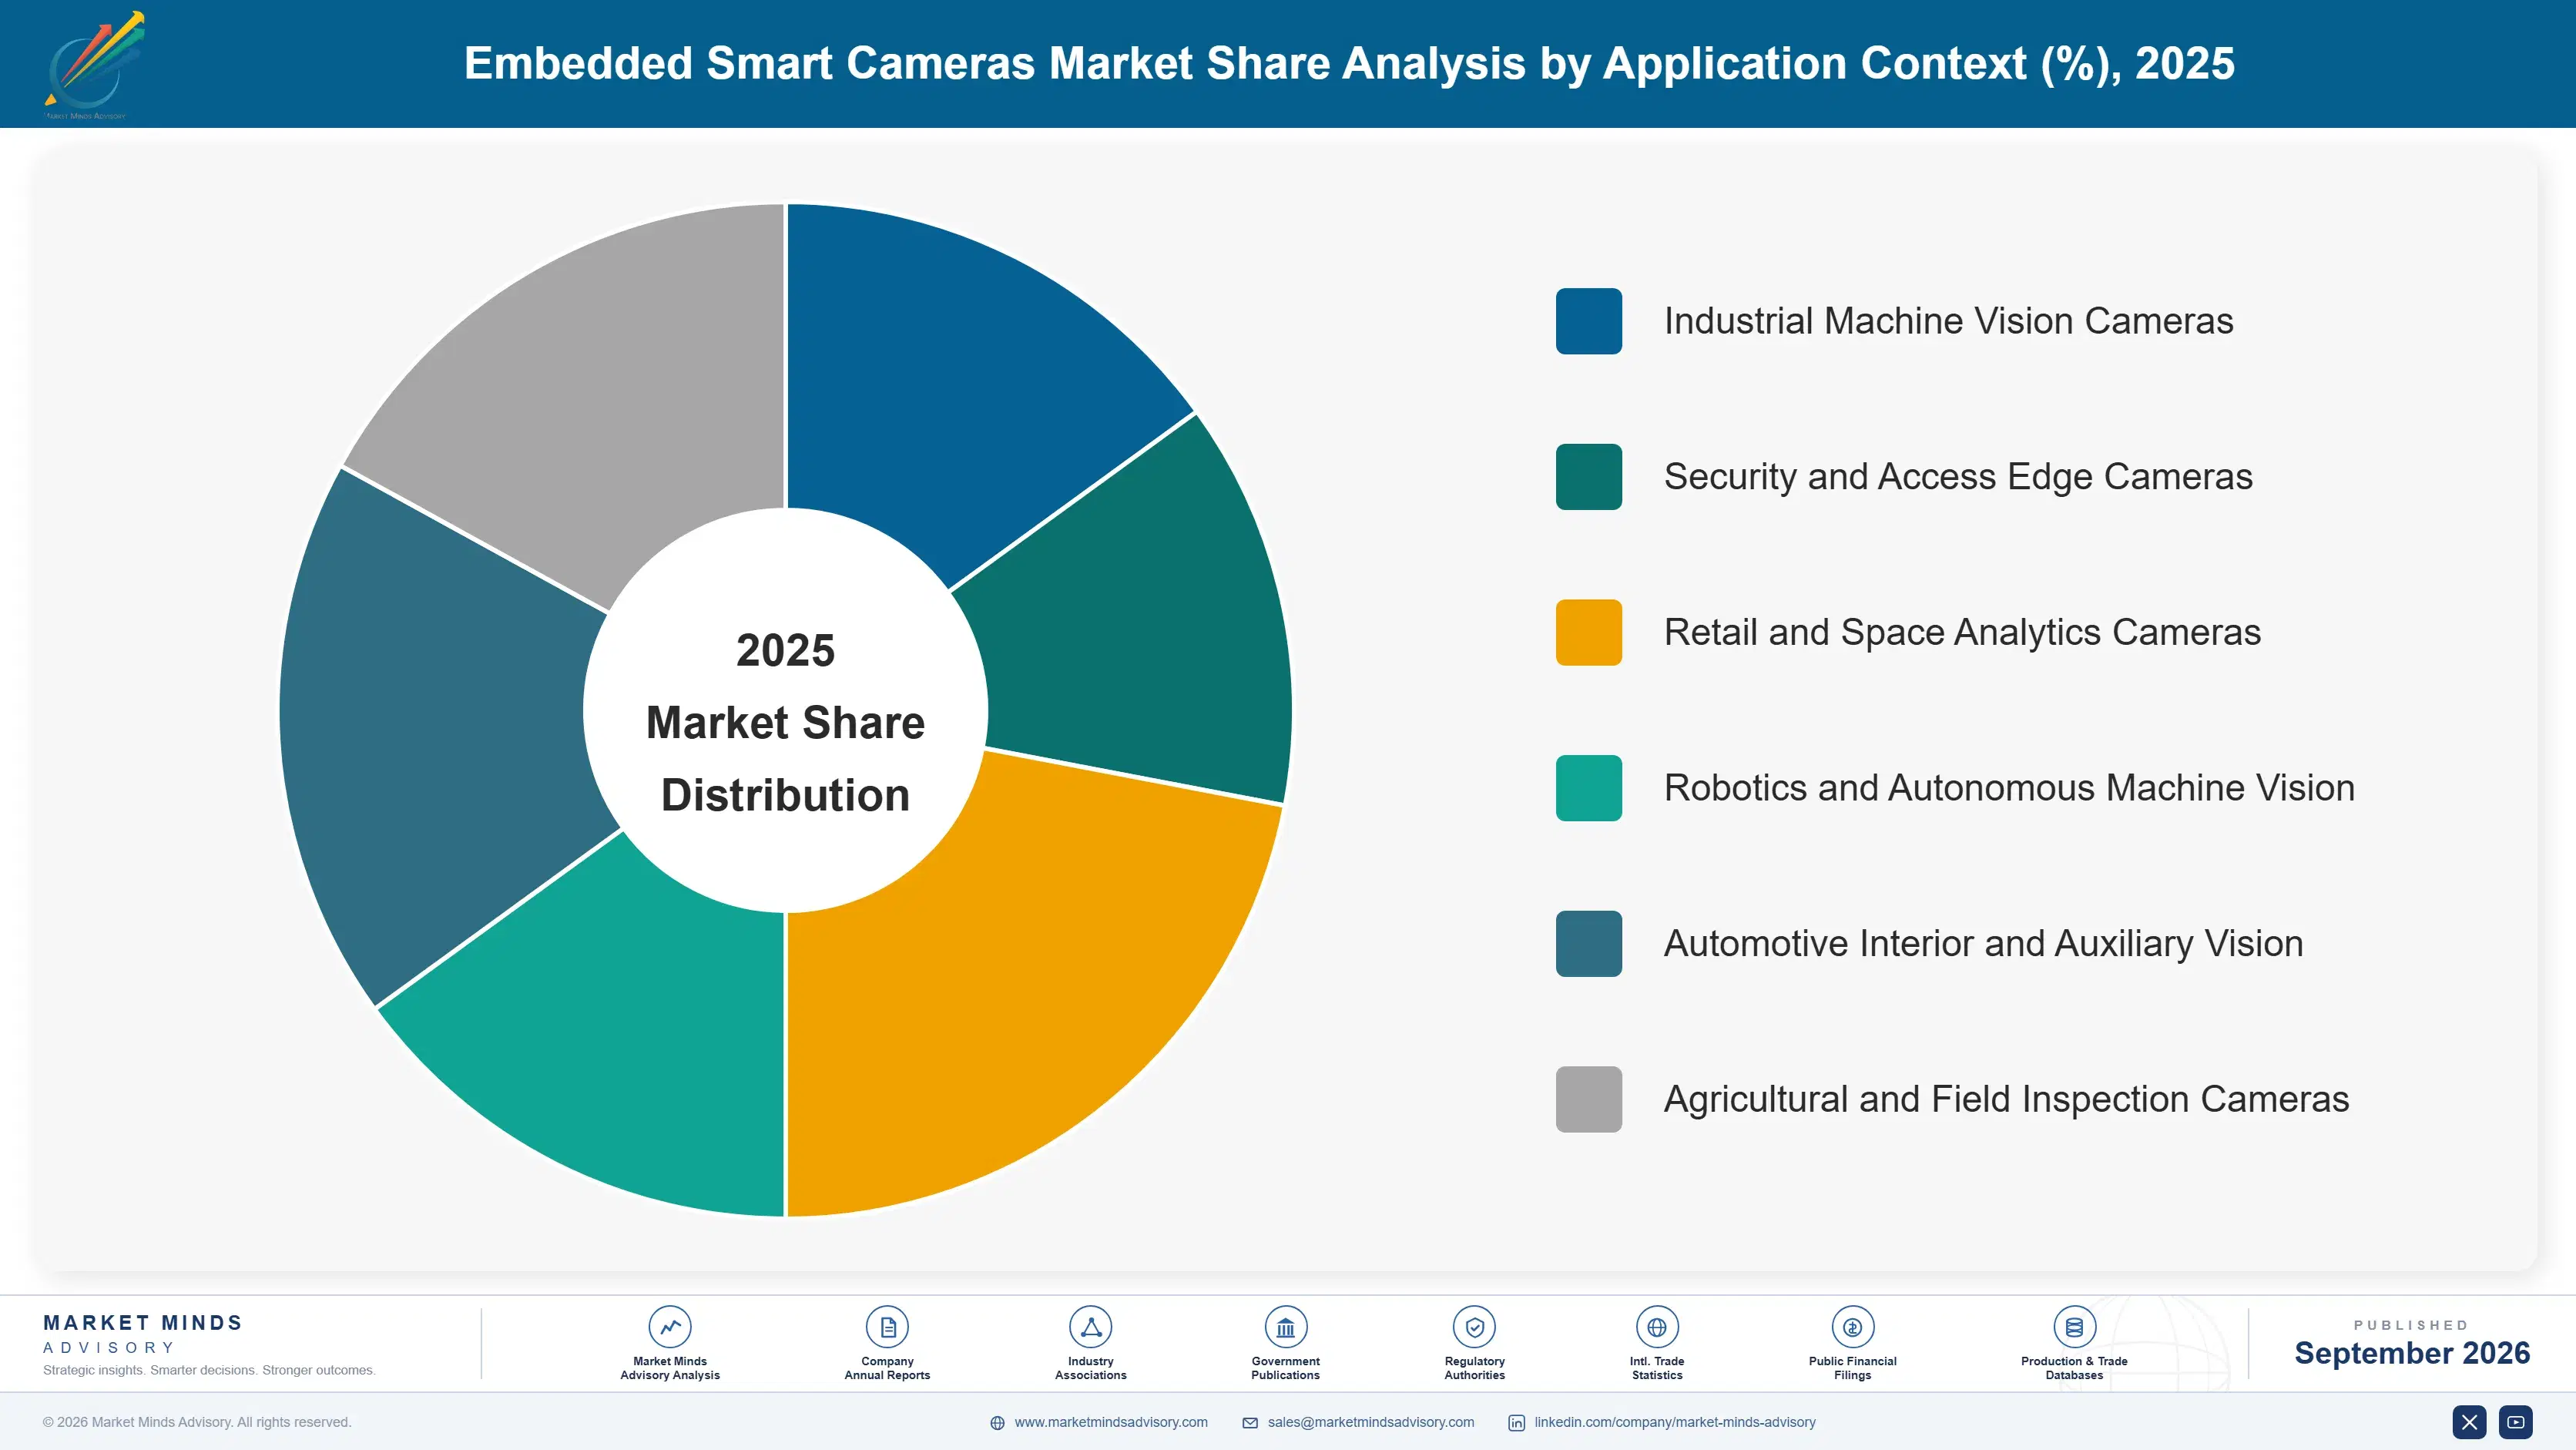
Segmentation follows application context. Six categories cover the market: industrial machine vision cameras, security and access edge cameras, retail and space analytics cameras, robotics and autonomous machine vision, automotive interior and auxiliary vision, and agricultural and field inspection cameras. Fixed industrial inspection remains the largest while mobile applications grow fastest. Automotive volumes dwarf every other application entirely.
embedded-smart-cameras-market-market-share-analysis-1790008885370

Robotics And Autonomous Machine Vision

Robotics vision grows at 21.3%, half again the market rate of 14.2%, because a machine in motion cannot wait for an answer from elsewhere. Latency and connectivity both fail precisely when the interpretation matters, which makes on-board processing a requirement rather than an efficiency choice. The specification differs sharply from fixed inspection: power budget, vibration tolerance, dynamic range across changing light, and handling of scenes that were never framed deliberately all take priority over the resolution and repeatability stationary applications optimise for. Suppliers built around industrial inspection frequently find their products unsuitable rather than merely uncompetitive here. Motion changes every requirement. Designs starting from motion win these awards. Adaptation rarely succeeds here.
CAGR 21.3%

Automotive Interior And Auxiliary Vision

Automotive interior vision grows at 18.2% on obligation rather than on demand. Driver attention and occupant detection requirements across several major markets oblige manufacturers to fit cameras they would not have chosen commercially, which turns the segment into a component award with long qualification, very high volume, and pricing that reflects a buyer with no alternative. Suppliers need automotive quality systems, functional safety documentation, and the patience for multi-year programme cycles, none of which industrial vision companies possess naturally. The volumes are large enough to justify acquiring all three, and several have. Programme cycles run for years before revenue arrives. Several suppliers acquired all three capabilities. Volumes justify the effort.
CAGR 18.2%
Full segment breakdown across 6 segments available in the complete report.

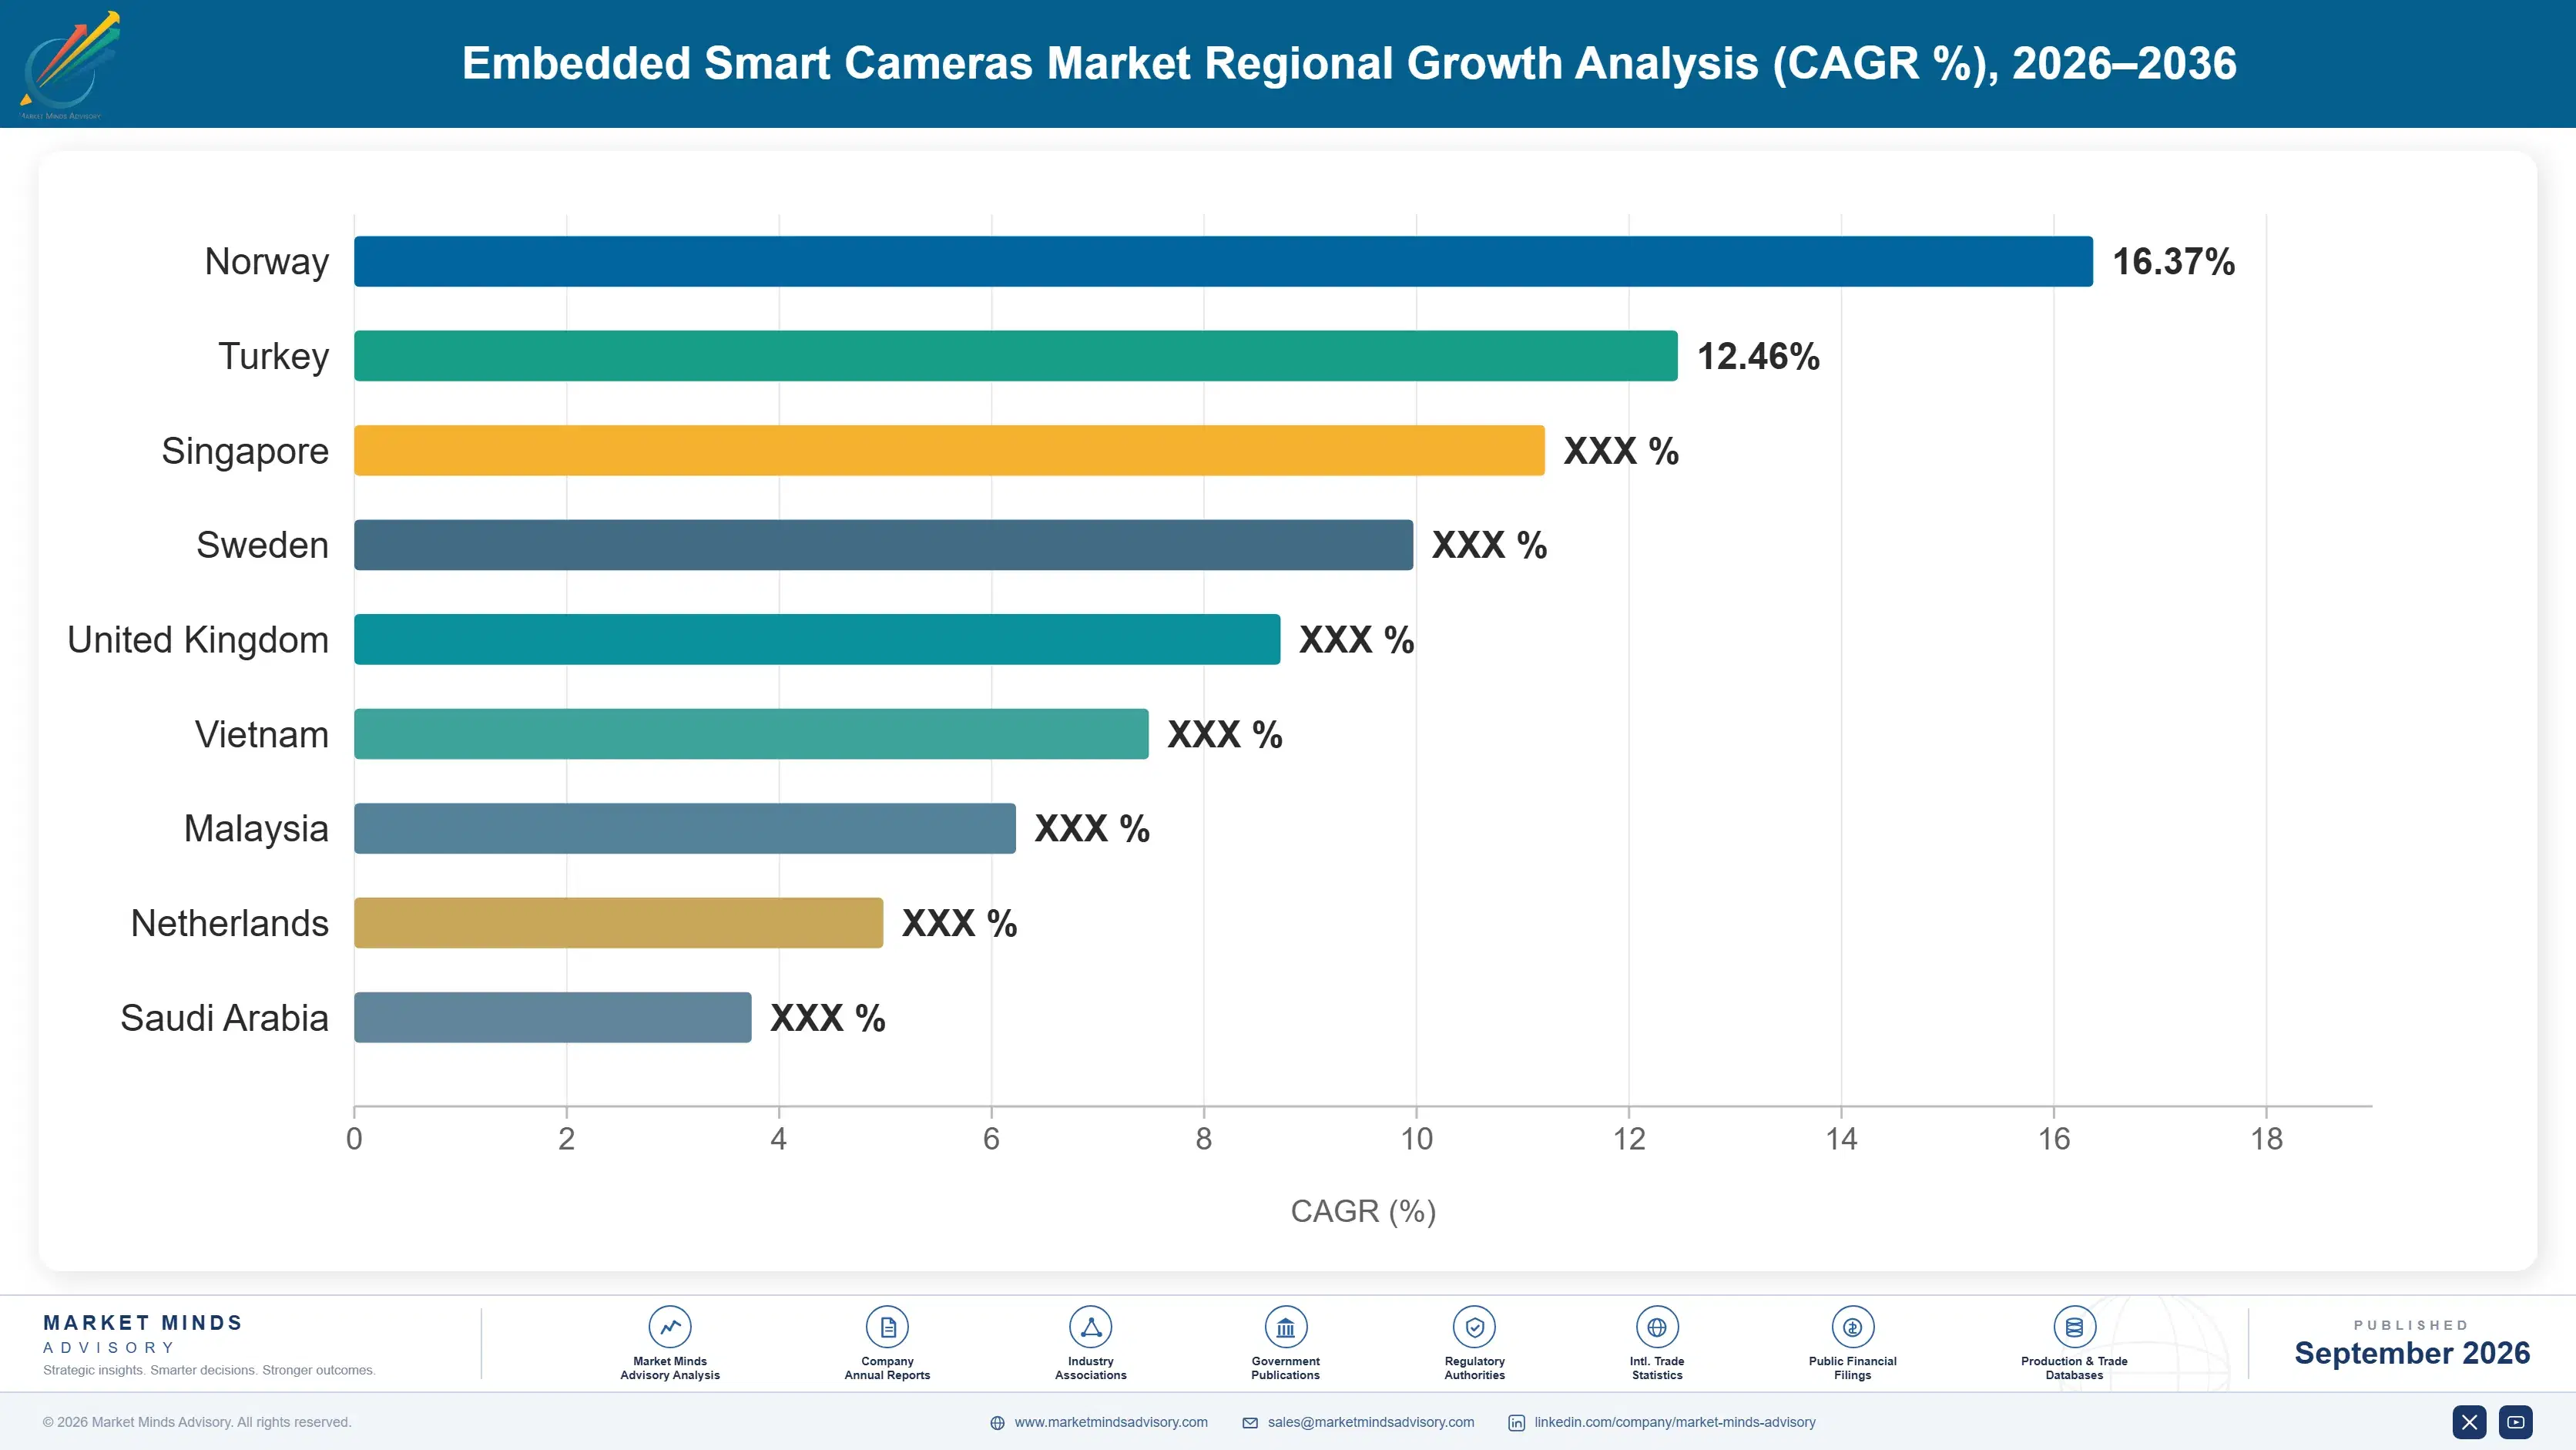
Regional Architecture and Country Demand Map

Regional shares track where embedded vision is deployed, which follows new production capacity construction rather than existing manufacturing scale. Read this as a map of where new lines are being built. One region sits far outside the standard bands because deployment and camera manufacture coincide there entirely.

East Asia

At 39% East Asia sits far above the standard band, and deployment and manufacture coincide here in a way they do nowhere else. Chinese industrial automation installs embedded vision at volumes no other region approaches, Chinese and Korean suppliers manufacture most of the world's camera modules, and Japanese suppliers hold strong positions in precision industrial inspection. Growth of 15.2% runs above the world rate because new production capacity continues being built alongside robotics deployment that is expanding faster than anywhere else. Component supply and application demand reinforce each other continuously here. Robotics deployment expands faster here than anywhere else covered in this study. Component supply and demand reinforce each other.
Share: 39% | CAGR: 15.2% (2026 to 2036)

North America

Warehouse robotics and logistics automation drive most deployment, and those applications specify vision at design because the machines are new rather than retrofitted. Industrial inspection demand is steadier and concentrated in aerospace, medical device, and semiconductor manufacture where defect consequences justify the installation cost. Growth of 13.4% is moderate, held back by a manufacturing base that is expanding selectively rather than broadly. Retail analytics deployment has slowed considerably as privacy expectations tightened and as several publicised installations produced results that did not justify continuation. Warehouse robotics specify vision at design because the machines are new rather than retrofitted. Retail analytics deployment has slowed as privacy expectations tightened considerably. Results disappointed several operators.
Share: 22% | CAGR: 13.4% (2026 to 2036)
Regional intelligence for 5 additional markets available in the complete report: Western Europe, South Asia and Pacific, Latin America, Middle East and Africa, Eastern Europe. Contact sales@marketmindsadvisory.com.
embedded-smart-cameras-market-country-cagr-analysis-1790008885895

Where Suppliers Beat Component Pricing

Four commercial moves separate suppliers earning properly from those selling a camera into a project the buyer did not know they were starting. Each recognises that the device is 27% of deployment cost and none of the reason a deployment succeeds or fails in production. Selling a device into somebody else's project is not a defensible position.

Supply Lighting And Mounting Alongside The Camera

Illumination and physical positioning consume 34% of deployment cost against 27% for the camera, and integrators quote that portion with almost no scrutiny applied to it. Suppliers offering integrated lighting, mounting, and installation guidance capture project revenue 2.3 times the camera value and remove the largest source of deployment variability at the same time. It requires application engineering capability that component suppliers deliberately avoided building, which is precisely why the position stays available. Integrators face almost no scrutiny on that portion of the quotation. Deployment variability disappears with it. Component suppliers avoided it.
Market Impact: Captures 2.3 times the camera value in projects

Stage Deployment To Accumulate Training Examples

Roughly 3.1% of production cases fail because no comparable examples existed, and that gap only closes with time on the actual line rather than with better sensors. Suppliers structuring a data gathering phase before full commitment report deployment success rates 2.8 times higher than those going straight to production acceptance. The customer accepts a slower start readily once the reason is explained, and the alternative is a system blamed for failing on cases nobody could have anticipated. Sensors cannot close that gap. Blame follows the system otherwise. Time on the line closes it.
Market Impact: Raises deployment success rate by roughly 2.8 times

Reach New Capacity At Line Design Stage

Retrofitting costs about 4.6 times what design stage specification does, so the addressable opportunity sits with lines being built rather than lines running. Suppliers working with machine builders and engineering contractors during design win 3.6 times more deployments than those approaching plants directly after commissioning. The engagement is early, unfunded, and requires people who can read a line layout, which is unfamiliar work for organisations selling through industrial distribution channels. Mounting positions and lighting are fixed by then. Distribution channels never reach these people. Reading a line layout is the skill required.
Market Impact: Wins 3.6 times more production line deployments overall

Build Automotive Quality Systems Before Bidding

Interior vision volumes are large and obligated, and they are closed to any supplier lacking automotive quality systems, functional safety documentation, and the capacity to sustain a multi-year programme cycle. Industrial vision companies possess none of these naturally. Those who acquired or built them report contract values 8 to 14 times a typical industrial award, on volumes that make the qualification investment straightforward to justify once a single platform is won. A single platform justifies the whole qualification investment. Margins reflect an obligated buyer throughout. Requalification is not realistically available.
Market Impact: Wins contracts 8 to 14 times larger overall

Who Controls the Margin Pool

Concentration is low for an industrial category. Five suppliers hold 38% of shipment value, measured consistently on that basis across all participants, and the field divides between precision industrial vision specialists, security camera manufacturers moving upward into analysis, and semiconductor companies supplying processors that increasingly arrive as reference designs anybody can build from. Reference designs have lowered the barrier for anybody assembling hardware.
Competition currently turns on three things: application engineering that addresses lighting and mounting rather than the camera, processor selection that determines what models will run for the product's life, and quality systems for automotive programmes. Sensor and optical specification differentiates far less than suppliers assume, since detection performance is decided by training data rather than by image quality. Training data rather than image quality decides detection performance.

Pressure comes from two directions. Processor vendors publishing reference designs have lowered the barrier for anybody assembling a camera. Meanwhile machine builders are integrating vision into equipment rather than buying it separately. Rankings will shift toward suppliers selling deployments rather than devices, since that is where the majority of project spending actually sits. Most project spending sits outside the device entirely.
embedded-smart-cameras-market-company-positioning-matrix-1790008886428

Competitive Moat and Risk Dimensions

COGNEX

Moat: Application Engineering And Libraries

Decades of accumulated inspection application knowledge, packaged as configurable tools rather than raw capability, lets an integrator solve a problem without building anything from first principles. That library reflects thousands of deployments and represents the part of machine vision that genuinely cannot be assembled from a reference design and a sensor.
COGNEX

Risk: Robotics Specification Differs Sharply

Mobile machine vision demands power budget, vibration tolerance, and dynamic scene handling that fixed inspection products were never designed for, and that segment grows fastest by a wide margin. Competing there means products rather than adaptations, against suppliers whose designs started from motion rather than from a factory bench.
HIKVISION

Moat: Manufacturing Scale And Cost

Very large camera manufacturing volume produces a delivered cost position that specialist industrial suppliers cannot match, and it matters most in applications where adequate detection at low unit cost beats excellent detection at several times the price. Security, retail analytics, and simpler industrial applications all price on exactly that basis.
HIKVISION

Risk: Procurement Restrictions In Markets

Several Western jurisdictions restrict procurement of cameras from certain suppliers in government, infrastructure, and increasingly commercial contexts, on grounds unrelated to product capability. That exposure concentrates in exactly the markets with the highest specifications and the strongest application engineering revenue attached to deployments. Capability is not the issue.

Players Tracked

Prominent Players

Basler
Cognex
Keyence
Teledyne
Hikvision

Other Key Players

Ambarella
Sony
OMNIVISION
Qualcomm
Texas Instruments
MVTec
Omron
SICK
Baumer
IDS Imaging
Allied Vision
Dahua Technology
Hanwha Vision
e-con Systems
Framos

Recent Developments

MARCH 2026

Cognex Releases Camera With On-Device Model Retraining Capability

Cognex released an embedded camera supporting model refinement using examples captured on the line itself, addressing the training data gap that causes deployments to fail on production cases nobody could have anticipated beforehand. Refinement runs without returning captured images to any external environment. Operators approve each refinement.
Signal: On-device retraining attacks the training data problem that laboratory demonstrations consistently fail to reveal in advance.
SEPTEMBER 2025

Ambarella Signs Supply Agreement With Warehouse Robotics Manufacturer

Ambarella entered a supply agreement providing vision processors for a warehouse robotics manufacturer, specified around power budget and dynamic scene handling rather than around the resolution that fixed industrial inspection prioritises. Vibration tolerance and thermal envelope formed part of the selection criteria. Power budget was the binding constraint.
Signal: Mobile machine specifications differ enough that fixed inspection products lose these awards on outright suitability grounds.
MAY 2025

Teledyne Acquires Embedded Vision Specialist For Automotive Programmes

Teledyne completed an acquisition of an embedded vision company holding automotive quality systems and functional safety documentation, opening interior monitoring programmes that industrial vision suppliers cannot bid for without those credentials. Existing platform relationships transferred alongside the qualification credentials. Programme cycles run several years before revenue arrives.
Signal: Automotive credentials are being acquired because building them internally takes far longer than the opportunity allows.

What These Cameras Cost To Build

Three inputs dominate manufacturing cost. Image sensors and vision processors run 40% to 48% of cost of goods sold, which is unusually concentrated and leaves little room at delivered prices near USD 214. Optics, housings, and connectors take 18% to 24%. Calibration, test, and application qualification add 10% to 16%, higher than conventional cameras because each device is verified against its application.
Image sensor pricing tightened through 2024 and 2025 as capacity was directed toward higher volume consumer and automotive applications, and SEMI materials data documents the underlying supply position. Several suppliers described the resulting margin pressure in their annual reports for those years, with industrial volumes too small to command priority allocation when specialty capacity became constrained. Allocation went to consumer and automotive volumes instead. Industrial volumes commanded no priority.

The competitive disadvantage mechanism runs through application engineering rather than through components. A supplier without library capability leaves integrators solving each problem from first principles, which extends deployments and produces failures the camera gets blamed for. Exposure varies by supplier type. Specialists amortise application libraries across thousands of deployments. Component-led suppliers ship capable hardware into projects nobody has the tools to complete efficiently.
embedded-smart-cameras-market-cost-volatility-analysis-1790008886623

Build Configurable Application Libraries Not Raw Capability

Integrators solving each inspection problem from first principles extend deployments and generate failures attributed to the camera. Packaging accumulated application knowledge as configurable tools rather than as programmable capability shortens installations materially and is the part of machine vision that a reference design and a sensor genuinely cannot replicate. Deployment duration falls substantially. Failures fall alongside.

Qualify Second Image Sensor Sources Early

Industrial volumes are too small to command priority allocation when specialty sensor capacity tightens, and requalifying mid-lifecycle disrupts customers who validated an application against specific imaging behaviour. Carrying a second qualified sensor from the outset costs money against no immediate return and protects supply when allocation decisions go elsewhere. Customers validated applications against specific imaging behaviour.

Share Processing Platforms Across Application Families

Industrial, robotics, and analytics cameras differ in housing, optics, and interface far more than in processing requirement. A common processing platform across families concentrates the dominant component purchase, simplifies model portability for customers, and spreads qualification cost across substantially more shipped units. Model portability improves for customers at the same time, which matters when applications move between lines.

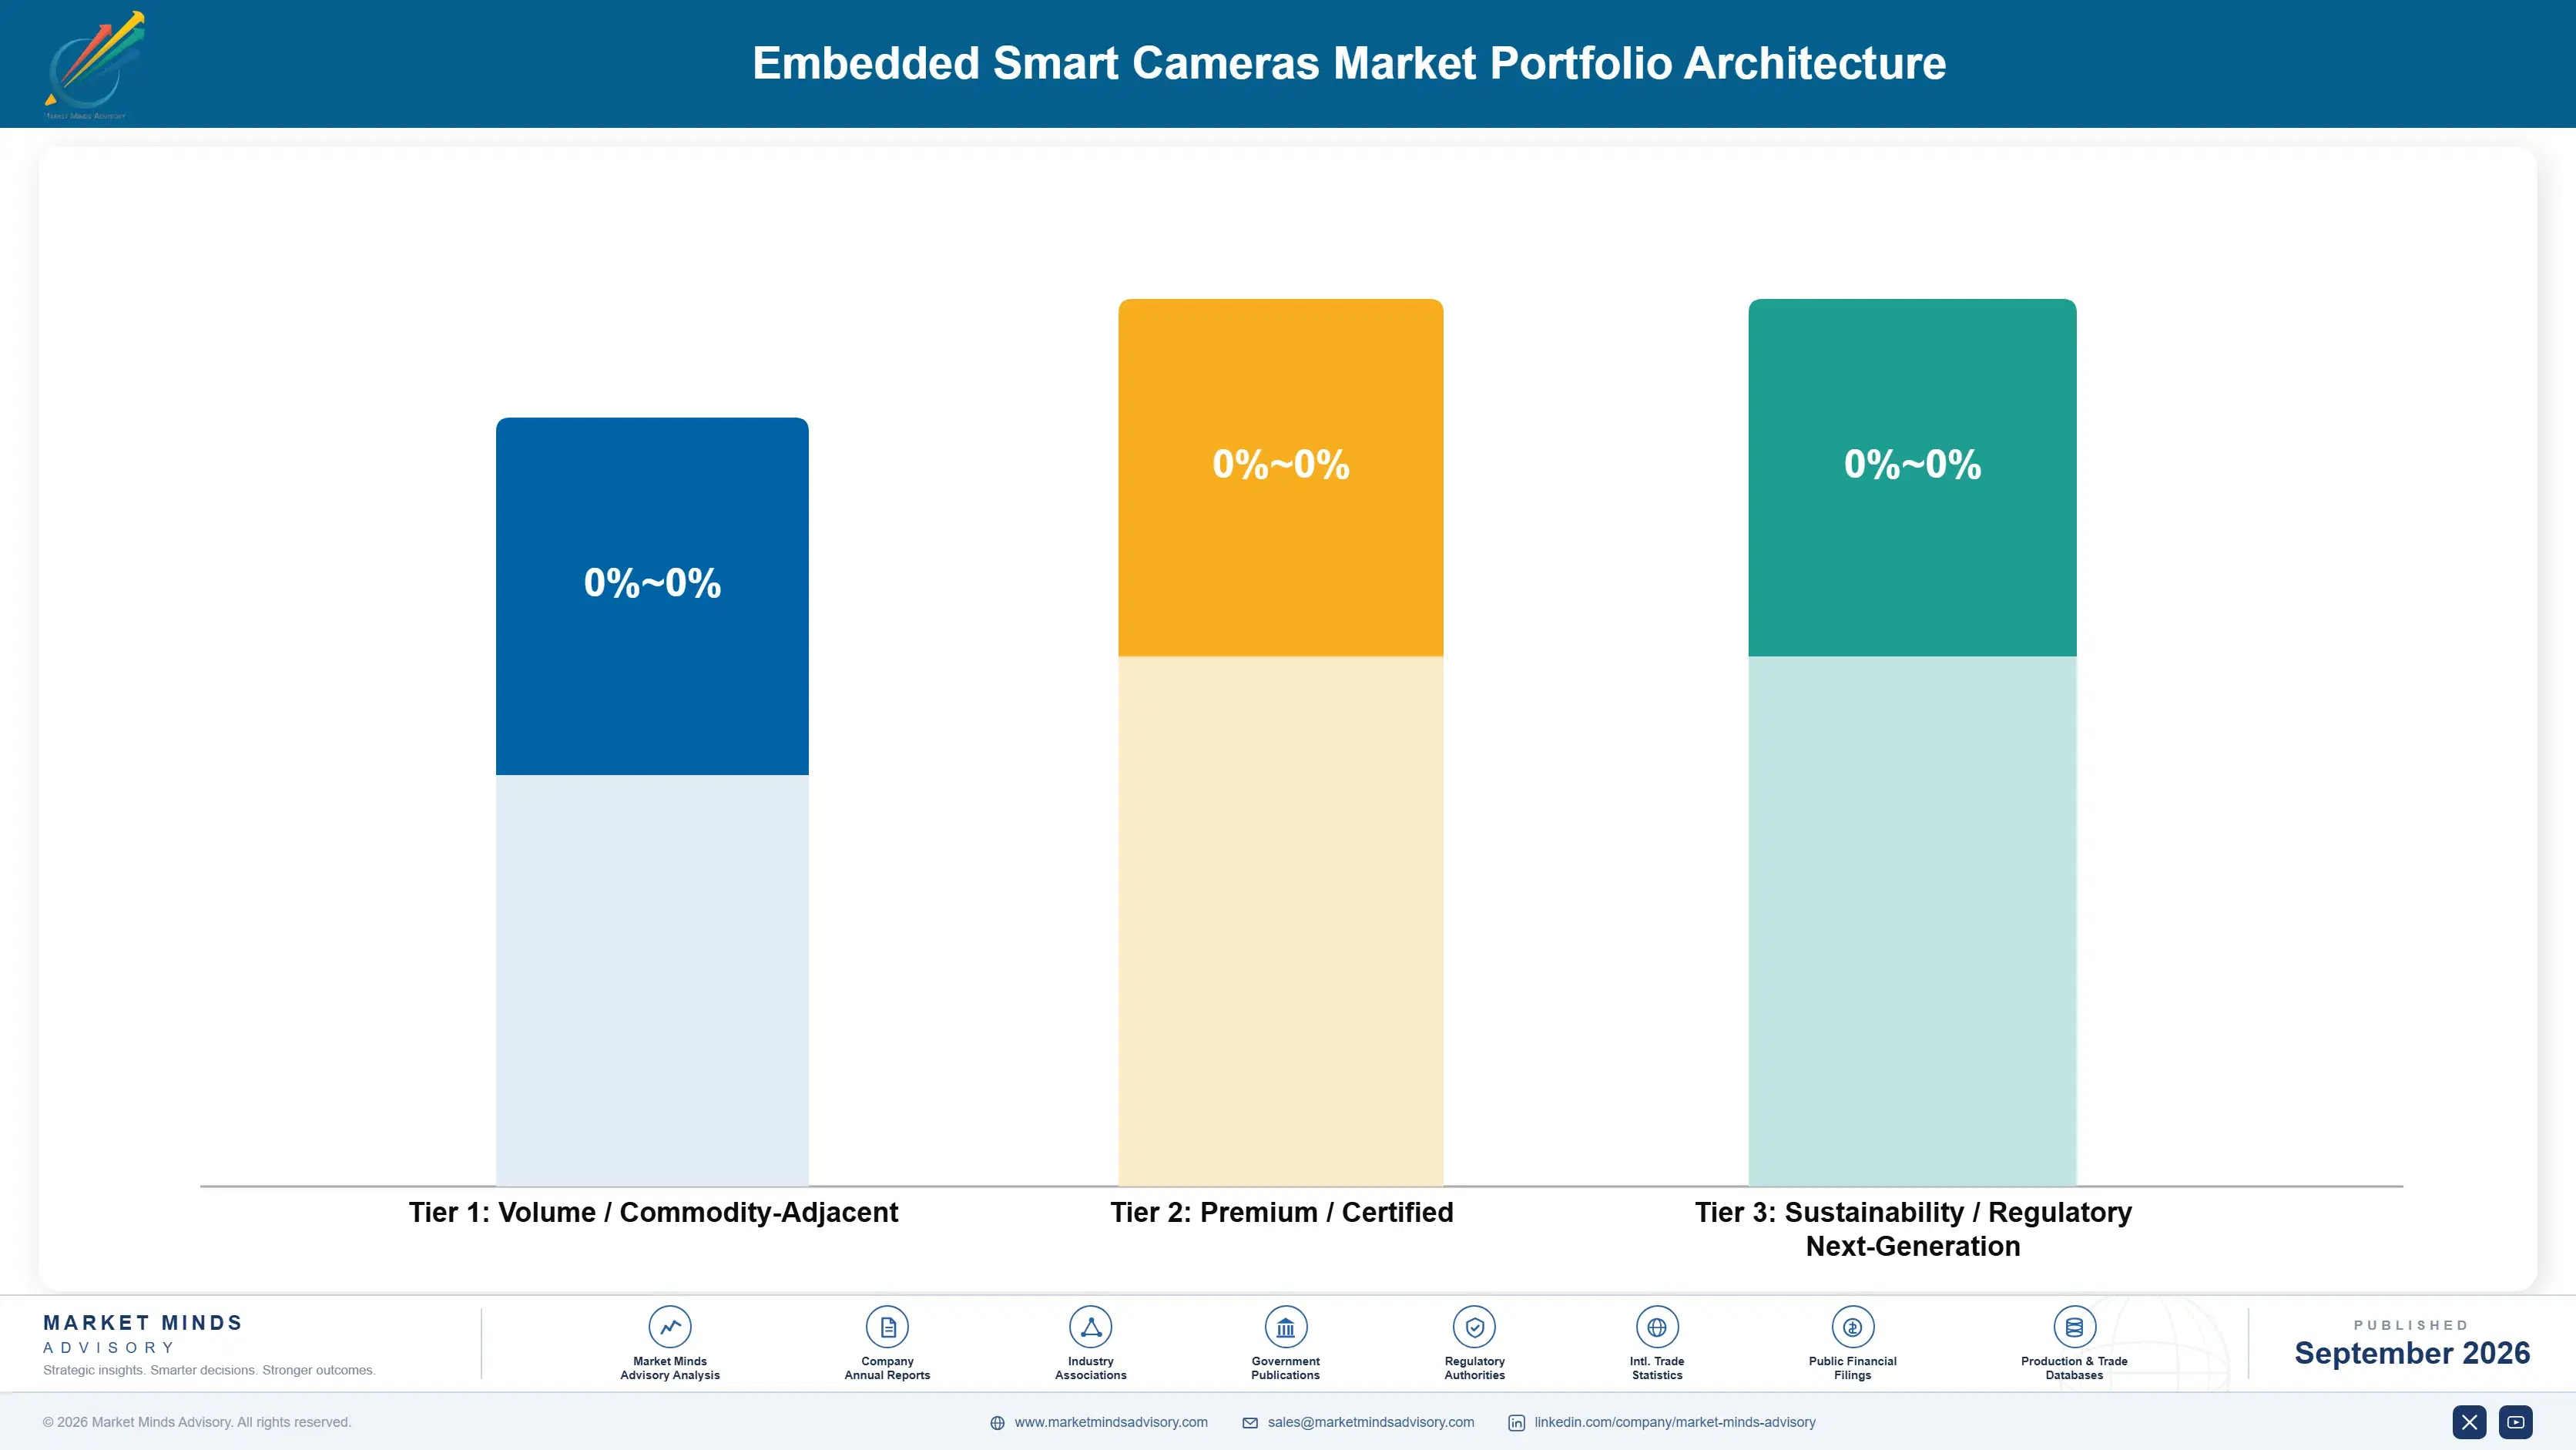
Portfolio Architecture for Margin Defence

Margin follows how much of the deployment problem the supplier takes on. Cameras sold as components into projects somebody else completes are close to commodity, particularly where reference designs let anybody assemble comparable hardware. Application library capability earns considerably more. Complete deployments including lighting, mounting, and commissioning earn most, because they address the 73% of project cost the camera does not. Deployment ownership sets the whole ladder.
The tension between volume and premium runs through automotive. Interior vision programmes deliver volumes no industrial application approaches, at prices reflecting an obligated buyer and margins to match, while industrial deployments carry far better margin on small quantities. A supplier cannot optimise for both without separating the operations, and several have discovered that the hard way. Several suppliers discovered that the hard way.

High-value pools concentrate where failure has a specific cost and the supplier can prevent it: precision inspection in aerospace, medical device, and semiconductor manufacture, robotics where the machine cannot function without vision, and complete deployments where somebody owns the outcome. These share a buyer purchasing a working system. Elsewhere the product is a camera, and cameras assembled from reference designs are increasingly interchangeable.

Volume / Commodity-Adjacent

Cameras sold as components into projects completed by somebody else, increasingly matched by hardware assembled from published reference designs. Detection performance depends on training data the supplier does not hold. The ten-point range reflects sensor sourcing and manufacturing scale differences between suppliers.
Gross Margin: 22% to 32%

Premium / Certified

Cameras supplied with configurable application libraries that let integrators solve inspection problems without building from first principles. Accumulated deployment knowledge cannot be replicated from a reference design. The eleven-point range separates suppliers with deep libraries from those shipping programmable capability alone.
Gross Margin: 44% to 55%

Sustainability / Regulatory / Next-Generation

Complete deployments including lighting, mounting, commissioning, and staged training data accumulation, plus automotive programmes requiring quality systems and functional safety documentation. Each addresses cost the camera does not. The twelve-point range reflects how differently suppliers price application engineering across markets.
Gross Margin: 56% to 68%
embedded-smart-cameras-market-portfolio-architecture-1790008887126

High-value Sub-segments and Strategic Watch-out

Complete Deployment Delivery

Highest value, addressing the 73% of project cost the camera does not represent and removing the deployment variability integrators introduce. Requires application engineering capability component suppliers deliberately avoided building. The twelve-point range reflects how differently that engineering is priced across regions. Outcome ownership is the product.
Gross Margin: 58% to 70%

Robotics And Mobile Machine Vision

Fastest growth at 21.3%, where on-board interpretation is a requirement rather than an optimisation because latency and connectivity fail when it matters. Specification differs enough that fixed inspection products are unsuitable rather than merely uncompetitive across these applications. Latency decides the architecture entirely. Suitability rather than price.
Gross Margin: 48% to 58%

Automotive Interior Vision Programmes

Growing at 18.2% on regulatory obligation rather than demand, with contract values 8 to 14 times a typical industrial award. Pricing reflects an obligated buyer and margins are correspondingly thin. Quality systems and functional safety documentation close the segment to most suppliers. Volumes justify the investment.
Gross Margin: 26% to 36%

Component Camera Supply

The strategic watch-out. Published reference designs let anybody assemble comparable hardware, and detection performance depends on data the supplier does not hold. The twelve-point range reflects manufacturing scale differences that do not change the direction of pricing at all. Interchangeability keeps increasing. Data stays with customers.
Gross Margin: 18% to 30%

How Installations Generate Revenue

Revenue arrives with a line build and then largely stops, since a working inspection installation runs for as long as the line does and nobody replaces cameras that are performing. That makes demand follow capital construction rather than the installed base, and it means suppliers forecasting from manufacturing sector size rather than from new capacity announcements consistently overestimate what is available to them.
Commitment depth varies by how much the supplier did. A camera sold as a component carries no relationship at all once installed, and the next line may specify anybody. A complete deployment including application configuration, lighting design, and accumulated training data creates dependency that survives the original project team leaving. Automotive programmes are the most locked, since requalifying a component mid-platform is not realistically available.

The decision maker sits earlier than suppliers reach. Plant engineering evaluates cameras after a line is designed, by which point mounting positions and lighting are fixed and the specification has narrowed. Machine builders and engineering contractors decide during design, months earlier, and rarely appear on a camera supplier's customer list at all. That gap explains a great deal of misdirected sales effort in this category.
embedded-smart-cameras-market-end-use-penetration-index-1790008887618

Where This Market Rewards

These are among the four positions where our research anticipates prominent divergence between winners and laggards over the coming forecast period. Each is grounded in the demand model, the regulatory perimeter, and the announced capacity pipeline.
01 / DEPLOYMENT SCOPE OWNERSHIP

Lighting costs more than the camera does

Illumination and mounting consume 34% of deployment cost against 27% for the camera, and integrators quote that larger portion with almost no scrutiny from a buyer who negotiated the device hard. Suppliers offering integrated lighting, mounting, and installation guidance capture project revenue 2.3 times the camera value while removing the largest source of deployment variability. It needs application engineering that component suppliers deliberately chose not to build, which is precisely why the position remains open to anybody willing to build it.
02 / TRAINING DATA REALISM

Demonstrations pass; production cases nobody photographed fail

About 3.1% of production cases fail because no comparable examples existed to train against, and that data belongs to the customer, accumulates slowly, and helps no other deployment anywhere. Suppliers structuring an explicit data gathering phase before production acceptance report success rates 2.8 times higher than those going straight to commitment. Customers accept a slower start once the reason is explained, and blame the system otherwise, months after everybody signed the acceptance certificate, when nobody is prepared for the conversation.
03 / DESIGN STAGE ACCESS

Retrofit costs 4.6 times what design specification does

Adding vision to a running line means creating mounting positions, lighting, and machine interfaces that were never designed for it, which is why growth follows new capacity construction rather than the size of any manufacturing base. Suppliers working with machine builders and engineering contractors during line design win 3.6 times more deployments than those approaching plants after commissioning. The engagement is early, unfunded, and requires reading a layout rather than a specification, which is unfamiliar work for a distribution led organisation.
04 / AUTOMOTIVE CREDENTIAL INVESTMENT

Interior vision is closed without quality systems

Occupant monitoring obligations attach vision to vehicle interiors regardless of manufacturer preference, producing volumes no industrial application approaches, and the segment is entirely closed to suppliers lacking automotive quality systems, functional safety documentation, and multi-year programme capacity. Industrial vision companies hold none of these naturally. Those who acquired them win contracts 8 to 14 times larger than typical industrial awards, at margins that reflect an obligated buyer with no realistic alternative supplier once a platform is qualified and shipping for years.

Engagement Snapshot From the Field

A live engagement with an industry participant carrying material or product regulatory and market exposure ahead of a defining policy shift, showing how our research translates into a defensible multi-year portfolio strategy.
MARKET MINDS ADVISORY · CLIENT ENGAGEMENT SUMMARY
Embedded Smart Cameras Producer Strategic Portfolio Review and Transition Roadmap 2026·Investment Scenario on Embedded Smart Cameras Exposure Evaluation 2025-26
CLIENT PROFILE
An electronics contract manufacturer operating eleven plants across four countries with annual revenue above USD 8.4 billion (client-reported, unverified by MMA). Embedded vision inspection had been deployed on 34 production lines over three years, with results described internally as inconsistent, and a further 60 lines were planned across new capacity being built in Vietnam and India.
STRATEGIC CHALLENGE
Deployment outcomes varied enormously between plants using identical cameras, which nobody could explain, and two installations had been abandoned entirely after failing to detect defect types that appeared months into production. Procurement had standardised on camera specification and treated everything else as an integrator matter. Lighting had never been competitively quoted anywhere.
MMA APPROACH
MMA compared deployment outcomes against installation conditions rather than against equipment specification, decomposed project cost across camera, lighting, mounting, and commissioning, and traced the abandoned installations back to establish whether the failures were equipment, integration, or training data related in origin. New line and retrofit costs were compared directly. Lighting quality was assessed per plant.
KEY FINDINGS
  1. Deployment outcomes correlated almost entirely with lighting design quality and not at all with camera specification, across plants using identical equipment from the same supplier.
  2. Both abandoned installations failed on defect types absent from the training set at commissioning, which no camera specification could have prevented in any circumstance.
  3. Cameras represented 24% of deployment cost while lighting and mounting took 37%, and the larger portion had never been competitively quoted at any plant.
  4. New line deployments cost roughly a fifth of retrofit installations for equivalent inspection capability, which the capital planning process had not reflected at all.
CLIENT PROFILE
An electronics contract manufacturer operating eleven plants across four countries with annual revenue above USD 8.4 billion (client-reported, unverified by MMA). Embedded vision inspection had been deployed on 34 production lines over three years, with results described internally as inconsistent, and a further 60 lines were planned across new capacity being built in Vietnam and India.
STRATEGIC CHALLENGE
Deployment outcomes varied enormously between plants using identical cameras, which nobody could explain, and two installations had been abandoned entirely after failing to detect defect types that appeared months into production. Procurement had standardised on camera specification and treated everything else as an integrator matter. Lighting had never been competitively quoted anywhere.
MMA APPROACH
MMA compared deployment outcomes against installation conditions rather than against equipment specification, decomposed project cost across camera, lighting, mounting, and commissioning, and traced the abandoned installations back to establish whether the failures were equipment, integration, or training data related in origin. New line and retrofit costs were compared directly. Lighting quality was assessed per plant.
KEY FINDINGS
  1. Deployment outcomes correlated almost entirely with lighting design quality and not at all with camera specification, across plants using identical equipment from the same supplier.
  2. Both abandoned installations failed on defect types absent from the training set at commissioning, which no camera specification could have prevented in any circumstance.
  3. Cameras represented 24% of deployment cost while lighting and mounting took 37%, and the larger portion had never been competitively quoted at any plant.
  4. New line deployments cost roughly a fifth of retrofit installations for equivalent inspection capability, which the capital planning process had not reflected at all.
RECOMMENDED STRATEGY
Phase 1: Phase one: specify lighting design and mounting to a documented standard across all plants, and tender that scope competitively rather than accepting integrator quotations. Phase 2: Phase two: require a documented data accumulation period before production acceptance on every new deployment, rather than accepting laboratory demonstration as evidence. Phase 3: Phase three: specify inspection at line design stage for all new Vietnamese and Indian capacity, rather than treating it as a post-commissioning addition.
OUTCOME
Deployment success on the first twelve new capacity installations reached eleven of twelve, against roughly half historically (client-reported, unverified by MMA). Total cost per inspected line fell 29% once lighting was competitively tendered. Neither of the two subsequent deployments required post-commissioning rework. Lighting standards were adopted across every plant in the group.

Frequently Asked Questions

Foundational context covering the market sizes, CAGR, scope, country, region and competition that inform every finding below. This section is provided to cover basics and most often pre-purchase conversations, answered from the MMA Primary Research Dataset.

What is the current size of the Embedded Smart Cameras Market?

The market was worth USD 5.2 billion in 2025 and reaches USD 5.9 billion in 2026. Value covers cameras with integrated processing that output decisions rather than video.

How large will the Embedded Smart Cameras Market be by 2036?

MMA forecasts USD 22.3 billion by 2036, an increase of USD 16.4 billion across the forecast period. That represents 3.78 times the 2026 base of USD 5.9 billion.

What is the CAGR for the Embedded Smart Cameras Market 2026 to 2036?

The base case compound annual growth rate is 14.2%, with a bull case at 15.5% and a bear case at 12.9%. Historical growth from 2020 to 2025 ran at 12.8%.

Which segment is growing fastest?

Robotics and autonomous machine vision grows at 21.3%, half again the market rate of 14.2%. Machines in motion cannot wait for an answer from elsewhere.

Who are the major companies in the Embedded Smart Cameras Market?

Basler, Cognex, Keyence, Teledyne, and Hikvision lead the field, holding 38% of shipment value between them. Processor reference designs are lowering the assembly barrier considerably.

Which country is growing fastest?

Vietnam grows at 19.6%, because the manufacturing capacity being built there now specifies embedded vision at design stage, where retrofitting an existing line never would.

Report Segmentation Architecture

The full report scope spans multiple orthogonal segmentation dimensions, with cross-tabulated demand data provided for each dimension pair. Coverage extends further to regional breakdowns, trend trajectories, and the competitive detail needed to support segment-level decision-making.

By Application Context

  • Industrial Machine Vision Cameras
  • Security and Access Edge Cameras
  • Retail and Space Analytics Cameras
  • Robotics and Autonomous Machine Vision
  • Automotive Interior and Auxiliary Vision
  • Agricultural and Field Inspection Cameras

By End-Use Industry

  • Electronics and Semiconductor Manufacturing
  • Automotive and Component Production
  • Logistics, Warehousing and Fulfilment
  • Food, Beverage and Pharmaceutical Processing
  • Agriculture and Protein Production
  • Retail, Transport and Public Spaces

By Commercial Dimension

  • Machine Builder Integrated Supply
  • Systems Integrator Delivered
  • Direct Plant Procurement
  • Automotive Programme Award
  • Industrial Distribution Channel
  • Complete Deployment Contract

By Region

  • East Asia
  • North America
  • Western Europe
  • South Asia and Pacific
  • Latin America
  • Middle East and Africa
  • Eastern Europe

Scope, Methodology, and Coverage

Every figure in this report is reproducible from documented input assumptions. The scope below maps the historical period, the forecast horizon, the segmentation dimensions, and the countries covered, alongside the underlying primary and qualitative methodology.
Historical Period
2020 to 2025
Forecast Period
2026 to 2036
Base Year
2025 (USD billions; MMA Primary Research Dataset, September 2026)
Market Definition
This market covers camera devices with integrated processing that output decisions or structured data rather than raw video, including industrial machine vision cameras, security and access edge cameras, retail and space analytics cameras, robotics and autonomous machine vision, automotive interior and auxiliary vision, and agricultural and field inspection cameras. It excludes conventional surveillance cameras without on-device analysis, image sensors sold as components, consumer devices, and centralised video analytics software.
Quantitative Units
USD billions, delivered shipment value
Segmentation Dimensions
Application context, end-use industry, commercial dimension, region
Regions Covered
East Asia, North America, Western Europe, South Asia and Pacific, Latin America, Middle East and Africa, Eastern Europe
Countries Covered
China, Japan, South Korea, Taiwan, United States, Canada, Mexico, Germany, Italy, France, Switzerland, Netherlands, Sweden, United Kingdom, Vietnam, India, Thailand, Malaysia, Indonesia, Australia, Brazil, Chile, Peru, Saudi Arabia, United Arab Emirates, South Africa, Poland, Czechia, Slovakia, Hungary
Key Companies Profiled
Basler, Cognex, Keyence, Teledyne, Hikvision, Ambarella, Sony, OMNIVISION, Qualcomm, Texas Instruments, MVTec, Omron, SICK, Baumer, IDS Imaging, Allied Vision, Dahua Technology, Hanwha Vision, e-con Systems, Framos
Quantitative Methodology
Primary survey, n=3,800 respondents, Q4 2025, six countries; demand-side model with trade association cross-validation
Qualitative Methodology
47 expert interviews, Q4 2025; applied to validate demand model assumptions, identify emerging dynamics, and assess competitive positioning
Report Format
PDF and XLSX data workbook (Word format preview document)
Publisher
Market Minds Advisory
Report Code
MMA-2026-TEC-631
Published
September 2026
Contact
sales@marketmindsadvisory.com | www.marketmindsadvisory.com

Purchase the full Embedded Smart Cameras Market Report (2026 to 2036).

The full report sizes the embedded smart camera market across six application contexts, seven regions, and thirty countries, with forecasts to 2036 under base, bull, and bear cases. It examines why the camera represents roughly a quarter of deployment cost, how training data availability rather than sensor quality decides field performance, and why retrofit economics tie growth to new capacity construction. Competitive analysis covers twenty participants evaluated consistently on shipment value, with detailed treatment of application libraries and automotive qualification barriers. Cost structure, margin architecture by application, and regional deployment drivers are analysed in full. Primary research includes 3,800 survey responses and 47 expert interviews.
Six application contexts sized and forecast separately
Twenty participants evaluated on delivered shipment value
Regional deployment and construction drivers across seven geographies
Margin architecture by application and deployment scope
Deployment cost decomposition beyond camera pricing analysed
Retrofit versus design stage cost benchmarking with plant evidence

Built For The People Who Decide

From boardroom strategy to bench-side execution, this report is read cover-to-cover by leaders shaping the next decade of their industry, turning demand scenarios, market dynamics and valuation benchmarks into decisions.
CXOs/ Presidents/ VPs/ Managers
M&A and Corporate Development
Strategy Teams and R&D Heads
Procurement and Product Directors
Regulatory and Compliance Leaders
Investor Relations and Equity Analysts