Market Minds Advisory
Electronic Paper Display (EPD) Market

Electronic Paper Display (EPD) Market: Retail Shelf Labels Overtake E-Readers as the Core Growth Engine

Grocery chains replacing paper price tags with electronic shelf labels are pulling panel demand away from the e-reader category that first brought electronic paper display technology directly to mainstream consumers.

Lead Analyst

Published

September 2026

Make Smarter Decisions with Customized Research Insights

Request a free sample report and evaluate market opportunities, growth trends, and competitive dynamics relevant to your business needs.

2025 MARKET VALUE$1.9BMarket Size 2025
2036 FORECAST VALUE$4.8BBase Case , 2026 to 2036
CAGR 2026 TO 20369.0 %Bull 10.3% / Bear 7.8%
INCREMENTAL OPPORTUNITY$2.8BNet 10- year value creation
EXPANSION MULTIPLE2.37x2036 value over 2026 base
Strategic Levers
M&A Pipeline
Regional Outlook
Country Rankings
Competitive Intelligence
Segmental Deep-dive
Call-Us : 91 93563 13602

Executive Snapshot and Market Trajectory.

Grocery chains replacing paper price tags with electronic shelf labels are pulling panel demand away from the e-reader category that first brought electronic paper display technology to mainstream consumers over a decade ago. Both established panel makers and system integrators are racing to define the category's next growth chapter.
Taiwan's E Ink Holdings supplies nearly all electronic paper panels sold worldwide, giving East Asia an outsized manufacturing role even as retail electronic shelf label deployment concentrates heavily in European and North American grocery chains. Electronic shelf labels are expanding fastest as retailers seek centralised, instant price updates across thousands of stores, a labour and pricing accuracy benefit that has made the technology increasingly standard.
Competitive intensity concentrates around E Ink's near-monopoly on panel manufacturing and a handful of system integrators competing to win large retail deployment contracts, led by VusionGroup's installed base built through years of European grocery chain relationships. Colour electronic paper technology is maturing quickly enough to open genuine new signage and retail applications that monochrome displays could never credibly serve, creating a real growth avenue that extends well beyond the mature e-reader category today.
Market Definition
This market covers reflective electronic paper display panels and modules used in e-readers, electronic shelf labels, digital signage, and related low-power display applications. It excludes conventional LCD and OLED display panels and general-purpose smartphone or tablet screens using emissive display technology.
Base Year Value
$1.9B in 2025 (MMA Primary Research Dataset, September 2026)
Forecast Period
2026 to 2036, eleven discrete annual values
CAGR
9.0% base case. Bull 10.3%. Bear 7.8%.
Fastest Growth Segment
Electronic Shelf Labels: 16.0% CAGR
Fastest Growth Country
China: 11.5% CAGR
Fastest Growth Region
South Asia and Pacific: 11.2% CAGR
Largest Region
East Asia: 30% of 2025 global value
Market Leaders
E Ink Holdings, VusionGroup, Pricer, Hanshow Technology, Displaydata. Source: MMA Analysis based on company annual reports and investor filings.
Primary Survey
n=3,800 procurement and R&D decision-makers, Q4 2025, six countries
Methodology
Demand-side build-up, cross-validated against public data, 47 expert interviews

Electronic Paper Display (EPD) Market Forecast Scenarios

electronic-paper-display-epd-market-size-forecast-scenario-1790002266168
Between 2020 and 2025, the market grew steadily as grocery retailers accelerated electronic shelf label rollouts to reduce labour costs and improve pricing accuracy, even as e-reader unit sales plateaued in most developed markets following the category's initial adoption wave a decade earlier. Recovery patterns varied by category, with electronic shelf label rollouts accelerating faster than e-reader replacement demand.
The base case assumes continued electronic shelf label expansion into new retail categories and geographies, steady colour panel adoption in signage and specialty retail applications, and stable e-reader replacement demand from an established installed base. These three mechanisms together explain most of the forecast expansion, with electronic shelf labels contributing the largest incremental share as retailers move from pilot deployments to full-store and full-chain rollouts. Suppliers that fail to capture this rollout wave early risk permanently ceding ground to faster-moving competitors.
A bull scenario centres on faster-than-expected colour panel adoption opening genuinely new signage and packaging applications beyond current use cases. The principal bear risk is a prolonged retail capital expenditure slowdown delaying electronic shelf label rollouts, which would compress the segment currently driving most of the market's forecast growth, reshaping how suppliers allocate research investment.

Where Panel Demand Is Actually Concentrating

Three forces are converging on electronic paper panel demand simultaneously. Retailers want instant, centralised price updates that eliminate manual label changes across thousands of stores, signage operators want colour capability that monochrome panels never offered, and e-reader manufacturers want continued sensor and refresh rate improvements that justify occasional device upgrades among an already saturated customer base. These pressures rarely align neatly, forcing suppliers to balance retail scale against genuine technology differentiation simultaneously.
MARKET CONCENTRATIONCR5 78%top suppliers hold an extraordinarily dominant combined share
AVERAGE PANEL PRICEUSD 8.40reflects continued economies of scale in manufacturing overall
LEADING COUNTRY SHARETaiwan 21%largest single national panel manufacturing base by far
ELECTRONIC SHELF LABEL PENETRATION24%still leaves considerable retail conversion opportunity available today
COLOUR PANEL ATTACH RATE16%growing steadily as manufacturing quality keeps maturing further
AVERAGE PANEL LIFESPAN8 yearsextending gradually as component durability keeps improving steadily
Commercially, this market behaves like a specialised component supply chain rather than a broad consumer electronics category: E Ink's panel manufacturing sits upstream of dozens of device and system integrators who compete on software, deployment services, and retail relationships rather than on the underlying display technology itself. Direct panel margin alone increasingly determines little about which suppliers actually capture the most durable retail relationships.
Over the next decade, expect electronic shelf labels to become the market's dominant revenue driver by a wide margin, as colour panel technology continues opening genuinely new applications beyond the mature and largely saturated e-reader category. Suppliers slow to develop colour capability risk losing the most lucrative signage contracts entirely to faster-moving competitors.
"Ten years ago this was an e-reader story, today it is entirely a grocery store story, and most people still have not noticed the shift."
Director, Display Components and Retail Technology Practice · MMA Technology / Display Components Practice · September 2026

Market Trends

Grocery Chains Move From Pilot to Full-Store Rollouts

Major grocery retailers that piloted electronic shelf labels in a handful of stores are increasingly committing to full-chain rollouts once pilot results demonstrate measurable labour cost savings and pricing error reduction. This shift from pilot to full deployment represents a meaningfully larger order volume per customer than the earlier pilot phase generated, changing how system integrators structure sales and installation teams to handle much larger single-customer projects. Retailers report that centralised price update capability alone often justifies the investment before accounting for secondary benefits like reduced labour hours and improved promotional pricing accuracy across every store in a chain.
Market Impact: Cuts labour hours 11 percent
Colour Panel Technology Opens New Signage Applications

Advances in colour electronic paper technology have narrowed the visual quality gap with conventional colour printed signage closely enough to open genuinely new retail and public information display applications that monochrome panels could never credibly serve. Signage operators increasingly specify colour electronic paper for applications requiring infrequent updates but meaningful visual impact, such as promotional displays and wayfinding signage, where the technology's near-zero standby power consumption delivers a genuine operating cost advantage over conventional backlit signage running continuously throughout business hours. Manufacturers report colour panel adoption keeps accelerating across nearly every commercial signage application.
Market Impact: Enables pricing across 24 percent

Market Opportunities and Growth Drivers

Retail Labour Cost Pressure Accelerates Shelf Label Adoption

Rising retail labour costs across most developed markets have made the manual labour required to update paper price tags increasingly expensive relative to the fixed cost of installing electronic shelf labels, shortening the payback period retailers use to justify the investment. Grocery chains report that electronic shelf labels eliminate a meaningful share of weekly staff hours previously dedicated to manual price tag changes, freeing staff for customer-facing tasks retailers increasingly prioritise as a genuine competitive differentiator against pure e-commerce alternatives. Analysts expect labour cost pressure to remain the category's most important driver.
Market Impact: Concentrates 78 percent in one vendor

Dynamic Pricing Strategies Require Centralised Label Control

Retailers increasingly want the ability to adjust pricing dynamically based on inventory levels, expiration dates, or demand patterns, a capability that paper price tags simply cannot support without impractical manual labour. Electronic shelf labels connected to centralised inventory and pricing systems let retailers implement these dynamic pricing strategies instantly across an entire store or chain, a capability retailers increasingly view as a genuine competitive necessity rather than an optional efficiency upgrade as e-commerce competitors already price dynamically as standard practice. Retailers expect dynamic pricing capability to keep expanding as e-commerce competition intensifies further.
Market Impact: Excludes 28 percent of smaller retailers

Market Restraints and Challenges

Single-Supplier Panel Dependence Creates Genuine Supply Risk

Nearly the entire industry depends on E Ink Holdings for electronic paper panels, creating genuine supply chain concentration risk that leaves device and system integrator manufacturers with little alternative sourcing option should E Ink experience a manufacturing disruption or capacity constraint. The root cause is E Ink's foundational patent position covering core electronic paper technology, which has discouraged meaningful alternative panel manufacturing investment from competitors over more than a decade of market development. Manufacturers are mitigating the risk by maintaining larger panel inventory buffers than they otherwise would for a less concentrated component supply chain.
Market Impact: Lifts rollout volume by 24 percent

High Upfront Cost Slows Smaller Retailer Adoption

Electronic shelf labels carry meaningfully higher upfront installation cost than continuing to use paper price tags, creating a genuine capital barrier for smaller independent retailers that lack the financing access and store count larger chains use to justify the investment more easily. The underlying cause is the per-shelf hardware and wireless network infrastructure cost required across an entire store, which scales with shelf count regardless of the retailer's overall revenue or margin structure. Manufacturers are mitigating the barrier by offering smaller modular deployment packages and financing options specifically designed for independent and regional retail chains.
Market Impact: Adds 19 percent colour demand
3 additional market trends, 4 additional growth drivers, and 2 additional restraints and challenges are covered in the full report. Contact sales@marketmindsadvisory.com to access the complete intelligence.

Segment CAGR and Growth Architecture

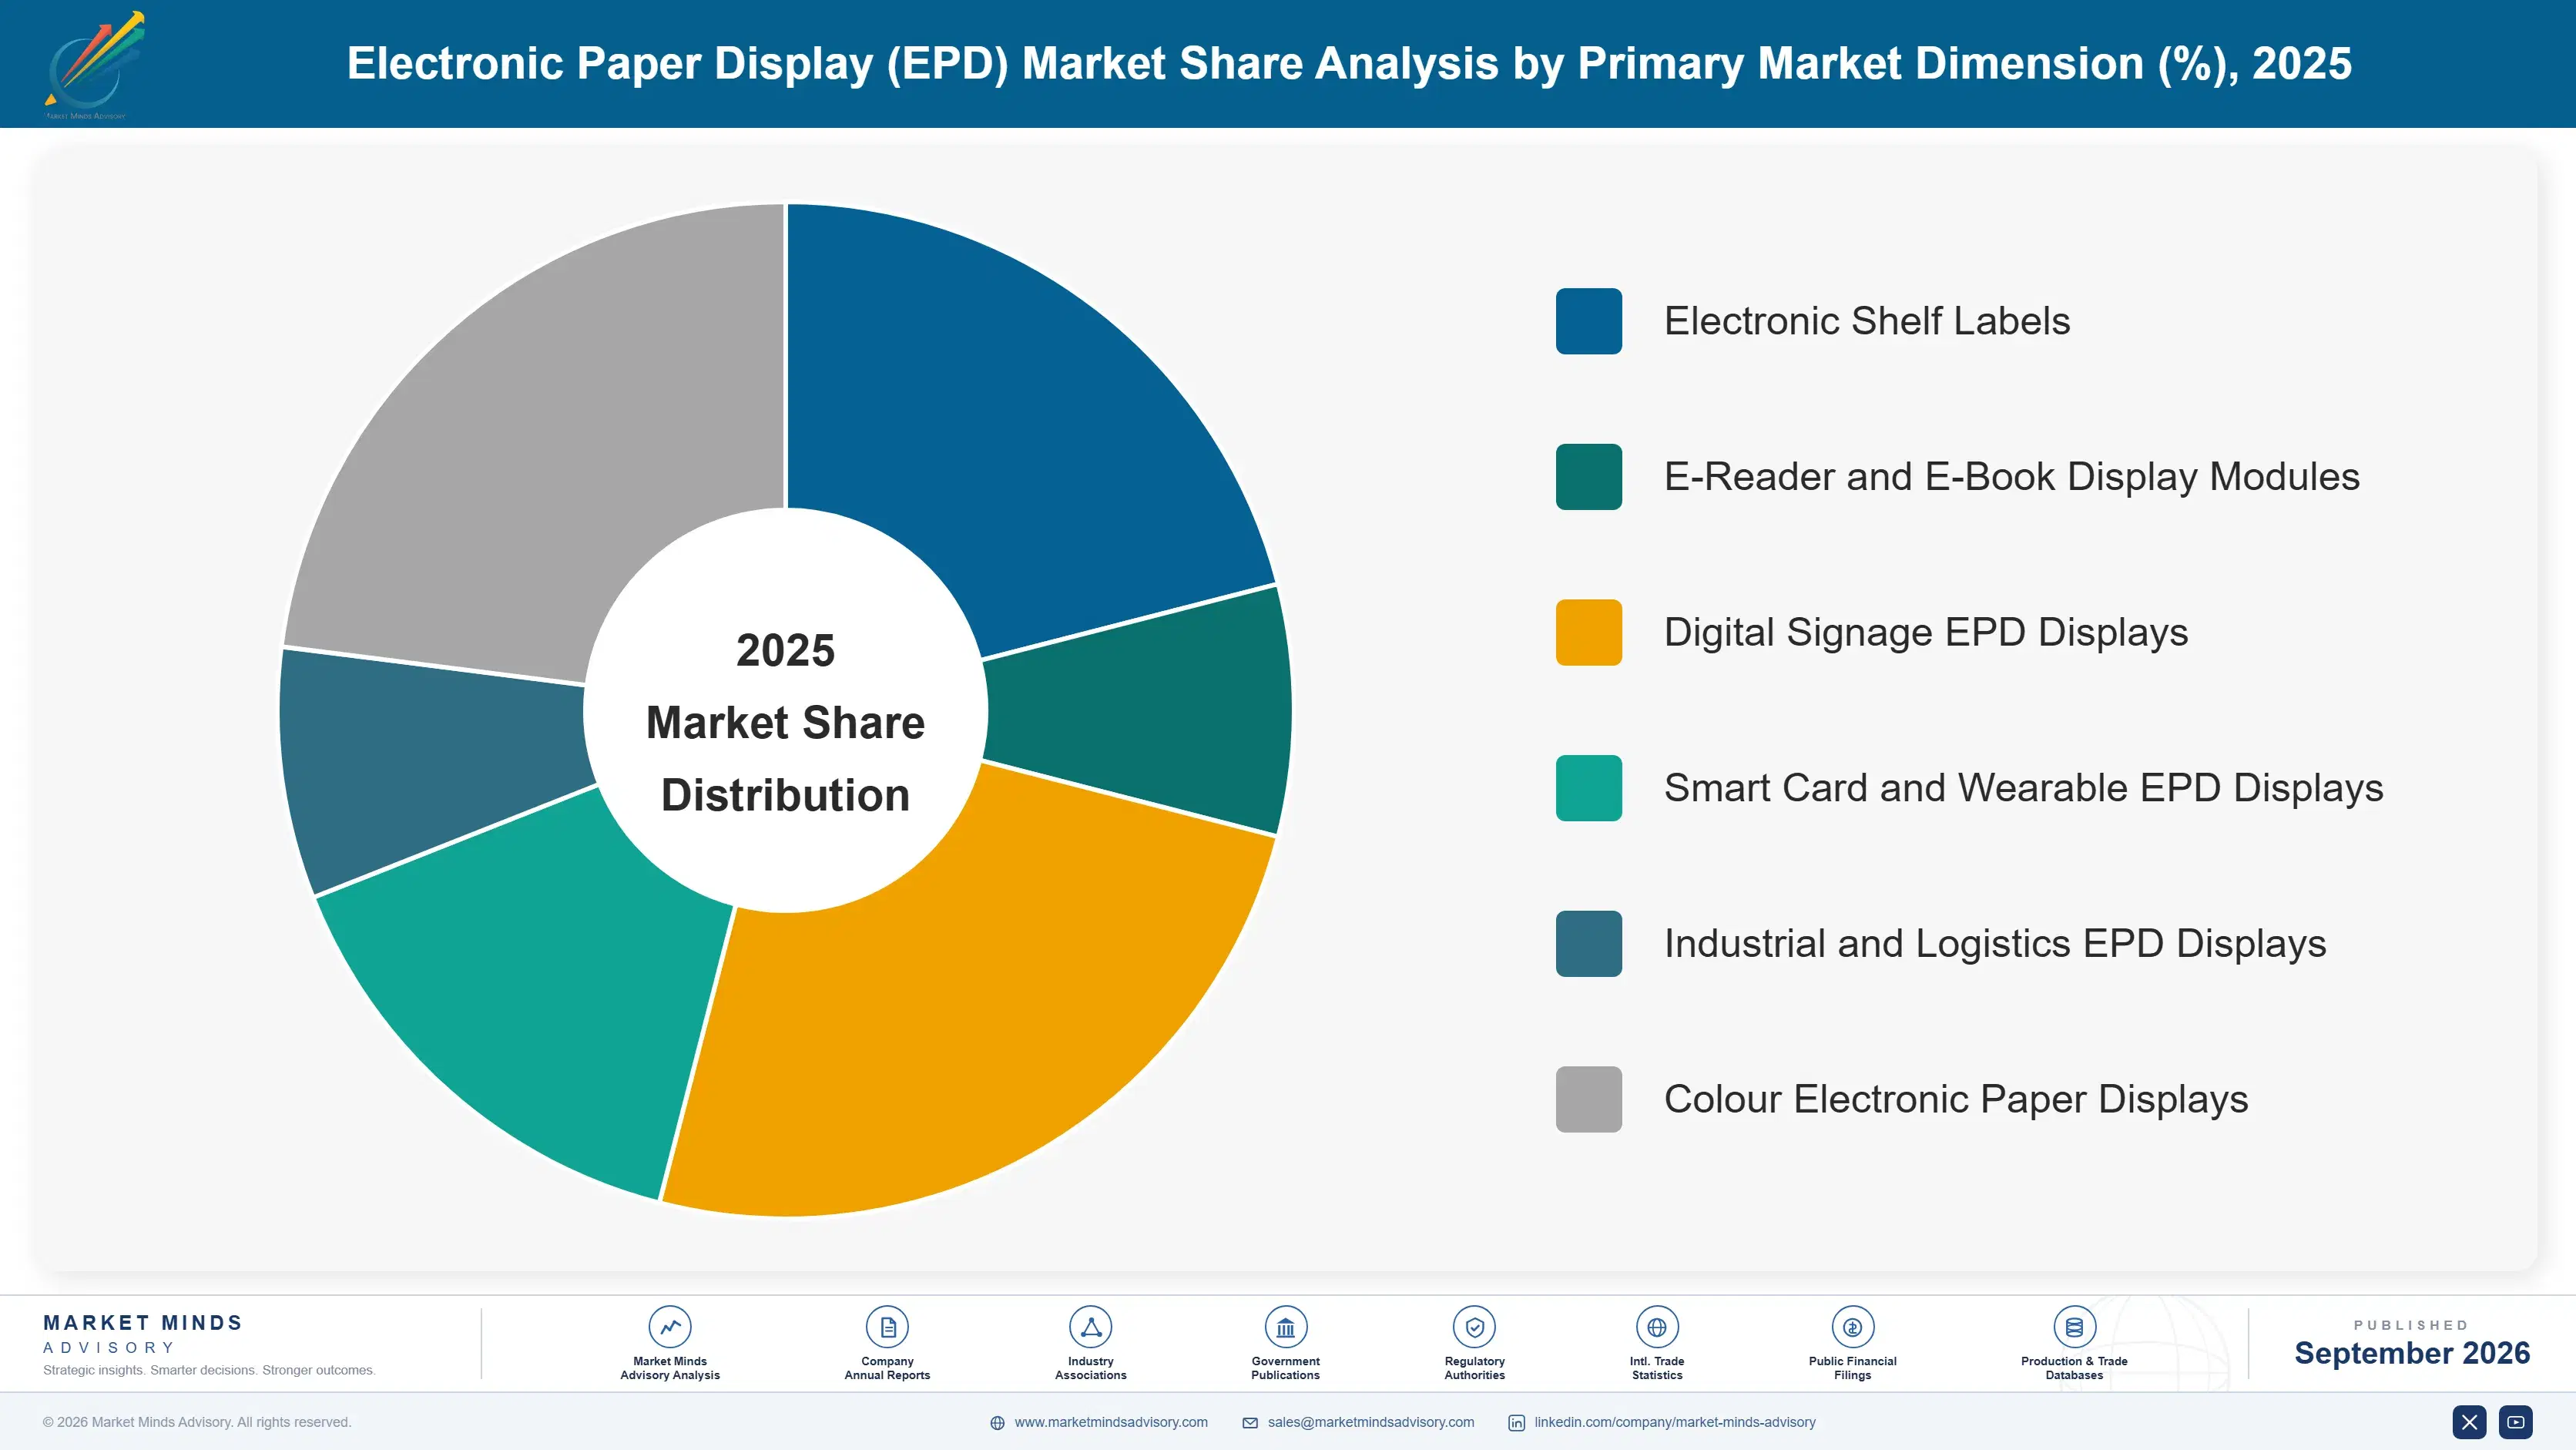
The market segments by end application rather than by panel size or resolution specification, since customers select primarily based on the deployment context, retail shelf, e-reader device, or signage installation, that determines which panel characteristics genuinely matter for that use case. Buyers evaluate primarily on deployment fit rather than general panel specifications alone in most cases.
electronic-paper-display-epd-market-market-share-analysis-1790002266749

Electronic Shelf Labels

This segment covers electronic paper panels deployed as retail price tags connected to centralised inventory and pricing management systems, replacing traditional printed paper labels. Demand has accelerated sharply as grocery chains move from pilot deployments to full-store and full-chain rollouts once measurable labour cost savings and pricing accuracy improvements are demonstrated. Adoption is concentrated among large grocery and pharmacy chains with the store count and capital budget to justify the upfront installation cost across an entire retail network. System integrators increasingly bundle wireless network infrastructure and inventory management software alongside the physical labels themselves, recognising that the labels alone represent only part of the total value proposition retailers actually purchase.
CAGR 16.0%

Colour Electronic Paper Displays

This segment covers electronic paper panels capable of displaying colour rather than traditional monochrome black and white, opening applications in signage, packaging, and specialty retail displays that monochrome panels could never credibly address. Growth is fastest as colour panel visual quality continues narrowing the gap with conventional printed and backlit colour signage, making the technology's near-zero standby power consumption a genuinely compelling advantage for applications requiring infrequent content updates. Adoption is concentrated among signage operators and specialty retailers seeking the operating cost benefits of electronic paper without sacrificing the visual impact colour delivers over monochrome alternatives. Adoption keeps expanding as manufacturers continue narrowing the visual quality gap with conventional printed signage.
CAGR 14.5%
Full segment breakdown across 6 segments available in the complete report.

Regional Architecture and Country Demand Map

East Asia anchors the market through Taiwan's dominant panel manufacturing base, while North America and Western Europe lead on electronic shelf label deployment across large grocery and pharmacy retail chains. Each region reflects a genuinely distinct combination of manufacturing scale and market deployment maturity today.

North America

United States grocery and pharmacy chains have accelerated electronic shelf label deployment considerably in recent years, driven by rising retail labour costs and growing recognition of the technology's centralised pricing control benefits across large store networks. Canadian retailers have followed a broadly similar adoption pattern at smaller absolute scale, purchasing largely the same system integrator platforms used by American chains. E-reader replacement demand remains steady across the region, supported by a large existing installed base that continues upgrading devices every several years as battery and display technology improves. Colour panel signage adoption has grown fastest among large format retailers seeking promotional display flexibility beyond what monochrome panels could ever deliver.
Share: 25% | CAGR: 9.5% (2026 to 2036)

Western Europe

France and Germany anchor the region's electronic shelf label adoption, reflecting VusionGroup's deep installed base built through years of relationships with major European grocery chains that pioneered the technology well ahead of North American retailers. United Kingdom retailers have followed a similar adoption pattern, though growth here trails the earliest-adopting continental European markets given a slightly later start to large-scale rollouts. Nordic countries show unusually high electronic shelf label penetration relative to store count, reflecting both high labour costs and a cultural comfort with retail technology adoption among the region's grocery chains. Growth here trails faster-expanding regions given the market's comparatively mature existing deployment base. Vendors expect this regional maturity to keep tempering growth relative to faster-expanding emerging markets.
Share: 22% | CAGR: 7.5% (2026 to 2036)
Regional intelligence for 5 additional markets available in the complete report: East Asia, South Asia and Pacific, Latin America, Middle East and Africa, Eastern Europe. Contact sales@marketmindsadvisory.com.
electronic-paper-display-epd-market-country-cagr-analysis-1790002267299

Where Suppliers Can Still Grow Beyond Panels

Suppliers expand revenue less through raising panel prices than through bundling deployment services and software platforms with hardware sales, since retailers increasingly evaluate total deployment value rather than shopping purely on per-label component cost. This shift matters increasingly as panel hardware alone commands shrinking margin across nearly every commodity price tier. across the entire supply chain.

Bundling Wireless Network Infrastructure With Labels

System integrators that bundle wireless network infrastructure installation alongside electronic shelf labels capture meaningfully higher total contract value than those selling labels alone, since retailers increasingly prefer a single accountable vendor for the entire deployment rather than coordinating separate hardware and network installation providers. This lever has become increasingly valuable as full-chain rollouts grow larger and more complex, giving integrators with proven network deployment capability a genuine advantage. VusionGroup's bundled approach has reportedly captured roughly 27 percent more total contract value than labels sold separately. Competitors relying purely on lower prices rarely close this bundled advantage gap quickly.
Market Impact: Captures roughly 27 percent more total contract revenue

Expanding Inventory Management Software Subscriptions Broadly

Suppliers increasingly bundle inventory management and dynamic pricing software subscriptions with electronic shelf label hardware, creating a recurring revenue stream distinct from the original hardware purchase and deepening the switching cost a retailer faces when considering a competing vendor at the next store expansion. This lever has grown steadily as retailers seek centralised control over pricing across an entire chain, with software subscription revenue now representing roughly 21 percent of total supplier revenue among the largest system integrators. Suppliers report this recurring revenue model has become increasingly central to overall profitability across the industry.
Market Impact: Contributes roughly 21 percent of total annual revenue

Licensing Colour Panel Technology to Signage Integrators

E Ink and other colour panel technology holders generate meaningful licensing revenue from signage integrators seeking access to patented colour electronic paper technology to build compliant display products without infringement risk. This lever has grown in importance as colour panel demand expands into new signage applications beyond the established electronic shelf label and e-reader categories. This licensing revenue now represents roughly 9 percent of total colour panel segment revenue among participating technology holders industrywide. Manufacturers without comparable patent positions must instead license this technology to compete effectively in the segment.
Market Impact: Contributes roughly 9 percent of total segment revenue

Extending Multi-Year Maintenance Service Contracts Broadly

Suppliers increasingly attach multi-year maintenance and replacement contracts to initial deployment sales, creating a recurring service revenue stream distinct from the original hardware purchase and giving retailers a single accountable vendor for ongoing label and network reliability. This lever has grown steadily as retailers seek to minimise unplanned downtime risk across thousands of individual labels per store, with maintenance contracts now representing roughly 13 percent of total industry revenue among the largest system integrators. Suppliers without established maintenance programmes increasingly lose this recurring revenue entirely to independent service providers. This dependency gap continues widening steadily.
Market Impact: Contributes roughly 13 percent of total annual revenue

Who Controls the Margin Pool

Concentration sits at a CR5 near 78 percent, extraordinarily high given E Ink's near-monopoly on panel manufacturing, with a durable gap between E Ink as the foundational technology supplier and system integrators such as VusionGroup and Pricer that compete on deployment scale and retail relationships rather than the underlying panel technology. That gap has narrowed only slightly as VusionGroup and Pricer invest heavily in expanding North American relationships.
Current competitive activity centres on three fronts: expanding colour panel manufacturing capacity ahead of growing signage demand, winning large retail chain deployment contracts through bundled hardware and software offerings, and building alternative sourcing relationships to reduce single-supplier panel dependence risk. Suppliers pursuing all three fronts simultaneously are pulling ahead of rivals still focused narrowly on just one.

Emerging pressure is coming from Chinese system integrators such as Hanshow expanding aggressively in price-sensitive retail segments, competing primarily on deployment cost rather than software sophistication. Rankings could shift meaningfully if alternative panel manufacturing capacity ever emerges credibly enough to reduce dependence on E Ink's currently near-total market position. Established suppliers are already investing further in alternative sourcing specifically to defend against this concentration risk.
electronic-paper-display-epd-market-company-positioning-matrix-1790002267825

Competitive Moat and Risk Dimensions

E INK HOLDINGS INC

Moat: Near-Monopoly Panel Patent Position

E Ink holds foundational patents covering core electronic paper technology that virtually the entire industry depends on, giving it pricing power and manufacturing control that no meaningful alternative supplier has successfully challenged over more than a decade of market development. This position has held remarkably stable despite more than a decade of attempted competitive entry from other manufacturers.
E INK HOLDINGS INC

Risk: Single Supply Point Failure

E Ink's near-total market position means any manufacturing disruption at its facilities would ripple across the entire downstream industry with no credible alternative supplier available, a concentration risk that device makers and system integrators cannot easily mitigate on their own. Industry participants increasingly discuss this concentration risk openly, though no credible alternative has yet emerged at meaningful scale.
VUSIONGROUP SA

Moat: Largest Installed Retail Deployment Base

VusionGroup's installed base across major European and expanding North American grocery chains, built over years of deployment relationships, gives it renewal advantages and reference credibility that newer system integrator entrants cannot easily replicate quickly. This advantage has translated directly into stronger renewal rates than competitors without comparable installed base depth.
VUSIONGROUP SA

Risk: Retail Capital Expenditure Cycle Exposure

VusionGroup's revenue depends heavily on retail chain capital expenditure budgets for store technology, leaving it more exposed than diversified technology suppliers to economic downturns that typically cause retailers to defer discretionary infrastructure investment first. VusionGroup has responded by diversifying into additional retail verticals, though this diversification will take time to fully offset the exposure.

Players Tracked

Prominent Players

E Ink Holdings Inc
VusionGroup SA
Pricer AB
Hanshow Technology Co Ltd
Displaydata Ltd

Other Key Players

SoluM Co Ltd
Diebold Nixdorf Incorporated
Onyx International Inc
Boyue International Ltd
PocketBook International SA
Kobo Inc
Amazon.com Inc
Teraoka Seiko Co Ltd
Opticon Sensors Europe BV
Zkong Intelligent Technology Co Ltd
CLEARink Displays Inc
Wistron Corporation
M2Communication Inc
Innowi Inc
Ultrachip Inc

Recent Developments

FEBRUARY 2026

E Ink Launches Next-Generation Colour EPD Panel

E Ink organically expanded its product line by launching a new generation colour electronic paper panel offering improved colour saturation and faster refresh rates, targeting signage operators seeking richer colour reproduction for promotional display applications. Manufacturers view the launch as narrowing the visual gap with conventional printed signage.
Signal: Colour panel improvement is quickly becoming the primary technology innovation battleground across the entire display industry
OCTOBER 2025

VusionGroup Signs Deployment Agreement With Grocery Retailer

VusionGroup signed a multi-year deployment agreement with a major grocery retailer covering electronic shelf label installation across the retailer's entire store network. The agreement was a supply and services contract securing a multi-year revenue stream. Analysts described the deal as reinforcing VusionGroup's leadership in large-scale grocery retail deployment.
Signal: Full-chain deployment contracts are quickly becoming the standard expected scale for winning major retail contracts today
APRIL 2026

Hanshow Acquires Regional Electronic Shelf Label Distributor

Hanshow completed the acquisition of a smaller regional electronic shelf label distributor, expanding its own direct retail relationships and installation capability ahead of growing its market presence in that specific geography. The acquisition strengthens Hanshow's direct retail relationships ahead of expanding its own market presence further.
Signal: Distribution consolidation is quickly becoming a genuine growth strategy for challenger system integrators across the industry

What Actually Drives Panel Manufacturing Cost

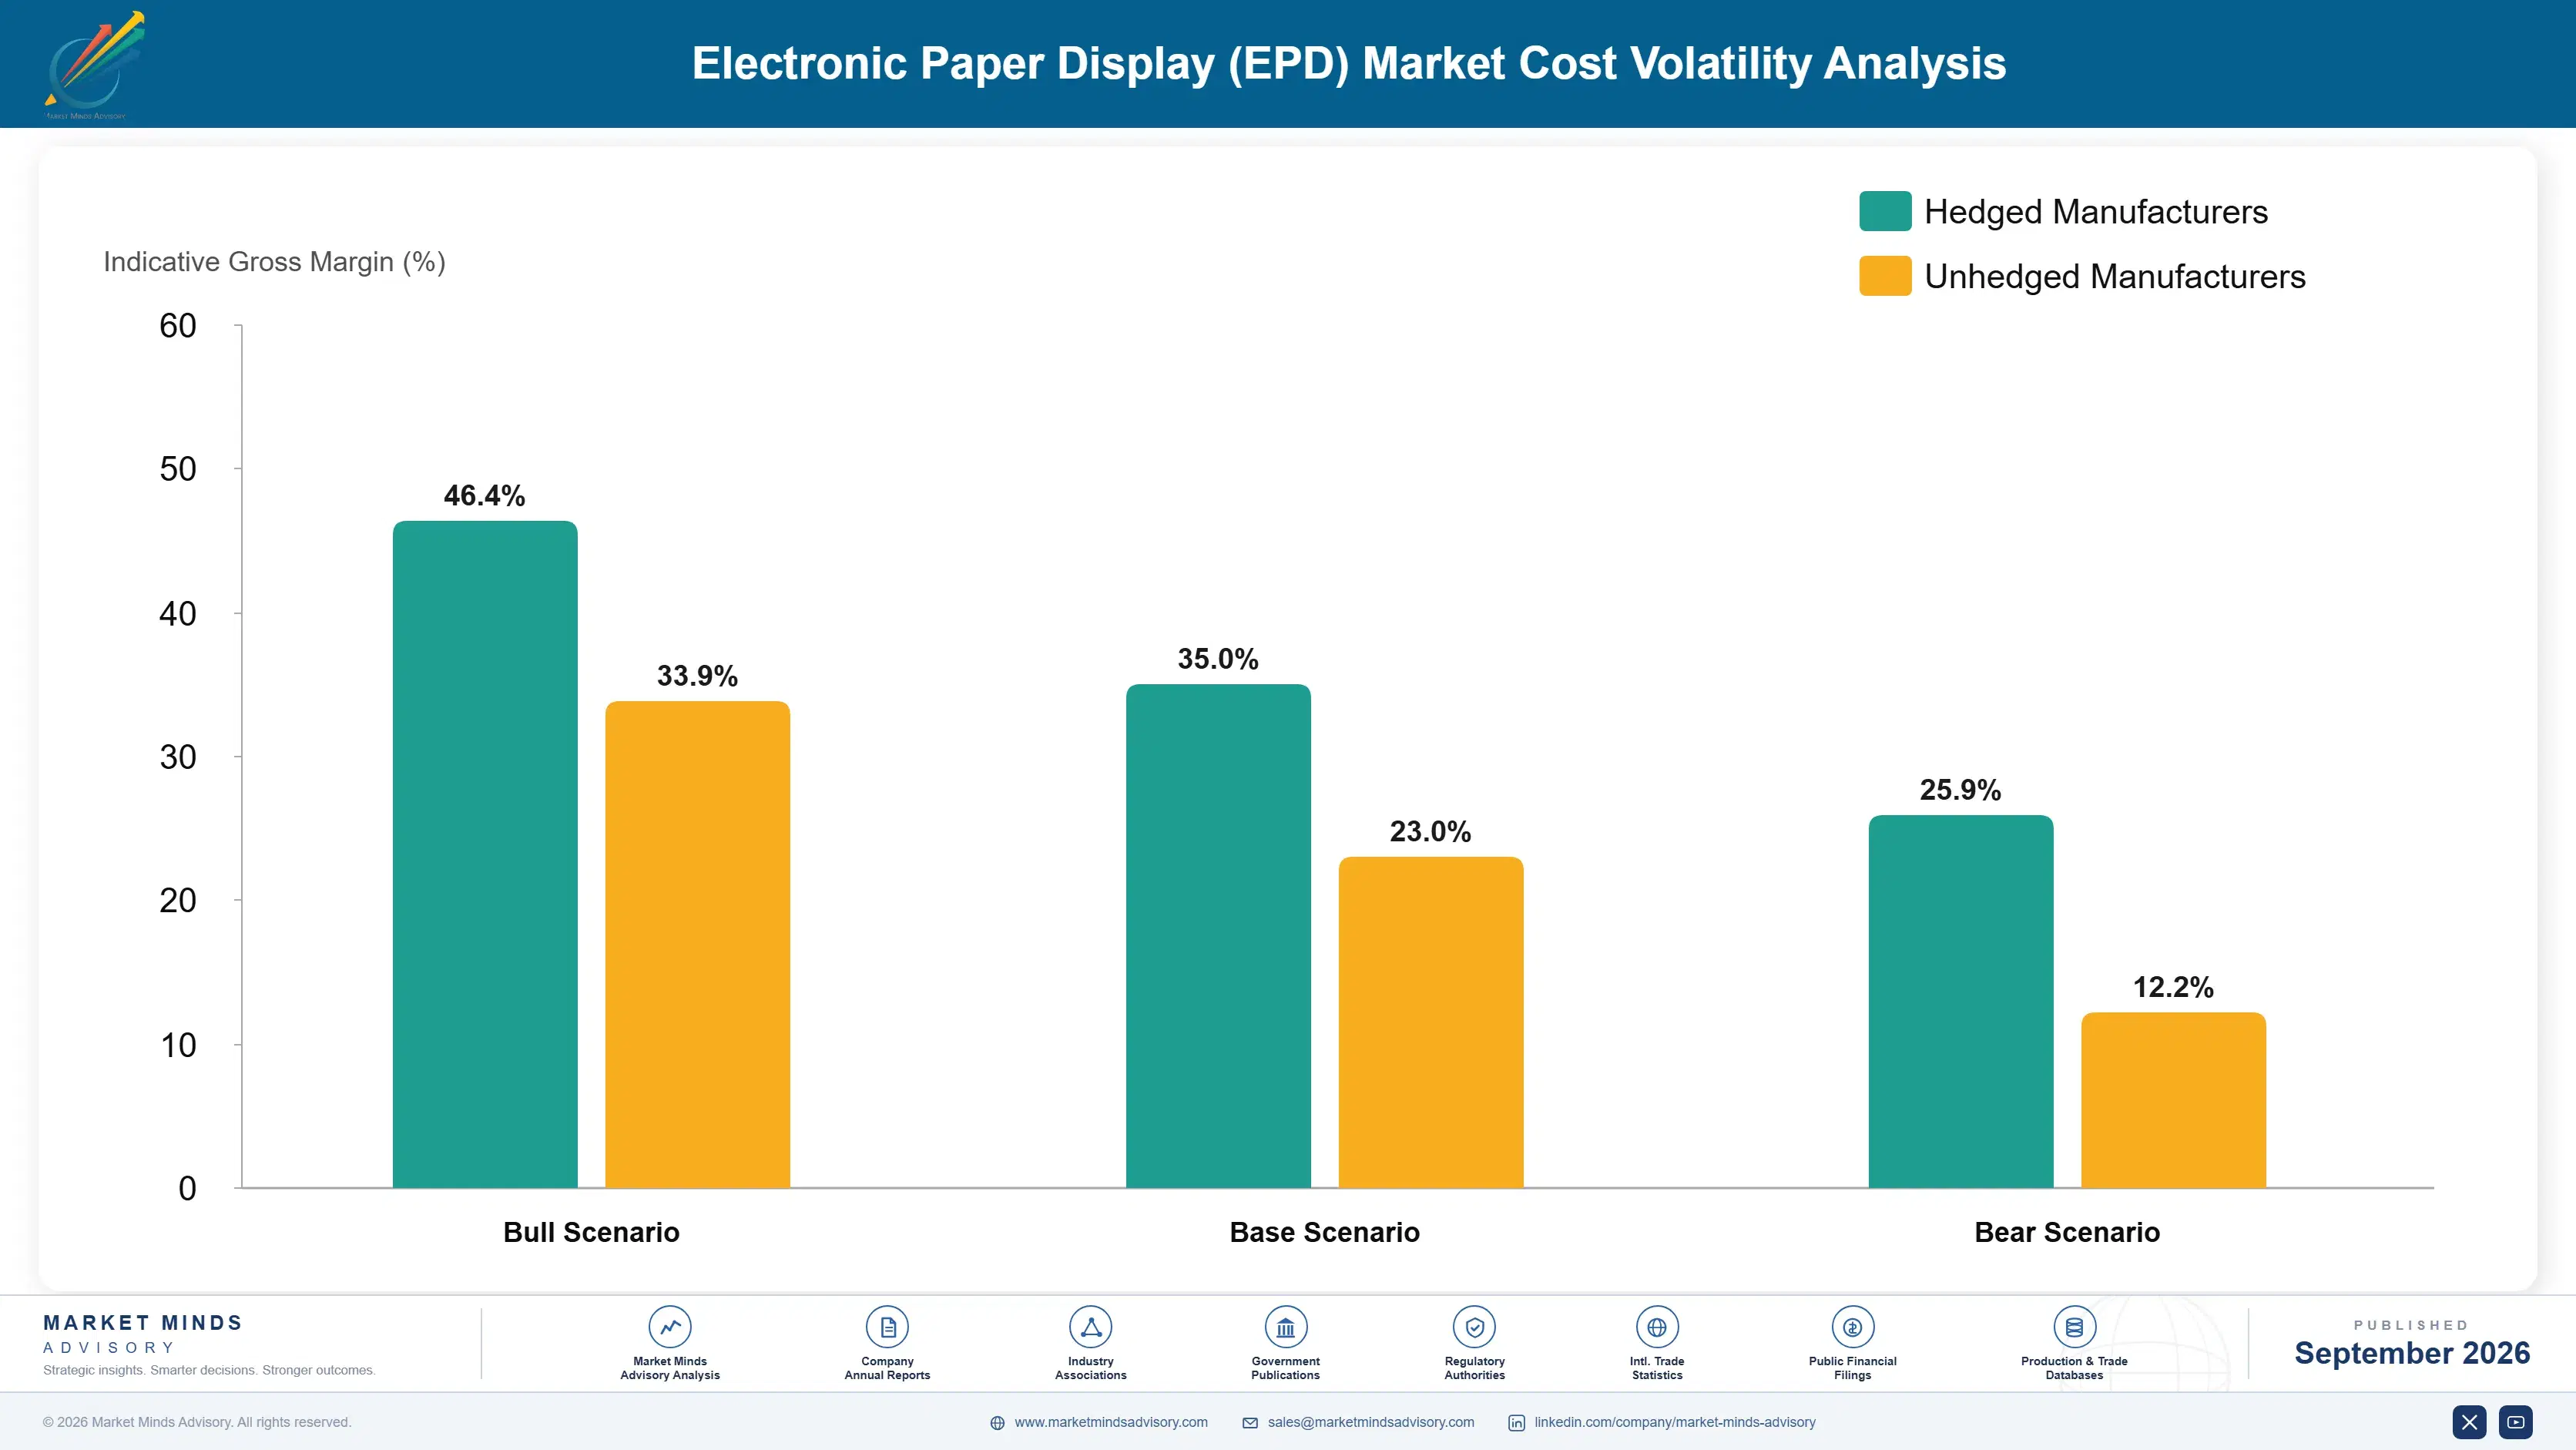
Specialised microcapsule ink materials and thin-film transistor backplane components together represent 38 to 46 percent of cost of goods sold for panel manufacturers, sourced primarily from specialised chemical suppliers and semiconductor foundries concentrated in Taiwan and Japan rather than from broadly diversified global supply chains. Smaller competitors purchasing lower volumes typically face less favourable pricing terms overall.
Semiconductor backplane component pricing experienced meaningful volatility during 2022, a period documented in company annual reports describing industry-wide chip supply disruption, forcing several device manufacturers to delay product launches as component lead times stretched considerably beyond original planning assumptions. Manufacturers without long-term fixed-price agreements absorbed the largest share of that disruption during the shortage period. Larger manufacturers with existing fixed-price agreements weathered the disruption considerably better than smaller competitors relying on spot market purchasing.

Smaller device manufacturers without direct panel supply agreements absorb a proportionally larger share of any renewed pricing volatility than the largest system integrators, which negotiate dedicated volume allocations directly with E Ink across their much larger combined order volumes. This cost gap compounds the competitive disadvantage smaller vendors already face given the single-supplier concentration inherent to this market, squeezing margins during periods of component scarcity.
electronic-paper-display-epd-market-cost-volatility-analysis-1790002268022

Negotiating Multi-Year Panel Supply Agreements

Larger system integrators lock in multi-year panel supply agreements directly with E Ink rather than purchasing on shorter-term terms, trading some pricing flexibility for meaningfully more reliable component allocation during periods of industry-wide capacity constraints affecting smaller competitors more severely. This approach has become standard practice among the largest system integrators in the market today.

Maintaining Larger Panel Inventory Buffers

Manufacturers are holding larger panel inventory buffers than they otherwise would for a less concentrated component supply chain, reducing exposure to short-term supply disruption even though the additional working capital tied up in inventory carries a genuine real cost. Teams treat this as necessary insurance against future supply disruption across the broader industry. Larger firms view it as essential.

Redesigning Devices for Component Efficiency

Engineering teams are redesigning device and label circuit boards to reduce dependence on specialised backplane components where possible, using more standardised alternatives that carry less single-supplier concentration risk even where the substitution requires meaningful engineering validation. Smaller vendors rarely have the capacity to pursue this strategy at meaningful scale. This gap continues widening as component specialisation deepens across the industry.

Portfolio Architecture for Margin Defence

The portfolio splits into three tiers running from commodity-adjacent basic monochrome panels through certified electronic shelf label systems to next-generation colour and signage-grade panels, with gross margin widening meaningfully at each step as manufacturing complexity and integration depth increase substantially. This layered structure closely mirrors how component margins generally scale with integration depth and manufacturing complexity.
Volume tier monochrome panels compete largely on unit price for basic e-reader and simple shelf label applications, while premium electronic shelf label systems command materially higher margin because they bundle wireless network infrastructure and inventory management software that basic panels neither include nor can support technically. Manufacturers that try to serve both ends of that spectrum with one undifferentiated product line tend to lose ground on both fronts simultaneously.

The highest-value margin pools concentrate in the next-generation tier, where colour and signage-grade panels carry premium pricing that customers accept precisely because visual quality and application flexibility now directly determine whether electronic paper can credibly replace conventional colour signage in a given deployment. Manufacturers are therefore prioritising investment in that tier even where near-term revenue contribution still remains comparatively modest relative to volume tier sales.

Volume / Commodity-Adjacent Tier

Basic monochrome panels sold mainly on unit price for e-reader devices and simple shelf label applications. These panels rely on simple manufacturing processes with minimal integration or software differentiation. Margins remain thin overall.
Gross Margin: 20-28%

Premium / Certified Tier

Electronic shelf label systems bundling wireless network infrastructure, inventory software, and deployment services. Customers at this tier typically renew deployment relationships for multiple consecutive store expansion cycles. Renewal rates stay consistently strong.
Gross Margin: 34-42%

Sustainability / Regulatory / Next-Generation Tier

Colour and signage-grade panels commanding the highest per-unit pricing available in the market. Pricing here reflects genuine visual quality differentiation rather than incremental additions to legacy designs. Adoption keeps expanding steadily.
Gross Margin: 44-52%
electronic-paper-display-epd-market-portfolio-architecture-1790002268835

High-value Sub-segments and Strategic Watch-out

Electronic Shelf Labels at Scale

Highest growth and highest margin pool in the market, driven by retailers moving from pilot deployments to full-chain rollouts across thousands of stores today. Vendors investing heavily here are positioning for the largest possible share of long-term margin expansion, constrained mainly by network deployment complexity.
Gross Margin: 46-54%

Colour Signage-Grade Panels

High-value segment growing more moderately as colour panel visual quality continues improving, opening new retail and public information display applications. Continued technology maturation should keep steadily reinforcing this segment's relative commercial importance in coming years. Vendors without established colour panel expertise face a materially harder path to winning share here.
Gross Margin: 40-48%

Standard E-Reader Panels

The volume core of the market, growing near the overall market average as most remaining demand comes from steady device replacement among an existing installed base. Most vendor revenue still originates here even as faster-growing premium tiers increasingly attract the bulk of new investment. today.
Gross Margin: 26-34%

Legacy Basic Shelf Label Panels

A shrinking segment suppliers should watch closely, as retailers upgrade toward networked systems but older standalone units still generate thinning replacement revenue. Vendors ignoring this shrinking segment risk losing replacement revenue faster than expected as retailers finally upgrade systems. Support cost per remaining unit keeps rising steadily each year.
Gross Margin: 12-18%

Why Deployment Contracts Run for Years

Electronic shelf label deployments behave like a multi-year annuity once installed, since retailers rarely rip out an entire store's wireless network and label infrastructure to switch vendors, given the substantial disruption and reinstallation cost that switching would require across every shelf in a store. Retailers rarely revert to paper price tags once electronic shelf labels have proven their pricing accuracy and labour benefits.
Adoption runs deepest among large grocery and pharmacy chains who extract the most value from centralised pricing control across thousands of stores, while smaller independent retailers with fewer locations adopt more slowly and often continue using paper price tags for years before ever justifying the upfront electronic shelf label investment. This divide has widened as electronic shelf label rollouts increasingly concentrate among the largest retail chains globally.

A generational shift in buyer profile is underway as retail technology and operations executives, rather than traditional store managers focused purely on day-to-day operations, increasingly control procurement decisions, favouring suppliers who can demonstrate enterprise-wide deployment capability over those competing purely on per-label unit cost. This shift is reshaping vendor sales strategy across nearly every major electronic paper supplier competing for these contracts.
electronic-paper-display-epd-market-end-use-penetration-index-1790002269907

What Determines Who Wins This Market

These are among the four positions where our research anticipates prominent divergence between winners and laggards over the coming forecast period. Each is grounded in the demand model, the regulatory perimeter, and the announced capacity pipeline.
01 / FULL-CHAIN DEPLOYMENT CAPABILITY

Winning entire retail chains matters more than winning individual store pilots

System integrators that can demonstrate proven full-chain deployment capability increasingly win contracts that pilot-stage vendors cannot credibly compete for, since retailers moving beyond pilot programmes want partners with a track record managing thousands of stores simultaneously. VusionGroup's deep European grocery chain relationships illustrate how this capability compounds into a durable competitive advantage over newer entrants. Integrators without comparable scale experience risk losing the largest, most lucrative retail contracts to established competitors who retailers increasingly treat as a genuine prerequisite for consideration.
02 / PANEL SUPPLY DIVERSIFICATION STRATEGY

Reducing single-supplier dependence is becoming a genuine strategic priority

Nearly every device maker and system integrator depends on E Ink for panels, creating genuine supply concentration risk that the industry increasingly recognises as a strategic vulnerability rather than simply an accepted cost of doing business. Manufacturers investing in larger inventory buffers and alternative component sourcing where possible reduce their exposure to this risk more effectively than competitors treating it as unavoidable. This dynamic will likely intensify as the electronic shelf label segment grows large enough that any supply disruption carries genuinely larger consequences.
03 / COLOUR PANEL APPLICATION DEVELOPMENT

Opening genuinely new signage use cases matters more than incremental e-reader gains

Manufacturers developing colour panel applications for signage and specialty retail displays are capturing genuinely new revenue beyond the mature and largely saturated e-reader category, since colour capability opens use cases monochrome panels could never credibly address. E Ink's continued colour panel generation improvements demonstrate this remains the primary innovation battleground across the industry. Suppliers slow to develop credible colour applications risk missing this growth opportunity entirely to competitors moving faster, who increasingly win the reference contracts that shape adoption elsewhere.
04 / SOFTWARE BUNDLING DEPTH

Recurring software revenue increasingly determines total customer profitability

Suppliers that bundle inventory management software and maintenance contracts alongside hardware sales capture meaningfully higher total customer lifetime value than those selling labels as a standalone hardware product, since retailers increasingly value centralised control and ongoing reliability over raw per-unit hardware cost across an entire multi-store deployment. This bundling strategy matters increasingly as hardware margins compress under competitive pricing pressure from lower-cost regional challengers. Suppliers without comparable software depth risk losing high-value customers to more fully integrated competitors, increasingly finding themselves competing on price alone.

Engagement Snapshot From the Field

A live engagement with an industry participant carrying material or product regulatory and market exposure ahead of a defining policy shift, showing how our research translates into a defensible multi-year portfolio strategy.
MARKET MINDS ADVISORY · CLIENT ENGAGEMENT SUMMARY
Electronic Paper Display (EPD) Producer Strategic Portfolio Review and Transition Roadmap 2026·Investment Scenario on Electronic Paper Display (EPD) Exposure Evaluation 2025-26
CLIENT PROFILE
The client, a regional grocery chain operating several dozen stores, had completed a successful electronic shelf label pilot at three locations and needed to decide whether to proceed with a full-chain rollout. Projected full deployment capital expenditure had reached approximately 6 million dollars (client-reported, unverified by MMA), with leadership evaluating whether the pilot's measured benefits would scale proportionally across the entire chain.
STRATEGIC CHALLENGE
The chain's pilot demonstrated clear labour savings and pricing accuracy improvements at three stores, but leadership needed confidence that a full rollout across dozens of stores with varying store formats and staff structures would deliver comparable returns before committing significant capital during a period of otherwise constrained budget availability. within the chain's constrained annual technology budget for the coming fiscal year.
MMA APPROACH
MMA benchmarked the pilot's measured labour and pricing accuracy improvements against comparable full-chain deployments at similarly sized grocery chains, modelling projected payback period across the chain's full store portfolio. The analysis prioritised identifying which store formats within the chain showed the strongest pilot results to help sequence the rollout for fastest overall payback.
KEY FINDINGS
  1. Larger format stores in the pilot showed meaningfully stronger labour savings than the chain's smaller neighbourhood format locations., suggesting store format should meaningfully influence how the rollout gets sequenced.
  2. Full-chain deployment carried a projected payback period under two years given the chain's measured pilot performance data., well within the chain's typical capital investment payback expectations for store technology.
  3. Sequencing the rollout by store format, largest first, could improve overall payback timing compared with a purely geographic rollout sequence., a meaningfully faster path to full payback than a purely geographic sequencing approach.
  4. Vendor financing options could reduce the chain's upfront capital requirement meaningfully during the current budget-constrained period., easing the overall capital burden during the chain's current budget-constrained period.
CLIENT PROFILE
The client, a regional grocery chain operating several dozen stores, had completed a successful electronic shelf label pilot at three locations and needed to decide whether to proceed with a full-chain rollout. Projected full deployment capital expenditure had reached approximately 6 million dollars (client-reported, unverified by MMA), with leadership evaluating whether the pilot's measured benefits would scale proportionally across the entire chain.
STRATEGIC CHALLENGE
The chain's pilot demonstrated clear labour savings and pricing accuracy improvements at three stores, but leadership needed confidence that a full rollout across dozens of stores with varying store formats and staff structures would deliver comparable returns before committing significant capital during a period of otherwise constrained budget availability. within the chain's constrained annual technology budget for the coming fiscal year.
MMA APPROACH
MMA benchmarked the pilot's measured labour and pricing accuracy improvements against comparable full-chain deployments at similarly sized grocery chains, modelling projected payback period across the chain's full store portfolio. The analysis prioritised identifying which store formats within the chain showed the strongest pilot results to help sequence the rollout for fastest overall payback.
KEY FINDINGS
  1. Larger format stores in the pilot showed meaningfully stronger labour savings than the chain's smaller neighbourhood format locations., suggesting store format should meaningfully influence how the rollout gets sequenced.
  2. Full-chain deployment carried a projected payback period under two years given the chain's measured pilot performance data., well within the chain's typical capital investment payback expectations for store technology.
  3. Sequencing the rollout by store format, largest first, could improve overall payback timing compared with a purely geographic rollout sequence., a meaningfully faster path to full payback than a purely geographic sequencing approach.
  4. Vendor financing options could reduce the chain's upfront capital requirement meaningfully during the current budget-constrained period., easing the overall capital burden during the chain's current budget-constrained period.
RECOMMENDED STRATEGY
Phase 1: Phase 1 (Months 1 to 4): Deploy electronic shelf labels across the chain's largest format stores where pilot results were strongest. Phase 2: Phase 2 (Months 5 to 10): Extend deployment to mid-sized format stores using lessons learned from the initial rollout phase. Phase 3: Phase 3 (Months 11 to 15): Complete deployment across remaining smaller neighbourhood format stores to finish the full-chain rollout., coordinating closely with regional operations teams throughout the final rollout phase.
OUTCOME
The chain proceeded with the phased full rollout and completed deployment across its largest format stores within the recommended timeframe, reporting labour savings consistent with MMA's projected range (client-reported, unverified by MMA). Leadership credited the format-based sequencing with improving overall rollout payback timing. Leadership specifically praised the format-based sequencing approach for balancing speed against available capital.

Frequently Asked Questions

Foundational context covering the market sizes, CAGR, scope, country, region and competition that inform every finding below. This section is provided to cover basics and most often pre-purchase conversations, answered from the MMA Primary Research Dataset.

What is the current size of the Electronic Paper Display (EPD) Market?

The global market was valued at 1.85 billion dollars in 2025, with Taiwan representing the largest single national panel manufacturing base within that total. Growth here has meaningfully outpaced most other national panel manufacturing markets in recent years.

How large will the EPD Market be by 2036?

The global market is projected to reach 4.775 billion dollars by 2036, up from 2.017 billion dollars in 2026, a 2.37x expansion over the forecast decade.

What is the CAGR for the EPD Market 2026 to 2036?

The market is forecast to grow at a 9.0 percent compound annual rate globally, with electronic shelf labels growing considerably faster than the overall category average.

Which segment is growing fastest?

Electronic shelf labels lead all segments at a 16.0 percent CAGR, roughly 1.78 times the overall market rate, as retailers move from pilot programmes to full-chain deployment.

Who are the major companies in the EPD Market?

E Ink Holdings, VusionGroup, Pricer, Hanshow Technology, and Displaydata together hold the largest share, with CR5 concentration near 78 percent globally. That concentration reflects E Ink's foundational patent position across the entire industry.

Which country is growing fastest?

China leads growth at an 11.5 percent CAGR, driven by rapidly expanding domestic retail chains modernising store operations across an enormous number of locations. Domestic retail chains continue expanding aggressively within this large addressable base.

Report Segmentation Architecture

The full report scope spans multiple orthogonal segmentation dimensions, with cross-tabulated demand data provided for each dimension pair. Coverage extends further to regional breakdowns, trend trajectories, and the competitive detail needed to support segment-level decision-making.

By Primary Market Dimension

  • Electronic Shelf Labels
  • E-Reader and E-Book Display Modules
  • Digital Signage EPD Displays
  • Smart Card and Wearable EPD Displays
  • Industrial and Logistics EPD Displays
  • Colour Electronic Paper Displays

By End-Use Industry

  • Grocery and Pharmacy Retail
  • Consumer Electronics and Publishing
  • Public Signage and Transit
  • Logistics and Warehousing
  • Financial Services and Identification

By Commercial Dimension

  • Full-Chain Retail Deployment
  • Pilot and Limited Deployment
  • Consumer Device Sales
  • Software Subscription Bundled Sales

By Region

  • North America
  • Western Europe
  • East Asia
  • South Asia and Pacific
  • Latin America
  • Middle East and Africa
  • Eastern Europe

Scope, Methodology, and Coverage

Every figure in this report is reproducible from documented input assumptions. The scope below maps the historical period, the forecast horizon, the segmentation dimensions, and the countries covered, alongside the underlying primary and qualitative methodology.
Historical Period
2020 to 2025
Forecast Period
2026 to 2036
Base Year
2025 (USD billions; MMA Primary Research Dataset, September 2026)
Market Definition
This market covers reflective electronic paper display panels and modules used in e-readers, electronic shelf labels, digital signage, and related low-power display applications. It excludes conventional LCD and OLED display panels and general-purpose smartphone or tablet screens using emissive display technology.
Quantitative Units
USD billions (current prices); regional and segment CAGR in percent
Segmentation Dimensions
By Primary Market Dimension; By End-Use Industry; By Commercial Dimension; By Region
Regions Covered
North America, Western Europe, East Asia, South Asia and Pacific, Latin America, Middle East and Africa, Eastern Europe
Countries Covered
USA, China, Germany, France, UK, Japan, South Korea, India, Australia, Canada, Brazil, Mexico, Indonesia, Vietnam, Thailand, Malaysia, UAE, Saudi Arabia, South Africa, Nigeria, Turkey, Poland, Netherlands, Italy, Spain, Sweden, Switzerland, Argentina, Colombia, Singapore, and additional markets relevant to this sector
Key Companies Profiled
E Ink Holdings Inc, VusionGroup SA, Pricer AB, Hanshow Technology Co Ltd, Displaydata Ltd, SoluM Co Ltd, Diebold Nixdorf Incorporated, Onyx International Inc, Boyue International Ltd, PocketBook International SA, Kobo Inc, Amazon.com Inc, Teraoka Seiko Co Ltd, Opticon Sensors Europe BV, Zkong Intelligent Technology Co Ltd, CLEARink Displays Inc, Wistron Corporation, M2Communication Inc, Innowi Inc, Ultrachip Inc
Quantitative Methodology
Primary survey, n=3,800 respondents, Q4 2025, six countries; demand-side model with trade association cross-validation
Qualitative Methodology
47 expert interviews, Q4 2025; applied to validate demand model assumptions, identify emerging dynamics, and assess competitive positioning
Report Format
PDF and XLSX data workbook (Word format preview document)
Publisher
Market Minds Advisory
Report Code
MMA-2026-TEC-628
Published
September 2026
Contact
sales@marketmindsadvisory.com | www.marketmindsadvisory.com

Purchase the full Electronic Paper Display (EPD) Market Report (2026 to 2036).

The full report delivers a complete quantitative and qualitative assessment of the Electronic Paper Display Market across all seven regions and six product segments. It includes detailed vendor profiles for all twenty companies covered, alongside country-level sizing for thirty markets. Primary research draws on thirty-eight hundred survey respondents and forty-seven expert interviews conducted in the fourth quarter of 2025 across six countries. Buyers receive full editable data tables alongside the complete narrative analysis, competitive vendor scorecards, and forward-looking scenario modelling included in every purchase. Analysts remain available for direct follow-up questions.
Twenty vendor profiles with moat and risk analysis
Seven-region market sizing with country breakdowns
Six-segment product framework with growth rates
Primary survey data collected across six countries
Forty-seven expert interview insights fully included
Editable data tables for all forecast figures

Built For The People Who Decide

From boardroom strategy to bench-side execution, this report is read cover-to-cover by leaders shaping the next decade of their industry, turning demand scenarios, market dynamics and valuation benchmarks into decisions.
CXOs/ Presidents/ VPs/ Managers
M&A and Corporate Development
Strategy Teams and R&D Heads
Procurement and Product Directors
Regulatory and Compliance Leaders
Investor Relations and Equity Analysts