Market Minds Advisory
Electrical Labels Market

Electrical Labels Market: Arc Flash Compliance, Data Centre Buildout and the Identification Layer Inside Every Panel

A label that must survive forty years inside an energised panel, stay legible after an arc flash study, and satisfy an inspector who will fail an installation over a marker nobody can read.

Lead Analyst

Bilal Shaikh

Published

September 2026

Make Smarter Decisions with Customized Research Insights

Request a free sample report and evaluate market opportunities, growth trends, and competitive dynamics relevant to your business needs.

2025 MARKET VALUE$2.6BMarket Size 2025
2036 FORECAST VALUE$5.7BBase Case , 2026 to 2036
CAGR 2026 TO 20367.4 %Bull 8.6% / Bear 6.2%
INCREMENTAL OPPORTUNITY$2.9BNet 10- year value creation
EXPANSION MULTIPLE2.04x2036 value over 2026 base
Strategic Levers
M&A Pipeline
Regional Outlook
Country Rankings
Competitive Intelligence
Segmental Deep-dive
Call-Us : 91 93563 13602

Executive Snapshot and Market Trajectory

An electrical label costs less than a dollar and can fail an inspection that holds up a building. That asymmetry explains almost everything about how this market prices, qualifies suppliers and resists substitution by cheaper alternatives that look identical on the shelf. Consequence, not cost, sets the price.
Arc flash and electrical safety warning labels compound at 11.1%, exactly 1.50 times the market, because NFPA 70E and equivalent standards turned hazard marking from good practice into a documented obligation carrying real liability. East Asia holds 30% of consumption, reflecting where switchgear, panels and electrical equipment are actually built, since most identification is applied during manufacture rather than in the field. Assembly geography sets the map.
Five suppliers hold 47% between them, concentrated by industrial consumable standards. The reason is qualification: adhesives, substrates and print systems are approved together against UL, CSA and IEC requirements, and a specification names the material rather than the price. Data centre construction and grid investment are the two demand engines pulling hardest right now. Both write specifications that hold for decades once equipment is energised. Field application is the minority case throughout.
Market Definition
The market covers labels, markers and identification materials applied to electrical wiring, cables, panels, components, terminal blocks and equipment enclosures, including arc flash and safety warning labels, certification marking, and asset identification for electrical assets. Printing hardware, software and general-purpose industrial labels outside electrical applications are excluded, as are cable ties and non-printed marking accessories.
Base Year Value
$2.6B in 2025 (MMA Primary Research Dataset, August 2026)
Forecast Period
2026 to 2036, eleven discrete annual values
CAGR
7.4% base case. Bull 8.6%. Bear 6.2%.
Fastest Growth Segment
Arc Flash and Electrical Safety Warning Labels: 11.1% CAGR
Fastest Growth Country
India: 10.2% CAGR
Fastest Growth Region
South Asia and Pacific: 9.6% CAGR
Largest Region
East Asia: 30% of 2025 global value
Market Leaders
Brady Corporation, Avery Dennison, HellermannTyton, Panduit, TE Connectivity. Source: MMA Analysis based on company annual reports.
Primary Survey
n=3,800 procurement and R&D decision-makers, Q4 2025, six countries
Methodology
Demand-side build-up, cross-validated against public data, 47 expert interviews

Electrical Labels Market Forecast Scenarios

electrical-labels-market-size-forecast-scenario-1787307233819
Growth ran at an implied 6.2% across 2020 to 2025, and it accelerated noticeably in the back half. Construction disruption suppressed 2020 and 2021 volumes, then data centre buildout, grid replacement programmes and reshored electrical equipment manufacturing arrived together from 2022 onward and pulled demand up faster than the industrial average. The back half looked nothing like the front.
The base case at 7.4% rests on three mechanisms. Hyperscale and colocation data centre construction consumes identification at extraordinary density, since every cable, circuit and panel in a facility must be marked and documented. Grid investment programmes across North America, Europe and India replace switchgear and substation equipment that has to be labelled to current standards rather than the standards it was built to. And arc flash requirements keep tightening.
The bull case at 8.6% assumes data centre construction sustains its current pace through the decade, which would keep the highest-density identification application growing well above the market. The bear case at 6.2% follows from a construction slowdown combined with continued price pressure on commodity wire markers, where regional converters compete effectively once a specification permits alternatives.

The Identification Layer Nobody Notices Until It Fails

The economics here are governed by consequence rather than by cost. A wire marker costs pennies. A wire marker that has curled off a conductor inside a live panel costs an electrician an hour of tracing, and in a fault investigation it can cost considerably more than that. Buyers who have been through the second experience stop shopping on the first number. Consequence rather than cost writes the specification.
TOP FIVE CONCENTRATION47%Combined share held by the five largest global suppliers
DATA CENTRE LABEL DENSITY42 labels per rackTypical identification count across cabling and power distribution
SUBSTRATE COST SHARE34% of COGSFilm and adhesive inputs as proportion of manufacturing cost
SPECIFICATION QUALIFICATION TIME16 weeksTypical approval cycle for a new material against listed standards
REQUIRED SERVICE LIFE40 yearsLegibility expectation for permanent panel and equipment marking
FIELD-APPLIED SHARE38% of volumeIdentification applied on site rather than during equipment manufacture
Qualification is the commercial mechanism. Substrate, adhesive and print system are approved together against UL 969, CSA and IEC requirements covering legibility, adhesion, temperature range and chemical exposure. A panel builder's specification names an approved material, and swapping it means requalification nobody has time for. That is why five suppliers hold 47% of an apparently generic consumable.
Two demand engines dominate at present. Hyperscale data centres consume identification at roughly 42 labels per rack across power distribution, network cabling and asset tracking. Grid replacement programmes generate a second, slower but very large stream, and equipment installed in the 1970s comes back labelled to standards that did not exist when it was built. Both engines have years left in them.
"The people who buy these labels twice buy them very differently the second time. Nothing concentrates a facilities manager's mind like standing in front of a panel where every marker has yellowed into illegibility and the drawings went missing three refurbishments ago."
Director, Industrial Identification and Electrical Infrastructure Practice · MMA

Market Trends

Arc Flash Standards Convert Hazard Marking Into Documented Obligation

NFPA 70E and the equivalent requirements adopted across Canada, Australia and increasingly the Gulf states require an arc flash risk assessment and a label recording incident energy, working distance and required protective equipment at each piece of equipment. That label carries legal weight in an incident investigation. The assessment must be reviewed at least every five years, which makes the label a recurring purchase rather than a one-time install. The segment compounds at 11.1% against a market at 7.4%, and demand tracks assessment cycles rather than construction volume. Adoption keeps widening geographically.
Market Impact: Utility applications at 23% of dema

Data Centre Construction Consumes Identification at Extreme Density

A hyperscale facility marks every power feed, every network run, every patch position and every asset, at roughly 42 labels per rack before commissioning documentation begins. Identification is also increasingly machine-readable, since asset management systems reconcile physical installations against configuration records automatically. Colocation operators impose labelling schemes contractually on tenants. That combination makes data centre construction the densest identification application in the built environment by a wide margin, and it is expanding faster than any other end use. Operators increasingly impose one portfolio-wide scheme across every facility they run, which concentrates specification authority into very few hands indeed.
Market Impact: Factory application covering 62% of

Market Opportunities and Growth Drivers

Grid Replacement Programmes Relabel Equipment to Current Standards

Transmission and distribution operators across North America, Western Europe and India are replacing switchgear, transformers and substation equipment installed decades ago. Every replacement is labelled to current identification, arc flash and asset traceability requirements rather than to the standards prevailing when the original was built. United States infrastructure funding and European grid investment plans both extend well into the next decade. Roughly 23% of electrical label demand now originates from utility and grid applications, and that share has risen steadily each year since 2022. Regulated capital plans fund the work for years ahead.
Market Impact: Price gaps reaching 40% on markers

Electrical Equipment Manufacturing Reshoring Adds Factory-Applied Volume

Switchgear, panel and transformer manufacturing capacity has been added across North America, India and Southeast Asia in response to lead times that stretched past two years during the 2022 to 2024 shortage. Factory-applied identification accounts for 62% of volume, so new assembly capacity translates directly into label demand at the point of manufacture. A material approved during plant commissioning typically stays in the bill of materials for the entire product line, so the qualification decision is worth far more than the first order suggests. Those plants qualify listed materials during commissioning and rarely revisit the choice.
Market Impact: Qualification adding 16 week delays

Market Restraints and Challenges

Commodity Wire Markers Face Regional Price Competition

Basic wire and cable markers on standard vinyl or polyester face genuine competition from regional converters wherever a specification permits equivalents rather than naming a listed material. The root cause is that the underlying converting is straightforward: slitting, printing and die-cutting pressure-sensitive stock requires no unusual capability. Price gaps of 30 to 40% are common in tenders that allow substitution. Suppliers mitigate by pushing specifications toward listed materials, and by bundling markers with printers and software the regional converter cannot supply. Specification wording decides the outcome. Wording, not converting cost, decides who wins.
Market Impact: Five-year review cycles covering 11

Qualification Cycles Delay Revenue From New Material Development

A new substrate or adhesive takes roughly sixteen weeks to qualify against listed standards, and considerably longer to work through customer specifications already naming an incumbent material. The root cause is that approval covers substrate, adhesive and print system as a combined system rather than as components, so any change reopens the whole assessment. That delay makes material innovation expensive to fund and slow to monetise. Suppliers mitigate by qualifying platform materials broadly upfront, then varying format and print method within an approved envelope. Innovation arrives slowly for that reason.
Market Impact: Density reaching 42 labels per rack
3 additional market trends, 4 additional growth drivers, and 2 additional restraints and challenges are covered in the full report. Contact sales@marketmindsadvisory.com to access the complete intelligence.

Segment CAGR and Growth Architecture

Segmentation follows label application type, because that determines the standard a material must satisfy, the environment it must survive and who specifies it. An arc flash label answers to a safety standard and a facility owner, while a terminal marker answers to a panel builder's assembly drawing, and no commercial logic connects the two decisions.
electrical-labels-market-market-share-analysis-1787307234350

Arc Flash and Electrical Safety Warning Labels

Arc flash labelling compounds at 11.1%, exactly 1.50 times the market rate, and it behaves unlike anything else in the category. The label records incident energy, working distance, arc flash boundary and required protective equipment at a specific piece of equipment, derived from an engineering study rather than chosen from a catalogue. NFPA 70E requires that study be reviewed at least every five years, which converts the label into a recurring purchase tied to an assessment cycle rather than to construction activity. It also carries evidential weight after an incident, so buyers specify durable substrates and legibility retention rather than shopping on unit price. Regional adoption beyond North America continues to widen.
CAGR 11.1%

Certification and Compliance Marking Labels

Compliance marking grows at 8.4%, driven by equipment that must carry UL, CSA, CE, UKCA and increasingly national certification marks across multiple export destinations. A single switchgear assembly destined for several markets can require six or more distinct marks, each with its own placement, durability and legibility requirements. Manufacturers cannot risk a mark that becomes illegible during the equipment's service life, since that creates a compliance exposure at inspection rather than merely an inconvenience. Certification body scrutiny of marking permanence has tightened. The segment rewards suppliers holding broad listed material portfolios, because a manufacturer serving eight export markets wants one qualified supplier rather than eight. Consolidating that qualification burden is the whole commercial argument.
CAGR 8.4%
Full segment breakdown across 6 segments available in the complete report.

Regional Architecture and Country Demand Map

Distribution follows electrical equipment manufacturing more closely than it follows electricity consumption, because 62% of identification is applied during assembly. Field-applied volume, including arc flash labelling, sits closer to where safety regulation is strictest rather than where equipment is built. Two different maps therefore govern one market.

East Asia

East Asia holds 30% of global consumption, the largest regional share, and switchgear and panel manufacturing explains most of it. Chinese producers supply electrical equipment worldwide, and identification is applied on the assembly line rather than at the installation site. Export destinations dictate which certification marks appear, so a Chinese panel bound for Europe carries CE marking qualified to European durability requirements. Japanese and Korean demand is narrower and higher in specification, concentrated in semiconductor fabrication facilities and industrial automation where environmental exposure is severe. Domestic Chinese arc flash adoption remains limited compared with North America, which keeps the regional mix weighted toward factory-applied marking. Growth of 8.4% tracks electrical equipment production volumes closely.
Share: 30% | CAGR: 8.4% (2026 to 2036)

North America

North America accounts for 28% of consumption and the highest value per unit anywhere, because safety regulation converts labelling into a documented obligation rather than a convenience. NFPA 70E arc flash requirements drive recurring demand on five-year assessment cycles, independent of construction activity. Data centre construction across northern Virginia, Texas, Arizona and Ohio consumes identification at roughly 42 labels per rack and shows no sign of slowing. Federal infrastructure funding directed at grid replacement adds a second large stream, since equipment installed decades ago returns labelled to standards that did not exist at the time. Regional growth of 8.2% is the strongest among developed markets, and field-applied volume runs above the global average.
Share: 28% | CAGR: 8.2% (2026 to 2036)
Regional intelligence for 5 additional markets available in the complete report: Western Europe, South Asia and Pacific, Latin America, Middle East and Africa, Eastern Europe. Contact sales@marketmindsadvisory.com.
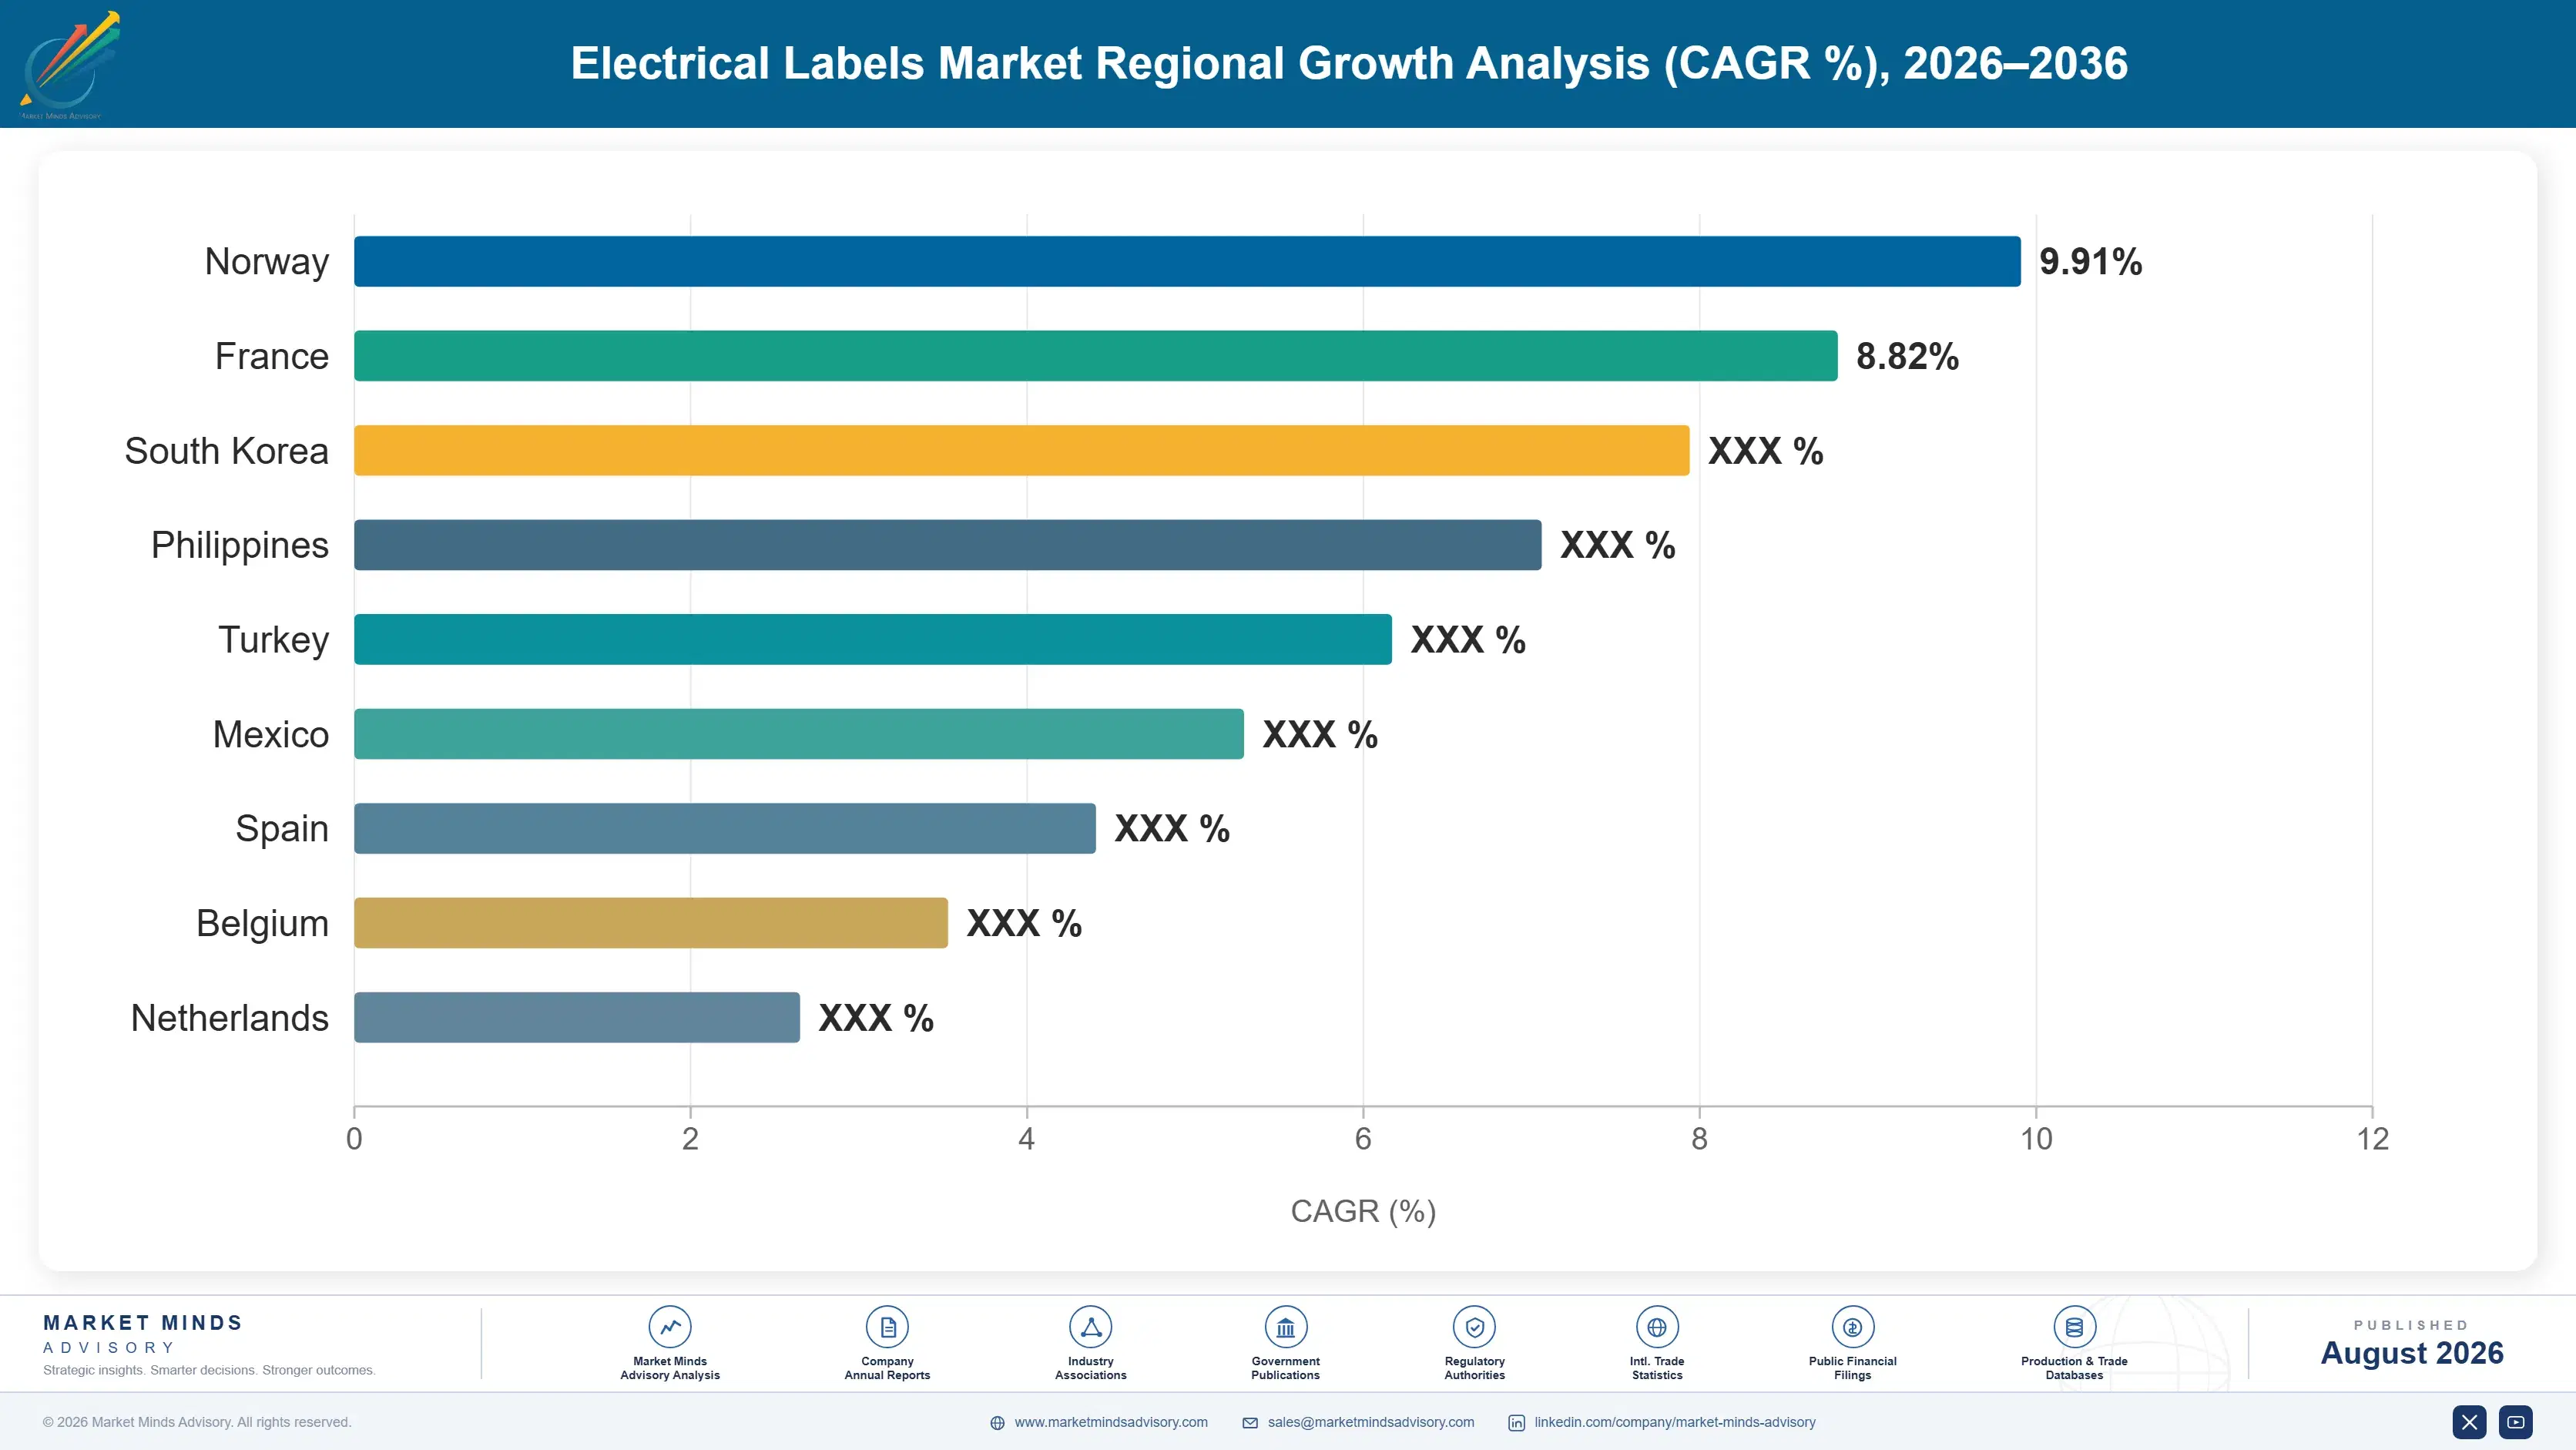
electrical-labels-market-country-cagr-analysis-1787307234860

Selling on Consequence Rather Than Unit Price

Every commercially attractive position in electrical labelling shares one property: the buyer is protecting against a consequence far larger than the label's cost. Where that is true, price sensitivity collapses and qualification becomes the barrier. Where it is not true, regional converters win on price. Four positions sit firmly on the right side of that line.

Own the Arc Flash Assessment Renewal Cycle

NFPA 70E requires arc flash studies be reviewed at least every five years, and every review generates fresh labels carrying updated incident energy values. That converts a construction-linked purchase into a recurring one running independently of building activity. Suppliers positioned with the engineering firms performing those studies capture the label specification at source, and the segment compounds at 11.1% with gross margins roughly 16 to 23 points above commodity wire markers. The requirement is a relationship with electrical engineering consultancies rather than with the distributor, which is a different commercial motion entirely.
Market Impact: Renewal cycles now driving 11.1% of

Qualify Platform Materials Broadly Before Customers Ask

Approval covers substrate, adhesive and print system as a combined system, taking around sixteen weeks per listing and considerably longer to work into customer specifications. Suppliers that qualify a platform material across the full range of listed standards upfront can then vary format, size and print method within the approved envelope without reopening assessment. That converts a sixteen week barrier into a same-week response when a customer needs something specific. Competitors qualifying reactively lose the enquiry before their submission clears, and broad upfront qualification typically costs under 3% of an annual development budget.
Market Impact: Turning a 16 week cycle into three

Bundle Identification Systems for Data Centre Construction

A hyperscale facility needs roughly 42 labels per rack, generated on site, matched to an asset management database and applied under commissioning deadlines. Selling label stock alone into that environment concedes the position to whoever supplies printers, software and scheme design. Suppliers offering the complete system capture the label consumption for the facility's operating life, since the scheme becomes embedded in the asset records. Data centre identification carries gross margins 12 to 19 points above general industrial work, and switching once commissioned is effectively impossible without rewriting documentation. Design-stage access is the whole game.
Market Impact: System selling worth 12 to 19 margi

Serve the Extreme-Environment Specifications Competitors Avoid

Gulf ambient temperatures, offshore wind salt exposure, mining chemical contact and semiconductor fabrication cleanroom chemistry all destroy ordinary label materials quickly. Specifications for these environments name durability requirements that most converters cannot meet and will not develop for the volume involved. Those positions carry premiums of roughly 40 to 60% over standard industrial equivalents and face almost no competitive pressure once qualified. The requirement is materials development and accelerated exposure testing capability, which is genuine laboratory investment rather than a converting capability any regional supplier can assemble. Few will make that investment.
Market Impact: Extreme specifications priced 40 to

Who Controls the Margin Pool

Five suppliers hold 47% of the market, measured on identification product revenue, the basis held consistently through this section. Concentration is high for an industrial consumable, and qualification explains it: listed material approval covers substrate, adhesive and print system together, and specifications name approved materials rather than generic descriptions. Brady and Avery Dennison lead, with a meaningful gap behind them. Price rarely decides a listed specification.
Competition runs on three dimensions. Breadth of listed material qualification decides which specifications a supplier can answer without a sixteen week delay. System capability covering printers, software and scheme design decides who wins data centre and large industrial projects. And connector and terminal block suppliers including Phoenix Contact, Weidmuller and WAGO hold marking positions inside their own hardware ranges that a label specialist cannot easily contest.

Two pressures will move rankings. Regional converters take commodity wire marker volume wherever specifications permit equivalents, and that pressure is intensifying in price-driven tenders. Against it, arc flash and data centre applications reward suppliers with engineering relationships and system capability rather than converting cost. Whoever pairs broad listed qualification with genuine system selling gains ground. Very few hold both today.
electrical-labels-market-company-positioning-matrix-1787307235382

Competitive Moat and Risk Dimensions

BRADY CORPORATION

Moat: Listed material and system breadth

Brady holds one of the broadest portfolios of materials qualified against UL, CSA and IEC identification standards, paired with printers, software and scheme design capability. That combination lets the company answer a specification immediately where competitors face a qualification cycle, and it positions Brady inside data centre and industrial projects at the design stage rather than at the purchase order.
BRADY CORPORATION

Risk: Commodity marker price exposure

A substantial part of the volume base sits in standard wire and cable markers, where regional converters undercut by 30 to 40% whenever a specification permits equivalents rather than naming a listed material. Defending that volume means constant specification work at the customer, which is expensive relative to the margin the tier returns.
AVERY DENNISON

Moat: Materials science and adhesive depth

Avery Dennison develops pressure-sensitive substrates and adhesives at a scale no identification specialist matches, which matters where a specification demands survival in Gulf ambient heat, offshore salt exposure or semiconductor cleanroom chemistry. That materials capability supports both its own branded identification range and supply into converters serving the same applications, giving the company two routes into a single demand pool.
AVERY DENNISON

Risk: Limited system and software presence

The company's position is strongest in materials and weaker in the printers, software and scheme design capability that increasingly decides data centre and large industrial project awards. Where identification is sold as a system tied to asset management records, a materials-led proposition competes at a disadvantage against suppliers who reach the specification during facility design rather than at procurement.

Players Tracked

Prominent Players

Brady Corporation
Avery Dennison
HellermannTyton
Panduit
TE Connectivity

Other Key Players

3M
Phoenix Contact
Weidmuller
WAGO
Partex Marking Systems
Grafoplast
Cembre
Newell Brands
Epson
Zebra Technologies
Nitto Denko
Lintec Corporation
UPM Raflatac
Herma
Murrplastik Systemtechnik

Recent Developments

FEBRUARY 2025

Arc flash assessment renewals lift safety label demand independent of construction

Five-year arc flash study review cycles fell due across a large installed base of North American industrial facilities, generating label demand disconnected from new construction activity. This reflects a regulatory review timetable rather than any commercial development, and it favours suppliers holding relationships with electrical engineering consultancies.
Signal: Safety label demand now follows an assessm
JUNE 2025

Data centre operators standardise identification schemes across facility portfolios

Several hyperscale and colocation operators moved to portfolio-wide identification standards covering label format, substrate and asset database integration. These were internal standardisation decisions rather than corporate transactions, and they concentrate specification authority with a small number of very large buyers. Individual site preferences no longer carry weight.
Signal: Specification power in the fastest-growing
OCTOBER 2025

Grid replacement programmes accelerate relabelling of legacy switchgear

Transmission and distribution operators across North America and Europe expanded switchgear and substation replacement schedules, with each replacement labelled to current identification and arc flash standards. This was organic programme expansion funded through regulated capital plans rather than any acquisition or joint venture. Volumes extend well into the next decade.
Signal: Equipment built decades ago returns to ser

Films, Adhesives and Qualified Supply

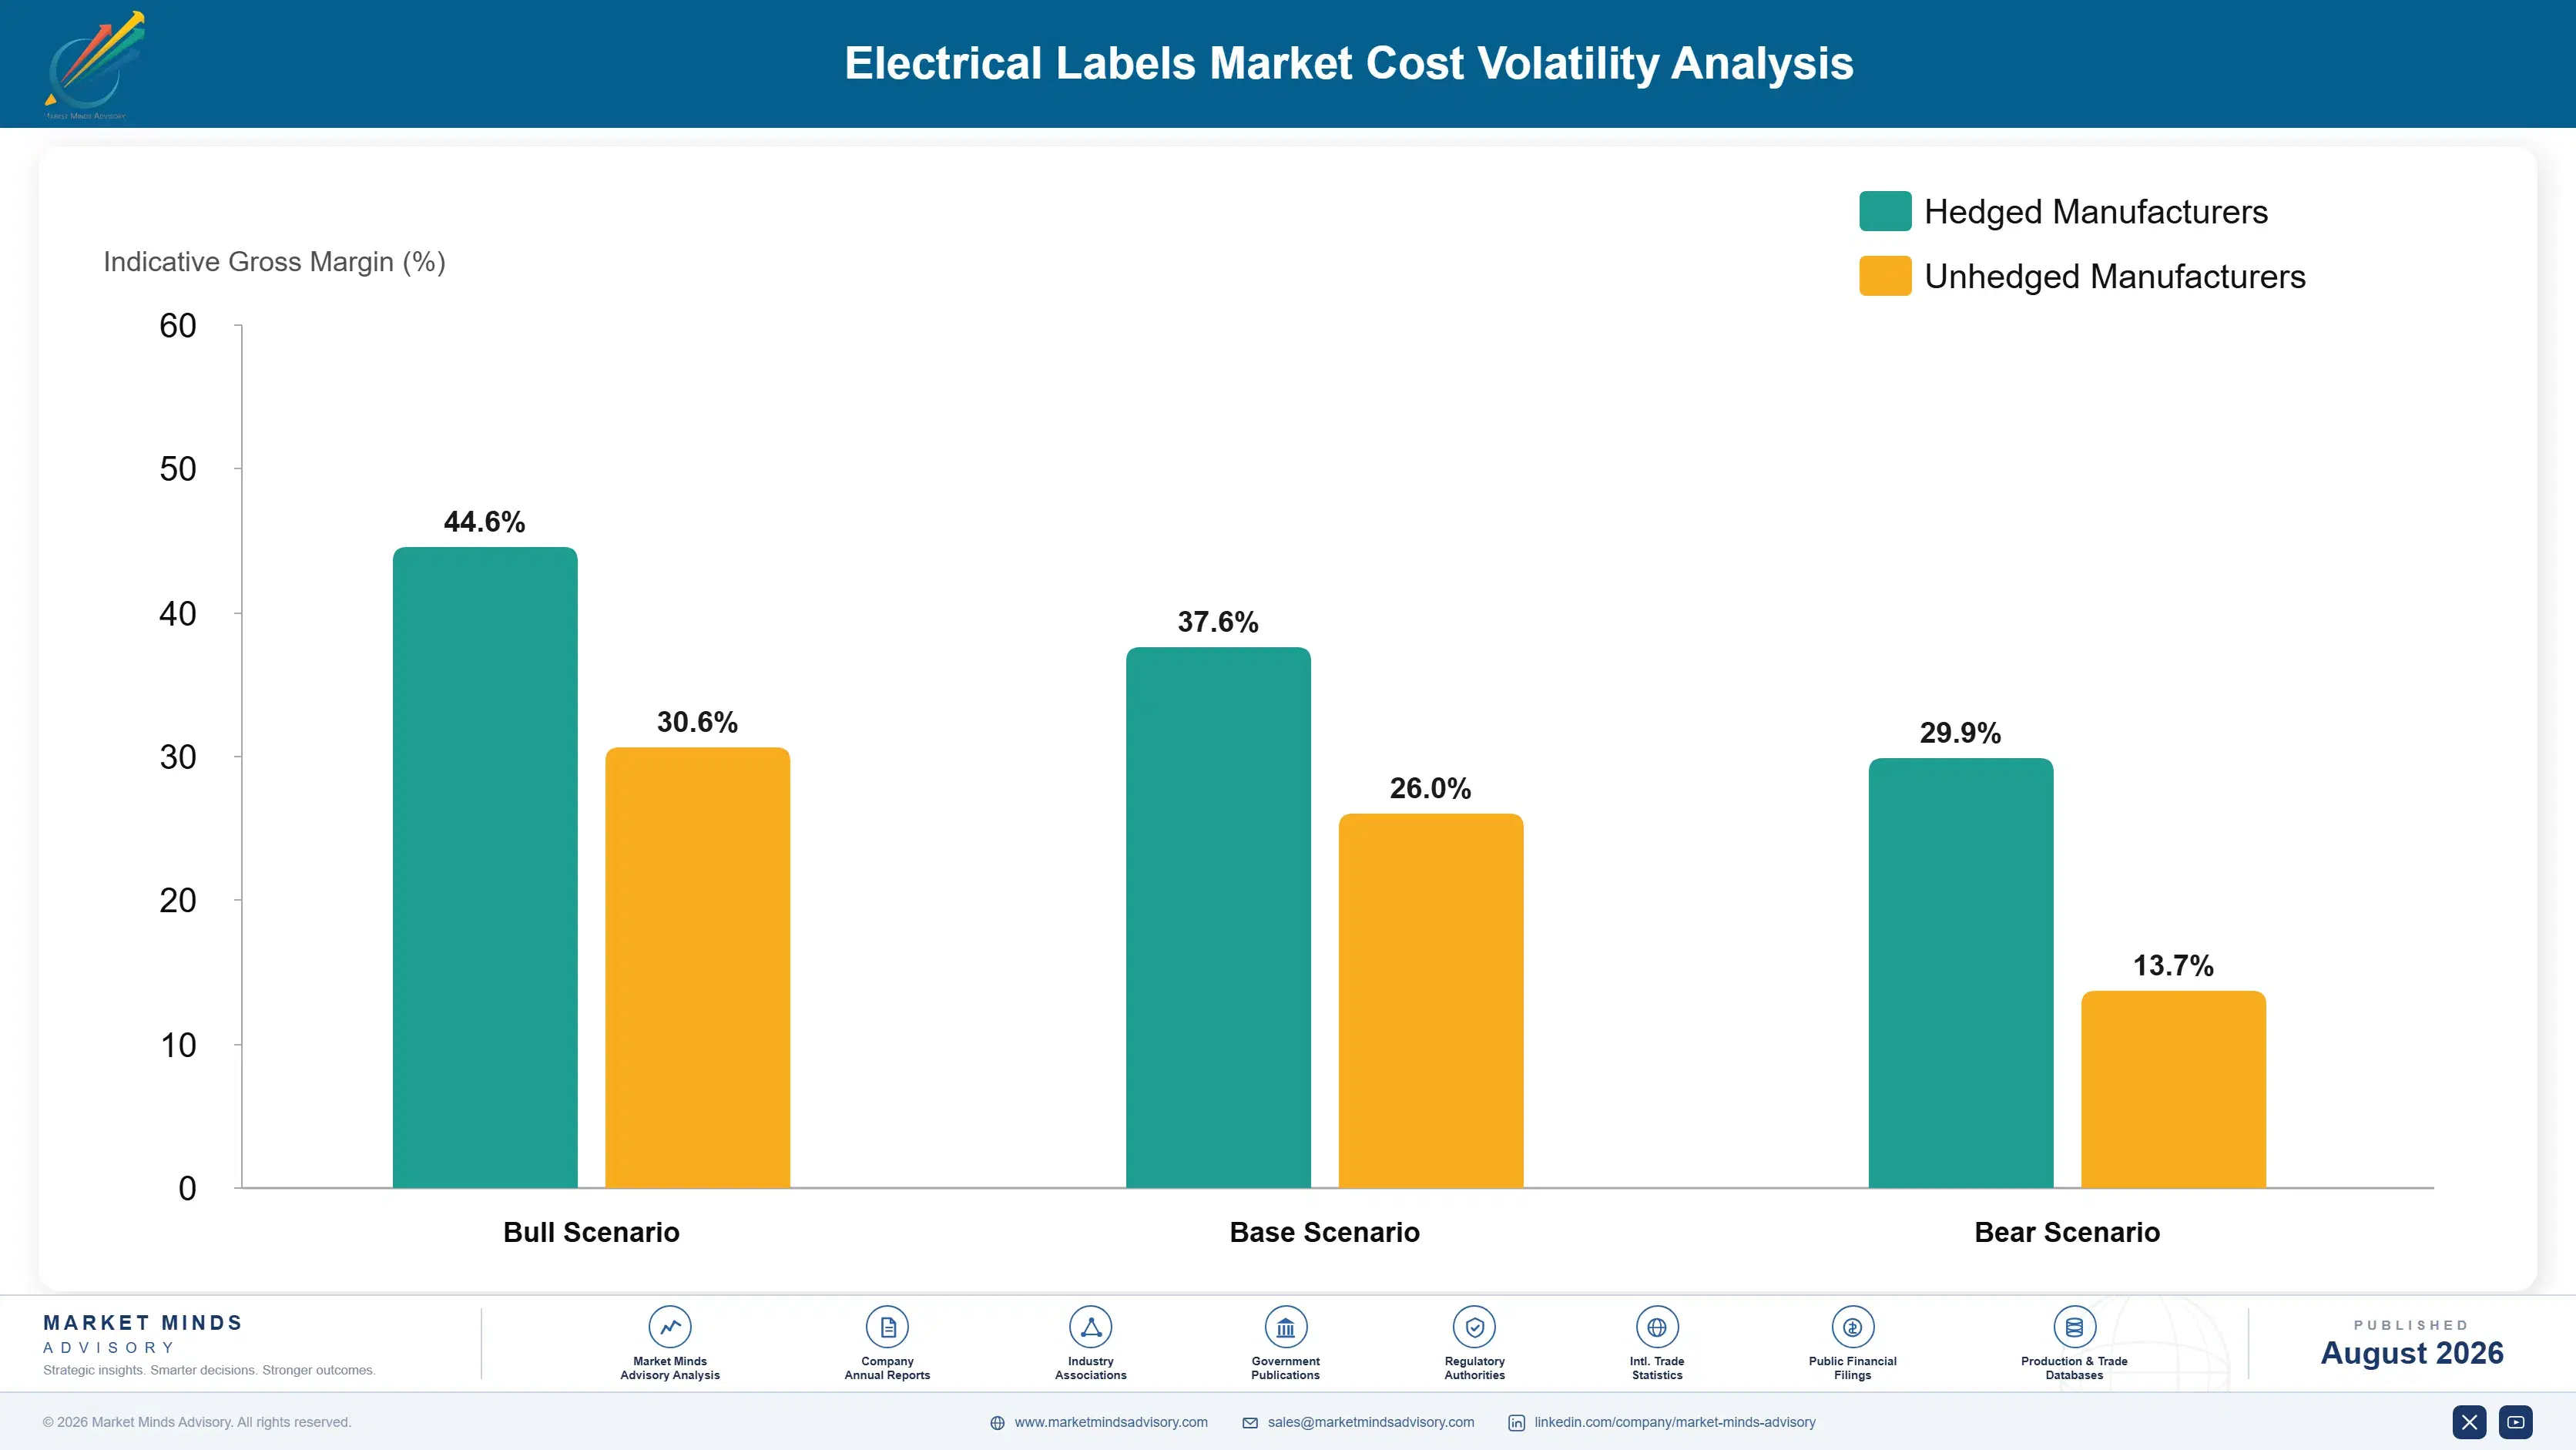
Substrate and adhesive account for roughly 34% of cost of goods, dominated by polyester, polyimide and vinyl films alongside acrylic and silicone adhesive systems, all sourced from specialty converters rather than commodity resin markets. Printing consumables including thermal transfer ribbons run a further 14%. Conversion labour, qualification maintenance and packaging make up the balance, with testing a small but unavoidable recurring line.
Polyimide film pricing moved sharply across 2022 and 2023 as electronics demand competed for the same capacity, and the European energy disruption that International Energy Agency reporting documented raised film conversion costs in parallel. Identification suppliers absorbed much of it, since a listed material cannot be reformulated to a cheaper substrate without reopening qualification. Company annual reports covering identification segments disclose the resulting margin pressure through that period.

Exposure divides by portfolio mix rather than by scale. A supplier weighted toward commodity vinyl markers competes against regional converters buying identical stock, so input increases cannot be passed on at all. One weighted toward listed and extreme-environment materials holds specification lock-in and reprices with far less resistance, because the customer cannot substitute without a sixteen week qualification cycle it has no appetite to run.
electrical-labels-market-cost-volatility-analysis-1787307235583

Dual-qualify substrates against listed standards from two suppliers

Because approval covers substrate and adhesive as a combined system, a single-sourced film becomes a genuine continuity risk rather than a commercial one. Qualifying an equivalent material from a second supplier at the outset costs one additional listing cycle and removes that exposure permanently. The suppliers that did this moved through the 2022 film shortage without allocating customers.

Shift portfolio weight toward specification-locked applications

Listed and extreme-environment materials reprice with far less resistance than commodity markers, because substitution requires a qualification cycle the customer will not run for a marginal saving. Deliberately weighting the portfolio toward arc flash, certification marking and severe-environment work reduces input cost exposure as a consequence of a strategy already justified on growth and margin grounds.

Contract thermal transfer ribbon supply on annual volume terms

Ribbon consumption is predictable from installed printer base and moves with the same film and resin inputs as the labels themselves. Contracting annually against forecast volume rather than buying on spot removes a meaningful part of the remaining input volatility. It also improves negotiating position on the printer hardware itself, which is frequently supplied by the same relationship.

Portfolio Architecture for Margin Defence

The portfolio divides on whether a specification names a listed material or permits an equivalent. Where equivalents are allowed, regional converters compete on identical stock and margins compress toward converting economics. Where a listing is named, substitution requires a qualification cycle the customer will not run, and pricing holds. Arc flash and extreme-environment work sits furthest from substitution pressure of anything in the category. Specification wording draws the whole line.
The tension is that commodity markers carry the volume, the distributor relationships and much of the account presence that specification work depends on. A supplier that withdraws from wire markers to chase safety and system margin loses the shelf position and the field visibility that put it in front of specifiers in the first place. Most leaders run the commodity tier as access rather than as profit. Access and margin have to be managed as separate objectives.

High-value pools concentrate where an engineering study, a certification body or a severe environment sets the requirement. Arc flash labelling, multi-market compliance marking and severe-exposure identification all qualify, and each is specified by someone who never sees the invoice. That separation between specifier and payer is what holds the pricing up.

Volume / Commodity-Adjacent Tier

Standard wire and cable markers, terminal block marking and general panel identification on vinyl or polyester. Competes against regional converters buying identical stock wherever a specification permits equivalents rather than naming a listed material.
Gross Margin: 28-38%

Premium / Certified Tier

Listed materials qualified against UL, CSA and IEC standards for permanent equipment marking, certification and compliance marking across multiple export destinations. Specification lock-in through combined substrate, adhesive and print system approval protects pricing.
Gross Margin: 46-58%

Sustainability / Regulatory / Next-Generation Tier

Arc flash safety labelling tied to engineering studies, and extreme-environment identification for Gulf heat, offshore salt and cleanroom chemistry. The wide margin range reflects sharply differing volumes and testing requirements across those applications.
Gross Margin: 52-74%
electrical-labels-market-portfolio-architecture-1787307236095

High-value Sub-segments and Strategic Watch-out

Arc Flash Safety Labelling

Compounding at 11.1% on five-year study review cycles that generate demand independent of construction activity entirely. Specification originates with the electrical engineering consultancy performing the assessment, which is a commercial relationship most label suppliers have never built at all. Building it takes years of consistent coverage.
Gross Margin: 56-74%

Data Centre Identification Systems

Growing at roughly 42 labels per rack across power, network and asset marking, sold as a system covering printers, software and scheme design. Once commissioned into asset records, changing supplier requires rewriting documentation nobody is willing to touch. The award effectively lasts the facility's operating life.
Gross Margin: 50-64%

Standard Wire and Cable Markers

The volume core at 6.8%, exposed to regional converters undercutting by 30 to 40% wherever specifications permit equivalents. Run for distributor shelf position and field visibility rather than for margin, since it is what puts a supplier in front of specifiers. Withdrawing costs more than it saves.
Gross Margin: 28-38%

Extreme-Environment Identification

The watch-out and the opportunity together. Gulf heat, offshore salt exposure and semiconductor cleanroom chemistry demand materials most converters will not develop, and premiums of 40 to 60% follow. Accelerated exposure testing capability is the entry requirement here. Accelerated exposure testing is genuine laboratory investment.
Gross Margin: 58-76%

Why Specifications Outlive Buyers

Identification demand is annuity revenue disguised as project revenue. A panel builder qualifies a material during plant commissioning and keeps ordering it for the life of the product line, because changing means requalifying a combined substrate, adhesive and print system. A data centre scheme embedded in asset records is harder still to change. Roughly 62% of volume is factory-applied against specifications that typically outlast the engineer who wrote them.
Depth varies sharply by end use. Data centres are deepest, marking at 42 labels per rack and integrating identification into asset management. Utilities buy deeply on long replacement cycles with strict durability requirements. Panel builders buy in volume on moderate specifications and switch more readily on price. Construction contractors sit shallowest, buying to code minimums from distributor stock without any material preference at all.

The specifying population is changing. Identification used to be decided by a panel engineer choosing from a distributor catalogue. Increasingly it is set at portfolio level by data centre operators, utility asset managers and multinational manufacturers writing one standard across every facility, which concentrates specification authority into far fewer hands. That is a different sales problem entirely.
electrical-labels-market-end-use-penetration-index-1787307236592

Where Identification Holds Price

These are among the four positions where our research anticipates prominent divergence between winners and laggards over the coming forecast period. Each is grounded in the demand model, the regulatory perimeter, and the announced capacity pipeline.
01 / ASSESSMENT CYCLE CAPTURE

Arc flash demand follows an engineering calendar, not construction spending

NFPA 70E requires arc flash studies be reviewed at least every five years, and each review generates fresh labels carrying updated incident energy values regardless of whether anything was built. That makes the segment's 11.1% growth different in kind from the rest of the category, since it runs on a compliance timetable rather than a capital spending one. Capturing it means holding relationships with the electrical engineering consultancies performing those studies rather than with the distributors or panel builders who dominate everything else.
02 / LISTED QUALIFICATION BREADTH

Broad upfront listing converts a sixteen week barrier into a same-week answer

Approval covers the substrate, the adhesive and the print system together as one combined system, and a new listing takes around sixteen weeks to clear before any customer specification work can even begin. Suppliers holding broad platform qualification can vary format, size and print method inside an already approved envelope and answer the enquiry immediately. Competitors qualifying reactively lose the enquiry entirely before their submission clears, which makes upfront listing breadth one of the cheapest genuinely defensible positions available anywhere in this market.
03 / SYSTEM SELLING ACCESS

Data centre schemes are won at design and never rebid afterwards

A hyperscale facility marks at roughly 42 labels per rack and integrates that identification directly into its asset management records during commissioning. A supplier that provides only the label stock concedes the whole position to whoever supplies the printers, software and scheme design at the facility design stage. Once a scheme is embedded in operating documentation, changing supplier means rewriting records that nobody will authorise, so the facility's entire operating consumption then follows that one original design-stage award for years.
04 / ENVIRONMENTAL DURABILITY POSITIONING

Extreme specifications carry premiums because competitors will not develop them

Gulf ambient temperature, offshore wind salt exposure and semiconductor cleanroom chemistry will destroy ordinary label materials within a very few years of installation. Specifications written for those environments name durability requirements that most converters cannot meet and will not develop for the modest volume involved. Premiums run roughly 40 to 60% above the standard industrial equivalents, with almost no competitive pressure at all, and the entry requirement here is accelerated exposure testing capability in a laboratory rather than any converting capacity.

Engagement Snapshot From the Field

A live engagement with an industry participant carrying material or product regulatory and market exposure ahead of a defining policy shift, showing how our research translates into a defensible multi-year portfolio strategy.
MARKET MINDS ADVISORY · CLIENT ENGAGEMENT SUMMARY
Electrical Labels Producer Strategic Portfolio Review and Transition Roadmap 2026·Investment Scenario on Electrical Labels Exposure Evaluation 2025-26
CLIENT PROFILE
An identification supplier with roughly USD 480 million in electrical labelling revenue (client-reported, unverified by MMA), weighted heavily toward wire markers and terminal marking sold through electrical distribution across North America and Western Europe. Arc flash and data centre applications together represented under 12% of revenue (client-reported, unverified by MMA), despite being the two fastest-growing applications in the company's own served market.
STRATEGIC CHALLENGE
Distributor price pressure on wire markers had compressed margins for three consecutive years, and regional converters were winning tenders wherever specifications allowed equivalents. Management proposed a cost reduction programme targeting converting efficiency. The commercial team argued the problem was channel position rather than cost, since the fastest-growing demand never passed through distribution at all.
MMA APPROACH
MMA traced specification origin for a sample of recent awards, separating decisions made by distributors, panel builders, engineering consultancies and facility operators. Arc flash study activity was mapped against the client's account coverage, and data centre identification awards were reconstructed to identify at what project stage the supplier had been selected across sixteen recent facilities.
KEY FINDINGS
  1. Arc flash label specifications originated with electrical engineering consultancies in nearly every case examined, and the client had no commercial relationship with any of the twelve largest firms performing those studies.
  2. Data centre awards were decided during facility design rather than at procurement, and the client's distribution-led model reached those projects an average of eleven months after the specification had closed.
  3. Converting cost was already competitive with regional rivals; the price gap in lost tenders came from specifications permitting equivalents, not from any manufacturing disadvantage the client held.
  4. The client held broad listed material qualification that was being used defensively in existing accounts but never presented as a response-time advantage to new specifiers.
CLIENT PROFILE
An identification supplier with roughly USD 480 million in electrical labelling revenue (client-reported, unverified by MMA), weighted heavily toward wire markers and terminal marking sold through electrical distribution across North America and Western Europe. Arc flash and data centre applications together represented under 12% of revenue (client-reported, unverified by MMA), despite being the two fastest-growing applications in the company's own served market.
STRATEGIC CHALLENGE
Distributor price pressure on wire markers had compressed margins for three consecutive years, and regional converters were winning tenders wherever specifications allowed equivalents. Management proposed a cost reduction programme targeting converting efficiency. The commercial team argued the problem was channel position rather than cost, since the fastest-growing demand never passed through distribution at all.
MMA APPROACH
MMA traced specification origin for a sample of recent awards, separating decisions made by distributors, panel builders, engineering consultancies and facility operators. Arc flash study activity was mapped against the client's account coverage, and data centre identification awards were reconstructed to identify at what project stage the supplier had been selected across sixteen recent facilities.
KEY FINDINGS
  1. Arc flash label specifications originated with electrical engineering consultancies in nearly every case examined, and the client had no commercial relationship with any of the twelve largest firms performing those studies.
  2. Data centre awards were decided during facility design rather than at procurement, and the client's distribution-led model reached those projects an average of eleven months after the specification had closed.
  3. Converting cost was already competitive with regional rivals; the price gap in lost tenders came from specifications permitting equivalents, not from any manufacturing disadvantage the client held.
  4. The client held broad listed material qualification that was being used defensively in existing accounts but never presented as a response-time advantage to new specifiers.
RECOMMENDED STRATEGY
Phase 1: Phase 1 (months 1 to 7): Build direct coverage of the twelve largest electrical engineering consultancies performing arc flash studies in the client's markets. Phase 2: Phase 2 (months 7 to 18): Assemble a data centre system offer covering printers, software and scheme design, sold at facility design stage rather than through distribution. Phase 3: Phase 3 (months 18 to 32): Reposition wire markers as channel access, holding volume for shelf presence while shifting margin expectation onto specification-locked tiers.
OUTCOME
The cost reduction programme was scaled back and roughly USD 11 million redirected into specification-facing commercial coverage (client-reported, unverified by MMA). Arc flash revenue grew by 34% within two years, and the client was specified at design stage on nine data centre projects. Blended electrical labelling gross margin improved by approximately five points (client-reported, unverified by MMA).

Frequently Asked Questions

Foundational context covering the market sizes, CAGR, scope, country, region and competition that inform every finding below. This section is provided to cover basics and most often pre-purchase conversations, answered from the MMA Primary Research Dataset.

What is the current size of the Electrical Labels Market?

The global market was worth USD 2.6 billion in 2025, reaching USD 2.79 billion in 2026. East Asia holds the largest regional share at 30% of consumption.

How large will the Electrical Labels Market be by 2036?

MMA forecasts USD 5.7 billion by 2036, an expansion multiple of 2.04 times the 2026 base. That represents roughly USD 2.91 billion of incremental value.

What is the CAGR for the Electrical Labels Market 2026 to 2036?

The base case compounds at 7.4% annually, with a bull case of 8.6% and a bear case of 6.2%. Historical growth from 2020 to 2025 ran at 6.2%.

Which segment is growing fastest?

Arc flash and electrical safety warning labels compound at 11.1%, exactly 1.50 times the market rate. Mandatory five-year study reviews make the demand recurring rather than construction-linked.

Who are the major companies in the Electrical Labels Market?

Brady Corporation, Avery Dennison, HellermannTyton, Panduit and TE Connectivity hold a combined 47% of the market. Terminal block suppliers including Phoenix Contact and WAGO hold marking positions inside their own hardware.

Which country is growing fastest?

India compounds at 10.2%, ahead of every other national market. Transmission investment, expanding domestic switchgear manufacturing and rapid data centre construction all contribute directly to that rate.

Report Segmentation Architecture

The full report scope spans multiple orthogonal segmentation dimensions, with cross-tabulated demand data provided for each dimension pair. Coverage extends further to regional breakdowns, trend trajectories, and the competitive detail needed to support segment-level decision-making.

By Label Application Type

  • Wire and Cable Markers
  • Panel and Component Identification Labels
  • Arc Flash and Electrical Safety Warning Labels
  • Certification and Compliance Marking Labels
  • Asset and Traceability Labels
  • Terminal Block and Device Marking Labels

By End-Use Industry

  • Data Centres and Telecommunications
  • Utilities and Grid Infrastructure
  • Industrial Manufacturing and Automation
  • Commercial and Institutional Construction
  • Transportation and Mobile Equipment

By Commercial Dimension

  • Electrical Distribution Channel
  • Direct Supply to Equipment Manufacturers
  • Project and System Specification Sales
  • Maintenance and Aftermarket Supply

By Region

  • North America
  • Western Europe
  • East Asia
  • South Asia and Pacific
  • Latin America
  • Middle East and Africa
  • Eastern Europe

Scope, Methodology, and Coverage

Every figure in this report is reproducible from documented input assumptions. The scope below maps the historical period, the forecast horizon, the segmentation dimensions, and the countries covered, alongside the underlying primary and qualitative methodology.
Historical Period
2020 to 2025
Forecast Period
2026 to 2036
Base Year
2025 (USD billions; MMA Primary Research Dataset, August 2026)
Market Definition
The market covers printed and pre-printed labels, markers and identification materials applied to electrical conductors, cables, panels, components, terminal blocks and equipment enclosures, including arc flash and safety warning labels, certification and compliance marking, and asset identification for electrical assets. Printing hardware, identification software, cable ties and non-printed marking accessories are excluded, as are general industrial labels outside electrical applications. Sizing is measured at supplier revenue in current prices.
Quantitative Units
USD billions (current prices); label unit volumes and square metres of converted material where applicable
Segmentation Dimensions
By Label Application Type; By End-Use Industry; By Commercial Dimension; By Region
Regions Covered
North America, Western Europe, East Asia, South Asia and Pacific, Latin America, Middle East and Africa, Eastern Europe
Countries Covered
USA, China, Germany, France, UK, Japan, South Korea, India, Australia, Canada, Brazil, Mexico, Indonesia, Vietnam, Thailand, Malaysia, UAE, Saudi Arabia, South Africa, Nigeria, Turkey, Poland, Netherlands, Italy, Spain, Sweden, Switzerland, Argentina, Colombia, Singapore, and additional markets relevant to this sector
Key Companies Profiled
Brady Corporation, Avery Dennison, HellermannTyton, Panduit, TE Connectivity, 3M, Phoenix Contact, Weidmuller, WAGO, Partex Marking Systems, Grafoplast, Cembre, Newell Brands, Epson, Zebra Technologies, Nitto Denko, Lintec Corporation, UPM Raflatac, Herma, Murrplastik Systemtechnik
Quantitative Methodology
Primary survey, n=3,800 respondents, Q4 2025, six countries; demand-side model with trade association cross-validation
Qualitative Methodology
47 expert interviews, Q4 2025; applied to validate demand model assumptions, identify emerging dynamics, and assess competitive positioning
Report Format
PDF and XLSX data workbook (Word format preview document)
Publisher
Market Minds Advisory
Report Code
MMA-2026-PAC-633
Published
August 2026
Contact
sales@marketmindsadvisory.com | www.marketmindsadvisory.com

Purchase the full Electrical Labels Market Report (2026 to 2036).

The full report sizes electrical labelling across six application types, three commercial dimensions and seven regions, with annual forecasts to 2036 under base, bull and bear scenarios. Specification origin is traced by application, separating decisions made by distributors, panel builders, engineering consultancies and facility operators, which determines where a supplier must hold commercial coverage. Arc flash study review cycles are modelled against installed equipment populations to project recurring demand independent of construction. Listed material qualification portfolios are compared supplier by supplier. Twenty companies are profiled on a consistent identification revenue basis.
Specification origin traced by application and project stage
Arc flash study review cycles modelled against installed equipment
Listed material qualification portfolios compared across twenty suppliers
Data centre identification density benchmarked by facility type
Regional converter price gaps quantified by specification wording
Extreme-environment durability requirements assessed by geography

Built For The People Who Decide

From boardroom strategy to bench-side execution, this report is read cover-to-cover by leaders shaping the next decade of their industry, turning demand scenarios, market dynamics and valuation benchmarks into decisions.
CXOs/ Presidents/ VPs/ Managers
M&A and Corporate Development
Strategy Teams and R&D Heads
Procurement and Product Directors
Regulatory and Compliance Leaders
Investor Relations and Equity Analysts