Market Minds Advisory
Electric Submersible Pumps Market

Electric Submersible Pumps Market: Artificial Lift as a Well Economics Problem

Shale operators now run electric submersible pumps as a default artificial lift choice rather than a workover afterthought, aging conventional fields extend pump life through digital monitoring, and mechanical failure downtime increasingly decides supplier contracts.

Lead Analyst

David Horsley

Published

September 2026

Make Smarter Decisions with Customized Research Insights

Request a free sample report and evaluate market opportunities, growth trends, and competitive dynamics relevant to your business needs.

2025 MARKET VALUE$9.6BMarket Size 2025
2036 FORECAST VALUE$19.0BBase Case , 2026 to 2036
CAGR 2026 TO 20366.4 %Bull 7.6% / Bear 5.2%
INCREMENTAL OPPORTUNITY$8.8BNet 10- year value creation
EXPANSION MULTIPLE1.86x2036 value over 2026 base
Strategic Levers
M&A Pipeline
Regional Outlook
Country Rankings
Competitive Intelligence
Segmental Deep-dive
Call-Us : 91 93563 13602

Executive Snapshot and Market Trajectory

Operators now treat electric submersible pump reliability as a production economics problem, not a routine maintenance line item, since unplanned pump failure in a horizontal shale well can idle output worth far more than the replacement unit itself for weeks at a stretch during peak production.
Unconventional shale wells lead growth at 9.5%, roughly 1.48 times the overall rate, as horizontal completions with high fluid volumes demand pump designs conventional vertical wells never required. North America holds the largest regional share at 30%, anchored by Permian Basin drilling density and the sheer number of individual wells requiring artificial lift equipment within a handful of prolific operating counties across West Texas and New Mexico.
Concentration runs high at 68% held by five suppliers, since building a reliable downhole electric motor and pump train demands decades of accumulated metallurgical and electrical engineering few challengers can replicate quickly at comparable scale. Digital monitoring platforms that predict failure before it happens are becoming a genuine differentiator, and operators increasingly select suppliers on documented multi-year run-life performance data rather than upfront unit price across their entire multi-basin producing portfolio each year.
Market Definition
The electric submersible pumps market covers submersible pump systems, motors, cables, and downhole monitoring equipment used for artificial lift in oil and gas production, mine dewatering, and industrial water transfer applications. It includes original equipment sales, replacement units, and run-life service contracts. Surface pumping equipment, rod lift systems, and gas lift installations are excluded.
Base Year Value
$9.6B in 2025 (MMA Primary Research Dataset, August 2026)
Forecast Period
2026 to 2036, eleven discrete annual values
CAGR
6.4% base case. Bull 7.6%. Bear 5.2%.
Fastest Growth Segment
Unconventional Shale Wells: 9.5% CAGR
Fastest Growth Country
United States: 10.2% CAGR
Fastest Growth Region
South Asia and Pacific: 8.5% CAGR
Largest Region
North America: 30% of 2025 global value
Market Leaders
SLB, Baker Hughes Company, Weatherford International plc, ChampionX Corporation, Borets International Limited. Source: MMA Analysis based on company annual reports.
Primary Survey
n=3,800 procurement and R&D decision-makers, Q4 2025, six countries
Methodology
Demand-side build-up, cross-validated against public data, 47 expert interviews

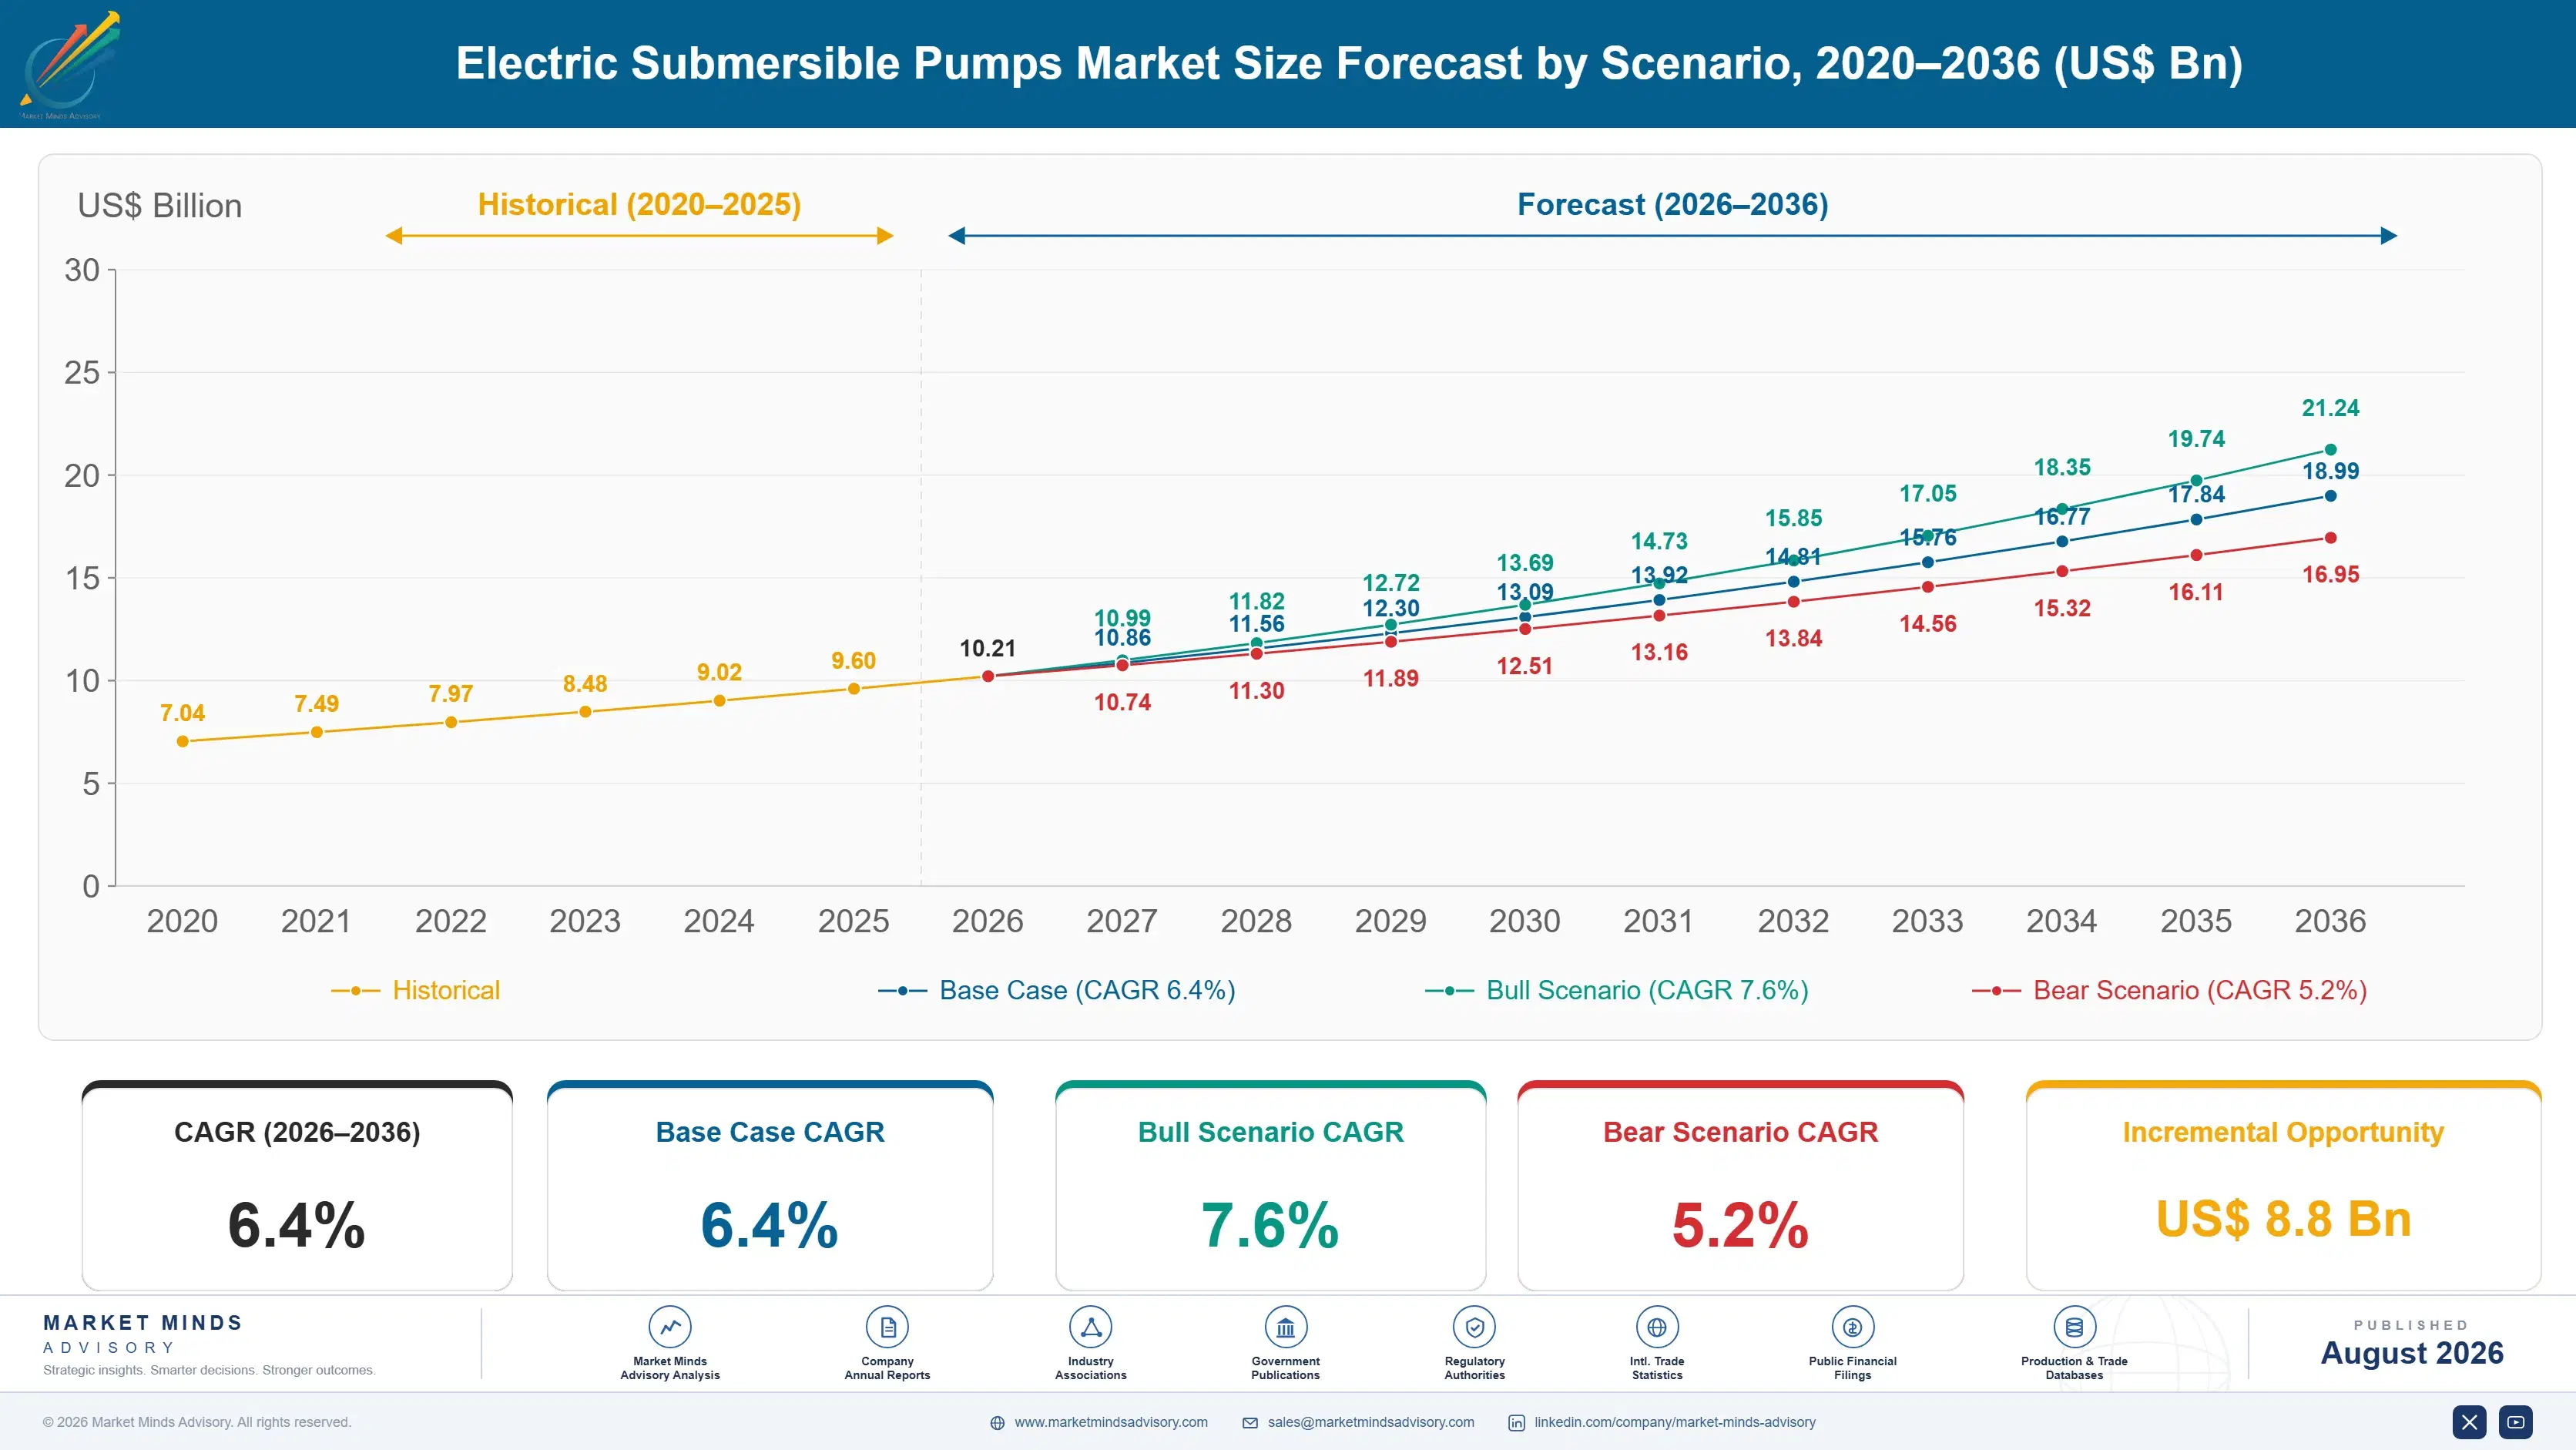
Electric Submersible Pumps Market Forecast Scenarios

electric-submersible-pumps-market-size-forecast-scenario-1787300457113
Between 2020 and 2025 the market grew at an estimated 5.6% annually, recovering from the 2020 oil price collapse as shale operators resumed drilling and offshore projects sanctioned earlier finally reached completion. Growth accelerated after 2022 as operators prioritized run-life reliability over unit cost following widespread supply chain disruption across the broader oilfield services sector generally.
Three mechanisms carry the base case to 6.4%. First, shale well counts keep climbing across the Permian and other basins, and each new horizontal well needs a pump sized for its specific fluid profile. Second, digital monitoring adoption extends average run life, which sounds like it should shrink replacement demand but instead frees operators to specify higher-value pump packages. Third, offshore project sanctioning is recovering as deepwater breakeven costs fall below prior cycle thresholds.
The bull case at 7.6% assumes sustained oil prices above 70 dollars a barrel keep shale drilling programs fully funded through the forecast period. The bear case at 5.2% assumes a demand-side slowdown in global oil consumption compresses drilling budgets industry-wide, delaying both replacement cycles and new well completions across most producing basins worldwide over time.

Run Life as the Real Competitive Metric

Electric submersible pumps sit at the center of well economics for any horizontal shale or deviated offshore producer, since the pump, not the reservoir, usually decides how much fluid actually reaches the surface each day. Reliability engineering, not raw lifting capacity, increasingly separates competing suppliers across nearly every major producing basin worldwide, from the Permian to the North Sea to offshore West Africa.
MARKET CONCENTRATION (CR5)68%Five suppliers hold most global pump system revenue
AVERAGE RUN LIFE600 to 900 daysTypical downhole operating duration before failure occurs today
TOP PRODUCING COUNTRY SHARE27%United States supplies largest share of installed pump base
REPLACEMENT CYCLE LENGTH2 to 3 yearsPump systems typically require replacement within this window
POWER COST SHARE35-45%Electricity consumption dominates ongoing artificial lift operating expense
TRADE INTENSITY38% cross-borderPump components frequently cross borders before final field assembly
Commercially, the category behaves like a specialized rotating equipment business wrapped inside an oilfield service relationship. Suppliers bundle pump hardware with monitoring software and field technician support under multi-well contracts, which locks operators into a single vendor across an entire pad or field rather than encouraging unit-by-unit shopping on price alone. Switching suppliers mid-field is disruptive enough that most operators tolerate modest price premiums for proven reliability.
Over the next decade, expect digital failure prediction to become standard rather than premium, as sensor cost keeps falling and operators demand data ownership rather than vendor-locked platforms. Electrification of surface power in remote basins will also reshape which suppliers can bid competitively on total lifting cost, particularly as grid connections reach previously diesel-powered well pads across West Texas and beyond.

Market Trends

Digital Failure Prediction Becomes Standard Contract Term

Operators are increasingly writing predictive monitoring requirements directly into pump supply contracts, requiring vendors to deliver real-time vibration, temperature, and current signature data rather than a bare hardware warranty. Baker Hughes and SLB have both expanded cloud-based monitoring platforms that flag degradation signs weeks before catastrophic failure, letting operators schedule replacement during planned downtime instead of losing production unexpectedly. ChampionX has followed with a comparable offering for smaller independent operators who previously lacked access to this diagnostic capability. The shift is turning pump selection into a data infrastructure decision as much as a mechanical one.
Market Impact: Adds 45,000 replacement units yearly
Permian Basin Well Density Reshapes Pump Specification

Well spacing across the Permian Basin has tightened considerably over the past five years, and each new well now competes with close neighbors for reservoir pressure, producing more variable and often gassier fluid streams than older vertical wells generated. That variability is pushing pump manufacturers toward gas-handling designs and modular configurations adjusted after installation rather than replaced outright when flow conditions shift. Borets and Novomet have both introduced gas-separator packages engineered for these conditions, and independent operators report meaningfully longer run life after switching away from standard vertical-well pump designs entirely.
Market Impact: Adds 8 new deepwater projects

Market Opportunities and Growth Drivers

Rising Global Well Count Sustains Replacement Demand

The world's producing well count keeps climbing as shale drilling programs remain active across the Permian, Bakken, and Eagle Ford, and every horizontal well drilled today becomes a replacement pump customer within two to three years of first production. The Energy Information Administration reports United States crude output near record levels sustained through 2025, and each incremental barrel typically requires artificial lift once reservoir pressure declines below natural flow thresholds. That structure gives the market an annuity-like replacement tail independent of new drilling activity across nearly every actively producing basin today.
Market Impact: Raises lifting cost 20% in spikes

Offshore Project Sanctioning Recovers After Multi-Year Pause

Deepwater project sanctioning slowed sharply after 2015 as operators cut capital budgets following the oil price collapse, but breakeven costs on new offshore developments have fallen enough that Brazil, Guyana, and the Gulf of Mexico are all seeing renewed final investment decisions. Each sanctioned deepwater project commits to submersible pump systems rated for far higher pressure and temperature than onshore equivalents, carrying substantially higher unit value per well. Petrobras and ExxonMobil have both disclosed expanded subsea development programs through 2030, and suppliers with qualified offshore-rated product lines are capturing a disproportionate share of that new offshore capital spending.
Market Impact: Cuts run life by 40%

Market Restraints and Challenges

Electricity Cost Volatility Squeezes Lifting Economics

Power consumption accounts for a substantial share of total artificial lift operating cost, since submersible pumps run continuously and draw meaningful current, particularly in high-volume shale applications. The root cause is grid exposure: remote well pads increasingly depend on regional electricity markets whose prices spike during peak demand periods, especially across Texas's ERCOT grid during summer heat waves. That volatility makes lifting cost harder to forecast and squeezes margin for smaller independent operators without hedging capability. Larger operators are responding by installing on-site generation or negotiating fixed-price power purchase agreements that insulate lifting economics from spot market swings entirely.
Market Impact: Cuts unplanned downtime by 35%

Harsh Downhole Conditions Limit Equipment Life

Submersible pumps operating in high-temperature, high-solids, or highly corrosive well environments fail considerably faster than published run-life averages suggest, particularly in older Permian wells producing increasing water cuts as they mature. The root cause is materials science: standard elastomer seals and steel components degrade faster than premium metallurgy alternatives, which cost more upfront but extend service life meaningfully. That gap creates real total-cost-of-ownership confusion for operators comparing quotes on sticker price alone. Suppliers are responding with abrasion-resistant coatings and premium corrosion-resistant alloys marketed specifically at operators in the harshest producing environments.
Market Impact: Extends average run life 25%
3 additional market trends, 4 additional growth drivers, and 2 additional restraints and challenges are covered in the full report. Contact sales@marketmindsadvisory.com to access the complete intelligence.

Segment CAGR and Growth Architecture

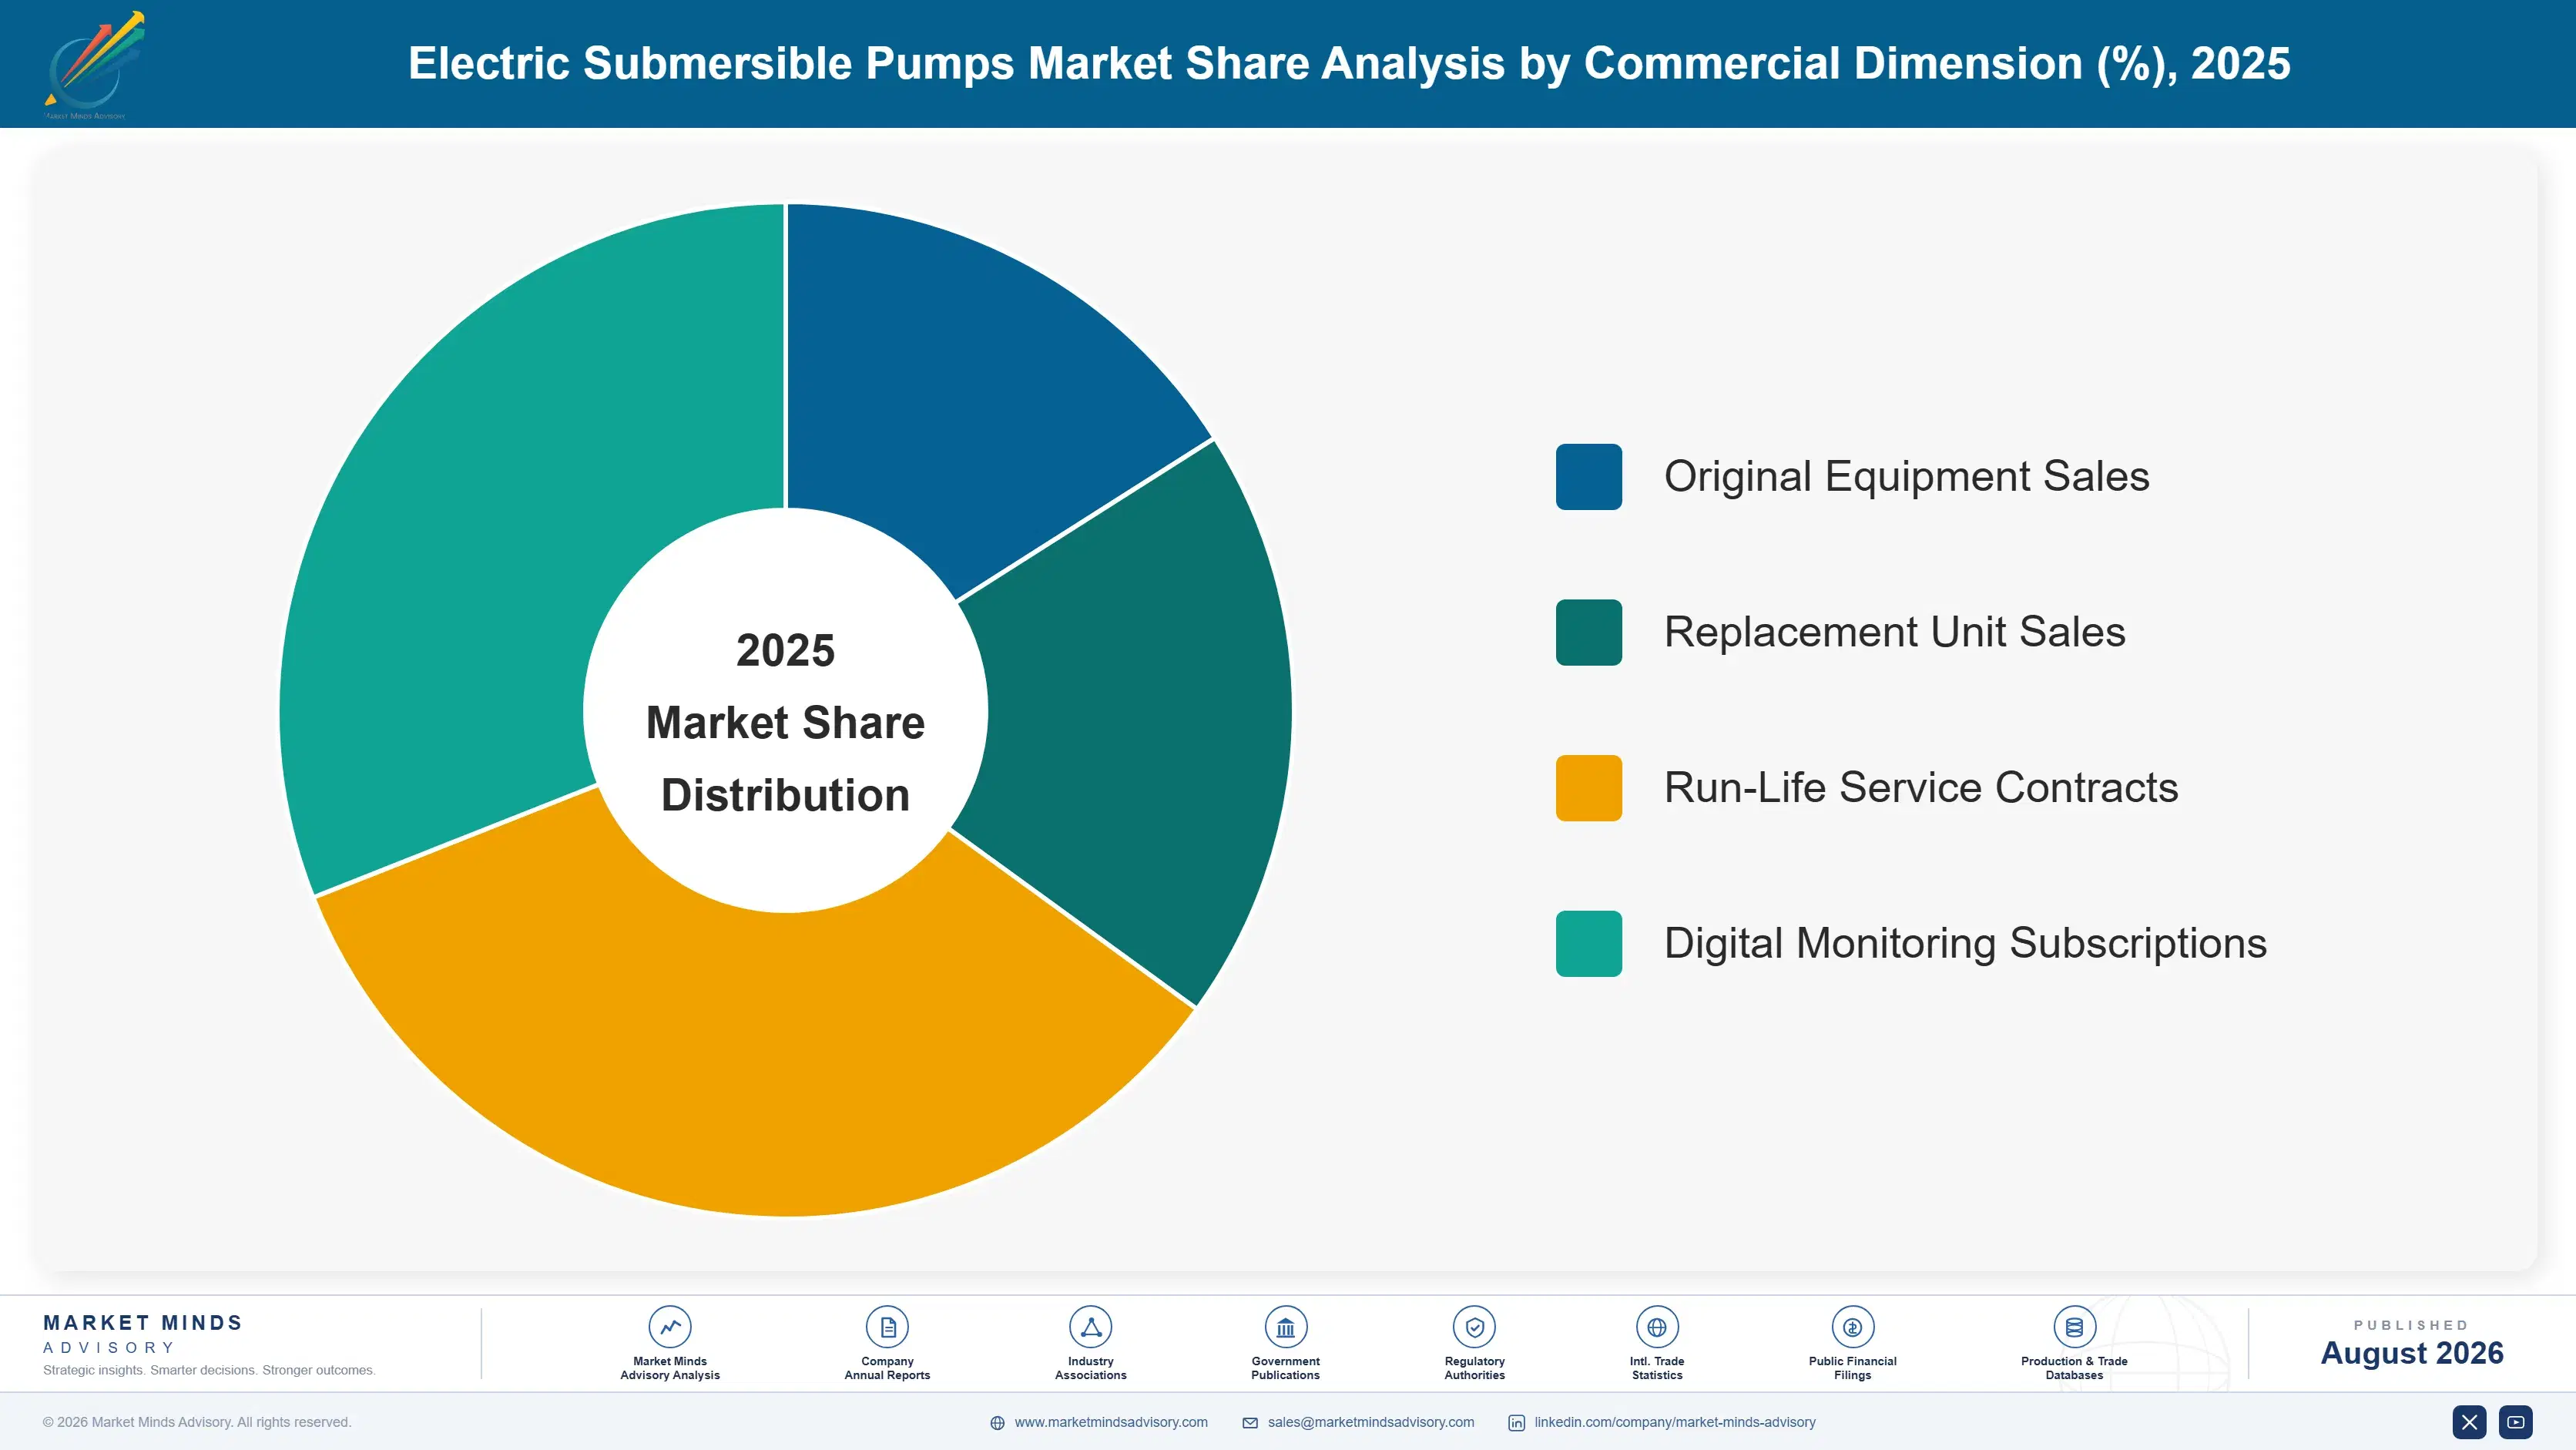
Segmentation follows end-use deployment application, a single logic spanning onshore and offshore oil and gas production, unconventional shale wells, water injection, mining dewatering, and industrial water transfer. Each application carries distinct pump specification, pressure rating, and buyer procurement pattern, so commercial position tracks deployment context rather than pump size, horsepower rating, or motor voltage class alone.
electric-submersible-pumps-market-market-share-analysis-1787300457644

Unconventional Shale Wells

Unconventional shale wells grow fastest at 9.5%, about 1.48 times the overall market rate, as horizontal well counts keep climbing across the Permian, Bakken, and Eagle Ford basins and each well requires a pump engineered for higher fluid volumes and gassier streams than conventional vertical wells ever produced. Standard pump packages built for older vertical completions are steadily losing share to purpose-built horizontal configurations with integrated gas separation. Borets, Novomet, and ChampionX have all expanded shale-specific product lines over the past three years, and independent operators increasingly specify these packages by default on new horizontal completions rather than defaulting to legacy designs carried over from older vertical well programs across the same acreage.
CAGR 9.5%

Mining Dewatering Applications

Mining dewatering applications grow second-fastest at 7.5%, driven by deepening open-pit and underground mine operations that require continuous water removal to keep working faces accessible and safe for equipment and personnel. Copper, lithium, and iron ore producers across Chile, Australia, and increasingly the Democratic Republic of Congo are extending mine depth well beyond historical norms, and each additional hundred meters of depth meaningfully increases pumping head requirements and total system cost. Grundfos and Xylem have both expanded mining-specific submersible pump lines engineered for abrasive slurry handling, and mining companies increasingly specify multi-year service contracts rather than one-off equipment purchases given how costly unplanned dewatering failure becomes underground during active production.
CAGR 7.5%
Full segment breakdown across 6 segments available in the complete report.

Regional Architecture and Country Demand Map

North America leads at 30% of global value on Permian Basin shale well density, followed by East Asia at 24% and Western Europe at 18% on North Sea mature-field replacement demand. South Asia and Pacific, Latin America, Middle East and Africa, and Eastern Europe together account for the remainder.

North America

The Permian Basin anchors North American demand almost single-handedly, since its sheer well density means more individual horizontal completions requiring artificial lift than any comparable basin worldwide. Operators there increasingly specify digital monitoring as standard rather than optional equipment, given how much production value a single unplanned failure can idle across a multi-well pad. The Bakken and Eagle Ford add meaningful secondary demand, while Gulf of Mexico offshore projects contribute a smaller but higher-value segment given the premium pricing offshore-rated pumps command in deepwater applications. Canada's oil sands and Montney formation add further steady volume. Growth of 7.5% outpaces the global rate as well counts keep climbing and replacement cycles shorten under harsher shale fluid conditions across the basin.
Share: 30% | CAGR: 7.5% (2026 to 2036)

Western Europe

The North Sea drives most Western European demand, though as a mature basin its character differs sharply from shale-driven growth elsewhere: operators there run pumps in aging platforms where replacement cost and logistics, not new well drilling, dominate procurement decisions. Norway and the United Kingdom both maintain active decommissioning-adjacent replacement programs on platforms extending field life well beyond original design horizons, often through enhanced oil recovery projects that reactivate previously marginal wells. Equinor and Shell both continue investing in subsea pump technology to extend North Sea asset life further into the 2030s. Growth of 4.8% trails the global average because well counts are broadly flat, with demand driven almost entirely by like-for-like replacement rather than new-field development across the region.
Share: 18% | CAGR: 4.8% (2026 to 2036)
Regional intelligence for 5 additional markets available in the complete report: East Asia, South Asia and Pacific, Latin America, Middle East and Africa, Eastern Europe. Contact sales@marketmindsadvisory.com.
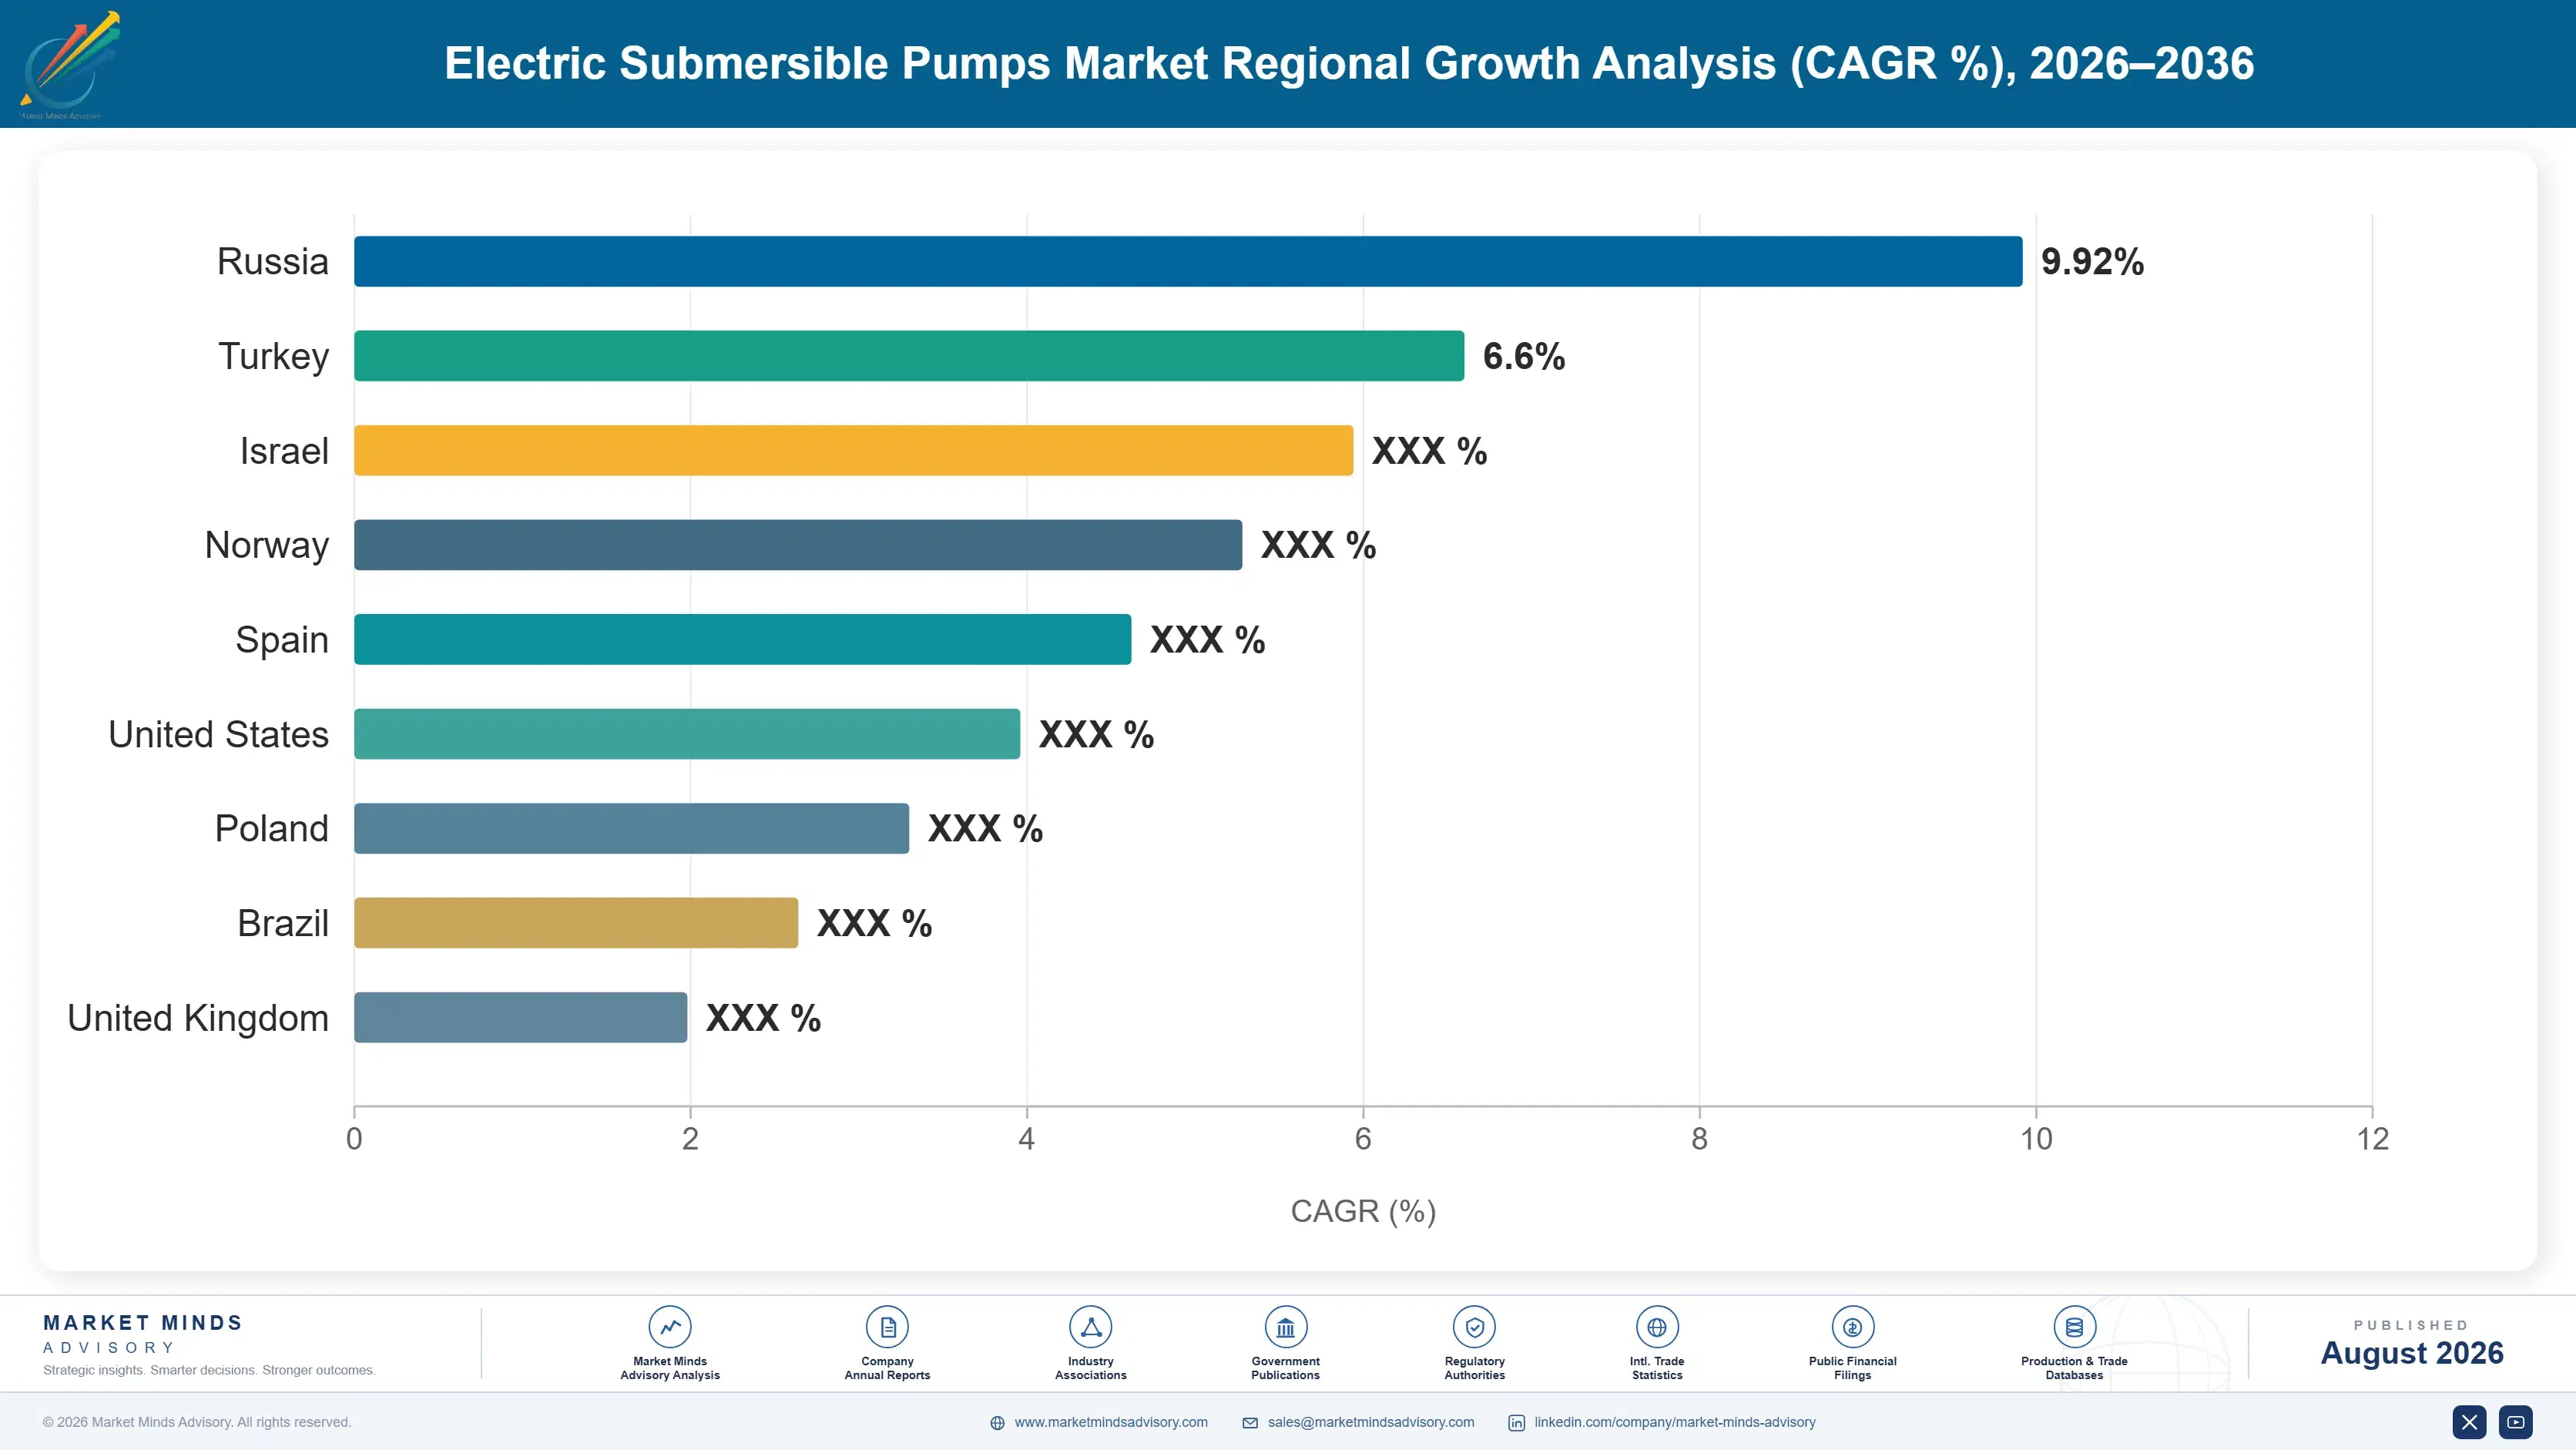
electric-submersible-pumps-market-country-cagr-analysis-1787300458151

Where Suppliers Can Defend Lifting Margin

Suppliers can defend margin against commoditized hardware pricing in several distinct ways beyond simply selling more pump units into a growing installed base. The four levers below identify genuine commercial advantage: digital monitoring attachment, multi-year run-life contracting, gas-handling specialization, and offshore-rated product qualification that together command durable pricing premiums across the entire global installed base of active wells.

Attach Digital Monitoring to Every Pump Sale

Selling bare hardware alone commoditizes quickly, since competing pumps often meet similar mechanical specifications within a given price band. Suppliers that bundle predictive monitoring software, charging a recurring subscription fee of roughly 8,000 to 15,000 dollars per well annually, convert a one-time equipment sale into a recurring revenue relationship that also generates the failure data needed to improve future product design. Baker Hughes and SLB have both scaled this attachment strategy successfully across their largest operator accounts, and the resulting data advantage compounds over time as more wells connect to the same monitoring platform.
Market Impact: Adds roughly 15,000 dollars in recurring revenue per well

Offer Run-Life Guarantees Backed by Performance Data

Operators increasingly want pricing tied to actual pump performance rather than a flat unit price regardless of outcome, particularly on their highest-value wells where unplanned failure carries the greatest cost. Suppliers with enough historical run-life data to confidently guarantee a minimum operating duration, typically 500 days or more, can charge premiums of 10% to 18% over unguaranteed equivalents while still winning the bid, since operators value the downside protection more than the incremental cost. ChampionX has built a dedicated performance-guarantee product line around exactly this structure, targeting its largest independent operator accounts specifically.
Market Impact: Commands a durable 10% to 18% pricing premium

Specialize in Gas-Handling Pump Configurations Now

Standard pump designs struggle in gassy, high-solids well conditions increasingly common across maturing shale basins, creating a genuine technical differentiation opportunity rather than a purely commercial one. Suppliers with proven gas-separator technology can charge meaningfully more, often 20% to 30% above standard configurations, because the alternative for operators is expensive, frequent pump failure rather than a modest price difference. Borets and Novomet have both built specific reputations around this capability, winning share in the toughest well conditions where generalist suppliers consistently underperform on documented run life across comparable well populations.
Market Impact: Commands a durable 20% to 30% price premium

Qualify Offshore-Rated Products for Deepwater Bids

Deepwater project qualification requires years of testing and reference installations before an operator will risk a subsea development on unproven equipment, creating a durable barrier that protects qualified incumbents from new entrants regardless of price competition. Suppliers with existing deepwater qualifications, including SLB, Baker Hughes, and Weatherford, can bid confidently on the highest-value segment of the market, where individual pump systems can sell for up to 3 times the price of an equivalent onshore unit given the pressure and reliability requirements involved. New entrants without qualification cannot compete for this business.
Market Impact: Captures a deepwater price premium up to 3x

Who Controls the Margin Pool

Concentration runs high at 68% held by the top five suppliers, evaluated on revenue from electric submersible pump systems and related monitoring services specifically. SLB and Baker Hughes lead on global scale and deepwater qualification depth, while Weatherford, ChampionX, and Borets compete for share in shale and land-based markets. The gap between leader and challenger is meaningful, since offshore qualification alone takes years to establish.
Competitive activity currently runs along three dimensions. Digital monitoring attachment matters most, as suppliers race to bundle predictive analytics with hardware sales rather than compete purely on unit price. Gas-handling and abrasion-resistant metallurgy runs a close second, as shale wells grow more challenging with age. Multi-year service contracting is the third, converting one-time equipment sales into recurring revenue relationships across entire well pads.

Pressure is building from two directions. Chinese and Russian domestic suppliers are scaling rapidly in their home markets, partly driven by sanctions-related substitution, and could eventually challenge Western suppliers on price in adjacent regions. Meanwhile independent specialists like Novomet are winning share in gas-handling applications that generalist suppliers struggle to match. Rankings will shift toward whichever suppliers combine defensible metallurgy with genuine digital differentiation.
electric-submersible-pumps-market-company-positioning-matrix-1787300458673

Competitive Moat and Risk Dimensions

SLB

Moat: Global Deepwater Qualification Depth

SLB holds qualified deepwater product lines across nearly every major offshore basin, an advantage that took decades of reference installations to build and that new entrants cannot replicate quickly. That breadth lets SLB bid confidently on the industry's highest-value offshore projects where qualification, not price, decides the award.
SLB

Risk: Exposure to Offshore Capex Cycles

SLB's offshore-weighted revenue mix makes it more exposed than shale-focused competitors to swings in deepwater project sanctioning, which can pause for years following a sustained low oil price environment. That cyclicality creates revenue volatility that competitors more focused on steady onshore shale replacement demand largely avoid.
BAKER HUGHES COMPANY

Moat: Integrated Digital Monitoring Platform

Baker Hughes has built one of the industry's most widely deployed predictive monitoring platforms, creating switching costs once an operator's field data lives inside its system. That data advantage compounds over time, since more connected wells improve failure prediction accuracy for every future customer across the platform.
BAKER HUGHES COMPANY

Risk: Platform Lock-In Draws Antitrust Scrutiny

Operators increasingly push back on vendor-locked data platforms that complicate switching suppliers, and several large independents have begun demanding data portability clauses written directly into new contracts. That pressure could steadily erode the very switching-cost advantage the platform was originally built to create over its competitors.

Key Players

SLB
Baker Hughes Company
Weatherford International plc
ChampionX Corporation
Borets International Limited

Others

Halliburton Company
National Oilwell Varco, Inc.
Novomet
Dover Corporation
John Wood Group plc
Rubicon Oilfield International
Flowserve Corporation
Sulzer Ltd
KSB SE & Co. KGaA
Grundfos Holding A/S
Xylem Inc.
Franklin Electric Co., Inc.
GEODynamics
Alkhorayef Petroleum Company
Yantai Jereh Oilfield Services Group Co., Ltd.

Recent Developments

MAY 2025

Baker Hughes expands predictive monitoring platform across Permian accounts

Baker Hughes rolled out an expanded version of its cloud-based pump monitoring platform across its largest Permian Basin operator accounts, adding new gas-handling failure prediction models. This was an internal product expansion, not a corporate transaction, reflecting organic technology investment funded through existing research and development budgets.
Signal: Shows leading suppliers increasingly investing in software and data differentiation rather than pursuing outright corporate acquisitions.
NOVEMBER 2024

Borets and Novomet enter supply agreement for gas-separator components

Borets signed a multi-year supply agreement with Novomet to source specialized gas-separator components for its shale-focused product lines rather than developing the technology internally from scratch. The arrangement was a supply agreement, not a joint venture or acquisition, preserving both companies' independent ownership structures fully.
Signal: Indicates even the largest suppliers now prefer sourcing specialized components externally rather than building capability entirely in-house.
FEBRUARY 2025

ChampionX launches performance-guarantee product line for independents

ChampionX introduced a new run-life performance guarantee product aimed specifically at independent shale operators lacking the scale to negotiate custom terms with larger suppliers directly. This was an internal product launch, not a corporate transaction, extending ChampionX's existing service portfolio into guaranteed-outcome pricing structures for smaller accounts.
Signal: Signals smaller independent operators increasingly demand the same performance guarantees that larger integrated operators already routinely receive.

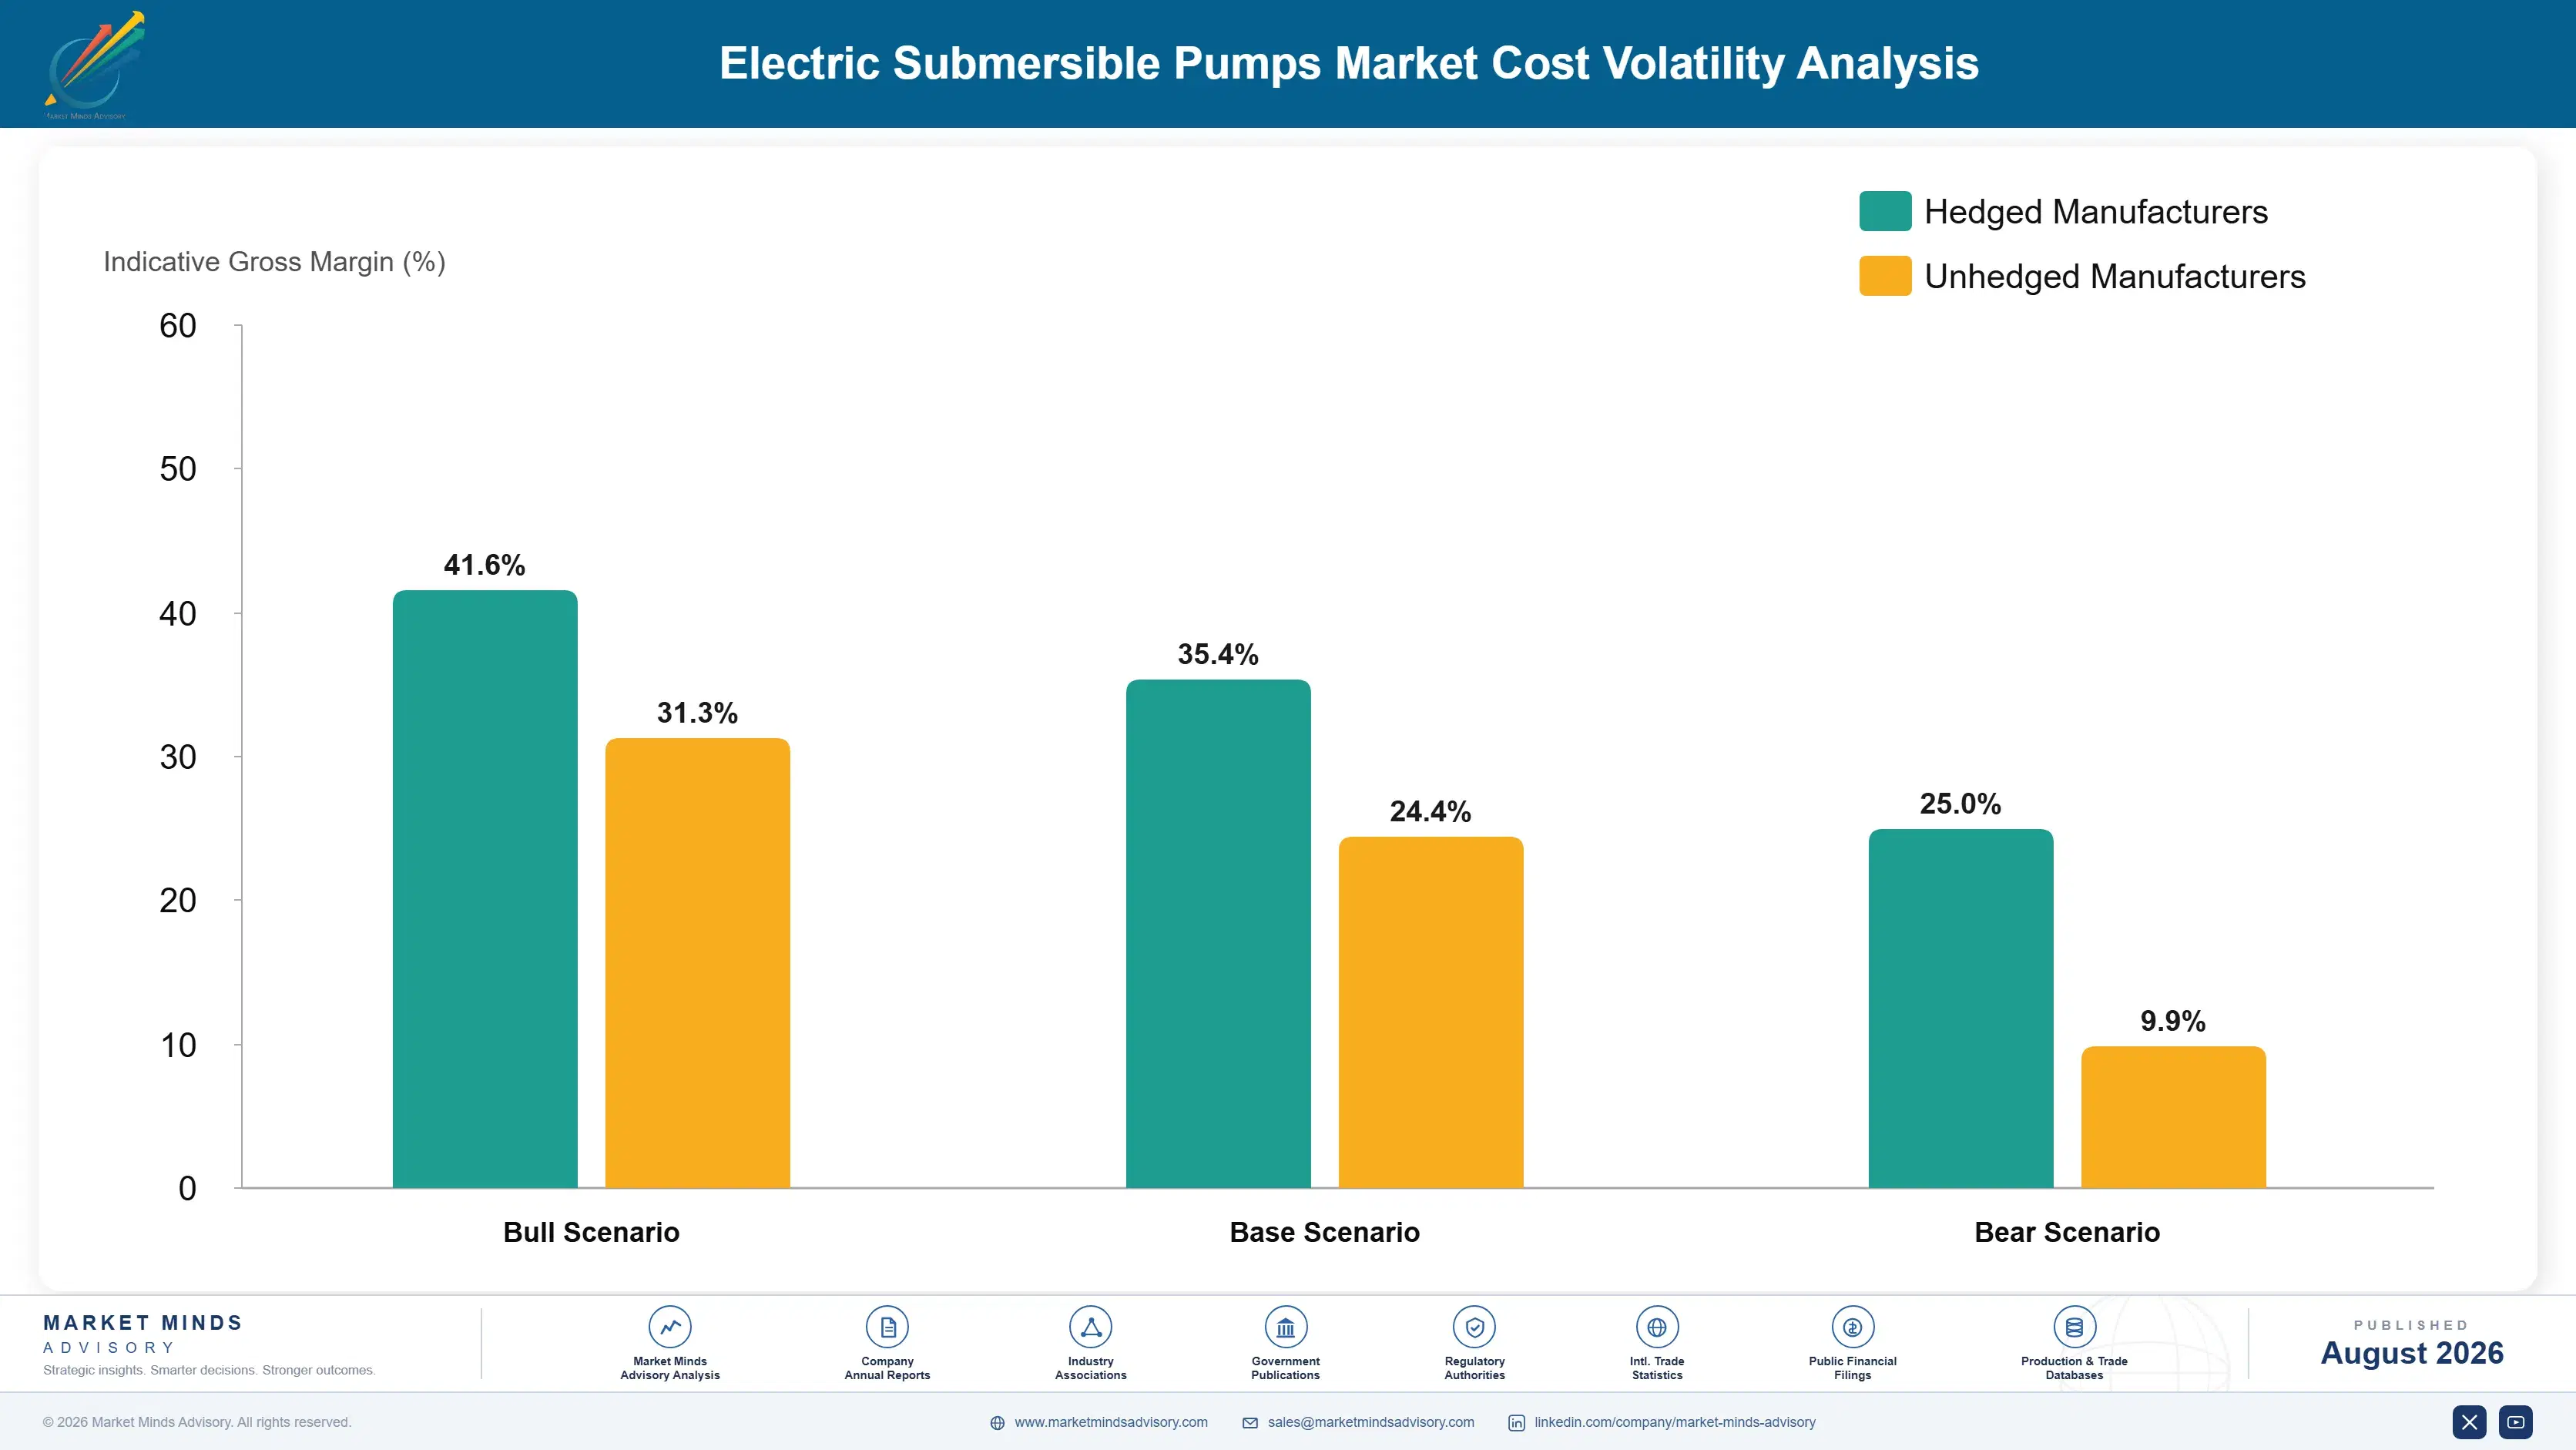
Electrical Steel and Copper Exposure

Electrical steel, copper motor windings, and specialty elastomer seals together account for roughly 30% to 38% of pump system COGS, sourced primarily from steel producers in the United States, Japan, and South Korea and from copper refiners concentrated in Chile and China. Nickel-alloy components used in corrosion-resistant premium designs add a further 8% to 12%, sourced mostly from specialty metals suppliers.
Copper prices surged through 2024 and into 2025, with prices approaching record highs on the London Metal Exchange as electrification demand from power grids and electric vehicles competed directly with industrial users for the same refined supply. Baker Hughes's 2024 annual report disclosed higher input costs attributable to copper and specialty metals inflation, noting that motor winding cost rose meaningfully faster than overall pump system pricing could absorb without margin compression.

Smaller regional pump assemblers carry more exposure than the largest diversified suppliers, since they lack the purchasing scale to negotiate favorable long-term metals contracts with primary producers. Suppliers sourcing copper windings from China face additional exposure to export policy shifts, while those with vertically integrated motor manufacturing capacity absorb volatility more predictably across their own supply chain.
electric-submersible-pumps-market-cost-volatility-analysis-1787300458867

Lock Copper Pricing Through Forward Purchase Agreements

Copper is the largest single volatile input and the most actively traded on organized metals exchanges worldwide. Forward purchase agreements and hedging positions matched to production schedules let commercial teams quote multi-year contracts with confidence, smoothing the quarter-to-quarter volatility that otherwise makes fixed-price bidding a genuine margin risk for suppliers competing on long-term contracts.

Diversify Steel Sourcing Across Producing Regions

Reliance on a single electrical steel source concentrates both price and availability risk unnecessarily across an entire product line. Qualifying secondary mills across multiple countries, even at modestly higher unit cost, protects continuity when any single region faces trade restriction, capacity outage, or a sudden demand spike from competing electrification sectors such as grid infrastructure.

Vertically Integrate Motor Winding Production

Suppliers that bring copper winding production in-house rather than purchasing finished motor components capture the manufacturing margin previously paid to a third party while gaining direct visibility into actual material consumption across every product line. That integration also shortens lead times meaningfully during periods of tight global copper supply and unexpected export restriction events.

Portfolio Architecture for Margin Defence

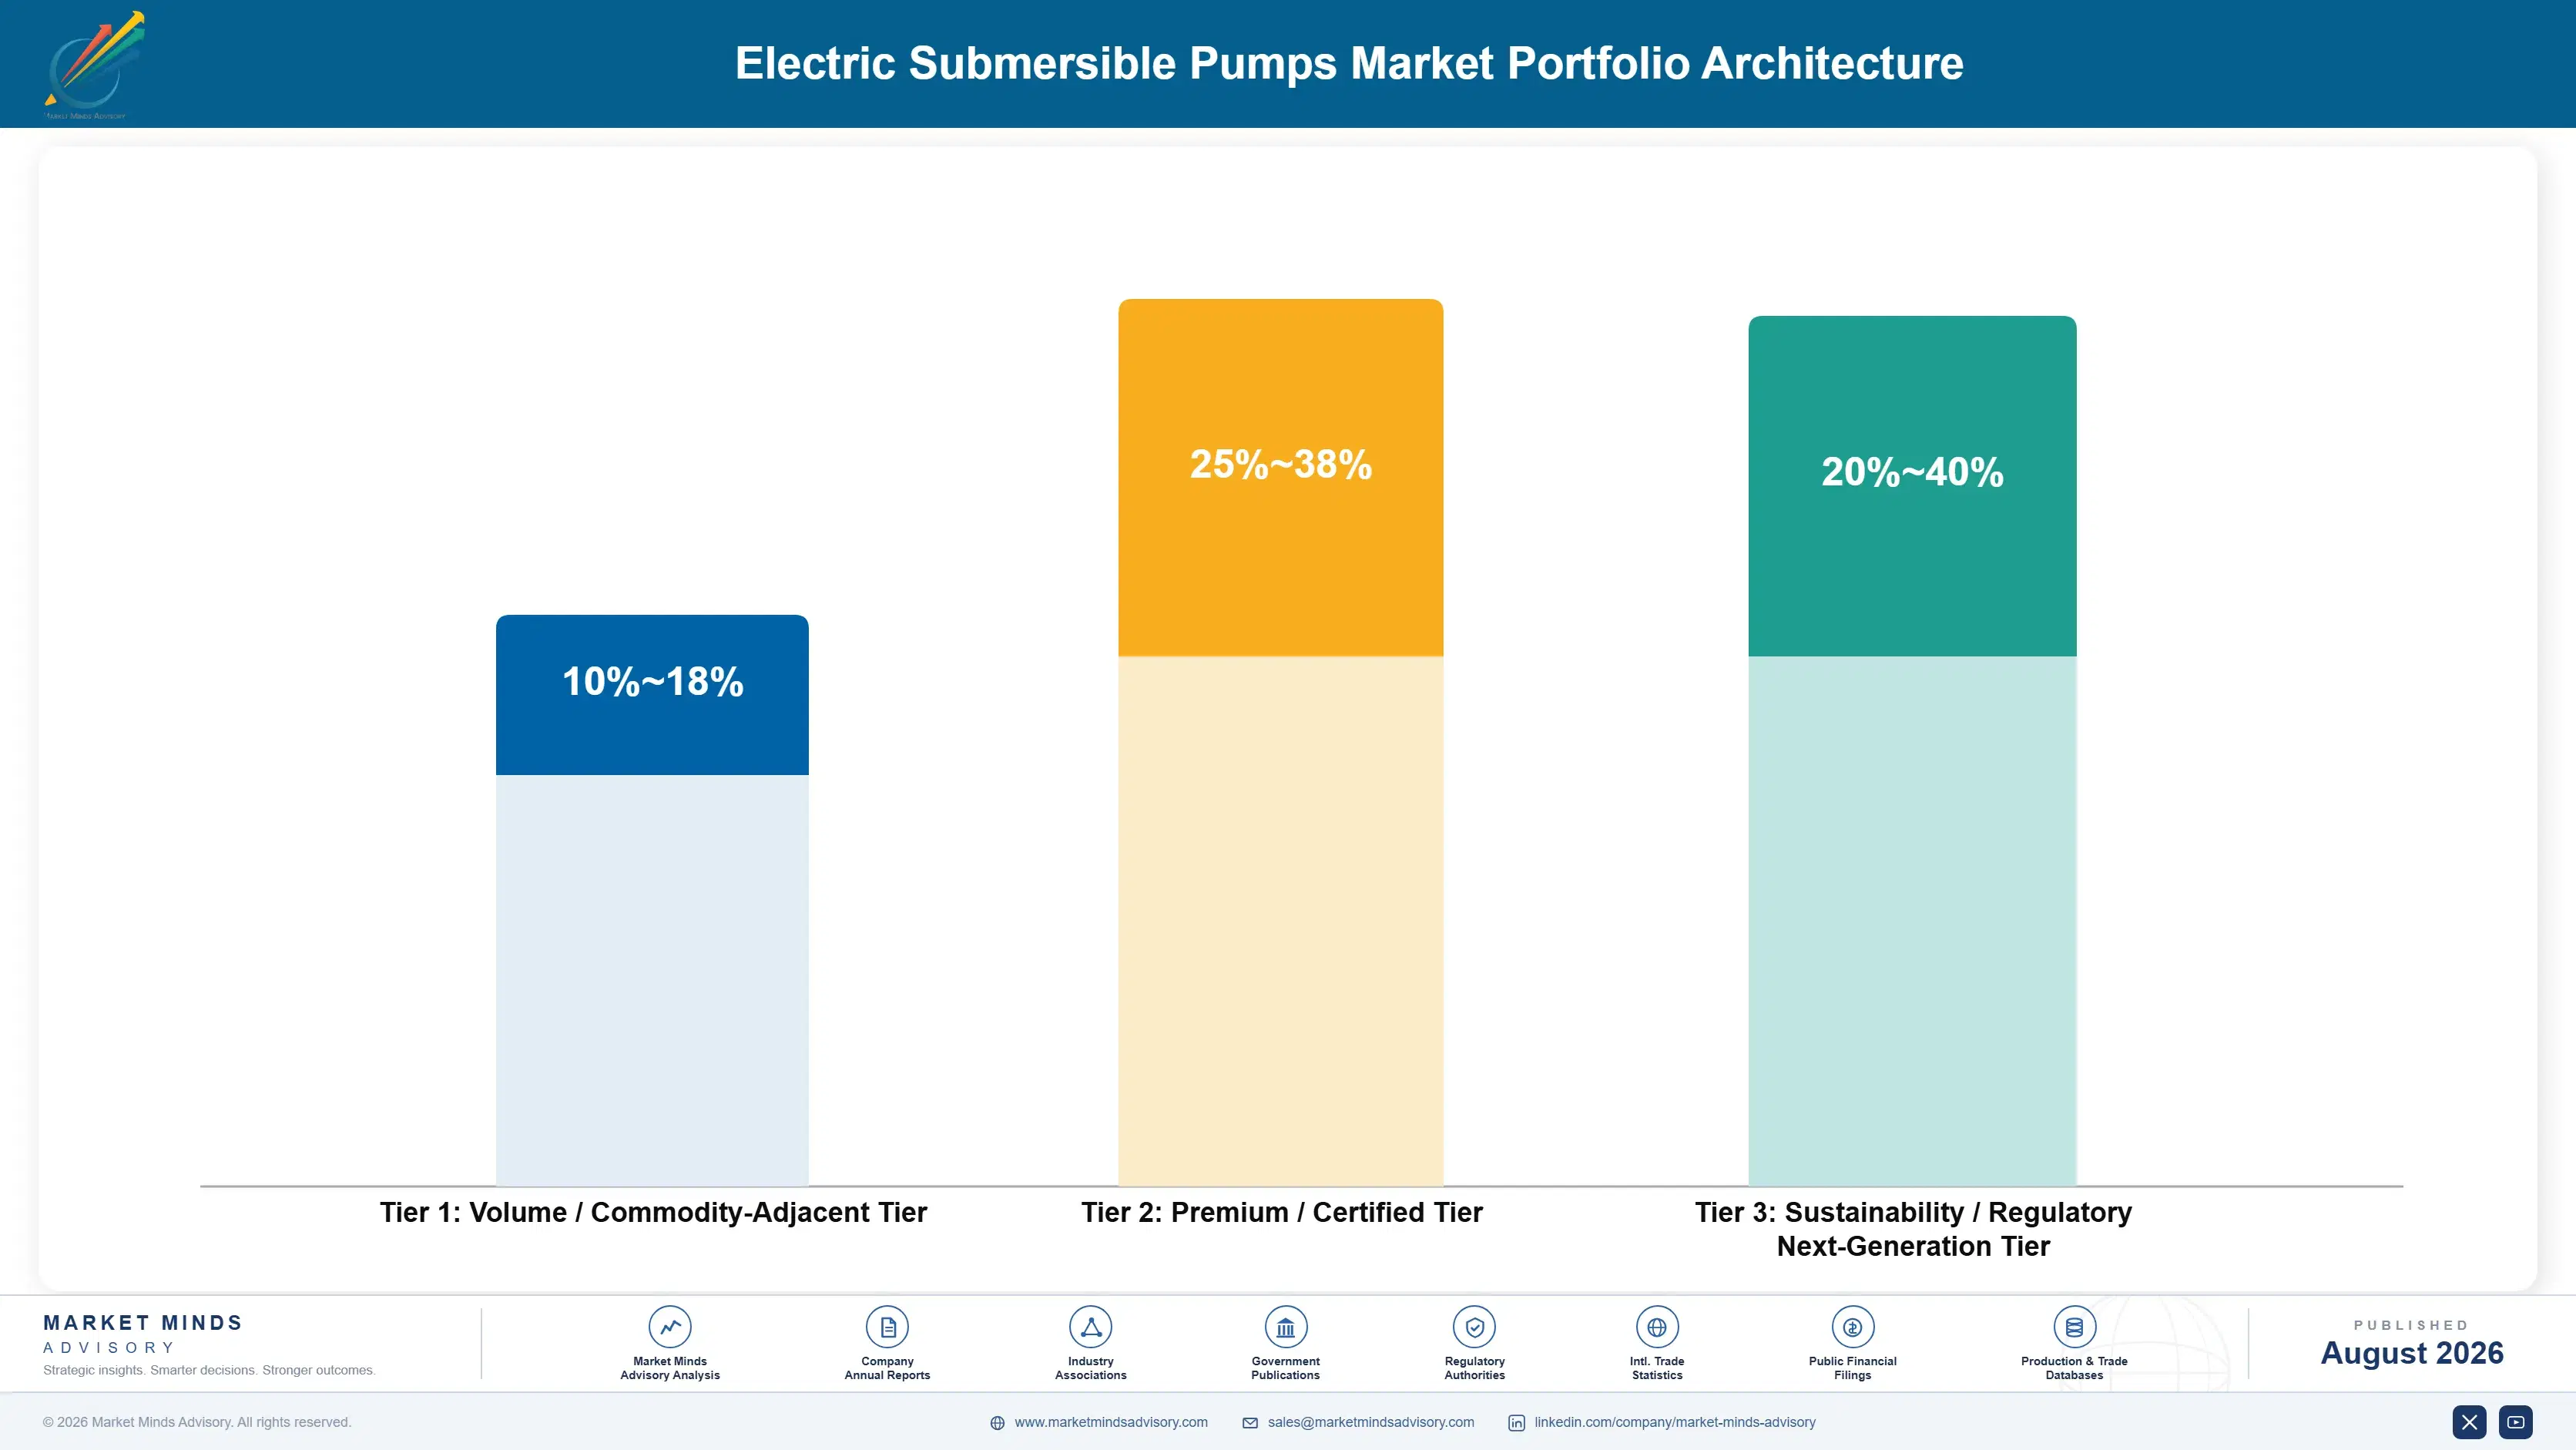
The portfolio splits into three tiers with meaningful margin separation tied to metallurgy sophistication and digital service attachment. Volume tier products carry standard configurations for conventional vertical wells, competing largely on price against a crowded field of regional assemblers. Premium certified products carry gas-handling and corrosion-resistant designs backed by documented run-life data. Sustainability and next-generation products, including fully electrified surface power an
The tension between volume and premium runs through nearly every supplier's product roadmap. Volume products fund the manufacturing scale and field service network that premium products eventually depend on, yet volume margins keep compressing as Chinese and domestic Russian competitors scale aggressively. Suppliers that under-invest in premium metallurgy risk commoditization within their own category, while those chasing premium exclusively struggle to fund the manufacturing base needed to serve high-volume shale replacement demand.

High-value margin pools concentrate specifically in offshore and harsh-condition onshore applications where failure consequences carry the largest financial stakes, and where multi-year service contracting rewards documented reliability directly. Conventional onshore replacement generates steadier volume but thinner margin, since that segment competes against a wider set of lower-cost regional suppliers with adequate but unremarkable metallurgy.

Volume / Commodity-Adjacent Tier

Standard pump configurations for conventional vertical wells and mature onshore fields, competing largely on price against a crowded field of regional and domestic assemblers offering broadly comparable metallurgy and reliability.
Gross Margin: 10-18%

Premium / Certified Tier

Gas-handling and corrosion-resistant pump designs backed by documented multi-year run-life data and formal performance guarantees, commanding meaningful pricing premiums over standard equivalents across most maturing shale basin applications and harsh offshore environments.
Gross Margin: 25-38%

Sustainability / Regulatory / Next-Generation Tier

Fully electrified surface power systems and advanced predictive monitoring platforms still scaling across the installed base, targeting reliability and cost outcomes that current hardware-only offerings simply cannot match consistently across comparable well populations.
Gross Margin: 20-40%
electric-submersible-pumps-market-portfolio-architecture-1787300459370

High-value Sub-segments and Strategic Watch-out

Unconventional Shale Gas-Handling Pumps

Fastest-growing at 9.5% CAGR, driven by tightening well spacing and gassier fluid streams across maturing shale basins, with operators now specifying gas-separator technology by default on new horizontal completions across most producing shale basins nationwide, from the Permian to the Bakken and Eagle Ford, plus Argentina's Vaca Muerta.
Gross Margin: 25-38%

Deepwater Offshore Pump Systems

High value with moderate growth, anchored by recovering final investment decisions across Brazil, Guyana, and the Gulf of Mexico, where qualification barriers protect incumbent suppliers from new entrant price competition on the highest-value deepwater projects worldwide, sustaining durable premium pricing power for years to come across every major operator.
Gross Margin: 30-42%

Conventional Onshore Replacement Units

The category's largest volume base by unit count, competing on price against a crowded field of regional suppliers, generating steady but thin margin as the installed base matures across most conventional onshore producing basins worldwide, from Russia to the wider Middle East and North African region generally.
Gross Margin: 10-18%

Sanctions-Constrained Russian Installed Base

Strategic watch-out where Western suppliers have lost direct market access following sanctions, forcing accelerated adoption of domestic and Chinese alternatives with documented reliability gaps that could reopen the market to qualified Western suppliers once current sanctions eventually ease or are substantially eased by future policymakers over time.
Gross Margin: 15-30%

Well-Level Replacement Economics

Pump demand behaves like an annuity tied directly to the installed well base rather than to new drilling activity alone, since every producing well eventually needs a replacement pump regardless of whether operators drill a new well that year. That structure gives suppliers with strong installed-base relationships a predictable revenue floor even during drilling downturns, since existing wells keep failing and requiring replacement on a two to three year cycle.
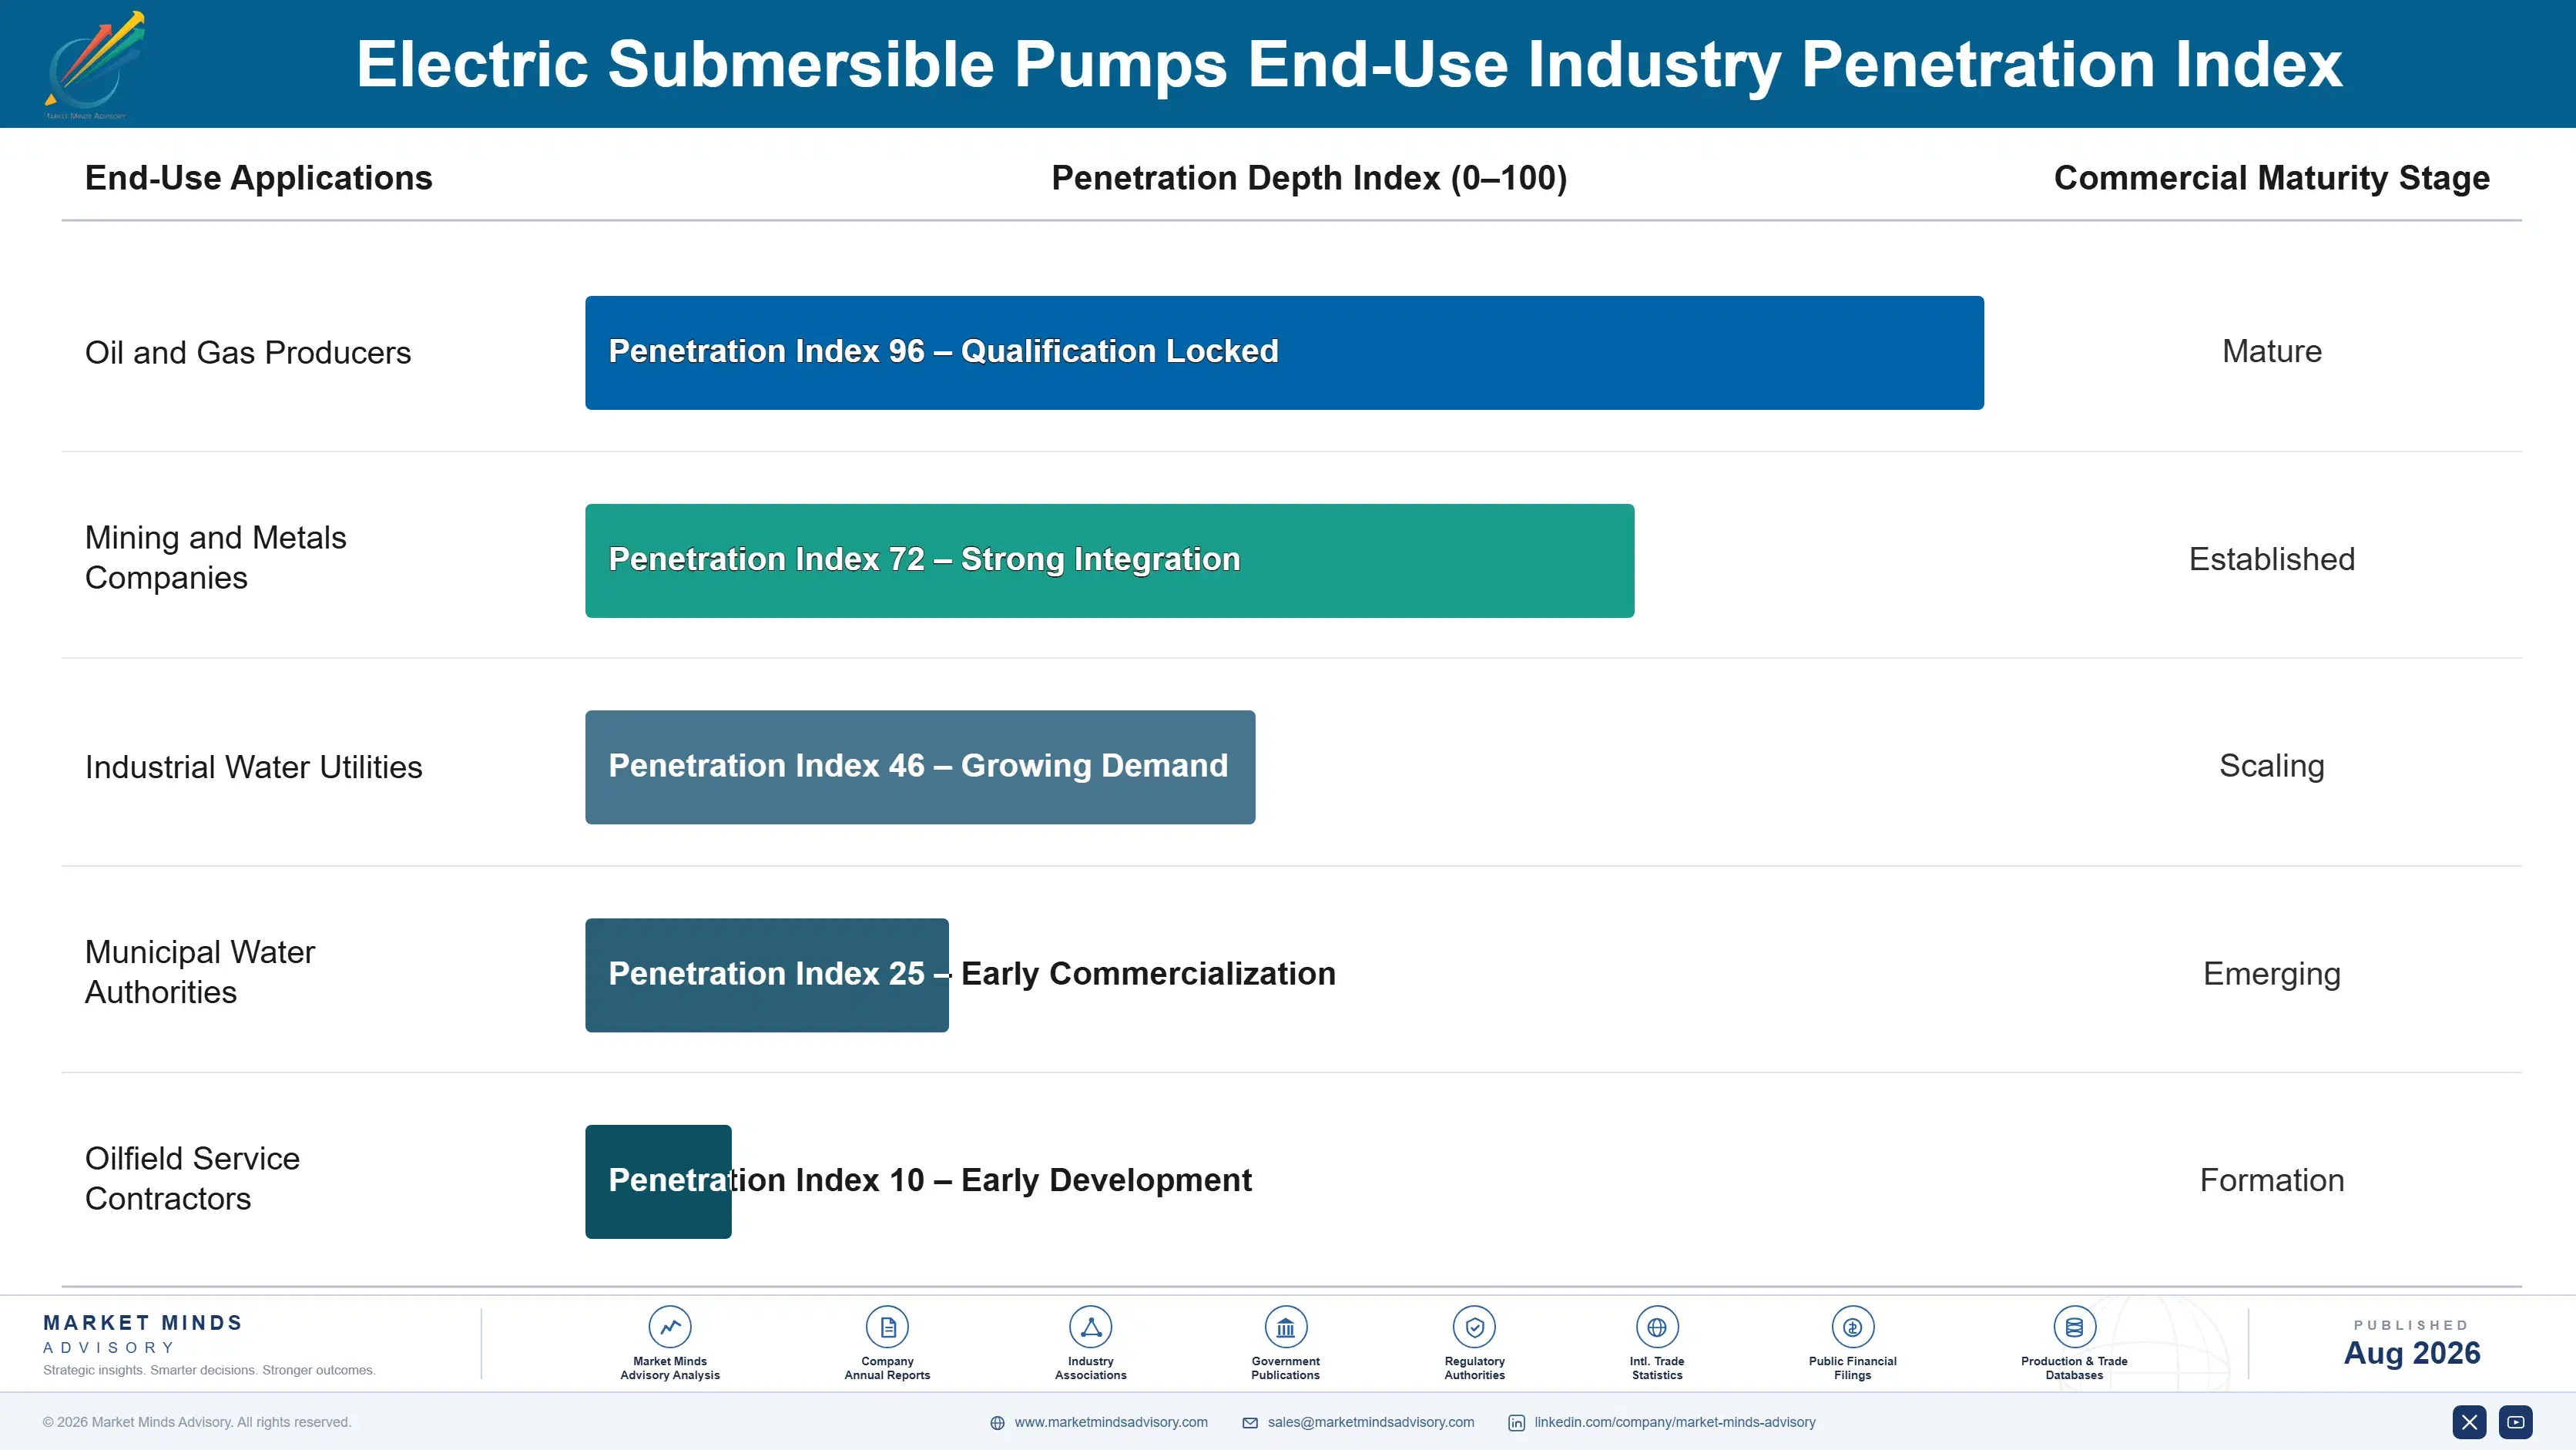
Adoption depth varies sharply by end-use vertical. Shale operators have adopted digital monitoring almost universally on their highest-value wells, since unplanned failure there carries severe financial consequences measured in weeks of lost production. Conventional onshore and mining dewatering applications lag behind, treating monitoring as optional, partly because failure consequences are genuinely lower and partly because budget scrutiny is tighter.

Buyer profiles have shifted generationally. Procurement decisions that once sat primarily with field-level production engineers now route through centralized reliability and digital transformation teams at larger operators, rewarding suppliers able to present integrated data platforms rather than relationship selling alone. Younger reservoir engineers entering leadership roles treat run-life data as a baseline procurement input rather than a marketing claim.
electric-submersible-pumps-market-end-use-penetration-index-1787300459856

MMA's Read on Artificial Lift

These are among the four positions where our research anticipates prominent divergence between winners and laggards over the coming forecast period. Each is grounded in the demand model, the regulatory perimeter, and the announced capacity pipeline.
01 / DIGITAL PLATFORM STRATEGY

Predictive monitoring attachment will separate winners from commoditized hardware sellers

Bare pump hardware is becoming commoditized across most conventional applications, which means suppliers competing solely on unit price rather than a monitoring platform advantage will see margin compress steadily over the next several years. Digital failure prediction addresses a genuine operator pain point, unplanned production loss during peak output, that hardware quality alone cannot fully solve regardless of metallurgy or design sophistication. Suppliers that build data advantages now, before switching costs harden around a competitor's platform, will hold accounts rivals cannot easily dislodge once operators standardize.
02 / SHALE BASIN SPECIALIZATION

Gas-handling metallurgy expertise will define share gains through 2036

Well spacing keeps tightening across every major shale basin, producing more variable and gassier fluid streams that punish generalist pump designs built for older, simpler vertical wells drilled a decade or more ago. Suppliers without proven gas-separator technology increasingly lose bids in the toughest well conditions, regardless of brand reputation built in earlier decades of oilfield service relationships. Those investing in specialized metallurgy now, ahead of competitors still relying on legacy designs, will capture disproportionate share as shale wells keep growing more technically demanding.
03 / OFFSHORE RECOVERY POSITIONING

Deepwater qualification barriers will reward incumbents as sanctioning recovers

Deepwater project sanctioning is recovering after a multi-year pause, and qualification requirements built over decades mean only a handful of suppliers can credibly bid on the highest-value new offshore projects coming to market. Suppliers without existing qualification cannot simply buy their way into this segment quickly, since operators will not risk a subsea development on unproven equipment regardless of price offered. Incumbent suppliers with qualified product lines are positioned to capture a disproportionate share of this recovering capital spending cycle.
04 / SANCTIONS SUPPLY REALIGNMENT

Russian market closure permanently redraws global competitive geography

Sanctions have permanently cut Western suppliers off from what was once a significant share of their installed base revenue, forcing accelerated growth of domestic Russian and Chinese alternatives that may not fully reverse even if sanctions eventually ease over the coming decade. That closure is simultaneously freeing Western suppliers to redirect capacity and investment toward faster-growing basins including the Permian and Vaca Muerta. The net effect redraws competitive geography in ways unlikely to fully unwind regardless of future policy shifts in Moscow or Washington.

Engagement Snapshot From the Field

A live engagement with an industry participant carrying material or product regulatory and market exposure ahead of a defining policy shift, showing how our research translates into a defensible multi-year portfolio strategy.
MARKET MINDS ADVISORY · CLIENT ENGAGEMENT SUMMARY
Electric Submersible Pumps Producer Strategic Portfolio Review and Transition Roadmap 2026·Investment Scenario on Electric Submersible Pumps Exposure Evaluation 2025-26
CLIENT PROFILE
A mid-cap independent operator running roughly 450 producing wells across the Midland and Delaware sub-basins, reporting approximately 2.2 billion dollars in annual revenue, approached MMA after unplanned pump failures drove a meaningfully higher-than-budgeted workover spend across its second-quarter 2025 results, well above the operator's internal reliability targets set at the start of the fiscal year (client-reported, unverified by MMA).
STRATEGIC CHALLENGE
Leadership faced pressure to cut workover spending without simply switching to the cheapest available pump supplier, since prior cost-driven switches had produced worse reliability outcomes. The reservoir engineering team wanted better failure prediction data, while finance wanted a defensible total-cost-of-ownership case before approving any new multi-year supplier commitment across the full well portfolio.
MMA APPROACH
MMA benchmarked run-life data across the operator's three incumbent pump suppliers against comparable Permian operators, modeled total cost of ownership including workover expense over a five-year horizon, and assessed which suppliers offered credible gas-handling technology suited to the operator's increasingly variable fluid streams and tightening well spacing conditions across the basin.
KEY FINDINGS
  1. The supplier with the lowest unit price also carried the shortest average run life, and total cost of ownership favored a mid-priced gas-handling specialist once workover expense was included.
  2. Wells completed within the past eighteen months showed meaningfully higher failure rates than older wells, consistent with tightening well spacing and gassier fluid streams across the basin.
  3. Consolidating from three suppliers to two, rather than one, preserved negotiating leverage while still capturing most of the reliability benefit identified in the analysis (client-reported, unverified by MMA).
  4. Digital monitoring attachment rates varied significantly by supplier, and the supplier with the highest attachment rate also showed the strongest documented run-life performance across comparable wells.
CLIENT PROFILE
A mid-cap independent operator running roughly 450 producing wells across the Midland and Delaware sub-basins, reporting approximately 2.2 billion dollars in annual revenue, approached MMA after unplanned pump failures drove a meaningfully higher-than-budgeted workover spend across its second-quarter 2025 results, well above the operator's internal reliability targets set at the start of the fiscal year (client-reported, unverified by MMA).
STRATEGIC CHALLENGE
Leadership faced pressure to cut workover spending without simply switching to the cheapest available pump supplier, since prior cost-driven switches had produced worse reliability outcomes. The reservoir engineering team wanted better failure prediction data, while finance wanted a defensible total-cost-of-ownership case before approving any new multi-year supplier commitment across the full well portfolio.
MMA APPROACH
MMA benchmarked run-life data across the operator's three incumbent pump suppliers against comparable Permian operators, modeled total cost of ownership including workover expense over a five-year horizon, and assessed which suppliers offered credible gas-handling technology suited to the operator's increasingly variable fluid streams and tightening well spacing conditions across the basin.
KEY FINDINGS
  1. The supplier with the lowest unit price also carried the shortest average run life, and total cost of ownership favored a mid-priced gas-handling specialist once workover expense was included.
  2. Wells completed within the past eighteen months showed meaningfully higher failure rates than older wells, consistent with tightening well spacing and gassier fluid streams across the basin.
  3. Consolidating from three suppliers to two, rather than one, preserved negotiating leverage while still capturing most of the reliability benefit identified in the analysis (client-reported, unverified by MMA).
  4. Digital monitoring attachment rates varied significantly by supplier, and the supplier with the highest attachment rate also showed the strongest documented run-life performance across comparable wells.
RECOMMENDED STRATEGY
Phase 1: Phase 1 (0 to 6 months): Transition the highest-value wells to the gas-handling specialist identified in the analysis, prioritizing wells drilled within the past eighteen months first. Phase 2: Phase 2 (6 to 18 months): Negotiate a two-supplier contract structure with mandatory digital monitoring attachment, extending gas-handling designs across the broader well portfolio. Phase 3: Phase 3 (18 to 36 months): Build an internal run-life tracking dashboard benchmarking supplier performance independently of vendor-provided reliability claims and marketing data.
OUTCOME
The operator reduced unplanned workover spending meaningfully within the first year of the transition, and the two-supplier structure preserved negotiating leverage at contract renewal. The internal run-life dashboard has since informed supplier selection across two additional basins the operator entered through acquisition (client-reported, unverified by MMA).

Frequently Asked Questions

Foundational context covering the market sizes, CAGR, scope, country, region and competition that inform every finding below. This section is provided to cover basics and most often pre-purchase conversations, answered from the MMA Primary Research Dataset.

What is the current size of the Electric Submersible Pumps Market?

The market reached an estimated 9.6 billion dollars in 2025. That figure reflects global revenue across onshore, offshore, shale, mining dewatering, and industrial water transfer pump applications.

How large will the Electric Submersible Pumps Market be by 2036?

MMA projects the market will reach approximately 19.0 billion dollars by 2036 under the base case scenario. That represents roughly 1.86 times the 2026 market value.

What is the CAGR for the Electric Submersible Pumps Market 2026 to 2036?

The base case CAGR is 6.4% annually across the forecast period. Bull and bear scenarios run 7.6% and 5.2% respectively, reflecting oil price and drilling activity uncertainty.

Which segment is growing fastest?

Unconventional shale wells grow fastest at 9.5% CAGR, about 1.48 times the overall market rate. Tightening well spacing and gassier fluid streams across shale basins are the primary driver.

Who are the major companies in the Electric Submersible Pumps Market?

SLB, Baker Hughes, Weatherford, ChampionX, and Borets lead the category by a consistent revenue basis. Together they hold roughly 68% of global pump system and monitoring service revenue combined.

Which country is growing fastest?

The United States leads national growth at an estimated 10.2% CAGR, driven by Permian Basin well density and rising replacement demand. Tightening well spacing is intensifying pump specification requirements.

Report Segmentation Architecture

The full report scope spans multiple orthogonal segmentation dimensions, with cross-tabulated demand data provided for each dimension pair. Coverage extends further to regional breakdowns, trend trajectories, and the competitive detail needed to support segment-level decision-making.

By Application and Deployment Context

  • Onshore Oil and Gas Production
  • Offshore Oil and Gas Production
  • Unconventional Shale Wells
  • Water Injection Systems
  • Mining Dewatering Applications
  • Industrial Water Transfer

By End-Use Industry

  • Oil and Gas Producers
  • Mining and Metals Companies
  • Industrial Water Utilities
  • Municipal Water Authorities
  • Oilfield Service Contractors

By Commercial Dimension

  • Original Equipment Sales
  • Replacement Unit Sales
  • Run-Life Service Contracts
  • Digital Monitoring Subscriptions

By Region

  • North America
  • Western Europe
  • East Asia
  • South Asia and Pacific
  • Latin America
  • Middle East and Africa
  • Eastern Europe

Scope, Methodology, and Coverage

Every figure in this report is reproducible from documented input assumptions. The scope below maps the historical period, the forecast horizon, the segmentation dimensions, and the countries covered, alongside the underlying primary and qualitative methodology.
Historical Period
2020 to 2025
Forecast Period
2026 to 2036
Base Year
2025 (USD billions; MMA Primary Research Dataset, August 2026)
Market Definition
The electric submersible pumps market covers submersible pump systems, motors, cables, and downhole monitoring equipment used for artificial lift in oil and gas production, mine dewatering, and industrial water transfer applications. It includes original equipment sales, replacement units, and run-life service contracts. Surface pumping equipment, rod lift systems, and gas lift installations are excluded.
Quantitative Units
USD billions (current prices); unit shipment volume where applicable
Segmentation Dimensions
By Application and Deployment Context; By End-Use Industry; By Commercial Dimension; By Region
Regions Covered
North America, Western Europe, East Asia, South Asia and Pacific, Latin America, Middle East and Africa, Eastern Europe
Countries Covered
USA, China, Germany, France, UK, Japan, South Korea, India, Australia, Canada, Brazil, Mexico, Indonesia, Vietnam, Thailand, Malaysia, UAE, Saudi Arabia, South Africa, Nigeria, Turkey, Poland, Netherlands, Italy, Spain, Sweden, Switzerland, Argentina, Colombia, Singapore, and additional markets relevant to this sector
Key Companies Profiled
SLB; Baker Hughes Company; Weatherford International plc; ChampionX Corporation; Borets International Limited; Halliburton Company; National Oilwell Varco, Inc.; Novomet; Dover Corporation; John Wood Group plc; Rubicon Oilfield International; Flowserve Corporation; Sulzer Ltd; KSB SE & Co. KGaA; Grundfos Holding A/S; Xylem Inc.; Franklin Electric Co., Inc.; GEODynamics; Alkhorayef Petroleum Company; Yantai Jereh Oilfield Services Group Co., Ltd.
Quantitative Methodology
Primary survey, n=3,800 respondents, Q4 2025, six countries; demand-side model with trade association cross-validation
Qualitative Methodology
47 expert interviews, Q4 2025; applied to validate demand model assumptions, identify emerging dynamics, and assess competitive positioning
Report Format
PDF and XLSX data workbook (Word format preview document)
Publisher
Market Minds Advisory
Report Code
MMA-2026-ENE-102
Published
August 2026
Contact
sales@marketmindsadvisory.com | www.marketmindsadvisory.com

Purchase the full Electric Submersible Pumps Market Report (2026 to 2036).

The full MMA Electric Submersible Pumps report sizes the market across six application categories, five end-use industries, four commercial contracting models, and seven regions through 2036. It profiles twenty participants on a consistent basis of pump system and monitoring service revenue, scoring the top five on metallurgy differentiation, digital platform depth, and offshore qualification breadth. Scenario models quantify how shale well density, offshore project sanctioning, and copper price volatility move both demand and achievable pricing. The report also includes delivered cost modeling by application category, a run-life benchmarking dataset across major basins, and a supplier displacement risk assessment built for operators, suppliers, and investors.
Six-segment application demand model through 2036
Run-life benchmarking dataset across major basins
Digital monitoring platform competitive positioning assessment
Deepwater qualification and offshore project tracker
Copper and electrical steel cost sensitivity model
Supplier displacement risk scoring by application

Built For The People Who Decide

From boardroom strategy to bench-side execution, this report is read cover-to-cover by leaders shaping the next decade of their industry, turning demand scenarios, market dynamics and valuation benchmarks into decisions.
CXOs/ Presidents/ VPs/ Managers
M&A and Corporate Development
Strategy Teams and R&D Heads
Procurement and Product Directors
Regulatory and Compliance Leaders
Investor Relations and Equity Analysts