Market Minds Advisory
Electric Golf Cart Market

Electric Golf Cart Market: Lithium Conversion Economics, Pack Certification and the Fleet Replacement Cycle

Lithium iron phosphate is displacing lead-acid on maintenance arithmetic rather than performance, pack certification is becoming a purchase condition, and every fleet lease renewal is now a chemistry decision rather than a replacement.

Lead Analyst

David Horsley

Published

September 2026

Make Smarter Decisions with Customized Research Insights

Request a free sample report and evaluate market opportunities, growth trends, and competitive dynamics relevant to your business needs.

2025 MARKET VALUE$1.9BMarket Size 2025
2036 FORECAST VALUE$4.8BBase Case , 2026 to 2036
CAGR 2026 TO 20368.8 %Bull 10.0% / Bear 7.6%
INCREMENTAL OPPORTUNITY$2.7BNet 10- year value creation
EXPANSION MULTIPLE2.32x2036 value over 2026 base
Strategic Levers
M&A Pipeline
Regional Outlook
Country Rankings
Competitive Intelligence
Segmental Deep-dive
Call-Us : 91 93563 13602

Executive Snapshot and Market Trajectory

Every electric golf cart sold today is really a battery decision wearing a vehicle around it. The chassis, motor and body have barely changed in twenty years. What changed is that lithium packs made the maintenance labour behind a lead-acid fleet look indefensible once anybody ran the numbers properly.
Lithium iron phosphate packs grow at 13.2%, a full 1.50 times the market rate, because the chemistry survives roughly 3,000 charge cycles, needs no watering at all and holds voltage until nearly flat instead of fading through the back nine. North America holds 48% of global value, well outside the standard regional band, because the United States operates roughly 16,000 of the world's 38,000 golf facilities and is the only cart-legal residential market at scale.
Concentration sits at 63% for the top five, considerably higher than the wider cart market, because lithium pack integration and certification favour manufacturers with engineering depth. A flooded lead-acid cart could be assembled by anybody. A certified lithium pack with a management system and a thermal strategy could not, and that single difference is quietly reshaping the competitive field in favour of engineering depth.
Market Definition
This report covers battery electric golf carts and golf-course personal transport vehicles, including street-legal low-speed variants derived from electric cart platforms, valued at complete vehicle level across course fleet, residential, resort, campus and commercial applications. Gasoline and hybrid golf carts, utility task vehicles, all-terrain vehicles, neighbourhood electric vehicles on automotive platforms, turf maintenance equipment and aftermarket battery conversion kits are excluded.
Base Year Value
$1.9B in 2025 (MMA Primary Research Dataset, August 2026)
Forecast Period
2026 to 2036, eleven discrete annual values
CAGR
8.8% base case. Bull 10.0%. Bear 7.6%.
Fastest Growth Segment
Lithium Iron Phosphate Pack: 13.2% CAGR
Fastest Growth Country
India: 11.4% CAGR
Fastest Growth Region
South Asia and Pacific: 11.0% CAGR
Largest Region
North America: 48% of 2025 global value
Market Leaders
Textron Specialized Vehicles, Club Car, Yamaha Motor, ICON Electric Vehicles and Evolution Electric Vehicles lead on electric unit shipment volume. Source: MMA Analysis, July 2026.
Primary Survey
n=3,800 procurement and R&D decision-makers, Q4 2025, six countries
Methodology
Demand-side build-up, cross-validated against public data, 47 expert interviews

Electric Golf Cart Market Forecast Scenarios

electric-golf-cart-market-trends-growth-size-forecast-scenario-1787315813370
Between 2020 and 2025 the market compounded at 7.4%, and chemistry rather than volume did most of the work. A pandemic surge in golf participation lifted fleet orders sharply, then normalised. What did not normalise was the shift toward lithium: attach rates on new electric units climbed steadily throughout, and each converted unit carried roughly 30% more realised value than the unit it replaced.
The base case at 8.8% rests on three mechanisms. Fleet replacement runs on five to seven year lease cycles, and every renewal is now a lithium conversion decision rather than a swap. Residential demand grows on ordinance changes that keep widening where low-speed electric vehicles may legally operate. Resort, campus and commercial shuttle demand adds a third stream, buying higher passenger counts at considerably higher configured value than a standard fleet cart.
The bull case at 10.0% turns on lithium cell costs falling far enough that the chemistry becomes standard fitment rather than an upgrade, pulling conversion decisions forward at smaller clubs currently deferring on capital grounds. The bear case at 7.6% is a discretionary spending contraction: a cart is deferrable for both households and clubs, and operators can run lead-acid fleets two more seasons.

What Governs Electric Cart Value Today

The economics of this market live entirely inside the battery box. A flooded lead-acid string costs a manufacturer under a thousand dollars, and then costs the owner monthly watering labour, a replacement every four years and range that fades noticeably as the pack ages toward the end of its life.
TOP FIVE CONCENTRATION63%Share held by the five largest electric cart manufacturers
AVERAGE SELLING PRICE$10,600Typical dealer transaction price for a lithium equipped cart
LITHIUM ATTACH RATE46%Share of new electric units shipped with lithium packs
BATTERY COST SHARE38% of COGSEnergy storage as portion of manufactured vehicle cost
PACK CYCLE LIFE3,000 cyclesCharge cycles a lithium iron phosphate pack survives
FULL CHARGE TIME4 hoursTypical time to replenish a fully depleted lithium pack
A lithium iron phosphate pack costs roughly three times as much at purchase and then costs almost nothing. It survives around 3,000 cycles against perhaps 800 for flooded lead-acid, requires no maintenance whatsoever, weighs about half as much and holds voltage until nearly discharged rather than sagging through the round. A course superintendent running that arithmetic across a hundred-cart fleet arrives at the same conclusion every time, which is why attach rates keep climbing regardless of the capital hurdle.
What is changing the competitive structure is certification. Insurers and course operators storing a hundred lithium packs in one barn now ask questions that nobody asked about lead-acid, and manufacturers answering them with tested pack designs, documented management systems and credible thermal strategies are now winning fleet tenders that delivered price alone would never have secured for them.
"The fleet manager conversation has completely inverted. Five years ago the question was whether lithium justified the premium. Now it is whether anybody can still explain why they are paying somebody to water batteries every month, and there is no good answer to that."
Practice Director, Mobility and Specialty Vehicles, Market Minds Advisory · MMA

Market Trends

Lithium Iron Phosphate Displaces Lead-Acid On Maintenance Arithmetic

The conversion running through course fleets is driven by labour cost rather than by performance enthusiasm. Watering a hundred-cart lead-acid fleet consumes real technician hours every month, and replacing those strings every four years against roughly ten years for lithium changes the ownership calculation decisively. Weight matters too: a lithium pack removes around 200 pounds, which reduces turf compaction on wet courses and extends range on the same motor. Purchase price remains roughly three times the lead-acid equivalent, and that capital hurdle is now the only thing still slowing conversion at smaller facilities.
Market Impact: Turns 500,000 units yearly
Pack Certification Becomes A Fleet Purchase Condition

Course operators storing and charging a hundred lithium packs inside one maintenance building have started asking questions that lead-acid never prompted, and their insurers have started asking those questions first. Underwriters Laboratories pack certification, documented thermal management and battery management system diagnostics are now appearing as conditions in fleet tender documents rather than as optional reassurance. Manufacturers holding that evidence now win tenders that delivered price alone would never have secured, and the requirement quietly excludes assemblers who buy generic imported packs and fit them without any testing evidence at all.
Market Impact: Covers 900 cart-legal communities

Market Opportunities and Growth Drivers

Fleet Lease Renewals Force A Chemistry Decision Every Cycle

Golf facilities run sixty to eighty carts on lease structures that force turnover every five to seven years regardless of machine condition, and every one of those renewals is now a conversion decision rather than a like-for-like replacement. The lease format matters commercially, because it converts what would be a deferrable capital purchase into a scheduled event that happens whether or not the club happens to feel wealthy that year. Roughly 500,000 fleet units turn over globally each year, and lithium attach rates on those renewals keep climbing steadily against every capital objection.
Market Impact: Adds $180,000 per fleet

Cart-Legal Residential Ordinance Expansion Widens The Buyer Base

Around 40 American states now permit low-speed electric vehicles on roads posted at or below thirty-five miles per hour, and developers have discovered that cart paths and cart-legal streets sell houses. Communities built around that premise now exist across Florida, Arizona, Texas, Georgia and the Carolinas, and households living in them treat the cart as a genuine second vehicle rather than a novelty. Those buyers specify lithium almost automatically, because charging in a garage overnight with no maintenance whatsoever is exactly what makes the vehicle behave like a second car.
Market Impact: Adds 4% to facility cost

Market Restraints and Challenges

Lithium Capital Cost Defers Conversion At Smaller Clubs

A lithium pack costs roughly three times a flooded lead-acid string at purchase, and across a sixty-cart fleet that difference is a substantial capital commitment. The root cause is cell pricing rather than any manufacturing inefficiency, and it has fallen but not far enough to disappear. Commercially this concentrates conversion at wealthier clubs and resorts while smaller facilities defer, which slows the transition. Participants are responding with lease structures that spread the premium, battery-as-a-service arrangements and residual value guarantees that make the capital case considerably easier for a club committee to approve.
Market Impact: Survives 3,000 charge cycles

Insurance And Storage Requirements Complicate Fleet Deployment

Charging a hundred lithium packs inside one maintenance building has prompted insurers to impose storage separation, fire suppression and charging protocol requirements that lead-acid never triggered. The root cause is genuine risk perception around thermal events, amplified by unrelated incidents in other product categories. Commercially this adds facility cost that the ownership calculation has to absorb, and it has occasionally stalled planned conversions entirely at facilities without suitable buildings. Participants are responding with certified pack designs, documented thermal management, charging systems carrying automatic isolation, and direct engagement with insurance underwriters ahead of any tender.
Market Impact: Appears in 40% of tenders
3 additional market trends, 2 additional growth drivers, and 4 additional restraints and challenges are covered in the full report. Contact sales@marketmindsadvisory.com to access the complete intelligence.

Segment CAGR and Growth Architecture

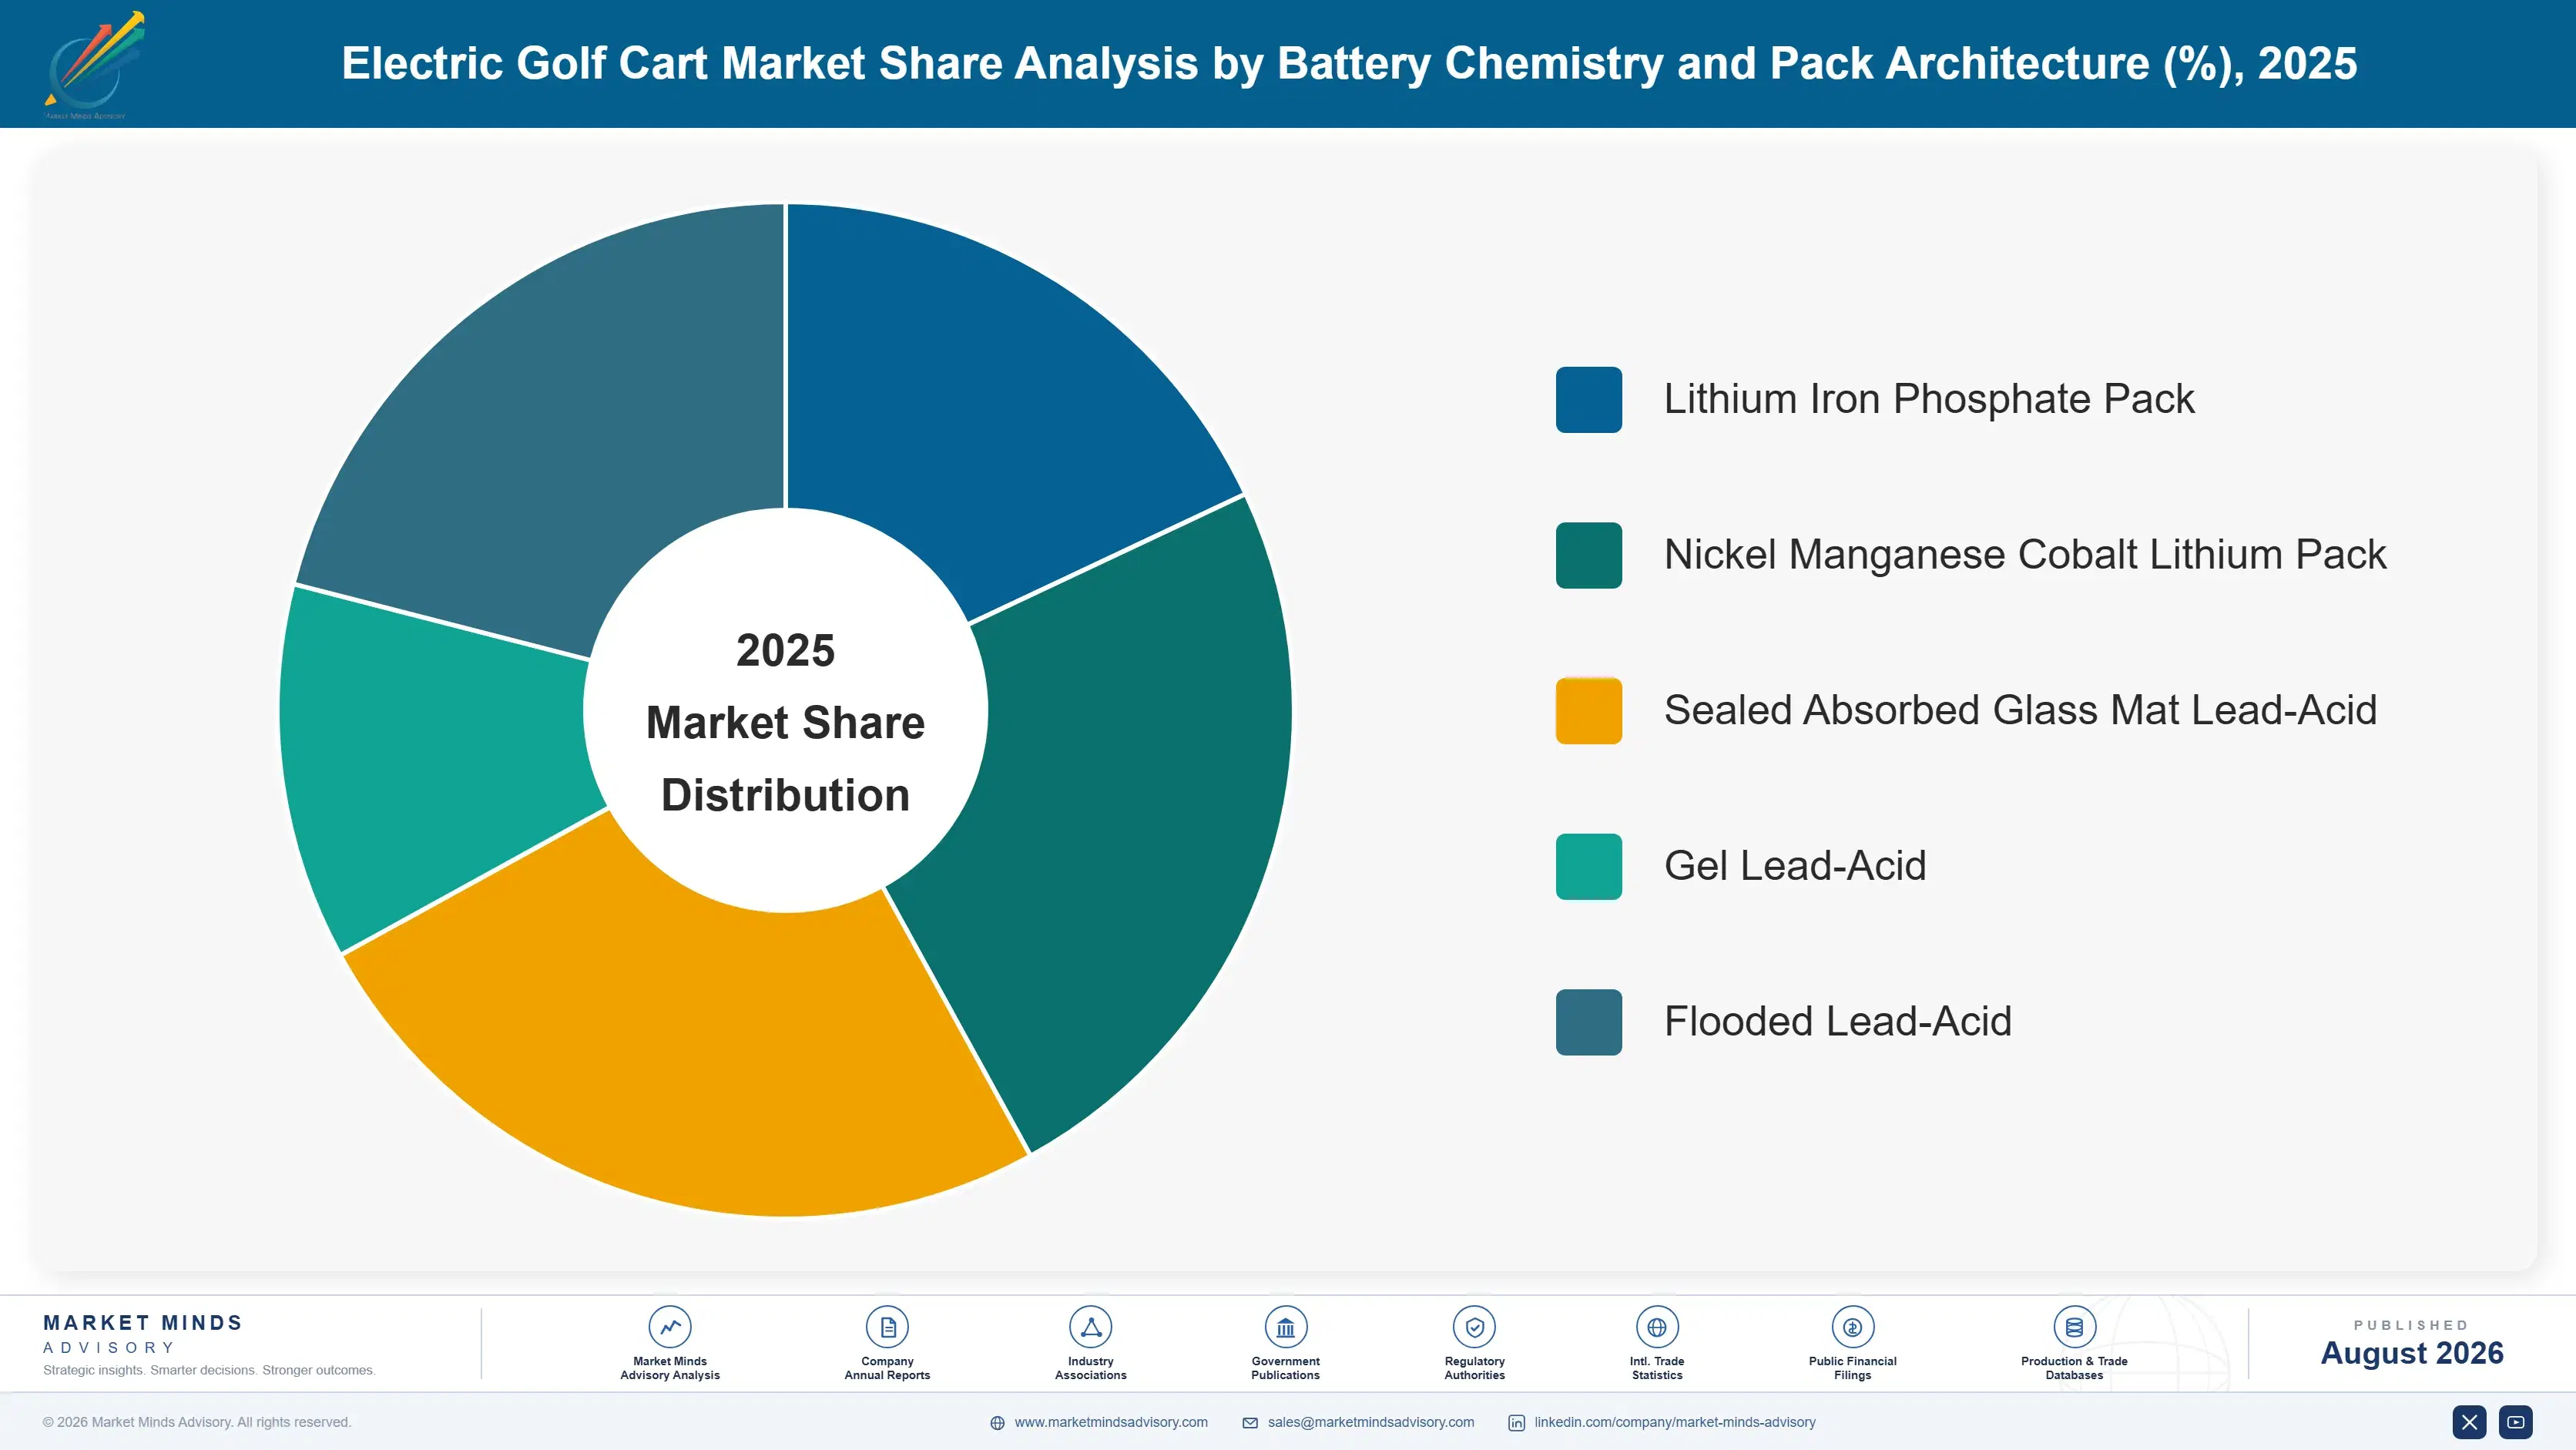
Segmentation follows battery chemistry and pack architecture, because energy storage determines maintenance burden, service life, vehicle weight, realised price and the total ownership calculation every fleet buyer actually performs. Chassis design, body style, passenger count, warranty scope and street-legal specification all sit downstream of that chemistry decision, and every one of them is priced directly against it.
electric-golf-cart-market-trends-growth-market-share-analysis-1787315813906

Lithium Iron Phosphate Pack

The fastest segment at 13.2%, a full 1.50 times the market rate, covering carts fitted with lithium iron phosphate packs rather than lead-acid strings or higher energy density lithium chemistries. Longevity and safety together explain the position. The chemistry survives roughly 3,000 charge cycles against perhaps 800 for flooded lead-acid, tolerates partial charging without damage, and carries a thermal stability advantage that matters enormously when a hundred packs sit charging in one maintenance building overnight. Energy density is lower than nickel manganese cobalt, which costs some range for a given pack volume, but a golf cart has room and does not need the weight saving badly enough to accept the trade against certification and insurance considerations.
CAGR 13.2%

Nickel Manganese Cobalt Lithium Pack

Growing at 11.4% on nickel manganese cobalt lithium packs, which carry meaningfully higher energy density than iron phosphate and therefore deliver more range from the same pack volume and weight. Street-legal residential vehicles are where that advantage actually matters, since a household using the cart for neighbourhood trips wants range without a pack filling the whole under-seat space. Performance and lifted configurations favour the chemistry for the same reason. What limits the segment is thermal behaviour: insurers and course operators storing packs in enclosed buildings increasingly prefer iron phosphate, and that preference is now appearing directly in fleet tender documents rather than only in private conversation between operators and their underwriters.
CAGR 11.4%
Full segment breakdown across 5 segments available in the complete report.

Regional Architecture and Country Demand Map

North America holds 48% of global value on golf facility density and cart-legal residential ordinance combined, a concentration few equipment categories match. East Asia follows on manufacturing weight rather than demand, and growth runs fastest across South Asia and Pacific on course construction and resort development.

North America

Note: North America holds 48% against a 22 to 32% band because the United States operates roughly 16,000 of the world's 38,000 golf facilities and is the only country where electric carts function as street-legal neighbourhood transport at meaningful scale. Course fleets replace on five to seven year lease cycles, and each turnover is now a lithium conversion decision rather than a like-for-like replacement. The larger growth sits outside golf, in cart-legal communities across Florida, Arizona, Texas, Georgia and the Carolinas where households specify lithium for range and charging convenience. Battery certification requirements have also advanced further here than in any other market. Nowhere else combines fleet density and residential ordinance this way.
Share: 48% | CAGR: 8.3% (2026 to 2036)

East Asia

Manufacturing weight rather than course density defines this region. Chinese producers in Guangdong and Jiangsu supply a very large share of world export volume, much of it under private label arrangements for brands sold in North America and Europe, and domestic lithium cell supply gives them a delivered cost position no importer matches. Japanese course fleets have historically favoured gasoline on hilly terrain that punishes battery range, though lithium packs holding voltage under load are changing that calculation. South Korean resort development adds steady demand, and Chinese domestic golf and resort construction is growing from a genuinely small base. Export volume matters more here than domestic demand does, and that balance shows no sign of changing soon.
Share: 22% | CAGR: 10.0% (2026 to 2036)
Regional intelligence for 5 additional markets available in the complete report: Western Europe, South Asia and Pacific, Latin America, Middle East and Africa, Eastern Europe. Contact sales@marketmindsadvisory.com.
electric-golf-cart-market-trends-growth-country-cagr-analysis-1787315814421

Where Electric Cart Margin Is Won

Four positions separate manufacturers capturing lithium value from those assembling chassis around purchased packs: owning pack design and battery management internally, holding certification evidence that fleet tenders now demand, structuring finance that removes the capital hurdle, and reaching residential buyers through the kind of dealers who have never once sold to a golf course.

Own Pack Design And Battery Management Internally

Energy storage runs to roughly 38% of manufactured vehicle cost, and manufacturers buying finished packs hand that entire margin pool straight to a cell integrator while still keeping the warranty exposure themselves. Bringing pack architecture, module assembly and battery management software in house captures between 9 and 14 points of gross margin on every single lithium unit shipped. Cells themselves still come from established external suppliers, but the thermal design, the state-of-charge logic and the diagnostics behind them are where both differentiation and margin genuinely live in this vehicle today.
Market Impact: Captures 14 points of pack gross ma

Hold Certification Evidence Fleet Tenders Now Demand

Course operators and their insurers now ask for pack certification, documented thermal management and battery management diagnostics before approving any hundred-cart lithium conversion at all, and roughly 40% of fleet tender documents already carry those conditions explicitly written into them. Manufacturers holding the evidence win 18% to 25% more fleet tenders than delivered price alone would predict, and the requirement quietly excludes assemblers fitting generic packs without testing. The cost involved is testing programmes and documentation rather than any manufacturing capital at all, which makes this the cheapest advantage available anywhere here.
Market Impact: Wins 25% more fleet tenders than pr

Structure Finance That Removes The Capital Hurdle

A lithium conversion across a sixty-cart fleet costs roughly $180,000 more than lead-acid at purchase, which is exactly the sum that stalls committee approval at smaller clubs running tight annual capital budgets. Manufacturers offering lease structures that spread the premium, battery-as-a-service arrangements or residual value guarantees convert facilities that would otherwise defer another cycle, lifting fleet conversion rates by somewhere between 22% and 30%. The cost is credit structuring and residual risk rather than engineering, which makes it considerably quicker to implement than any product engineering programme could ever be.
Market Impact: Lifts fleet conversion rates by up

Reach Residential Buyers Through Non-Golf Dealers

Household buyers in cart-legal communities never visit a golf course to shop for a cart, which is the single fact that incumbent distribution was never designed around at all. Powersports, marine and independent street-legal dealers now move a large share of residential volume, and manufacturers signing those dealers early hold 16% to 22% higher realised price than competitors routing the same buyer through golf distribution channels. The build cost here is dealer recruitment, floor plan financing and territory management rather than any engineering effort whatsoever, which makes it fast to execute.
Market Impact: Adds 22% realised price across the

Who Controls the Margin Pool

Concentration sits at 63% for the top five measured on electric unit shipment volume, the basis used throughout this section, and it runs considerably higher than the wider cart market. Textron Specialized Vehicles and Club Car lead on golf facility fleet penetration built over decades of lease financing and dealer coverage, with Yamaha holding a smaller but durable installed base and ICON and Evolution taking residential channel share rapidly.
Competitive activity runs on three fronts. Pack integration is the first and the most consequential, since owning the battery decides who captures the value lithium created. Certification evidence is the second, and it now determines which manufacturers even reach the shortlist on large fleet tenders. The third is residential dealer reach, where the challengers moved fastest and the incumbents were simply unprepared.

Pressure is arriving from below and from outside. ICON and Evolution built residential share from nothing inside a decade, and Chinese manufacturers supplying private label volume compete at delivered prices established brands cannot approach. Rankings will shift wherever residential volume outgrows fleet volume, which on current trajectory happens well before 2030 across North America.
electric-golf-cart-market-trends-growth-company-positioning-matrix-1787315814942

Competitive Moat and Risk Dimensions

TEXTRON SPECIALIZED VEHICLES

Moat: Entrenched fleet lease financing

Decades of lease structures written directly with golf facilities create switching friction that no product specification overcomes on its own. Fleet managers renew with whoever holds their financing, service history and parts availability, and the dealer coverage across North American golf makes that renewal the path of least resistance at almost every cycle.
TEXTRON SPECIALIZED VEHICLES

Risk: Weak residential channel presence

The distribution network that makes the fleet business defensible counts for very little in the residential segment now driving growth. Household buyers shop powersports and independent dealers where challengers have signed territory aggressively, and rebuilding reach there means competing for floor space against brands already established in those showrooms.
CLUB CAR

Moat: Platform breadth beyond golf

A common electric chassis architecture spanning golf fleets, commercial transport, campus utility and street-legal residential configurations spreads engineering and tooling cost across far more units than a golf-only line ever supports. That breadth gives dealers a fuller catalogue to sell, which improves territory economics and makes the brand considerably harder to displace at distributor level.
CLUB CAR

Risk: Capital constraints on pack development

Ownership structure and associated debt service limit how aggressively the business can fund pack integration, certification programmes and dealer expansion at the same time. Competitors backed by larger industrial balance sheets or cheap domestic cell supply can outspend on any one front, forcing sequencing where the market currently rewards moving on all three.

Players Tracked

Prominent Players

Textron Specialized Vehicles
Club Car
Yamaha Motor
ICON Electric Vehicles
Evolution Electric Vehicles

Other Key Players

Guangdong Marshell Green Power
STAR EV
Bintelli
Tomberlin
HDK Electric Vehicles
Garia
Melex
Ligier Group
Dongguan Excar Electric Vehicle
Xiamen Dalle New Energy
Suzhou Eagle Electric Vehicle Manufacturing
Speedways Electric
AGT Electric Cars
Moto Electric Vehicles
Cruise Car

Recent Developments

JANUARY 2025

Certified lithium pack assembly commissioned at Georgia facility

A leading North American manufacturer commissioned certified lithium pack module assembly alongside battery management production at its Augusta facility during the year, taking direct control of the thermal design and the warranty exposure that fleet customers and their insurers now weigh most heavily at tender time.
Signal: Pack integration rather than vehicle assem
MAY 2025

Insurer conditions reshape fleet lithium conversion requirements

A major insurer of golf facilities introduced new storage separation, charging protocol and pack certification conditions as explicit requirements for continued lithium fleet cover, which pushed several planned fleet conversions toward certified iron phosphate designs and away from generic imported pack assemblies entirely across the market.
Signal: Insurance conditions rather than purchase
SEPTEMBER 2025

Residential brand signs one hundred powersports dealer territories

A street-legal electric cart specialist added roughly one hundred entirely new dealer territories across the American Sun Belt, all of them powersports and marine outlets with no prior golf relationship, targeting the residential community buyer directly rather than any golf facility fleet manager at all.
Signal: Channel reach outside golf distribution ha

What Drives Electric Cart Cost

Cells and pack assembly dominate at roughly 38% of manufactured vehicle cost, with lithium iron phosphate and nickel manganese cobalt cells arriving almost entirely from Chinese and Korean producers. Aluminium and steel chassis content adds around 16%, motor and controller a further 12%, and body panels plus glazing roughly 9%. Certification, testing and battery management software contribute about 5% on regulated fleet product.
Lithium carbonate pricing collapsed through 2023 and 2024 after the 2022 spike, which cut pack costs materially and was passed through as larger packs at the same price point or better attach rates at unchanged retail. IEA battery price tracking shows that decline clearly. Cell tariff measures during 2025 moved the other way for North American assemblers, and Textron Annual Report 2025 identifies input cost pressure on powertrain components across its specialised vehicles segment.

The disadvantage mechanism is cell procurement scale rather than chassis cost. A manufacturer shipping 200,000 units annually negotiates cell pricing on volumes a 20,000 unit producer cannot approach, and the resulting gap runs several hundred dollars on an item already approaching two fifths of cost. Exposure varies geographically too: Chinese assemblers buy cells domestically at prices no importer matches after freight and tariff.
electric-golf-cart-market-trends-growth-cost-volatility-analysis-1787315815137

Index cell supply contracts to published battery pricing

Supply agreements written against published cell and lithium indices rather than fixed annual pricing move volatility onto a formula both parties can verify, which shortens negotiation and removes the argument following every unexpected move. It does not reduce exposure, but it makes pass-through defensible to dealers and fleet customers who can see the same published data themselves.

Qualify both iron phosphate and higher density chemistries

Holding validated pack designs in both lithium iron phosphate and nickel manganese cobalt lets a manufacturer follow price movements between chemistries rather than being locked to whichever one it designed around three years ago. It also matches insurer preference where iron phosphate is required and range preference where it is not, which turns a cost hedge into a commercial advantage.

Design chassis architecture accepting multiple pack formats

A frame engineered to accept lead-acid, sealed and both lithium chemistries without retooling lets a manufacturer follow cell pricing and customer preference rather than committing to one architecture for the life of the platform. The engineering premium is modest at design stage and effectively impossible to retrofit afterwards, which makes it a decision that has to be taken very early.

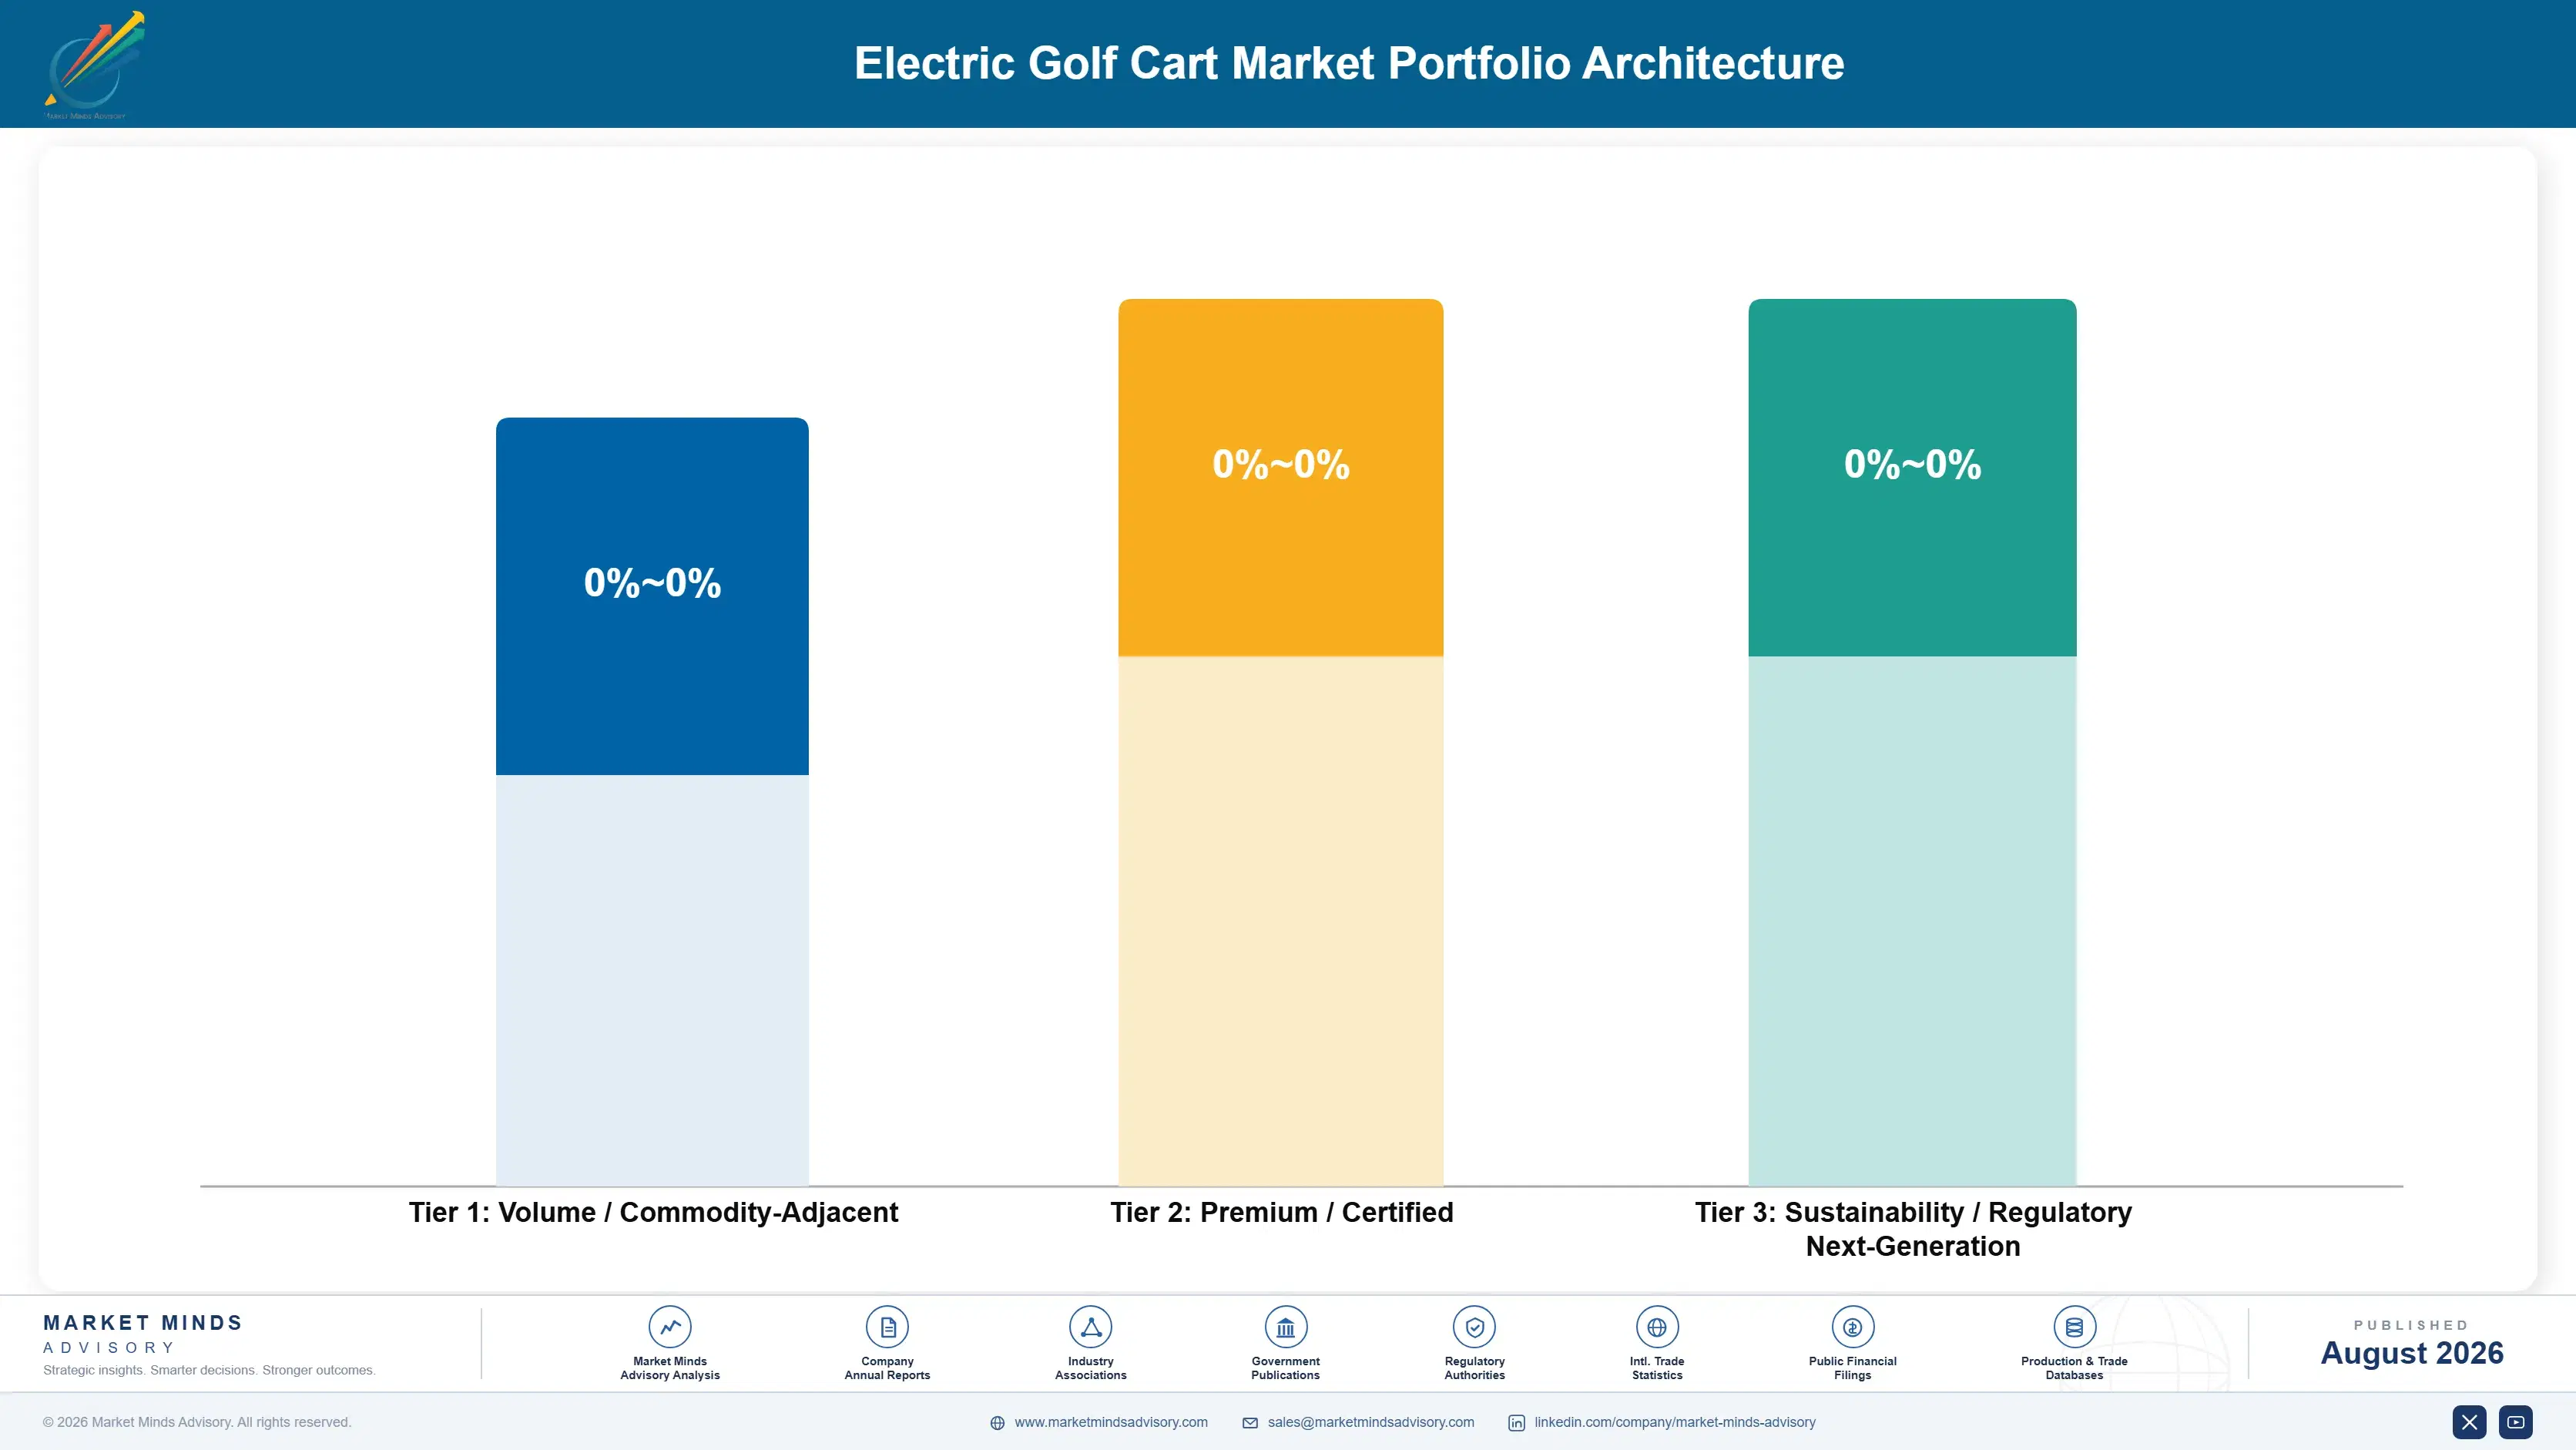
Portfolio Architecture for Margin Defence

Portfolio economics here divide on pack ownership and certification rather than on vehicle configuration. Lead-acid fleet carts sold into competitive tenders earn gross margins in the low to mid teens, because specification is effectively identical across suppliers, the technology is entirely settled and price plus service coverage are the only variables any operator actually negotiates. Volume secures the relationship rather than the margin.
The premium tier is certified lithium fleet supply. Manufacturers owning pack design, holding certification evidence and answering insurer questions convincingly win tenders that price alone would not secure, and the lithium unit carries roughly 30% more realised value than lead-acid on a chassis costing barely more. Margins run in the high twenties to mid thirties. Insurer engagement is now part of the sales process.

Above both sits street-legal residential and specialised commercial product. Household buyers in cart-legal communities specify lithium, comfort content, lighting, safety equipment and audio, and they buy through dealers who price for a considered household purchase rather than a fleet tender. Margins reach the high thirties, and the demand grows on ordinance expansion rather than on golf participation, which makes it considerably less correlated with the rest of this business.

Volume / Commodity-Adjacent

Lead-acid fleet carts sold into competitive facility tenders. Specification is effectively identical across suppliers and the technology is entirely settled, leaving price and service coverage as the only genuine variables under negotiation.
Gross Margin: 12 to 17%

Premium / Certified

Certified lithium fleet supply with owned pack design and documented thermal management. The range is wide because certification depth varies considerably and because some manufacturers still fit purchased packs without it.
Gross Margin: 27 to 35%

Sustainability / Regulatory / Next-Generation

Street-legal residential configurations together with specialised commercial and campus shuttle product. The range reflects the gap between standard residential fitment and fully configured commercial shuttle vehicles sold direct to operators.
Gross Margin: 34 to 42%
electric-golf-cart-market-trends-growth-portfolio-architecture-1787315815654

High-value Sub-segments and Strategic Watch-out

Certified Lithium Residential Configurations

High value and high growth sitting squarely together. Certification content, lithium packs and comfort options stack onto one chassis, the buyer is a household rather than a procurement committee, and Sun Belt dealer territories are still being signed for the first time rather than defended.
Gross Margin: 36 to 43%

Resort And Campus Shuttle Platforms

High value running on genuinely moderate growth. Six and eight passenger configurations sold to hospitality, university and industrial operators who replace on schedule and specify on guest experience or duty cycle rather than delivered price, which holds realised margin genuinely steady right through the cycle.
Gross Margin: 31 to 38%

Certified Lithium Fleet Conversions

The volume core that keeps assembly lines loaded and dealer networks commercially viable across the whole cycle. Lease renewals force the conversion decision every five to seven years, and certification evidence rather than delivered price increasingly decides which manufacturer actually ends up winning the tender.
Gross Margin: 27 to 35%

Lead-Acid Fleet Product

The strategic watch-out sitting squarely in this portfolio. Volumes still matter at price-sensitive clubs and in import-duty markets, but lithium takes share at every lease renewal, and the tooling and working capital committed to it now depreciate against a base that shrinks every single year.
Gross Margin: 12 to 17%

How Electric Cart Demand Repeats

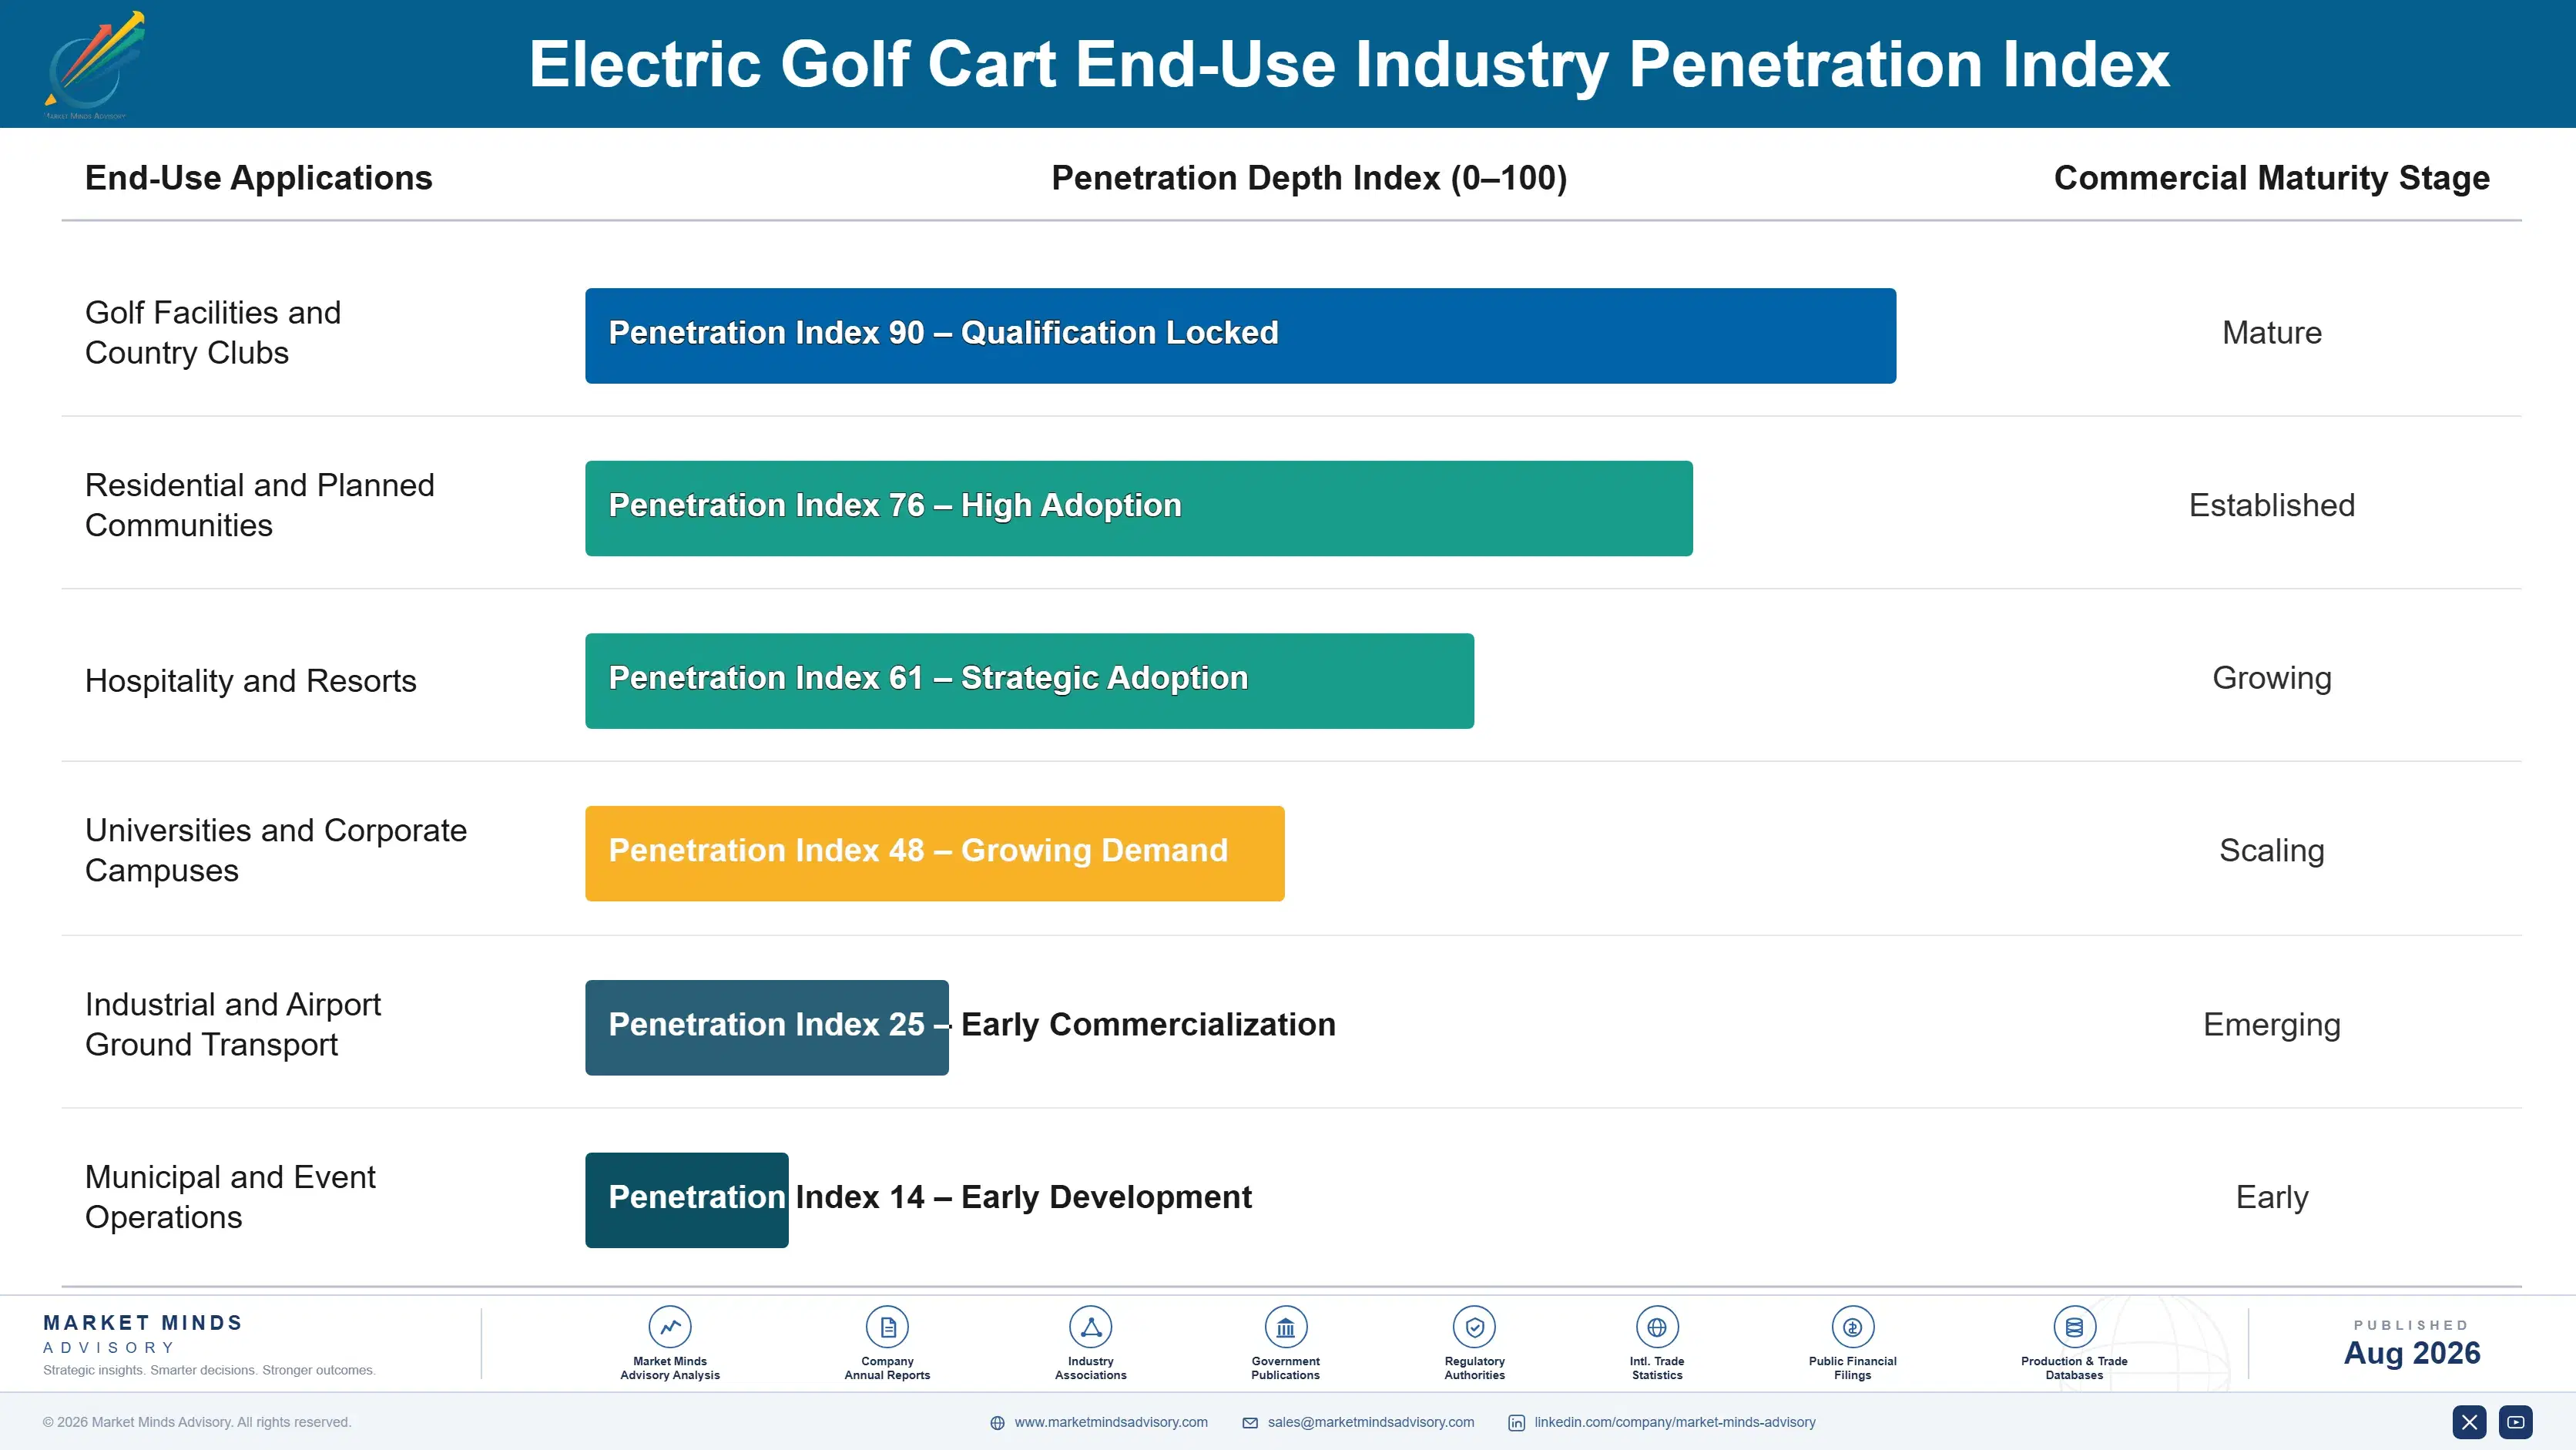
The annuity here is the lease cycle rather than the vehicle. A golf facility running sixty to eighty carts on a five to seven year lease turns its entire fleet over on schedule regardless of condition, which converts what would be a deferrable capital purchase into a recurring commercial event. Parts, service and eventually pack replacement follow across that period, and the manufacturer holding the financing usually holds all of it.
Stickiness varies sharply by end-use. Golf facilities are the stickiest buyers because lease financing, service history and parts availability all bind them to one counterparty, and open tenders are genuinely rare. Resort and campus operators follow closely, since duty cycle and guest experience matter more to them than delivered price. Household buyers are the least sticky by a wide margin, comparing specification openly across dealers and switching brands without any hesitation at all.

The buyer profile has shifted generationally and decisively. Twenty years ago the purchasing decision sat almost entirely with club superintendents and fleet managers. Today a large share sits with homeowners in their forties and fifties choosing a second vehicle, and they arrive expecting lithium range, app connectivity and audio as standard rather than as extra-cost options.
electric-golf-cart-market-trends-growth-end-use-penetration-index-1787315816139

Where To Compete And Why

These are among the four positions where our research anticipates prominent divergence between winners and laggards over the coming forecast period. Each is grounded in the demand model, the regulatory perimeter, and the announced capacity pipeline.
01 / BATTERY PACK OWNERSHIP

Own the pack or surrender the lithium value

Energy storage is roughly 38% of manufactured cost, and a manufacturer buying finished packs hands that entire margin pool to a cell integrator while retaining the warranty exposure regardless. Bringing module assembly and battery management design in house captures 9 to 14 points of gross margin on every lithium unit shipped. It also decides whether a fleet customer renews, because pack reliability is the one failure mode that operators and their insurers genuinely remember when the next tender comes around.
02 / CERTIFICATION EVIDENCE DEPTH

Insurers now write the tender conditions

Course operators storing a hundred lithium packs in one building ask questions lead-acid never prompted, and their insurers ask them first, which is why roughly 40% of fleet tenders now carry certification conditions explicitly. Manufacturers holding tested pack designs, thermal documentation and management system diagnostics win 18% to 25% more tenders than delivered price alone would predict. The cost involved is testing and documentation rather than any manufacturing capital, which makes this the cheapest competitive advantage available anywhere in this market.
03 / CONVERSION FINANCE STRUCTURING

Capital not conviction is what stalls conversion

A lithium conversion across a sixty-cart fleet costs roughly $180,000 more than lead-acid at purchase, and that figure is precisely what stalls approval at smaller clubs running tight annual budgets. Lease structures spreading the premium, battery-as-a-service arrangements and residual guarantees convert facilities that would otherwise defer another full cycle, lifting conversion rates by 22% to 30%. The cost involved is credit structuring and residual value risk rather than engineering, which makes it considerably quicker to implement than any product programme.
04 / RESIDENTIAL CHANNEL REACH

Sign non-golf dealers before territories close

Household buyers in cart-legal communities shop powersports, marine and independent street-legal outlets, and they never set foot on a golf course to make the decision at all. Manufacturers reaching them through those channels hold 16% to 22% higher realised price than those routing the same buyer through golf distribution. Territory is finite and being claimed right now, which makes this a timing question rather than a strategic one, and late entrants will end up paying considerably more for materially weaker outlets.

Engagement Snapshot From the Field

A live engagement with an industry participant carrying material or product regulatory and market exposure ahead of a defining policy shift, showing how our research translates into a defensible multi-year portfolio strategy.
MARKET MINDS ADVISORY · CLIENT ENGAGEMENT SUMMARY
Electric Golf Cart Producer Strategic Portfolio Review and Transition Roadmap 2026·Investment Scenario on Electric Golf Cart Exposure Evaluation 2025-26
CLIENT PROFILE
A North American manufacturer of electric personal transport vehicles with annual revenue around $210 million (client-reported, unverified by MMA), roughly 88% of it from golf facility fleet sales through an established dealer network. The business fitted purchased lithium packs rather than designing its own, held no certification evidence of its own, and had lost four large fleet tenders in eighteen months on insurer conditions it could not satisfy.
STRATEGIC CHALLENGE
Fleet volumes were holding but margins compressing, and the tender losses had all turned on pack certification rather than on price or specification. The board had approved capital for one major programme and needed to choose between bringing pack design and battery management in house, funding a certification programme around purchased packs, or entering the residential channel where it had no presence.
MMA APPROACH
MMA modelled fleet conversion demand across 340 North American facilities by lease renewal date, mapped insurer conditions appearing in tender documents across four underwriters, and assessed the capital and timeline requirements for each option. Twenty-two expert interviews with course superintendents, fleet lessors, insurance underwriters and powersports dealers tested where decisions were genuinely being made.
KEY FINDINGS
  1. Certification conditions appeared in roughly 40% of fleet tenders studied and were expected to reach most of them within three years, which made the client's exclusion a widening problem rather than a temporary one.
  2. Certifying purchased packs was possible but left the client dependent on a supplier who could change cell specification at will, invalidating the evidence and repeating the exclusion problem entirely.
  3. In-house pack design returned roughly 12 points of additional gross margin alongside the certification benefit, making it the only option that solved two problems with one programme.
  4. Residential channel entry offered stronger margins still but required dealer recruitment the client could not fund simultaneously with any pack development programme.
CLIENT PROFILE
A North American manufacturer of electric personal transport vehicles with annual revenue around $210 million (client-reported, unverified by MMA), roughly 88% of it from golf facility fleet sales through an established dealer network. The business fitted purchased lithium packs rather than designing its own, held no certification evidence of its own, and had lost four large fleet tenders in eighteen months on insurer conditions it could not satisfy.
STRATEGIC CHALLENGE
Fleet volumes were holding but margins compressing, and the tender losses had all turned on pack certification rather than on price or specification. The board had approved capital for one major programme and needed to choose between bringing pack design and battery management in house, funding a certification programme around purchased packs, or entering the residential channel where it had no presence.
MMA APPROACH
MMA modelled fleet conversion demand across 340 North American facilities by lease renewal date, mapped insurer conditions appearing in tender documents across four underwriters, and assessed the capital and timeline requirements for each option. Twenty-two expert interviews with course superintendents, fleet lessors, insurance underwriters and powersports dealers tested where decisions were genuinely being made.
KEY FINDINGS
  1. Certification conditions appeared in roughly 40% of fleet tenders studied and were expected to reach most of them within three years, which made the client's exclusion a widening problem rather than a temporary one.
  2. Certifying purchased packs was possible but left the client dependent on a supplier who could change cell specification at will, invalidating the evidence and repeating the exclusion problem entirely.
  3. In-house pack design returned roughly 12 points of additional gross margin alongside the certification benefit, making it the only option that solved two problems with one programme.
  4. Residential channel entry offered stronger margins still but required dealer recruitment the client could not fund simultaneously with any pack development programme.
RECOMMENDED STRATEGY
Phase 1: Phase one: bring lithium pack design and battery management in house, targeting certification evidence ahead of the next major lease renewal window. Phase 2: Phase two: rebuild the fleet tender proposition around owned certification, insurer engagement and documented thermal management rather than around delivered price. Phase 3: Phase three: enter the residential channel once pack capability is proven, recruiting powersports territories in states with the widest cart-legal ordinance coverage.
OUTCOME
The client commissioned pack assembly within eleven months and reported certification completed ahead of schedule (client-reported, unverified by MMA). Three of the four previously lost tenders were won at re-bid, blended gross margin improved by roughly five points, and residential dealer recruitment began a year ahead of the original plan.

Frequently Asked Questions

Foundational context covering the market sizes, CAGR, scope, country, region and competition that inform every finding below. This section is provided to cover basics and most often pre-purchase conversations, answered from the MMA Primary Research Dataset.

What is the current size of the Electric Golf Cart Market?

The global electric golf cart market was valued at $1.90 billion in 2025, reaching an estimated $2.07 billion in 2026. That covers battery electric golf carts and street-legal low-speed variants derived from electric cart platforms.

How large will the Electric Golf Cart Market be by 2036?

MMA forecasts the market reaching $4.81 billion by 2036, an increase of $2.74 billion over the 2026 base. That represents an expansion multiple of 2.32 times across the forecast period.

What is the CAGR for the Electric Golf Cart Market 2026 to 2036?

The base case compound annual growth rate is 8.8%, with a bull case of 10.0% and a bear case of 7.6%. Historical growth between 2020 and 2025 ran at 7.4% annually.

Which segment is growing fastest?

Lithium iron phosphate packs grow at 13.2%, a full 1.50 times the market rate, on cycle life and thermal stability advantages. Nickel manganese cobalt packs follow at 11.4% on energy density.

Who are the major companies in the Electric Golf Cart Market?

Textron Specialized Vehicles, Club Car, Yamaha Motor, ICON Electric Vehicles and Evolution Electric Vehicles lead on electric unit shipment volume. Together they account for roughly 63% of global electric shipments.

Which country is growing fastest?

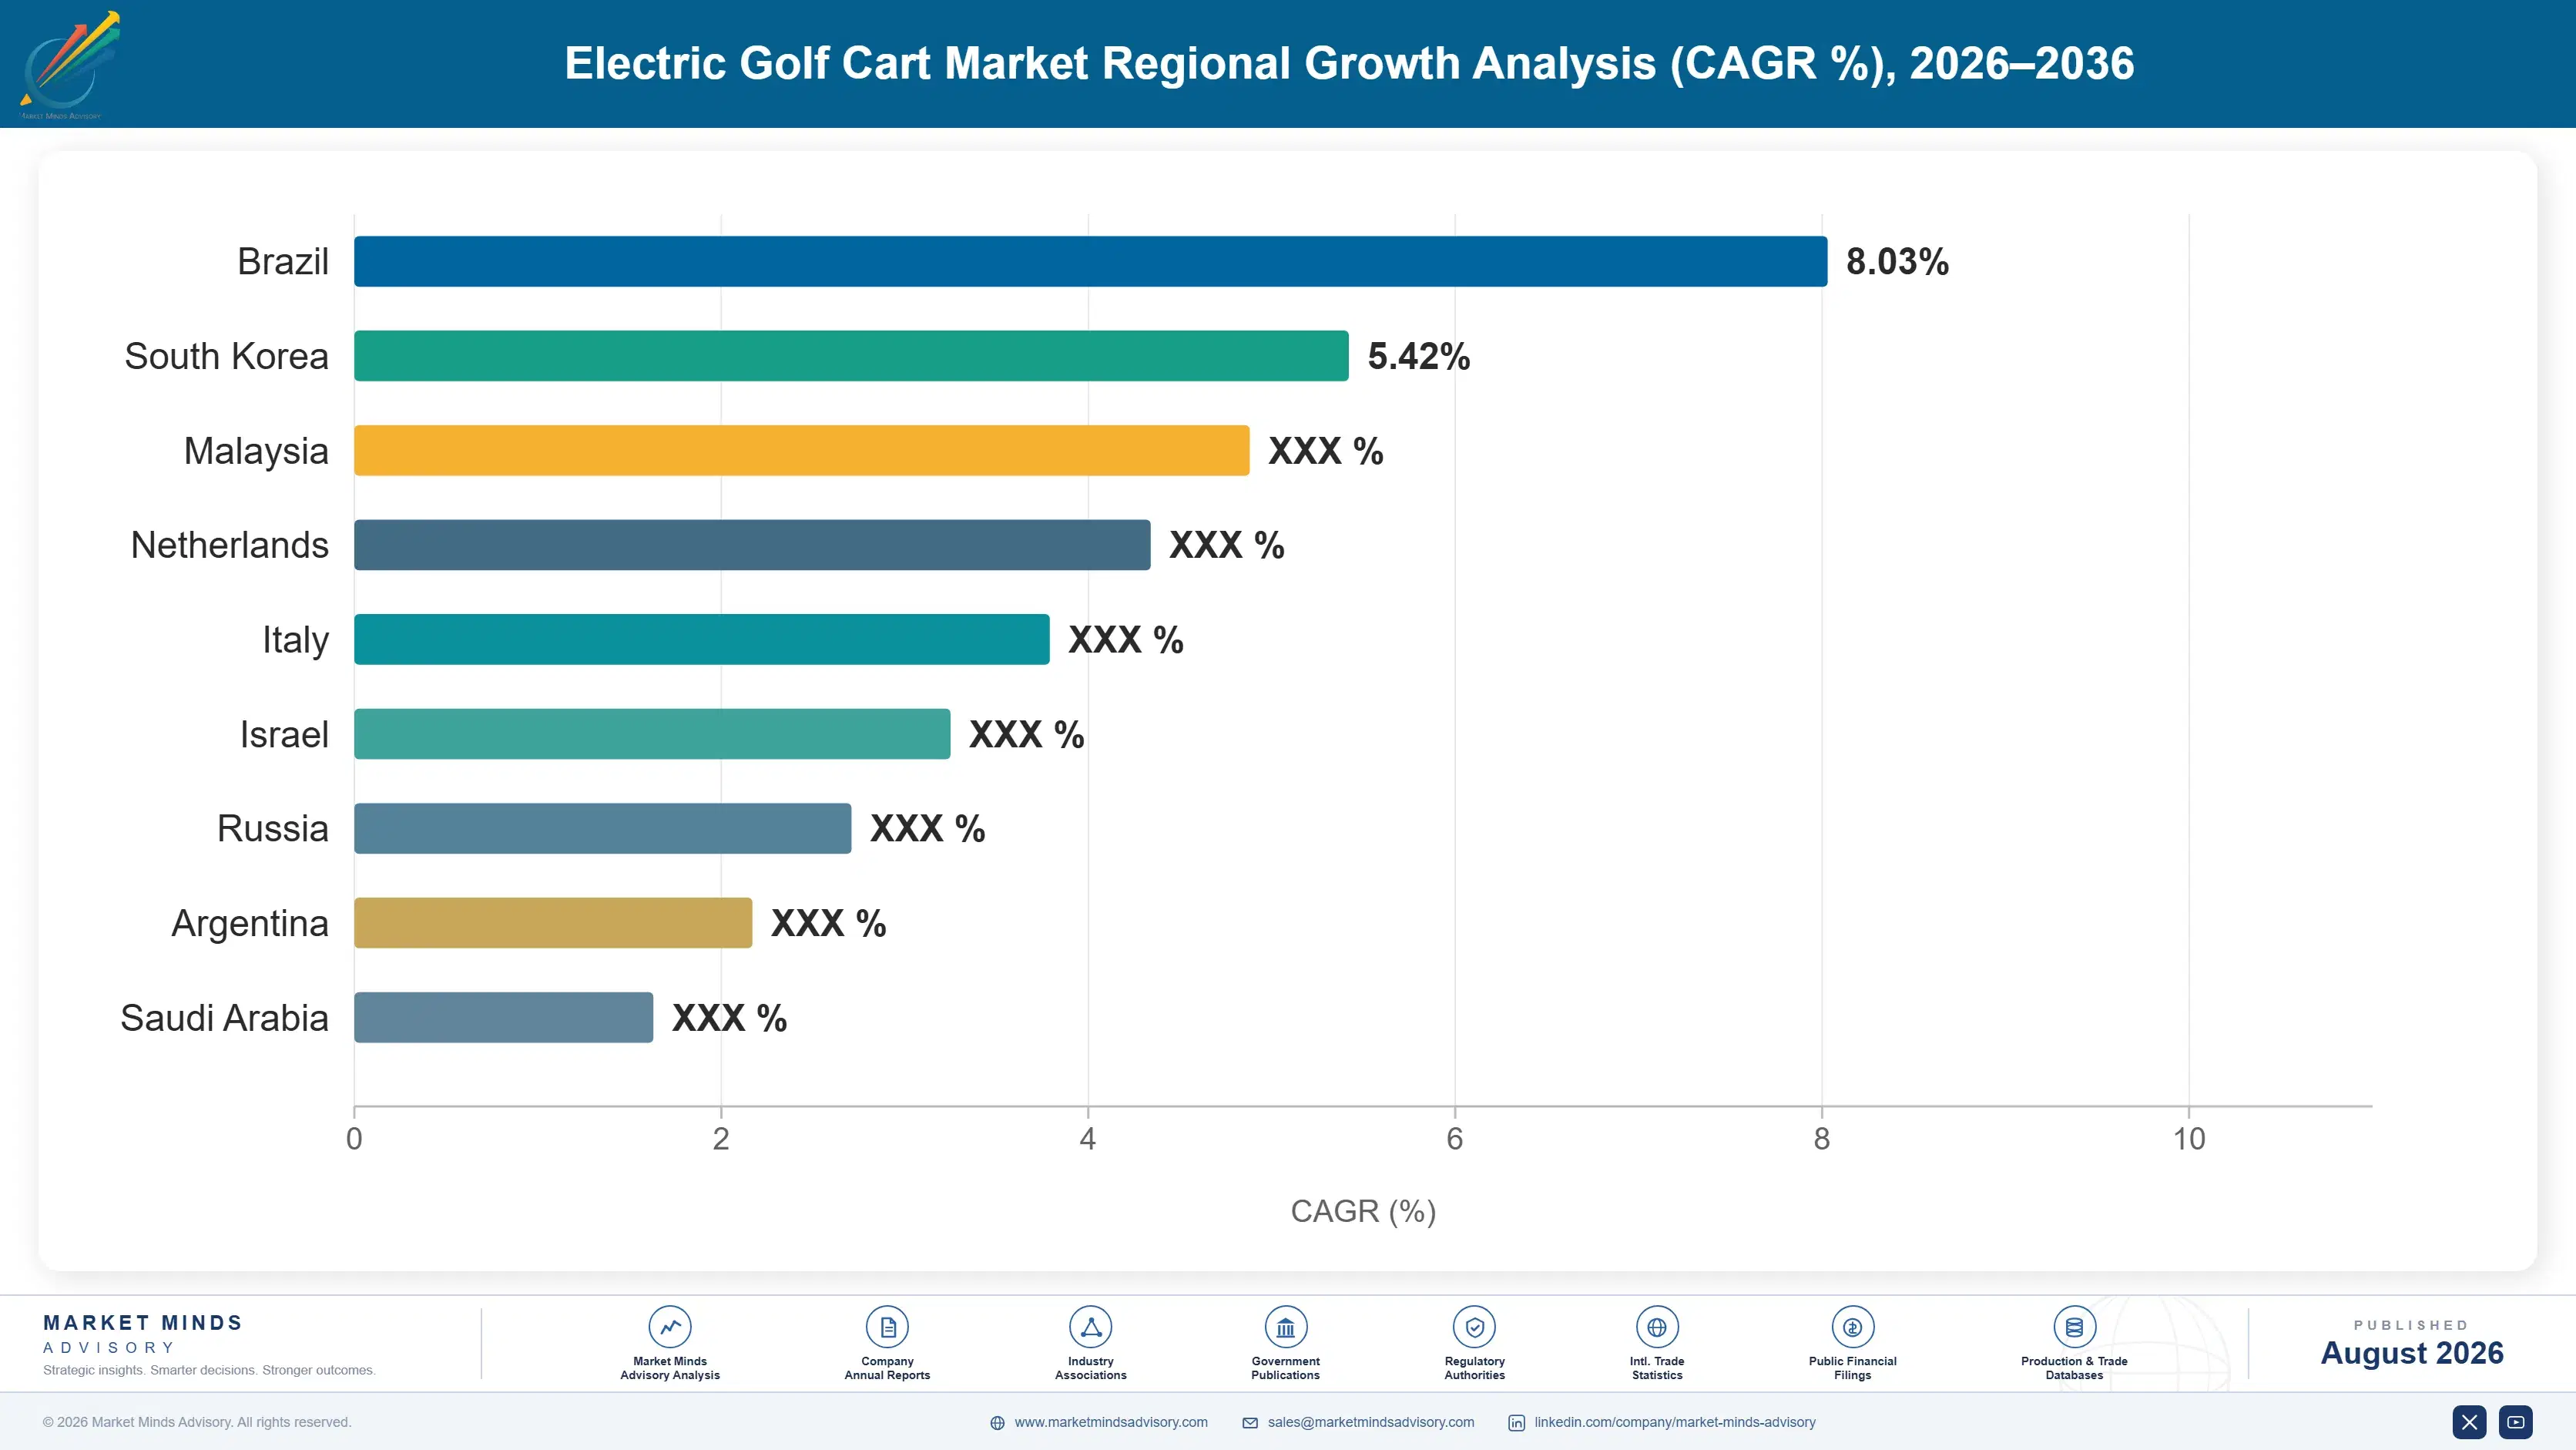
India grows fastest at 11.4% annually, driven by course construction attached to residential and hospitality development plus expanding domestic assembly. Vietnam and Saudi Arabia follow on resort development.

Report Segmentation Architecture

The full report scope spans multiple orthogonal segmentation dimensions, with cross-tabulated demand data provided for each dimension pair. Coverage extends further to regional breakdowns, trend trajectories, and the competitive detail needed to support segment-level decision-making.

By Battery Chemistry and Pack Architecture

  • Lithium Iron Phosphate Pack
  • Nickel Manganese Cobalt Lithium Pack
  • Sealed Absorbed Glass Mat Lead-Acid
  • Gel Lead-Acid
  • Flooded Lead-Acid

By End-Use Industry

  • Golf Facilities and Country Clubs
  • Residential and Planned Communities
  • Hospitality and Resorts
  • Universities and Corporate Campuses
  • Industrial and Airport Ground Transport
  • Municipal and Event Operations

By Commercial Dimension

  • Golf Dealer and Distributor Channel
  • Powersports and Independent Dealer Channel
  • Direct Fleet Lease Programmes
  • Original Equipment Private Label Supply
  • Certified Pre-Owned and Refurbished Trade

By Region

  • North America
  • Western Europe
  • East Asia
  • South Asia and Pacific
  • Latin America
  • Middle East and Africa
  • Eastern Europe

Scope, Methodology, and Coverage

Every figure in this report is reproducible from documented input assumptions. The scope below maps the historical period, the forecast horizon, the segmentation dimensions, and the countries covered, alongside the underlying primary and qualitative methodology.
Historical Period
2020 to 2025
Forecast Period
2026 to 2036
Base Year
2025 (USD billions; MMA Primary Research Dataset, August 2026)
Market Definition
This report covers battery electric golf carts and golf-course personal transport vehicles across all battery chemistries, including street-legal low-speed vehicle variants derived from electric cart platforms and sold into golf facility, residential, resort, campus, industrial and municipal applications. Gasoline and hybrid golf carts, utility task vehicles, all-terrain vehicles, neighbourhood electric vehicles built on automotive platforms, turf maintenance equipment and aftermarket battery conversion kits are excluded from the sizing.
Quantitative Units
USD billions at manufacturer realised value; unit shipments in thousands; average realised price in USD per vehicle.
Segmentation Dimensions
By battery chemistry and pack architecture; by end-use industry; by commercial dimension; by region.
Regions Covered
North America, Western Europe, East Asia, South Asia and Pacific, Latin America, Middle East and Africa, Eastern Europe
Countries Covered
United States, Canada, Mexico, United Kingdom, Germany, Spain, Sweden, Ireland, Japan, South Korea, China, Australia, India, Thailand, Vietnam, Brazil, United Arab Emirates, Saudi Arabia, South Africa, Turkey.
Key Companies Profiled
Textron Specialized Vehicles, Club Car, Yamaha Motor, ICON Electric Vehicles, Evolution Electric Vehicles, Guangdong Marshell Green Power, STAR EV, Bintelli, Tomberlin, HDK Electric Vehicles, Garia, Melex, Ligier Group, Speedways Electric and others.
Quantitative Methodology
Primary survey, n=3,800 respondents, Q4 2025, six countries; demand-side model with trade association cross-validation
Qualitative Methodology
47 expert interviews, Q4 2025; applied to validate demand model assumptions, identify emerging dynamics, and assess competitive positioning
Report Format
PDF and XLSX data workbook (Word format preview document)
Publisher
Market Minds Advisory
Report Code
MMA-2026-AUT-942
Published
August 2026
Contact
sales@marketmindsadvisory.com | www.marketmindsadvisory.com

Purchase the full Electric Golf Cart Market Report (2026 to 2036).

The full report sizes the electric golf cart market across five battery chemistries, six end-use industries and seven regions, with unit shipment and realised pricing detail behind every value estimate. It profiles twenty manufacturers on pack integration depth, certification evidence and dealer network reach. Regional chapters cover cart-legal ordinance status by American state, European noise and emission rules and Asian manufacturing capacity. Fleet analysis quantifies lease renewal timing, conversion economics and insurer conditions appearing in tender documents. Cost analysis tracks cell pricing and chemistry mix across the supply base.
Unit shipment and pricing detail by battery chemistry
Fleet lease renewal timing across major facility markets
Lithium attach rate forecasts through 2036
Insurer condition tracking across fleet tender documents
Competitive position assessments across twenty global manufacturers
Cart-legal ordinance status by American state

Built For The People Who Decide

From boardroom strategy to bench-side execution, this report is read cover-to-cover by leaders shaping the next decade of their industry, turning demand scenarios, market dynamics and valuation benchmarks into decisions.
CXOs/ Presidents/ VPs/ Managers
M&A and Corporate Development
Strategy Teams and R&D Heads
Procurement and Product Directors
Regulatory and Compliance Leaders
Investor Relations and Equity Analysts