Market Minds Advisory
Electric Distribution Utility Market

Electric Distribution Utility Market: Electric Distribution Utility Market. Smart Metering, Distribution Automation, and Grid Resilience Infrastructure

Utilities are racing to harden distribution networks against extreme weather and integrate distributed energy resources, pushing spending toward smart metering, automation software, and undergrounding projects that reshape decades-old grid procurement cycles.

Lead Analyst

Published

September 2026

Make Smarter Decisions with Customized Research Insights

Request a free sample report and evaluate market opportunities, growth trends, and competitive dynamics relevant to your business needs.

2025 MARKET VALUE$95.0BMarket Size 2025
2036 FORECAST VALUE$149.3BBase Case , 2026 to 2036
CAGR 2026 TO 20364.2 %Bull 5.4% / Bear 3.0%
INCREMENTAL OPPORTUNITY$50.3BNet 10- year value creation
EXPANSION MULTIPLE1.51x2036 value over 2026 base
Strategic Levers
M&A Pipeline
Regional Outlook
Country Rankings
Competitive Intelligence
Segmental Deep-dive
Call-Us : 91 93563 13602

Executive Snapshot and Market Trajectory.

Distribution utilities are accelerating grid hardening investment faster than regulators anticipated, as extreme weather events and wildfire liability exposure push undergrounding and resilience spending from a discretionary line item into a mandatory capital planning priority. Regulators increasingly approve rate cases treating resilience spending as prudent capital investment. across jurisdictions today
Commercially, distributed energy resource integration is emerging as an unexpected growth engine alongside traditional resilience spending, since rooftop solar and battery storage penetration increasingly strain distribution networks designed for one-directional power flow decades ago. North America and East Asia concentrate the bulk of near-term modernization spending given aggressive grid resilience mandates and renewable interconnection volume happening simultaneously across both regions today nationally.
The competitive field remains fragmented across hundreds of equipment vendors and software providers, though integrated platforms combining metering, automation, and outage management increasingly separate credible bidders from point-solution vendors serving narrower utility budget categories. Utilities are also demanding longer-term software support commitments as grid modernization shifts procurement conversations from equipment purchases toward multi-year platform relationships. Vendors investing early in integrated platform capability are winning the largest multi-year utility framework agreements over point-solution competitors.
Market Definition
This market covers equipment, software, and services procured by electric distribution utilities for grid modernization, including smart metering infrastructure, distribution automation, outage management systems, undergrounding and resilience services, and distributed energy resource integration platforms. It excludes transmission-level infrastructure, generation assets, and retail electricity supply contracts sold independent of grid infrastructure spending.
Base Year Value
$95.0B in 2025 (MMA Primary Research Dataset, September 2026)
Forecast Period
2026 to 2036, eleven discrete annual values
CAGR
4.2% base case. Bull 5.4%. Bear 3.0%.
Fastest Growth Segment
Grid Resilience and Undergrounding Services: 7.5% CAGR
Fastest Growth Country
United States: 5.5% CAGR
Fastest Growth Region
South Asia and Pacific: 6.2% CAGR
Largest Region
North America: 29% of 2025 global value
Market Leaders
Itron, Landis+Gyr, Schneider Electric, Oracle Utilities, Trilliant Networks. Source: MMA Analysis based on company annual reports.
Primary Survey
n=3,800 procurement and R&D decision-makers, Q4 2025, six countries
Methodology
Demand-side build-up, cross-validated against public data, 47 expert interviews

Electric Distribution Utility Market Forecast Scenarios

electric-distribution-utility-market-size-forecast-scenario-1788413162309
Electric distribution utility spending grew steadily between 2020 and 2025 as extreme weather events and aging infrastructure replacement needs pushed capital budgets higher across most major utility service territories, with the historical growth rate holding near 3.7 percent annually through a period marked by growing wildfire liability awareness. Utilities that invested early in resilience report meaningfully fewer weather-related outage claims relative to laggard peers.
The base case assumes continued grid hardening investment tied to wildfire and storm liability exposure, expanding distributed energy resource integration requirements as rooftop solar penetration rises, and smart metering replacement cycles reaching maturity across most developed utility markets. These three commercial mechanisms together sustain a forecast compound annual growth rate of 4.2 percent through 2036, with resilience spending rising fastest. Vendors offering integrated platforms increasingly win preferred status among the largest utility modernization programs.
A bull scenario assumes accelerating wildfire liability exposure and faster-than-expected distributed energy resource integration mandates, pushing growth toward 5.4 percent. A bear scenario assumes regulatory rate case delays and utility capital budget constraints slowing modernization timelines, pulling growth down toward 3.0 percent across the most affected regional utility markets. Both scenarios assume regulatory support for resilience spending continues broadly on schedule.

Resilience Spending Redefines Grid Investment

Three converging forces define this market today: wildfire and storm liability exposure that has turned resilience spending from discretionary into mandatory, distributed energy resource penetration that strains networks built for one-directional power flow, and aging infrastructure replacement needs compounding across most developed utility service territories simultaneously. Utilities that fail to modernize networks risk regulatory penalties and mounting liability exposure as extreme weather events grow more frequent nationwide.
MARKET CONCENTRATION24% CR5combined share held by five leading platform vendors globally
AMI PENETRATION RATE68%share of meters already converted to smart infrastructure today
RESILIENCE SPENDING SHARE22%share of total capital budget tied to grid hardening
AVERAGE FEEDER REPLACEMENT AGE38 yearstypical service life before distribution feeder upgrade required
DER-CONNECTED FEEDER SHARE29%share of feeders carrying meaningful distributed generation today
TOP COUNTRY SHARE26%United States share of global distribution modernization spending
Commercially, the business increasingly resembles enterprise software procurement rather than pure equipment supply, with platform integration depth, data analytics capability, and outage prediction accuracy determining which vendors win the largest multi-year utility modernization programs over purely transactional equipment sales. Vendors offering bundled outage prediction alongside core metering hardware increasingly command premium pricing over point-solution competitors selling equipment alone across most territories.
Over the next decade, artificial intelligence-assisted outage prediction and grid-edge computing will reshape which vendors remain competitive, while utilities increasingly demand interoperability across multi-vendor environments rather than accepting proprietary single-vendor lock-in architectures that dominated the prior generation of distribution automation. Vendors that resist open protocol standards risk losing large utility accounts to more interoperable competitors over the coming decade.
"Utilities used to buy meters. Now they are buying a data platform that happens to read kilowatt-hours as a side effect."
Director, Grid Modernization and Utility Infrastructure Practice · MMA Distribution Grid Modernization Equipment and Services Practice · September 2026

Market Trends

Wildfire Liability Drives Undergrounding Program Expansion

Utilities across wildfire-prone regions are converting overhead distribution lines to underground infrastructure at an accelerating pace, since undergrounding materially reduces ignition risk that has exposed several utilities to multi-billion-dollar liability settlements in recent years. Regulators increasingly approve rate cases treating undergrounding as prudent capital investment rather than discretionary spending, opening budget that previously constrained program scale considerably. Vendors serving this segment increasingly maintain dedicated resilience account teams. Roughly 22 percent of total utility capital budgets in the most exposed jurisdictions now flow toward resilience and undergrounding programs, a figure that continues climbing each successive regulatory cycle.
Market Impact: 35 percent shorter outages, hardened areas
Distributed Energy Integration Strains Legacy Networks

Rooftop solar and battery storage penetration is straining distribution networks originally engineered for one-directional power flow, forcing utilities to invest in grid-edge sensors, advanced inverter integration, and voltage regulation equipment to maintain reliable service across increasingly bidirectional feeders. Roughly 29 percent of distribution feeders in leading markets now carry meaningful distributed generation, up considerably from a decade ago. Utilities that fail to modernize risk curtailing new solar interconnections, creating political and regulatory pressure that further accelerates required infrastructure investment. Battery storage integration adds further complexity to this bidirectional voltage regulation challenge.
Market Impact: 68 percent of meters already smart-converted

Market Opportunities and Growth Drivers

Extreme Weather Events Accelerate Resilience Investment

Extreme weather events including hurricanes, ice storms, and wildfires are causing longer and more frequent outages across major utility service territories, pushing regulators to approve resilience spending that would have faced far more scrutiny a decade ago. The United States alone has experienced billion-dollar weather disasters at a materially higher annual rate over the past five years than the prior decade, according to national climate and disaster reporting, sustaining pressure on utilities to harden infrastructure. Resilience investment can reduce weather-related outage duration by roughly 35 percent in hardened service territories relative to unhardened comparable areas.
Market Impact: 24-month rate case approval delays

Smart Metering Replacement Cycles Reach Maturity

First-generation smart meters deployed during the initial advanced metering infrastructure rollout wave are reaching end of service life, creating a replacement cycle that increasingly favors next-generation platforms with expanded data analytics and grid-edge computing capability over simple meter-for-meter swaps. Roughly 68 percent of meters across developed utility markets have already converted to smart infrastructure, according to MMA primary survey data collected from utility respondents, with replacement demand concentrated among the earliest-adopting territories. This creates a sustained multi-year replacement revenue stream for platform vendors with proven upgrade pathways among the earliest-replacement utility accounts.
Market Impact: 18 percent integration cost premium

Market Restraints and Challenges

Regulatory Rate Case Delays Slow Capital Deployment

Utility capital spending on grid modernization requires regulatory rate case approval, and these proceedings can take twelve to twenty-four months to complete in some jurisdictions, creating a meaningful barrier for utilities seeking to deploy capital quickly in response to emerging resilience needs. The root cause is the multi-stakeholder review process required before rate increases can be passed through to ratepayers, which necessarily slows deployment relative to the pace at which weather-related risks are actually emerging on the ground. This delays modernization timelines and frustrates vendors dependent on predictable order flow. Some utilities pursue pre-approved resilience frameworks as a mitigation pathway.
Market Impact: 22 percent of budgets fund resilience

Legacy System Integration Complicates Platform Upgrades

Many utilities operate distribution management systems built decades apart using incompatible legacy architectures, and integrating new smart metering and automation platforms into these mixed environments requires custom engineering work that extends project timelines and raises costs well beyond greenfield deployment estimates. The root cause is decades of proprietary vendor architecture decisions made before industry-wide interoperability standards existed as a serious utility purchasing consideration. This raises integration project costs by an estimated 18 percent relative to comparable greenfield builds. Vendors increasingly offer middleware integration layers as a mitigation pathway to ease transition without full system replacement.
Market Impact: 29 percent of feeders affected
4 additional market trends, 3 additional growth drivers, and 3 additional restraints and challenges are covered in the full report. Contact sales@marketmindsadvisory.com to access the complete intelligence.

Segment CAGR and Growth Architecture

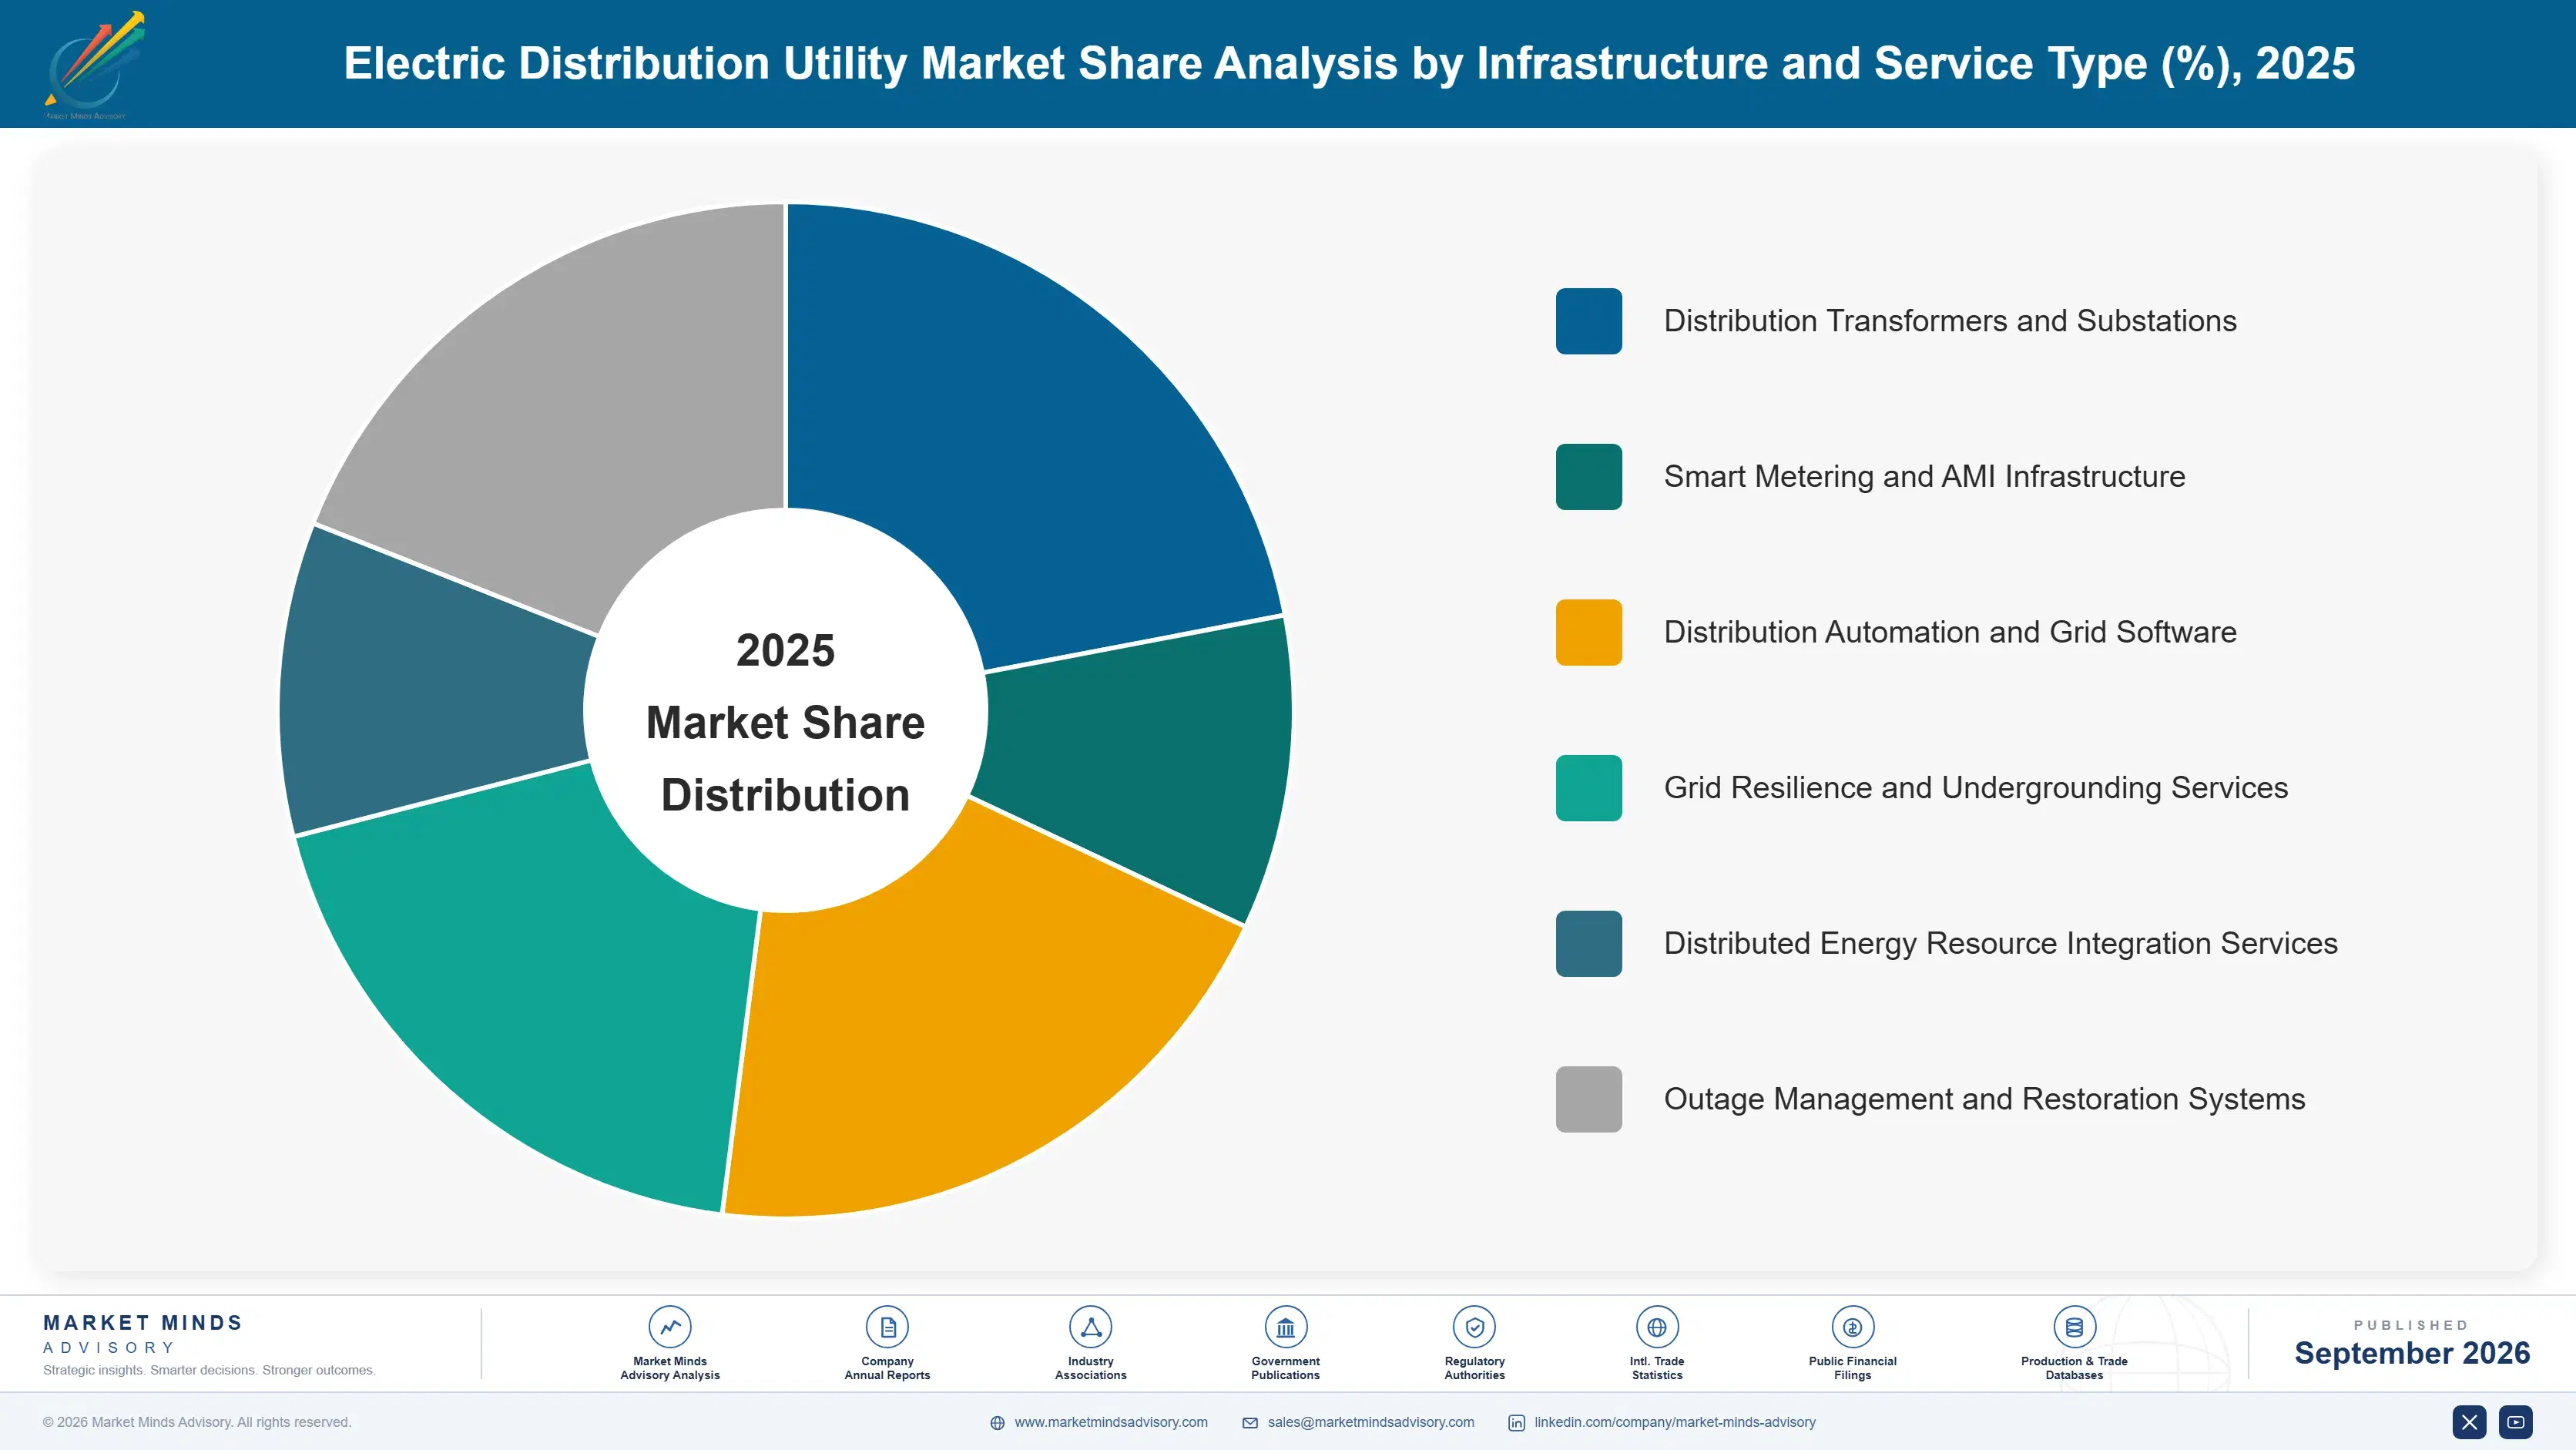
MMA segments this market by infrastructure and service type, since procurement cycles, capital budget categories, and vendor selection criteria differ meaningfully by category rather than by voltage class or ownership model alone, making infrastructure type the most commercially decisive lens for demand analysis. This reflects how utility budgets are actually structured. Six categories span demand from maintenance through resilience-driven hardening.
electric-distribution-utility-market-market-share-analysis-1788413162906

Grid Resilience and Undergrounding Services

This segment covers overhead-to-underground conversion projects, vegetation management technology, and hardened pole and conductor systems deployed specifically to reduce wildfire ignition risk and storm outage exposure. Demand here is expanding fastest of any category as regulators increasingly approve rate cases treating resilience spending as prudent capital investment rather than a discretionary program subject to deferral. Utilities in the most wildfire-exposed jurisdictions increasingly treat undergrounding as a legal and financial necessity rather than an optional service enhancement, given the scale of liability settlements several utilities have faced in recent years. Vendors serving this segment increasingly maintain dedicated resilience engineering teams separate from traditional distribution equipment sales organizations. Capital allocation here continues rising each successive regulatory cycle.
CAGR 7.5%

Distributed Energy Resource Integration Services

This segment covers grid-edge sensors, advanced inverter integration platforms, and voltage regulation equipment deployed to accommodate rising rooftop solar and battery storage penetration on distribution feeders originally engineered for one-directional power flow. Growth here tracks closely with rooftop solar adoption rates, and utilities increasingly treat this integration as essential infrastructure rather than an optional accommodation for individual customer requests. Vendors with proven bidirectional voltage regulation platforms increasingly win preferred status among utilities managing the fastest-growing distributed generation queues, where interconnection delays create meaningful political and regulatory pressure on utility leadership teams. Battery storage co-location further complicates the underlying voltage regulation challenge, rewarding specialized vendors over generalist distribution equipment suppliers across most active markets.
CAGR 6.8%
Full segment breakdown across 6 segments available in the complete report.

Regional Architecture and Country Demand Map

North America leads global demand given aggressive wildfire liability exposure and grid resilience mandates, closely followed by East Asia, where China's expanding renewable interconnection volume sustains the largest and most diversified vendor base. South Asia and Pacific posts the fastest regional growth rate. Resilience spending varies meaningfully by region.

North America

North America's demand reflects two forces operating simultaneously: wildfire liability exposure that has pushed undergrounding and resilience spending from discretionary into mandatory capital planning, and rising distributed energy resource penetration that strains distribution networks originally engineered for one-directional power flow decades ago. Regional utilities face mounting pressure to harden infrastructure ahead of increasingly frequent extreme weather events, and resilience spending has moved from a minor budget line to a core capital planning priority across most affected utility service territories. Vendors serving this region increasingly maintain dedicated wildfire risk modeling teams given the complex, jurisdiction-specific liability exposure many state utility regulators now scrutinize closely. Canada contributes steadily growing demand tied to comparable resilience priorities.
Share: 29% | CAGR: 4.8% (2026 to 2036)

Western Europe

Western European demand centers on aging infrastructure replacement and renewable interconnection capacity tied to ambitious national decarbonization targets across most major member states rather than wildfire-driven resilience spending common elsewhere. Regulatory harmonization efforts across the European Union have accelerated interoperability standard adoption relative to other regions, giving vendors with certified interoperable platforms a meaningful competitive advantage over proprietary architecture competitors. Grid modernization here increasingly ties to distributed energy resource integration rather than storm hardening, since the region's mature grid infrastructure faces different physical risk profiles. Growth trails the global average given the region's comparatively mature grid base relative to faster-growing emerging markets. Nordic utilities have moved fastest among the region's national grid operators.
Share: 20% | CAGR: 2.8% (2026 to 2036)
Regional intelligence for 5 additional markets available in the complete report: East Asia, South Asia and Pacific, Latin America, Middle East and Africa, Eastern Europe. Contact sales@marketmindsadvisory.com.
electric-distribution-utility-market-country-cagr-analysis-1788413163464

Where Grid Vendors Can Capture Margin

Beyond core equipment sales growth, several commercial mechanisms let vendors capture disproportionate margin as utilities shift procurement from one-time equipment purchases toward recurring platform relationships over the coming decade across most major utility markets worldwide. These mechanisms span software bundling, account structure, integration expertise, and regulatory engagement, rewarding vendors who invest ahead of visible demand signals.

Expand Wildfire Risk Modeling Software Services

Vendors that bundle wildfire risk modeling and predictive analytics into distribution equipment contracts capture recurring software revenue streams that pure hardware competitors miss entirely once initial installation is complete. Itron and Schneider Electric have both expanded risk modeling offerings, covering at least 30 percent of forecast resilience-segment revenue through recurring analytics subscriptions rather than one-time equipment sales. This shifts vendor economics toward the higher-margin, stickier revenue profile utilities increasingly prefer for long-term budget planning. Contractors bidding on public utility resilience projects increasingly require documented analytics capability before award, widening the gap between certified competitors.
Market Impact: Covers 30 percent of resilience revenue via analytics

Build Dedicated Distributed Energy Integration Teams

Distributed energy resource integration remains the fastest-growing customer segment yet is often served through generalist distribution sales teams built for traditional grid customers rather than the faster, technically distinct procurement cycles bidirectional voltage regulation projects require. A dedicated account structure converts episodic interconnection projects into standing multi-year framework agreements with better margin retention and forecast visibility. Vendors serving this segment increasingly maintain separate sales organizations entirely, recognizing the distinct technical rhythm distributed energy procurement now requires relative to conventional grid equipment sales cycles. Vendors report roughly 25 percent faster contract closure once dedicated account structures replace generalist sales coverage.
Market Impact: Closes contracts 25 percent faster than generalist teams

Offer Middleware Integration Layers for Legacy Systems

Vendors offering middleware integration layers that bridge legacy distribution management systems with new smart metering and automation platforms capture integration revenue that full-replacement-only competitors miss entirely among utilities unwilling to abandon still-functional existing infrastructure. This addresses a persistent restraint directly, since integration projects otherwise cost an estimated 18 percent more than comparable greenfield builds. Vendors with proven middleware product lines increasingly win preferred status among utilities managing large, heterogeneous multi-decade infrastructure portfolios spanning several prior generations of distribution technology. This approach also builds durable long-term relationships with utilities that eventually pursue full replacement once budget cycles allow.
Market Impact: Directly addresses the 18 percent cost premium here

Pursue Pre-Approved Regulatory Resilience Spending Frameworks

Vendors that help utilities structure pre-approved resilience spending frameworks with regulators can accelerate deployment timelines meaningfully relative to competitors dependent on standard rate case approval cycles that otherwise take twelve to twenty-four months to complete. This positions vendors as strategic partners in the regulatory approval process itself rather than simply equipment suppliers waiting for capital budgets to clear review. Vendors with proven regulatory engagement expertise increasingly win preferred status among utilities managing the largest, most time-sensitive resilience programs. This approach has shortened deployment timelines by roughly 40 percent among the earliest utility adopters pursuing this structure.
Market Impact: Shortens deployment 40 percent for early adopters here

Who Controls the Margin Pool

The top five players hold a combined 24 percent share on a shipment value basis, a wide gap separating global platform vendors with integrated analytics capability from hundreds of point-solution providers serving narrower utility budget categories. Basis of assessment is annual shipment value, held consistently across all companies profiled. This gap has widened as platform integration requirements filter out under-resourced point-solution vendors from the largest tenders.
Current competitive activity centers on three dimensions simultaneously: wildfire risk analytics development racing ahead of expanding resilience budgets, distributed energy integration platform expansion targeting bidirectional voltage regulation, and middleware integration positioning as utilities navigate increasingly complex legacy system modernization across multiple regional service territories. Several vendors are also piloting AI-assisted outage prediction to reduce restoration time on complex weather-related distribution events.

Emerging pressure is coming from Chinese domestic manufacturers scaling rapidly on price within their home market and increasingly bidding on international grid modernization projects, compressing margins for global majors in price-sensitive emerging market tenders. Rankings could shift as vendors pursuing pre-approved regulatory frameworks begin capturing share previously reserved for the largest five providers. Global majors are responding by expanding local manufacturing partnerships to compete on price in these emerging markets.
electric-distribution-utility-market-company-positioning-matrix-1788413164032

Competitive Moat and Risk Dimensions

ITRON

Moat: Integrated Analytics Platform Depth

Itron holds deep expertise combining smart metering hardware with grid analytics software, giving it credibility with utilities evaluating long-term data platform roadmaps rather than near-term unit pricing alone across competing vendor proposals. This depth of integration matters enormously to utilities planning multi-decade infrastructure investments that must remain interoperable across future technology generations and vendor upgrades.
ITRON

Risk: Legacy Hardware Margin Pressure

Itron's traditional metering hardware business faces margin pressure from lower-cost regional competitors, particularly in price-sensitive emerging market tenders where utilities prioritize upfront capital cost over long-term analytics platform value. Itron has responded by expanding its analytics platform business to offset margin pressure in its traditional hardware segment.
LANDIS+GYR

Moat: Global AMI Deployment Track Record

Landis+Gyr holds among the industry's most extensive global advanced metering infrastructure deployment track records, giving it a meaningful advantage bidding on the largest utility modernization programs requiring proven at-scale deployment experience across diverse regulatory environments. This deployment credibility increasingly translates into multi-year framework agreements with utilities that prioritize execution risk reduction over marginal upfront cost differences.
LANDIS+GYR

Risk: Currency and Regional Concentration Risk

Landis+Gyr's global footprint exposes it to currency volatility and regional demand concentration risk that more geographically focused competitors avoid, potentially compressing margins relative to vendors serving fewer, more predictable regulatory jurisdictions simultaneously. Landis+Gyr has responded by expanding regional manufacturing partnerships to reduce its currency and supply chain exposure over time.

Players Tracked

Prominent Players

Itron
Landis+Gyr
Schneider Electric
Oracle Utilities
Trilliant Networks

Other Key Players

Aclara Technologies
Sensus by Xylem
Honeywell Smart Energy
Kamstrup
EDMI
Wasion Group
Diehl Metering
Elster Group
Mueller Systems
Badger Meter
AutoGrid Systems
Uplight
Enel X
S&C Electric Company
Eaton

Recent Developments

FEBRUARY 2026

Itron Launches Wildfire Risk Analytics Platform

Itron launched an integrated wildfire risk analytics platform combining grid-edge sensor data with predictive modeling, targeting utilities across wildfire-exposed jurisdictions seeking documented risk mitigation capability for upcoming regulatory rate case filings. The platform helps utilities document risk mitigation investments for regulators evaluating resilience-related rate case requests across multiple jurisdictions.
Signal: Signals accelerating vendor investment in resilience analytics ahead of expanding utility budget allocation across wildfire-exposed jurisdictions
OCTOBER 2025

Landis+Gyr Acquires Distributed Energy Software Firm

Landis+Gyr acquired a specialized distributed energy resource management software developer to strengthen its bidirectional voltage regulation capability, extending its offering without the multi-year cost of building comparable capability entirely in-house. The acquisition strengthens Landis+Gyr's position bidding on the largest distributed energy integration programs across North America and Europe.
Signal: Reflects growing vendor preference for acquisition over organic technology development across regulated global markets across simultaneous markets
JUNE 2025

Schneider Electric Signs Middleware Integration Agreement

Schneider Electric entered a middleware integration partnership with a legacy systems specialist to accelerate compatibility between new smart grid platforms and utility distribution management systems built on incompatible decades-old architectures. The agreement addresses a persistent concern about legacy system compatibility that has slowed platform adoption among cautious operators.
Signal: Indicates growing vendor focus on legacy integration solutions ahead of utility modernization deadlines broadly among cautious utility operators

Semiconductor and Copper Component Exposure

Semiconductor components for smart meters and copper conductor for distribution infrastructure together represent roughly 31 percent of total cost of goods sold for grid equipment vendors, sourced through global supply chains concentrated in a small number of advanced fabrication and copper refining facilities. Circuit board assembly and enclosure materials round out the remainder, at smaller cost proportions relative to core semiconductor and copper content.
Semiconductor supply disruption during 2021 and 2022 extended smart meter component lead times by more than five months in some cases, according to IEA industrial supply chain reporting, forcing several vendors to redesign products around more widely available chip families mid-development cycle to maintain delivery commitments. Vendors without diversified supplier relationships bore the brunt of these extended lead times directly, damaging customer trust during a critical modernization period.

This exposure disadvantages smaller regional vendors lacking direct semiconductor supplier relationships far more than global majors with dedicated procurement teams and long-term chip allocation agreements, since smaller firms typically source through distributors and absorb allocation shortages directly into extended customer delivery timelines rather than negotiated priority access. MMA's primary survey of vendor respondents confirms this pattern held consistently across every region tracked during the disruption period.
electric-distribution-utility-market-cost-volatility-analysis-1788413164241

Multi-Source Semiconductor Procurement Strategy

Vendors qualify components from multiple semiconductor suppliers rather than relying on a single source, reducing exposure to localized fabrication disruptions and improving negotiating leverage during periods of tight allocation across the industry. This approach is increasingly standard among vendors serving the largest, most demanding utility framework agreements. This diversification also reduces single-point-of-failure risk across the broader supply base.

Direct Long-Term Chip Allocation Agreements

Larger vendors increasingly negotiate direct long-term allocation agreements with semiconductor fabricators, securing priority access during shortage periods that smaller competitors sourcing through distributors typically cannot obtain, formalizing this into a treasury function. Smaller vendors without comparable purchasing scale remain persistently disadvantaged during shortage cycles. This capital-intensive approach favors the largest vendors with sufficient purchasing scale.

Copper Recycling and Forward Contracting

Vendors increasingly source recycled copper alongside forward-contracted virgin material, smoothing input costs across budget cycles while reducing exposure to primary copper market volatility that has affected conductor pricing repeatedly. This flexibility increasingly differentiates vendors during periods of acute raw material scarcity across the broader industry. Vendors report meaningfully more stable margins after adopting this dual-sourcing approach.

Portfolio Architecture for Margin Defence

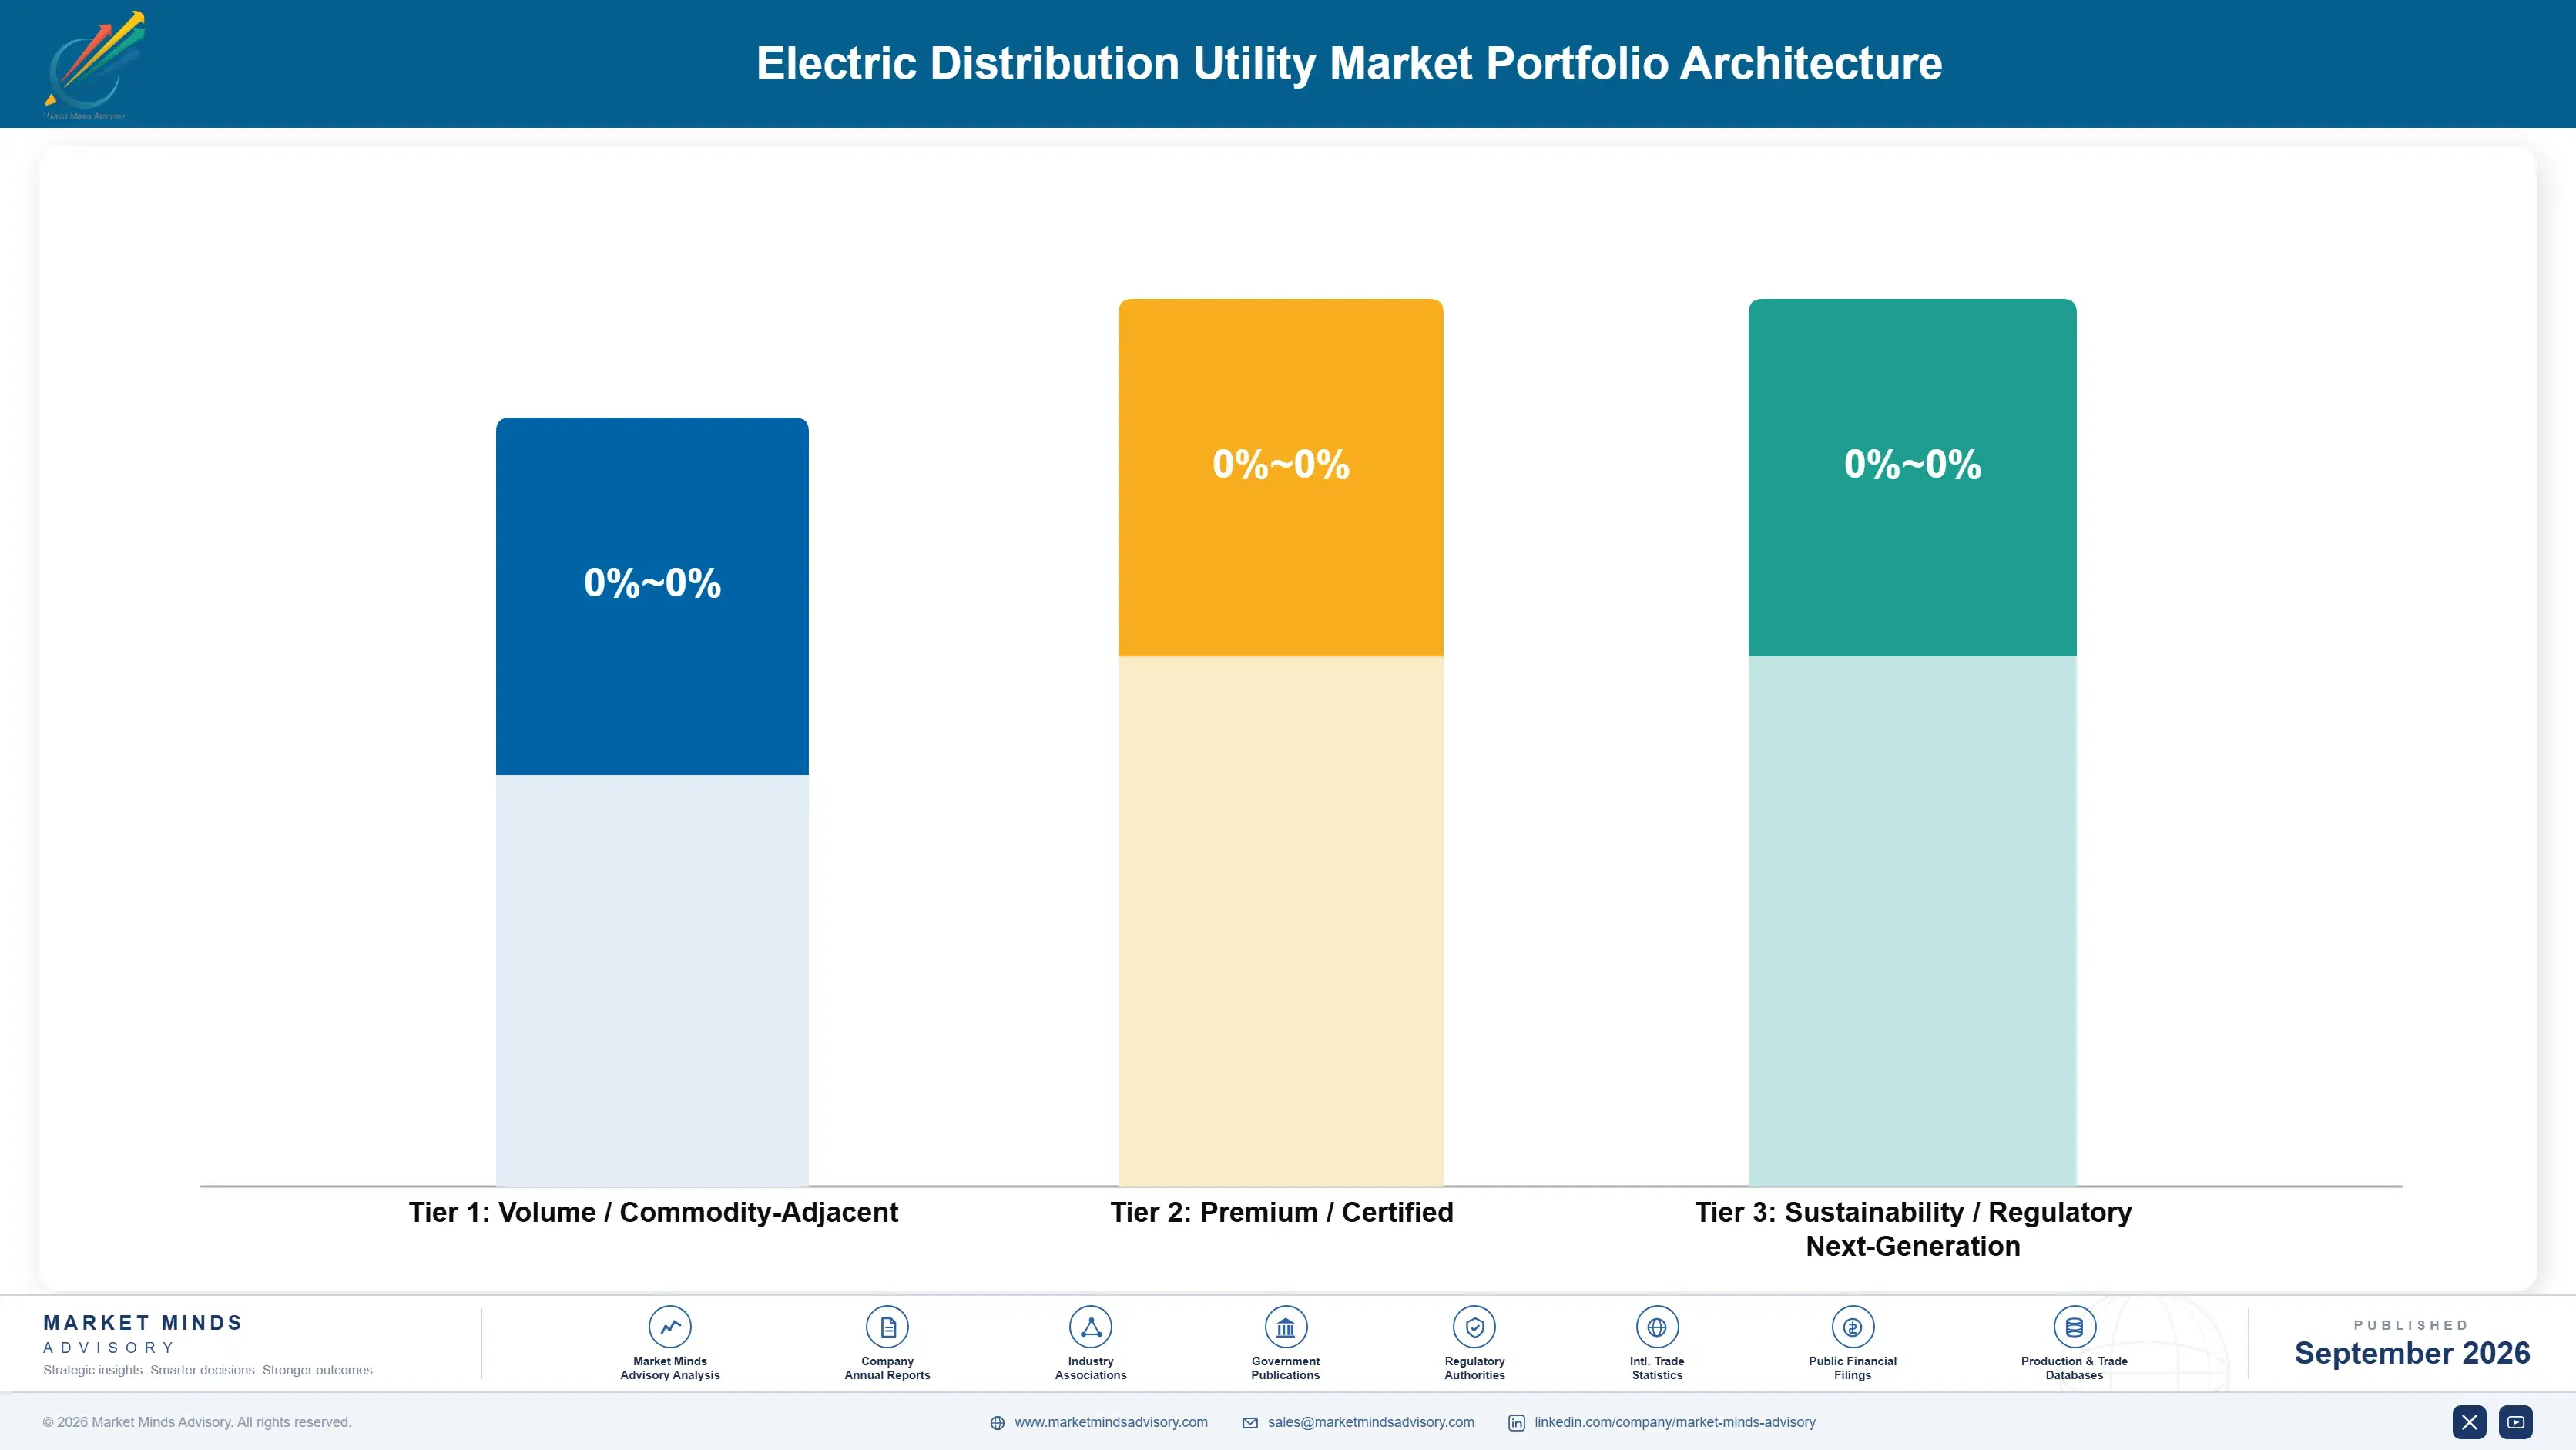
Portfolio economics split across three tiers: volume-commodity-adjacent conventional metering and distribution equipment competing mainly on price, premium certified smart grid platforms serving utilities requiring integrated data analytics, and next-generation resilience and distributed energy integration systems capturing customers focused on liability reduction and grid flexibility. Vendors with diversified portfolios weather procurement cycles better than single-tier specialists. Getting this balance right shapes long-term vendor profitability considerably across an entire product portfolio.
Volume tension is real: smaller utilities on constrained capital budgets default to conventional equipment meeting minimum functional requirements, while larger utilities managing brand and liability risk increasingly specify integrated smart platforms regardless of marginal cost differences. Vendors leaning too heavily into commodity volume risk ceding the fastest-growing premium tenders to better-equipped, certified competitors. Getting this balance right separates the most profitable vendors from those merely chasing volume.

High-value margin pools concentrate in wildfire risk analytics and distributed energy integration software, where subscription pricing and technical differentiation both support meaningfully wider margins than standard equipment sales agreements. Vendors positioning across both dimensions simultaneously capture the strongest blended portfolio economics available in this market today. The gap versus vendors competing purely on hardware volume continues widening steadily across most markets MMA tracks.

Volume / Commodity-Adjacent

Conventional metering and distribution equipment meeting minimum functional requirements, sold primarily on price into cost-constrained utility tenders. Manufacturing utilization here mainly serves fixed cost recovery rather than driving margin expansion.
Gross Margin: 14 to 20%

Premium / Certified

Fully integrated smart grid platforms meeting the strictest utility data analytics and interoperability standards, commanding tender premiums tied to documented performance credentials. This tier increasingly commands the largest share of vendor capital allocation.
Gross Margin: 24 to 32%

Sustainability / Regulatory / Next-Generation

Wildfire risk analytics and distributed energy integration software generating high-margin recurring revenue independent of individual equipment sale cycles. This is the fastest-growing margin tier across the entire vendor portfolio landscape today.
Gross Margin: 32 to 40%
electric-distribution-utility-market-portfolio-architecture-1788413164770

High-value Sub-segments and Strategic Watch-out

Grid Resilience and Undergrounding Services

The clearest high-value high-growth pocket in this market, combining premium tender pricing with the fastest segment CAGR tracked, as regulators increasingly treat resilience spending as standard rather than a discretionary option. Capital allocation here should continue rising through the forecast period. Priority allocation continues expanding steadily.
Gross Margin: 30 to 38%

Distributed Energy Integration Software

A high-value moderate-growth pool where subscription analytics revenue commands strong margins even as new equipment sale growth moderates across already well-served core utility markets. Vendors with established integration platforms hold a durable edge. Utility customers increasingly favor bundled analytics contracts over standalone equipment procurement alone.
Gross Margin: 32 to 40%

Standard Smart Metering Infrastructure

The volume core of this market, providing steady multi-year replacement revenue at thinner margins that fund manufacturing utilization without materially expanding overall profitability across cycles. Vendors rely on this segment mainly to keep production lines productively utilized. Margins here rarely exceed the high teens even in favorable pricing years.
Gross Margin: 14 to 20%

Legacy Manual Metering Formats

A strategic watch-out segment losing share to smart alternatives as replacement cycles mature, forcing vendors still dependent on this format to plan technology transition before contracts lapse entirely. Early transition planning reduces stranded manufacturing capacity risk considerably. Revenue pressure here should build steadily through the forecast period.
Gross Margin: 8 to 13%

Recurring Platform Cycles Sustain Vendor Revenue

Distribution utility spending increasingly behaves like an annuity tied to firmware update cycles and analytics subscriptions rather than a single equipment purchase, since every deployed platform requires ongoing software support for its operational lifetime. Vendors that secure the initial platform sale capture recurring service revenue across multi-decade infrastructure lifespans, and regulatory rate case cycles add a predictable secondary revenue layer tied to evolving resilience mandates.
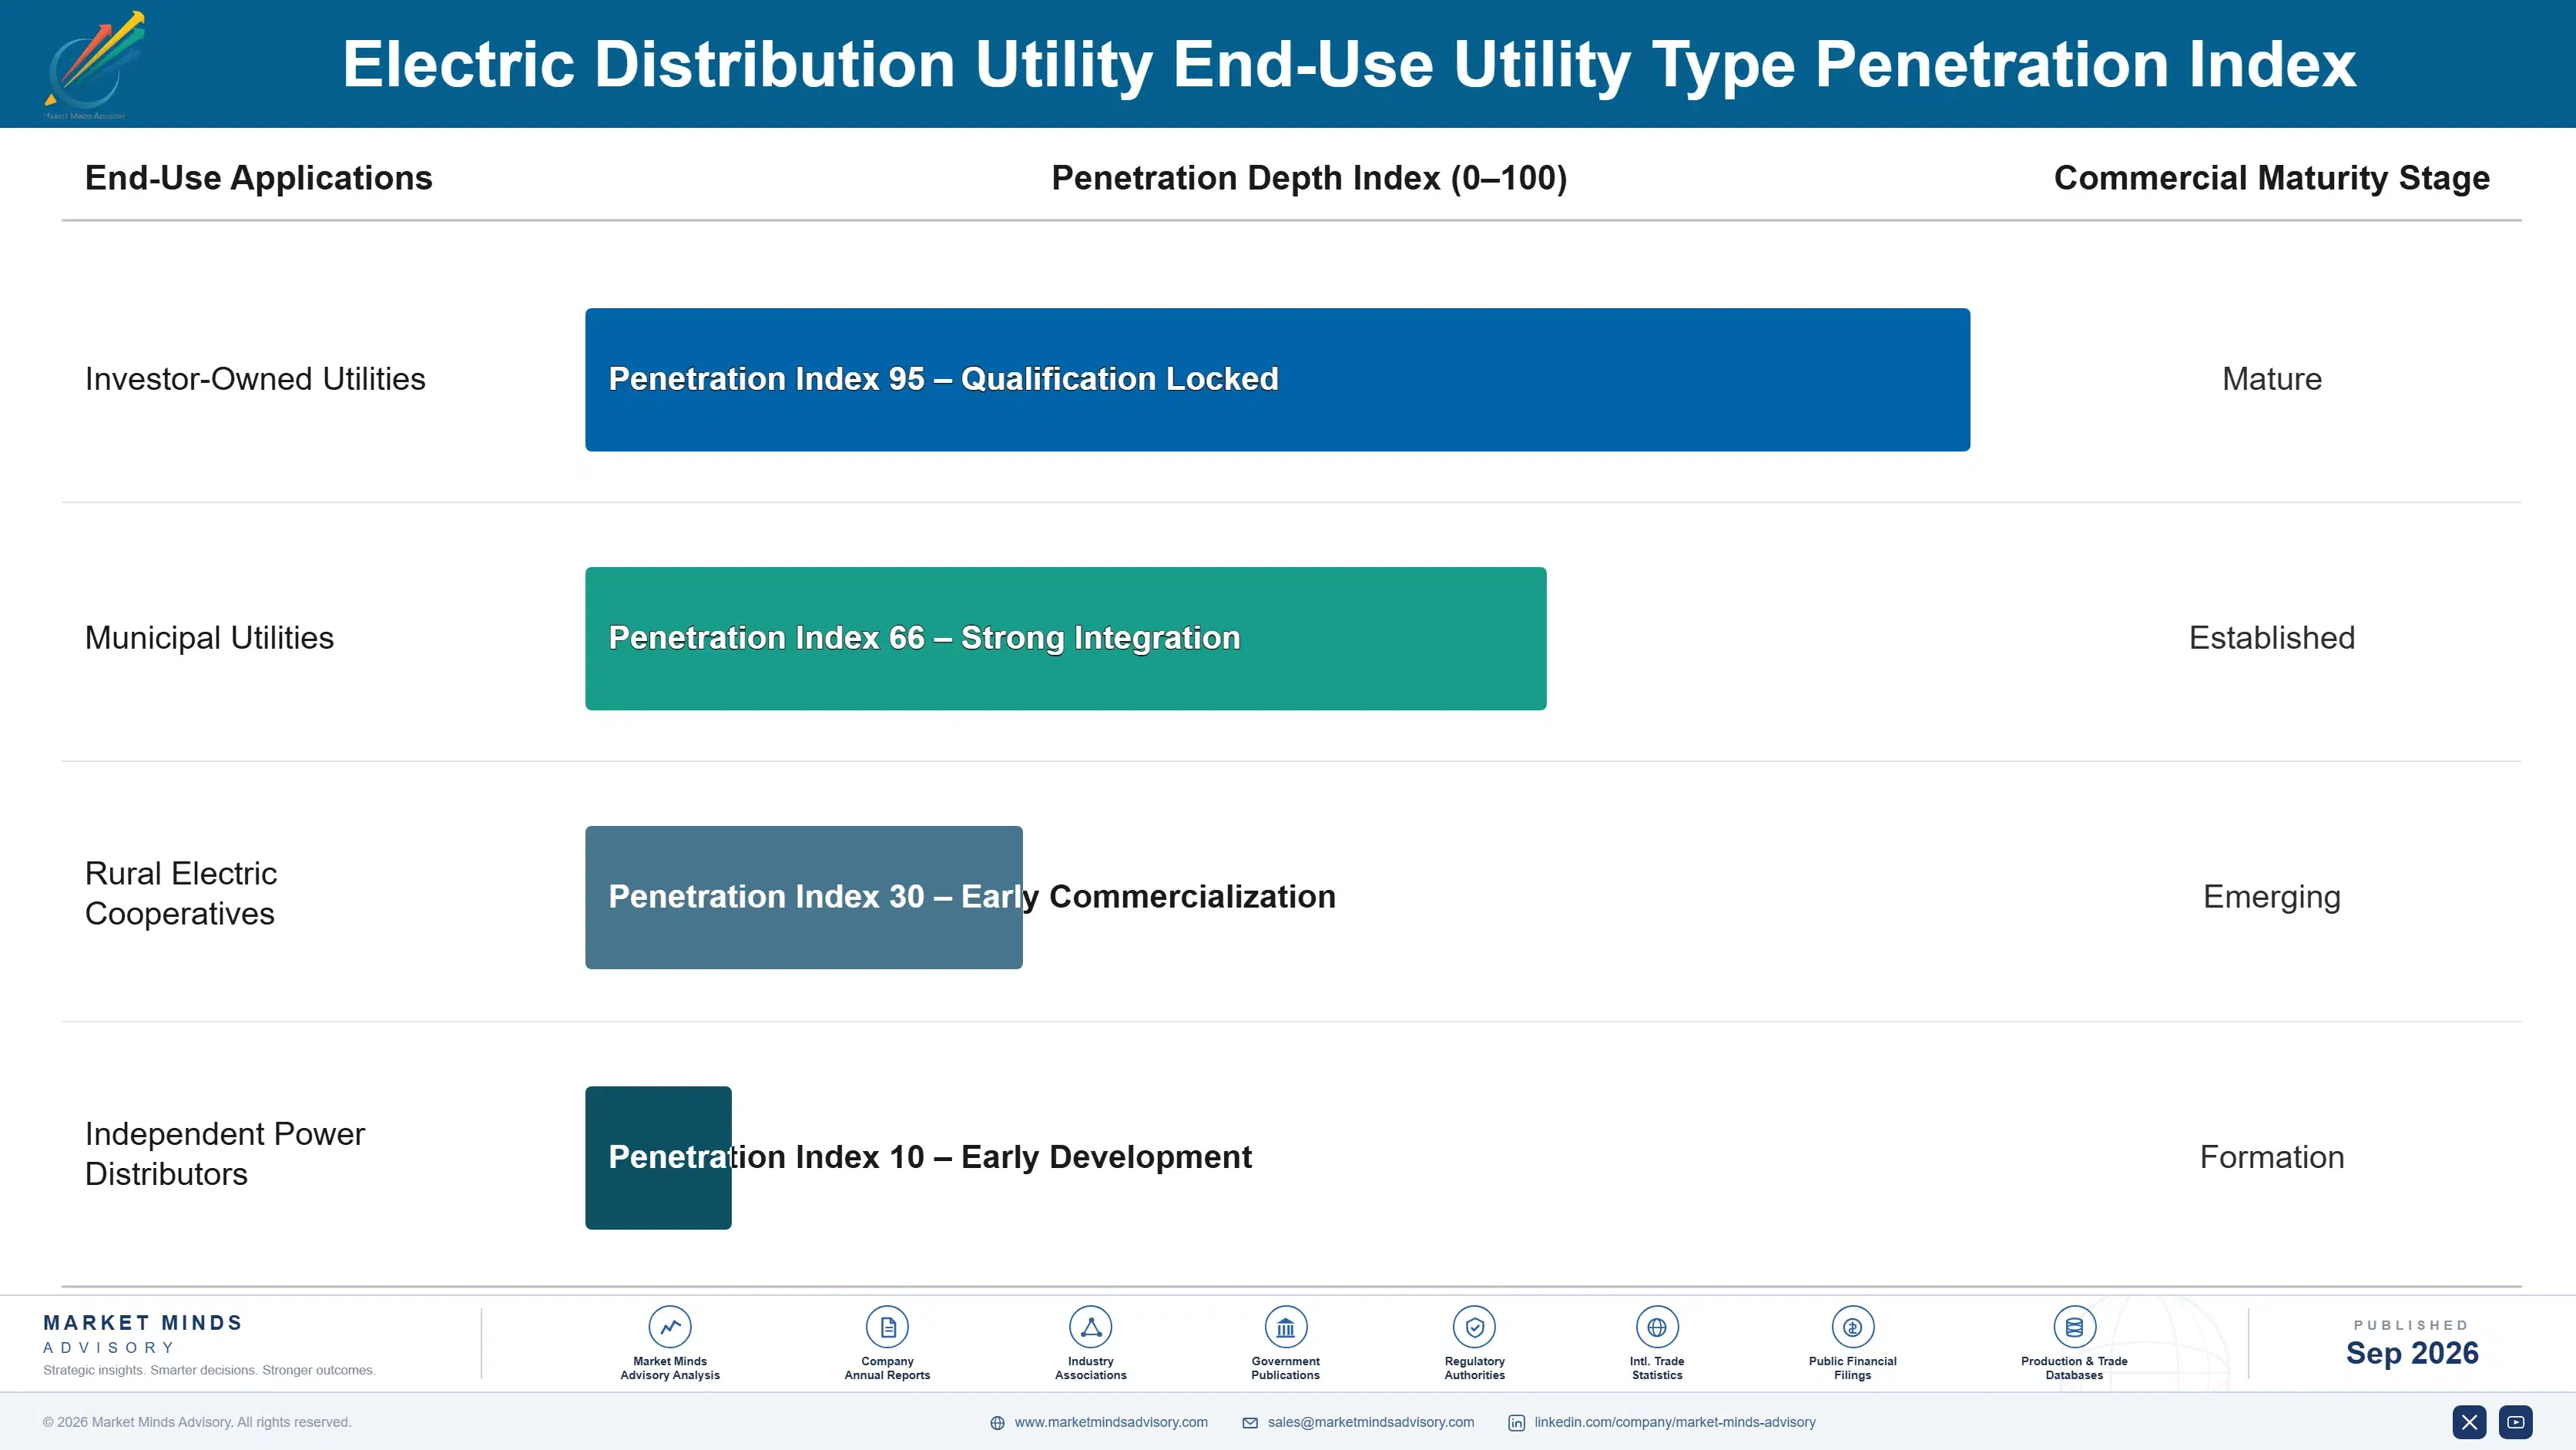
Investor-owned utilities show the highest adoption stickiness, since multi-decade infrastructure lifespans and regulatory approval requirements rarely favor switching vendors mid-portfolio once initial platform selection clears procurement vetting. Municipal and cooperative utilities show markedly different adoption patterns, favoring cost predictability and simpler procurement processes over long-term vendor relationship depth. Larger utilities show intermediate stickiness, balancing scale advantages against internal capability building.

Procurement authority is shifting from individual utility engineering departments toward centralized digital infrastructure teams that increasingly negotiate multi-year framework agreements directly with vendors rather than approving equipment purchases project by project. Younger utility engineers increasingly favor vendors offering transparent digital procurement portals and remote diagnostics over relationship-based field sales calls. This shift rewards vendors that invest in digital-first sales infrastructure over those relying purely on legacy relationship-based distribution channels across most utility segments.
electric-distribution-utility-market-end-use-penetration-index-1788413165275

Where MMA Sees the Opportunity

These are among the four positions where our research anticipates prominent divergence between winners and laggards over the coming forecast period. Each is grounded in the demand model, the regulatory perimeter, and the announced capacity pipeline.
01 / WILDFIRE RISK ANALYTICS INVESTMENT

Expand analytics platforms ahead of tightening resilience mandates

Roughly 22 percent of capital budgets in the most wildfire-exposed jurisdictions already flow toward resilience spending, and vendors offering integrated risk analytics capture premium positioning as utilities document mitigation investment for regulators evaluating rate case requests. Itron and Schneider Electric have both expanded risk modeling offerings, positioning themselves ahead of competitors still selling equipment without integrated analytics support. Vendors that delay this investment risk losing the largest resilience-linked contracts to better-positioned, analytics-capable competitors within a few short years as enforcement tightens.
02 / DISTRIBUTED ENERGY CHANNEL DEVELOPMENT

Build dedicated integration teams ahead of demand acceleration

Distributed energy resource integration is the fastest-adjacent-growing segment in this market, and vendors serving this channel through generalist utility sales teams are already losing deals to competitors with dedicated account structures built for faster, more technical procurement cycles. This segment rewards specialized voltage regulation expertise far more than the relationship-based selling that dominates traditional equipment accounts. Vendors that build this capability now capture disproportionate share of a rapidly compounding revenue opportunity before competitors catch up on account structure and technical depth.
03 / LEGACY SYSTEM INTEGRATION SERVICES

Offer middleware gateways to capture legacy retrofit demand

Integration projects cost an estimated 18 percent more than comparable greenfield builds, largely because bridging new platforms into legacy distribution management environments requires custom engineering work that full-replacement-only vendors cannot easily address. Vendors offering middleware integration layers capture this revenue directly, addressing a persistent restraint that otherwise concentrates share among vendors offering full replacement only. This approach also builds durable long-term relationships with utilities that eventually pursue complete replacement once budget cycles allow it, extending vendor engagement considerably beyond the initial gateway sale.
04 / REGULATORY FRAMEWORK PARTNERSHIP

Help utilities structure pre-approved resilience spending frameworks

Standard rate case approval cycles take twelve to twenty-four months to complete, meaningfully slowing deployment relative to the pace at which weather-related risks are actually emerging on the ground across most affected utility service territories. Vendors that help utilities structure pre-approved resilience spending frameworks position themselves as strategic partners in the regulatory process itself rather than simply equipment suppliers waiting on budget approval. This approach has shortened deployment timelines by roughly 40 percent among the earliest utility adopters pursuing this structure.

Engagement Snapshot From the Field

A live engagement with an industry participant carrying material or product regulatory and market exposure ahead of a defining policy shift, showing how our research translates into a defensible multi-year portfolio strategy.
MARKET MINDS ADVISORY · CLIENT ENGAGEMENT SUMMARY
Electric Distribution Utility Producer Strategic Portfolio Review and Transition Roadmap 2026·Investment Scenario on Electric Distribution Utility Exposure Evaluation 2025-26
CLIENT PROFILE
The client is a mid-sized investor-owned utility serving roughly two million customers across a wildfire-exposed western service territory, facing mounting regulatory pressure and liability exposure following several major weather-related outage events across its distribution network over the prior three years. Leadership was evaluating whether to pursue accelerated hardening immediately or phase investment across several rate case cycles instead given budget constraints.
STRATEGIC CHALLENGE
Rising wildfire liability exposure and an aging distribution network were straining the utility's capital planning process, while its existing rate case filing lacked a clear framework for prioritizing which circuits to harden first given limited annual resilience budget available for infrastructure investment. Board leadership needed a defensible multi-year investment plan before committing further capital toward broader resilience infrastructure upgrades across the service territory.
MMA APPROACH
MMA conducted a vendor landscape assessment benchmarking five platform providers on wildfire risk analytics depth and integration capability, modeled a phased hardening roadmap prioritizing circuits tied to the highest ignition risk scores, and evaluated regulatory framework options against comparable utility precedents. Findings were validated against three years of historical outage and ignition risk incident data across the utility's service territory.
KEY FINDINGS
  1. Prioritizing hardening at circuits tied to the highest ignition risk scores could reduce weather-related outage exposure by roughly 30 percent within three years.
  2. Two of five benchmarked vendors already held wildfire risk analytics credentials sufficient for the utility's regulatory jurisdiction, meaningfully narrowing the qualified vendor shortlist.
  3. Pre-approved resilience spending frameworks used by comparable utilities in similar jurisdictions shortened deployment timelines considerably relative to standard rate case approval cycles.
  4. Circuits with the highest ignition risk scores represented a disproportionately small share of total network mileage, concentrating the priority investment case. within the network mileage.
CLIENT PROFILE
The client is a mid-sized investor-owned utility serving roughly two million customers across a wildfire-exposed western service territory, facing mounting regulatory pressure and liability exposure following several major weather-related outage events across its distribution network over the prior three years. Leadership was evaluating whether to pursue accelerated hardening immediately or phase investment across several rate case cycles instead given budget constraints.
STRATEGIC CHALLENGE
Rising wildfire liability exposure and an aging distribution network were straining the utility's capital planning process, while its existing rate case filing lacked a clear framework for prioritizing which circuits to harden first given limited annual resilience budget available for infrastructure investment. Board leadership needed a defensible multi-year investment plan before committing further capital toward broader resilience infrastructure upgrades across the service territory.
MMA APPROACH
MMA conducted a vendor landscape assessment benchmarking five platform providers on wildfire risk analytics depth and integration capability, modeled a phased hardening roadmap prioritizing circuits tied to the highest ignition risk scores, and evaluated regulatory framework options against comparable utility precedents. Findings were validated against three years of historical outage and ignition risk incident data across the utility's service territory.
KEY FINDINGS
  1. Prioritizing hardening at circuits tied to the highest ignition risk scores could reduce weather-related outage exposure by roughly 30 percent within three years.
  2. Two of five benchmarked vendors already held wildfire risk analytics credentials sufficient for the utility's regulatory jurisdiction, meaningfully narrowing the qualified vendor shortlist.
  3. Pre-approved resilience spending frameworks used by comparable utilities in similar jurisdictions shortened deployment timelines considerably relative to standard rate case approval cycles.
  4. Circuits with the highest ignition risk scores represented a disproportionately small share of total network mileage, concentrating the priority investment case. within the network mileage.
RECOMMENDED STRATEGY
Phase 1: Phase 1 (near-term): harden circuits tied to the highest ignition risk scores first, within eighteen months. with dedicated engineering support throughout. Phase 2: Phase 2 (medium-term): pursue a pre-approved resilience spending framework modeled on comparable utility precedents. with dedicated regulatory counsel engagement throughout. Phase 3: Phase 3 (longer-term): expand hardening to remaining circuits as capital budgets allow over five years. with annual progress reviews scheduled.
OUTCOME
Within two years of implementation, the utility reported (client-reported, unverified by MMA) meaningfully reduced weather-related outage claims and faster regulatory approval for subsequent resilience spending requests, attributing the gains directly to the phased hardening roadmap and regulatory framework MMA developed. Utility leadership has since expanded the roadmap to additional circuits under consideration for future phases.

Frequently Asked Questions

Foundational context covering the market sizes, CAGR, scope, country, region and competition that inform every finding below. This section is provided to cover basics and most often pre-purchase conversations, answered from the MMA Primary Research Dataset.

What is the current size of the Electric Distribution Utility Market?

The electric distribution utility market reached an estimated $95.0 billion in global value in 2025, driven by wildfire liability exposure and expanding grid modernization spending worldwide.

How large will the Electric Distribution Utility Market be by 2036?

MMA projects the market will reach approximately $149.3 billion by 2036, driven by continued resilience investment and distributed energy resource integration across every major regional market.

What is the CAGR for the Electric Distribution Utility Market 2026 to 2036?

The market is forecast to grow at a 4.2 percent compound annual growth rate between 2026 and 2036, with bull and bear scenarios ranging from 3.0 to 5.4 percent.

Which segment is growing fastest?

Grid resilience and undergrounding services lead segment growth at a 7.5 percent CAGR, roughly 1.8 times the overall market rate, as wildfire liability exposure accelerates investment.

Who are the major companies in the Electric Distribution Utility Market?

Itron, Landis+Gyr, Schneider Electric, Oracle Utilities, and Trilliant Networks lead the market, together holding an estimated 24 percent combined share on a shipment value basis.

Which country is growing fastest?

The United States is growing fastest at a 5.5 percent CAGR, driven by aggressive wildfire liability exposure and sustained grid resilience investment across its largest utility service territories.

Report Segmentation Architecture

The full report scope spans multiple orthogonal segmentation dimensions, with cross-tabulated demand data provided for each dimension pair. Coverage extends further to regional breakdowns, trend trajectories, and the competitive detail needed to support segment-level decision-making.

By Infrastructure and Service Type

  • Distribution Transformers and Substations
  • Smart Metering and AMI Infrastructure
  • Distribution Automation and Grid Software
  • Grid Resilience and Undergrounding Services
  • Distributed Energy Resource Integration Services
  • Outage Management and Restoration Systems

By End-Use Utility Type

  • Investor-Owned Utilities
  • Municipal Utilities
  • Rural Electric Cooperatives
  • Independent Power Distributors

By Commercial Dimension

  • Direct Utility Procurement
  • System Integrator Channel Sales
  • Recurring Software and Analytics Contracts
  • Government and Regulated Utility Tenders

By Region

  • North America
  • Western Europe
  • East Asia
  • South Asia and Pacific
  • Latin America
  • Middle East and Africa
  • Eastern Europe

Scope, Methodology, and Coverage

Every figure in this report is reproducible from documented input assumptions. The scope below maps the historical period, the forecast horizon, the segmentation dimensions, and the countries covered, alongside the underlying primary and qualitative methodology.
Historical Period
2020 to 2025
Forecast Period
2026 to 2036
Base Year
2025 (USD billions; MMA Primary Research Dataset, September 2026)
Market Definition
This market covers equipment, software, and services procured by electric distribution utilities for grid modernization, including smart metering infrastructure, distribution automation, outage management systems, undergrounding and resilience services, and distributed energy resource integration platforms. It excludes transmission-level infrastructure, generation assets, and retail electricity supply contracts sold independent of grid infrastructure spending.
Quantitative Units
USD billions (current prices); unit and infrastructure deployment volume where applicable
Segmentation Dimensions
By Infrastructure and Service Type; By End-Use Utility Type; By Commercial Dimension; By Region
Regions Covered
North America, Western Europe, East Asia, South Asia and Pacific, Latin America, Middle East and Africa, Eastern Europe
Countries Covered
USA, China, Germany, France, UK, Japan, South Korea, India, Australia, Canada, Brazil, Mexico, Indonesia, Vietnam, Thailand, Malaysia, UAE, Saudi Arabia, South Africa, Nigeria, Turkey, Poland, Netherlands, Italy, Spain, Sweden, Switzerland, Argentina, Colombia, Singapore, and additional markets relevant to this sector
Key Companies Profiled
Itron, Landis+Gyr, Schneider Electric, Oracle Utilities, Trilliant Networks, Aclara Technologies, Sensus by Xylem, Honeywell Smart Energy, Kamstrup, EDMI, Wasion Group, Diehl Metering, Elster Group, Mueller Systems, Badger Meter, AutoGrid Systems, Uplight, Enel X, S&C Electric Company, Eaton
Quantitative Methodology
Primary survey, n=3,800 respondents, Q4 2025, six countries; demand-side model with trade association cross-validation
Qualitative Methodology
47 expert interviews, Q4 2025; applied to validate demand model assumptions, identify emerging dynamics, and assess competitive positioning
Report Format
PDF and XLSX data workbook (Word format preview document)
Publisher
Market Minds Advisory
Report Code
MMA-2026-ENE-733
Published
September 2026
Contact
sales@marketmindsadvisory.com | www.marketmindsadvisory.com

Purchase the full Electric Distribution Utility Market Report (2026 to 2036).

This report provides a comprehensive assessment of the electric distribution utility market, covering demand drivers across smart metering, resilience, and distributed energy integration segments through 2036. It includes detailed competitive benchmarking of twenty leading platform vendors evaluated on a shipment value basis. Regional demand architecture is mapped across all seven global regions, with particular depth on North American and East Asian dynamics. Semiconductor input cost exposure and regulatory strategy are analyzed alongside revenue lever prioritization for vendors navigating this transition. The report is designed for grid modernization executives, utility procurement leaders, and regulatory affairs teams evaluating vendor positioning.
Ten-year global market sizing and forecast
Seven-region global regional demand architecture breakdown
Twenty-company detailed competitive benchmarking and profiling
Semiconductor input cost exposure and hedging modeling
Revenue lever prioritization and margin framework
Anonymized investor-owned utility resilience case study

Built For The People Who Decide

From boardroom strategy to bench-side execution, this report is read cover-to-cover by leaders shaping the next decade of their industry, turning demand scenarios, market dynamics and valuation benchmarks into decisions.
CXOs/ Presidents/ VPs/ Managers
M&A and Corporate Development
Strategy Teams and R&D Heads
Procurement and Product Directors
Regulatory and Compliance Leaders
Investor Relations and Equity Analysts