Market Minds Advisory
Electric Boats Market

Electric Boats Market: Ferry Mandates, Shore Charging Grid Constraints, and Two Markets Sharing One Name

Commercial ferries are bought on operating cost and increasingly mandated outright, while recreational boats run forty-two hours a year and must be sold on silence rather than on any economic case.

Lead Analyst

David Horsley

Published

September 2026

Make Smarter Decisions with Customized Research Insights

Request a free sample report and evaluate market opportunities, growth trends, and competitive dynamics relevant to your business needs.

2025 MARKET VALUE$6.4BMarket Size 2025
2036 FORECAST VALUE$23.1BBase Case , 2026 to 2036
CAGR 2026 TO 203612.4 %Bull 13.7% / Bear 11.2%
INCREMENTAL OPPORTUNITY$16.0BNet 10- year value creation
EXPANSION MULTIPLE3.22x2036 value over 2026 base
Strategic Levers
M&A Pipeline
Regional Outlook
Country Rankings
Competitive Intelligence
Segmental Deep-dive
Call-Us : 91 93563 13602

Executive Snapshot and Market Trajectory

Two entirely different businesses share this market's name. Passenger ferries run continuously on fixed routes and are increasingly required by law to be emission free, while recreational boats operate about forty-two hours a year and save their owners almost nothing on fuel. Selling both from one organisation is genuinely difficult.
Commercial power sits with builders who can deliver a charging solution alongside the vessel rather than with anyone able to install batteries in a hull. Hydrofoiling craft grow fastest at 24.6%, roughly 1.98 times the market, because lifting the hull clear of the water cuts energy consumption enough to make range genuinely workable. Western Europe holds 26% of global value, led by Norwegian ferry electrification.
Concentration is very low at roughly 22% for the top five, since boat building is fragmented everywhere and electric propulsion has attracted specialist entrants rather than consolidation. Ferry programmes supply 31% of value. Shore charging grid connections frequently cost more than the vessels and sit on the critical path. Grid works routinely arrive later than the vessels they are meant to charge, which has become the most common failure mode in these programmes.
Market Definition
The market comprises battery-electric and hybrid-electric watercraft, covering electric recreational day boats, small craft with electric outboards, electric and hybrid passenger ferries, commercial workboats and tenders, and hydrofoiling electric craft. Value is measured at builder level including integrated propulsion and battery systems. Standalone outboard motors sold separately, large ocean-going merchant vessels, submarines and naval craft, marine batteries sold as components, and shore charging infrastructure fall outside scope.
Base Year Value
$6.4B in 2025 (MMA Primary Research Dataset, August 2026)
Forecast Period
2026 to 2036, eleven discrete annual values
CAGR
12.4% base case. Bull 13.7%. Bear 11.2%.
Fastest Growth Segment
Hydrofoiling Electric Craft: 24.6% CAGR
Fastest Growth Country
India: 15.8% CAGR
Fastest Growth Region
South Asia and Pacific: 14.6% CAGR
Largest Region
Western Europe: 26% of 2025 global value
Market Leaders
Torqeedo, Vision Marine Technologies, Candela, X Shore, and Brunswick Corporation lead on electric vessel and propulsion revenue. Source: company annual reports and MMA Analysis, July 2026.
Primary Survey
n=3,800 procurement and R&D decision-makers, Q4 2025, six countries
Methodology
Demand-side build-up, cross-validated against public data, 47 expert interviews

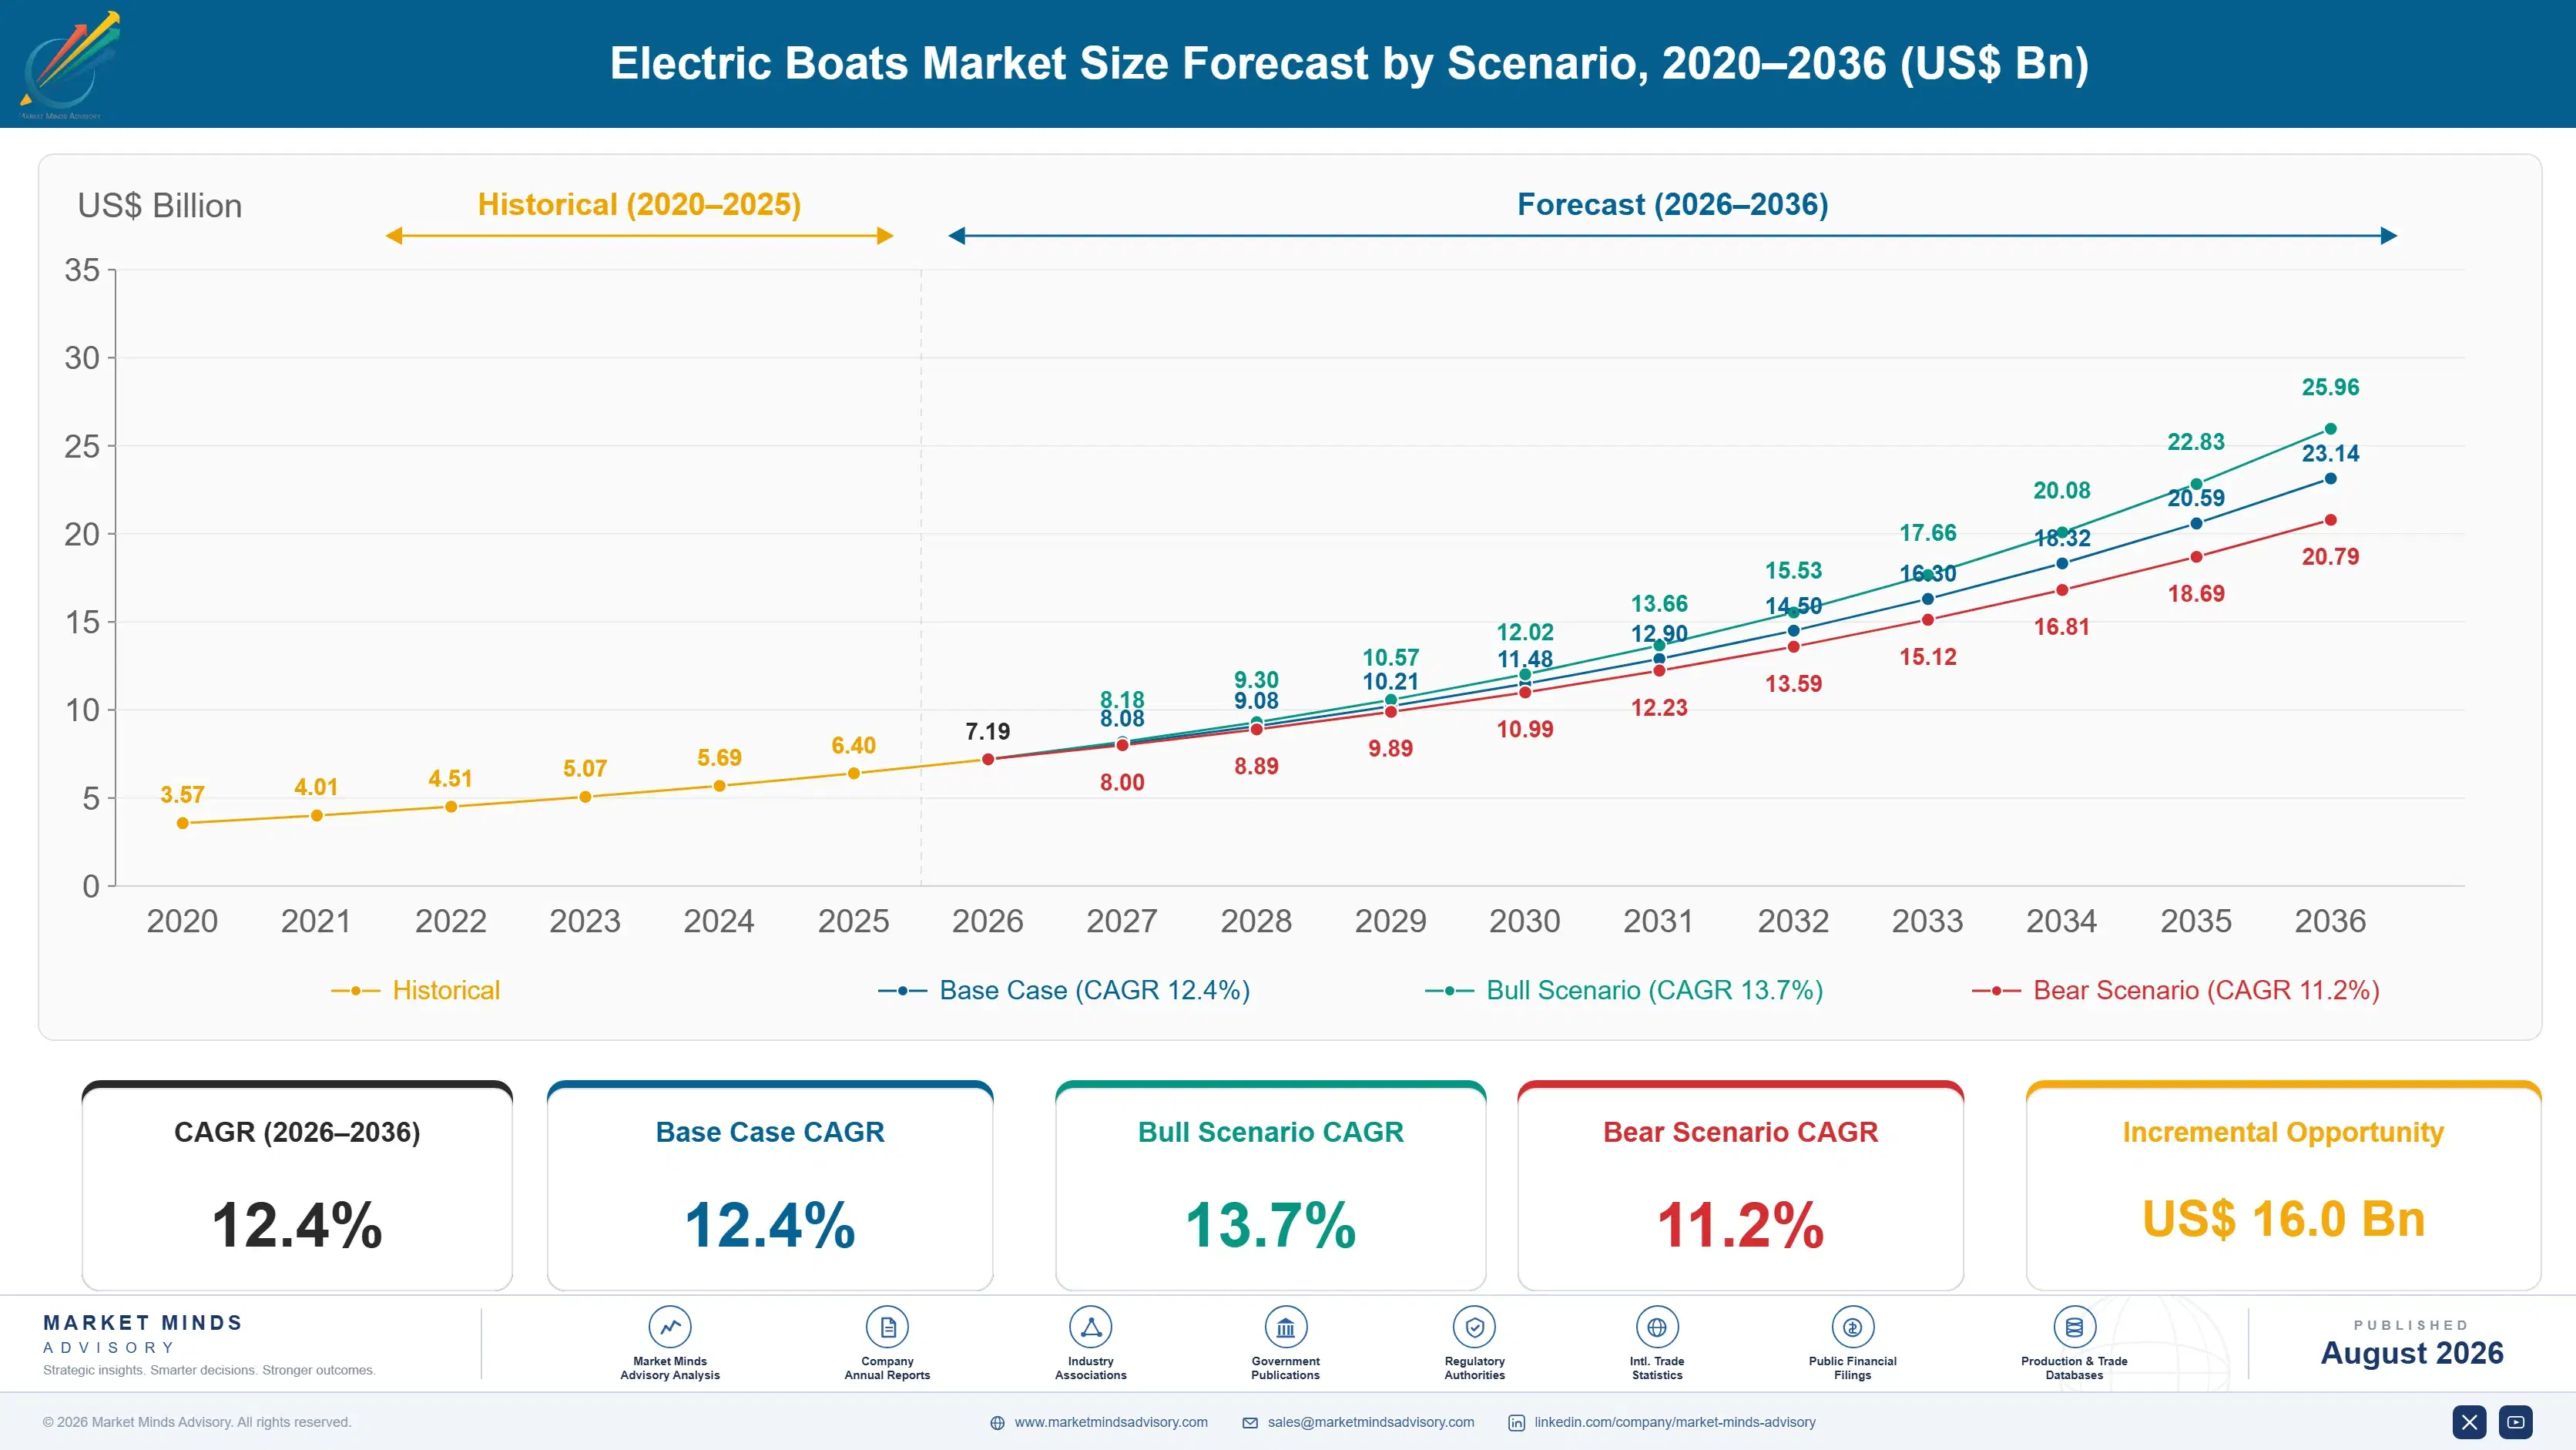
Electric Boats Market Forecast Scenarios

electric-boats-market-size-forecast-scenario-1787549334726
Between 2020 and 2025 ferry mandates did most of the work. Norwegian zero-emission fjord requirements turned a demonstration technology into a procurement standard, and Nordic and Dutch operators followed. Recreational adoption grew more slowly and from a smaller base than press coverage suggested. Battery costs fell substantially across the period. The 10.9% historical growth blends a mandated commercial transition with a leisure market still finding its argument.
The 12.4% base case rests on three mechanisms. Ferry and inland water transport electrification continues on regulatory timetables that operators cannot negotiate, which makes that demand unusually predictable for a nascent category. Hydrofoiling cuts energy consumption by roughly three quarters, which turns range from a fundamental obstacle into an engineering parameter. And combustion restrictions on lakes and in city waterways create protected demand for electric leisure craft regardless of operating economics.
The 13.7% bull case assumes ferry mandates spread beyond Northern Europe and shore charging investment keeps pace with vessel delivery. The 11.2% bear case reflects grid connection delays stalling ferry programmes, recreational buyers rejecting the price premium once the novelty fades, and battery certification costs deterring smaller builders entirely. Infrastructure delivery separates the two cases more than technology does.

Where the Grid Connection Costs More Than the Boat

Three things set the commercial shape of this market. Duty cycle comes first, because a ferry crossing the same water forty times a day and a boat used at weekends in summer present completely different engineering and completely different commercial cases. Charging infrastructure comes second, and it is frequently the hardest part of any project. Certification comes third, since marine battery installations face safety approval that road vehicles never encounter.
TOP-FIVE CONCENTRATION22%Share of global electric vessel value held by leading builders
AVERAGE VESSEL PRICEUSD 186,000Blended value across recreational and small commercial craft
BATTERY COST SHARE38%Battery system within total electric vessel build cost
FERRY PROGRAMME SHARE31%Portion of value from passenger ferry and water transport
CHARGING TURNAROUND TIME9 minutesTypical shore charging window between scheduled ferry crossings
RECREATIONAL USAGE HOURS42 hoursAverage annual operation across privately owned leisure vessels
The charging point deserves emphasis. A ferry with a nine-minute turnaround needs megawatt-scale shore power, which means a grid connection, a substation, often a buffer battery on the quay, and permission from a utility with its own timetable. Those works routinely cost more than the vessel and take longer, which puts the grid connection on the critical path.
Hydrofoiling changes the physics rather than the economics. Lifting the hull clear of the water removes most of the drag, cutting energy consumption by roughly three quarters at cruising speed, which turns an impossible battery requirement into a manageable one. That is a rare instance in transport of a genuine engineering answer to a range problem rather than an incremental improvement, and it explains growth at 24.6%.
"The recreational electric boat pitch usually starts with fuel savings, which is nonsense for something used forty-two hours a year. The honest pitch is that you can hear the water, your children are not breathing exhaust, and the lake you want to use has banned petrol engines. Builders who lead with that sell boats; the ones running payback calculations do not."
Practice Director, Marine Technology and Coastal Transport · MMA Marine and Transport Equipment Practice · August 2026

Market Trends

Hydrofoiling Makes Battery Range an Engineering Parameter

Lifting a hull clear of the water removes most of its drag, and foiling electric craft consume roughly three quarters less energy at cruising speed than displacement hulls of comparable size. That converts battery range from a fundamental barrier into something naval architects can design around, which is a genuinely rare development in transport electrification. Candela and Artemis have both moved foiling vessels into commercial passenger service rather than leaving them as demonstrators. Cost, sea state limitations, and control system complexity remain real constraints. Growth at 24.6% reflects operators discovering that the physics works rather than any subsidy driving adoption.
Market Impact: Ferries supply 31% of value
Shore Charging Grid Works Determine Programme Timelines

A ferry turning around in nine minutes requires megawatt-scale shore charging, which means substations, cabling, quayside buffer batteries, and a utility connection with its own approval and construction timetable. Those works frequently cost more than the vessel and take longer to complete, which puts them on the critical path of almost every electrification programme. Operators who scoped the vessel first and the infrastructure afterwards have found boats waiting for power. Builders who arrive with an infrastructure partner and a grid feasibility assessment win contracts that a better vessel alone would not have secured.
Market Impact: Restrictions cover above 40 waterways

Market Opportunities and Growth Drivers

Ferry Mandates Convert Procurement Into a Legal Timetable

Norwegian zero-emission requirements for fjord operation removed the choice from operators entirely, and Danish, Swedish, Dutch, and increasingly Mediterranean authorities have followed with their own commitments and tender conditions. That makes ferry demand unusually predictable for a nascent technology, since replacement schedules and route franchises are published years ahead. Ferry programmes already supply 31% of market value. Operators cannot defer, negotiate, or substitute, which removes the price sensitivity that governs almost every other part of this market and rewards builders able to deliver on the published timetable. Published timetables make the demand unusually visible.
Market Impact: Usage averages 42 hours yearly

Waterway Combustion Restrictions Create Protected Leisure Demand

Swiss and Italian lakes, Dutch city canals, and a growing list of protected waterways restrict or ban combustion engines outright, which converts an environmental preference into a condition of access. A boat owner who wants to use those waters has no alternative, and the purchase decision stops being an economic comparison entirely. Amsterdam requiring emission-free operation on its canals moved an entire local fleet. This demand is geographically concentrated and completely inelastic, which makes it the most reliable recreational segment and the one builders should pursue first. No economic comparison enters the decision at all.
Market Impact: Approval costs above $300,000

Market Restraints and Challenges

Recreational Economics Do Not Work on Forty-Two Annual Hours

A privately owned leisure boat runs about forty-two hours a year, which means fuel savings from electrification amount to very little against a purchase premium that can reach half the vessel price. The root cause is utilisation rather than technology or cost. Any payback calculation presented to a recreational buyer fails, and builders who lead with one damage their own credibility. Mitigation runs through selling the actual benefits, which are silence, absence of fumes, minimal maintenance, and access to restricted waters, and through charter and rental operators whose utilisation is several times higher.
Market Impact: Cuts energy consumption by 75%

Marine Battery Certification Deters Smaller Builders Entirely

Classification societies apply demanding requirements to marine battery installations, covering thermal runaway containment, fire suppression, ventilation, and redundancy, because a fire at sea has nowhere to go. The root cause is genuine safety necessity rather than regulatory excess. Approval work costs several hundred thousand dollars per vessel design and requires expertise most small boatbuilders have never needed. That is why specialist propulsion suppliers with pre-certified systems have taken so much of the value. Builders mitigate by adopting certified propulsion packages rather than engineering battery installations independently. Specialist propulsion suppliers captured that value accordingly.
Market Impact: Turnarounds allow 9 minute charging
4 additional market trends, 3 additional growth drivers, and 2 additional restraints and challenges are covered in the full report. Contact sales@marketmindsadvisory.com to access the complete intelligence.

Segment CAGR and Growth Architecture

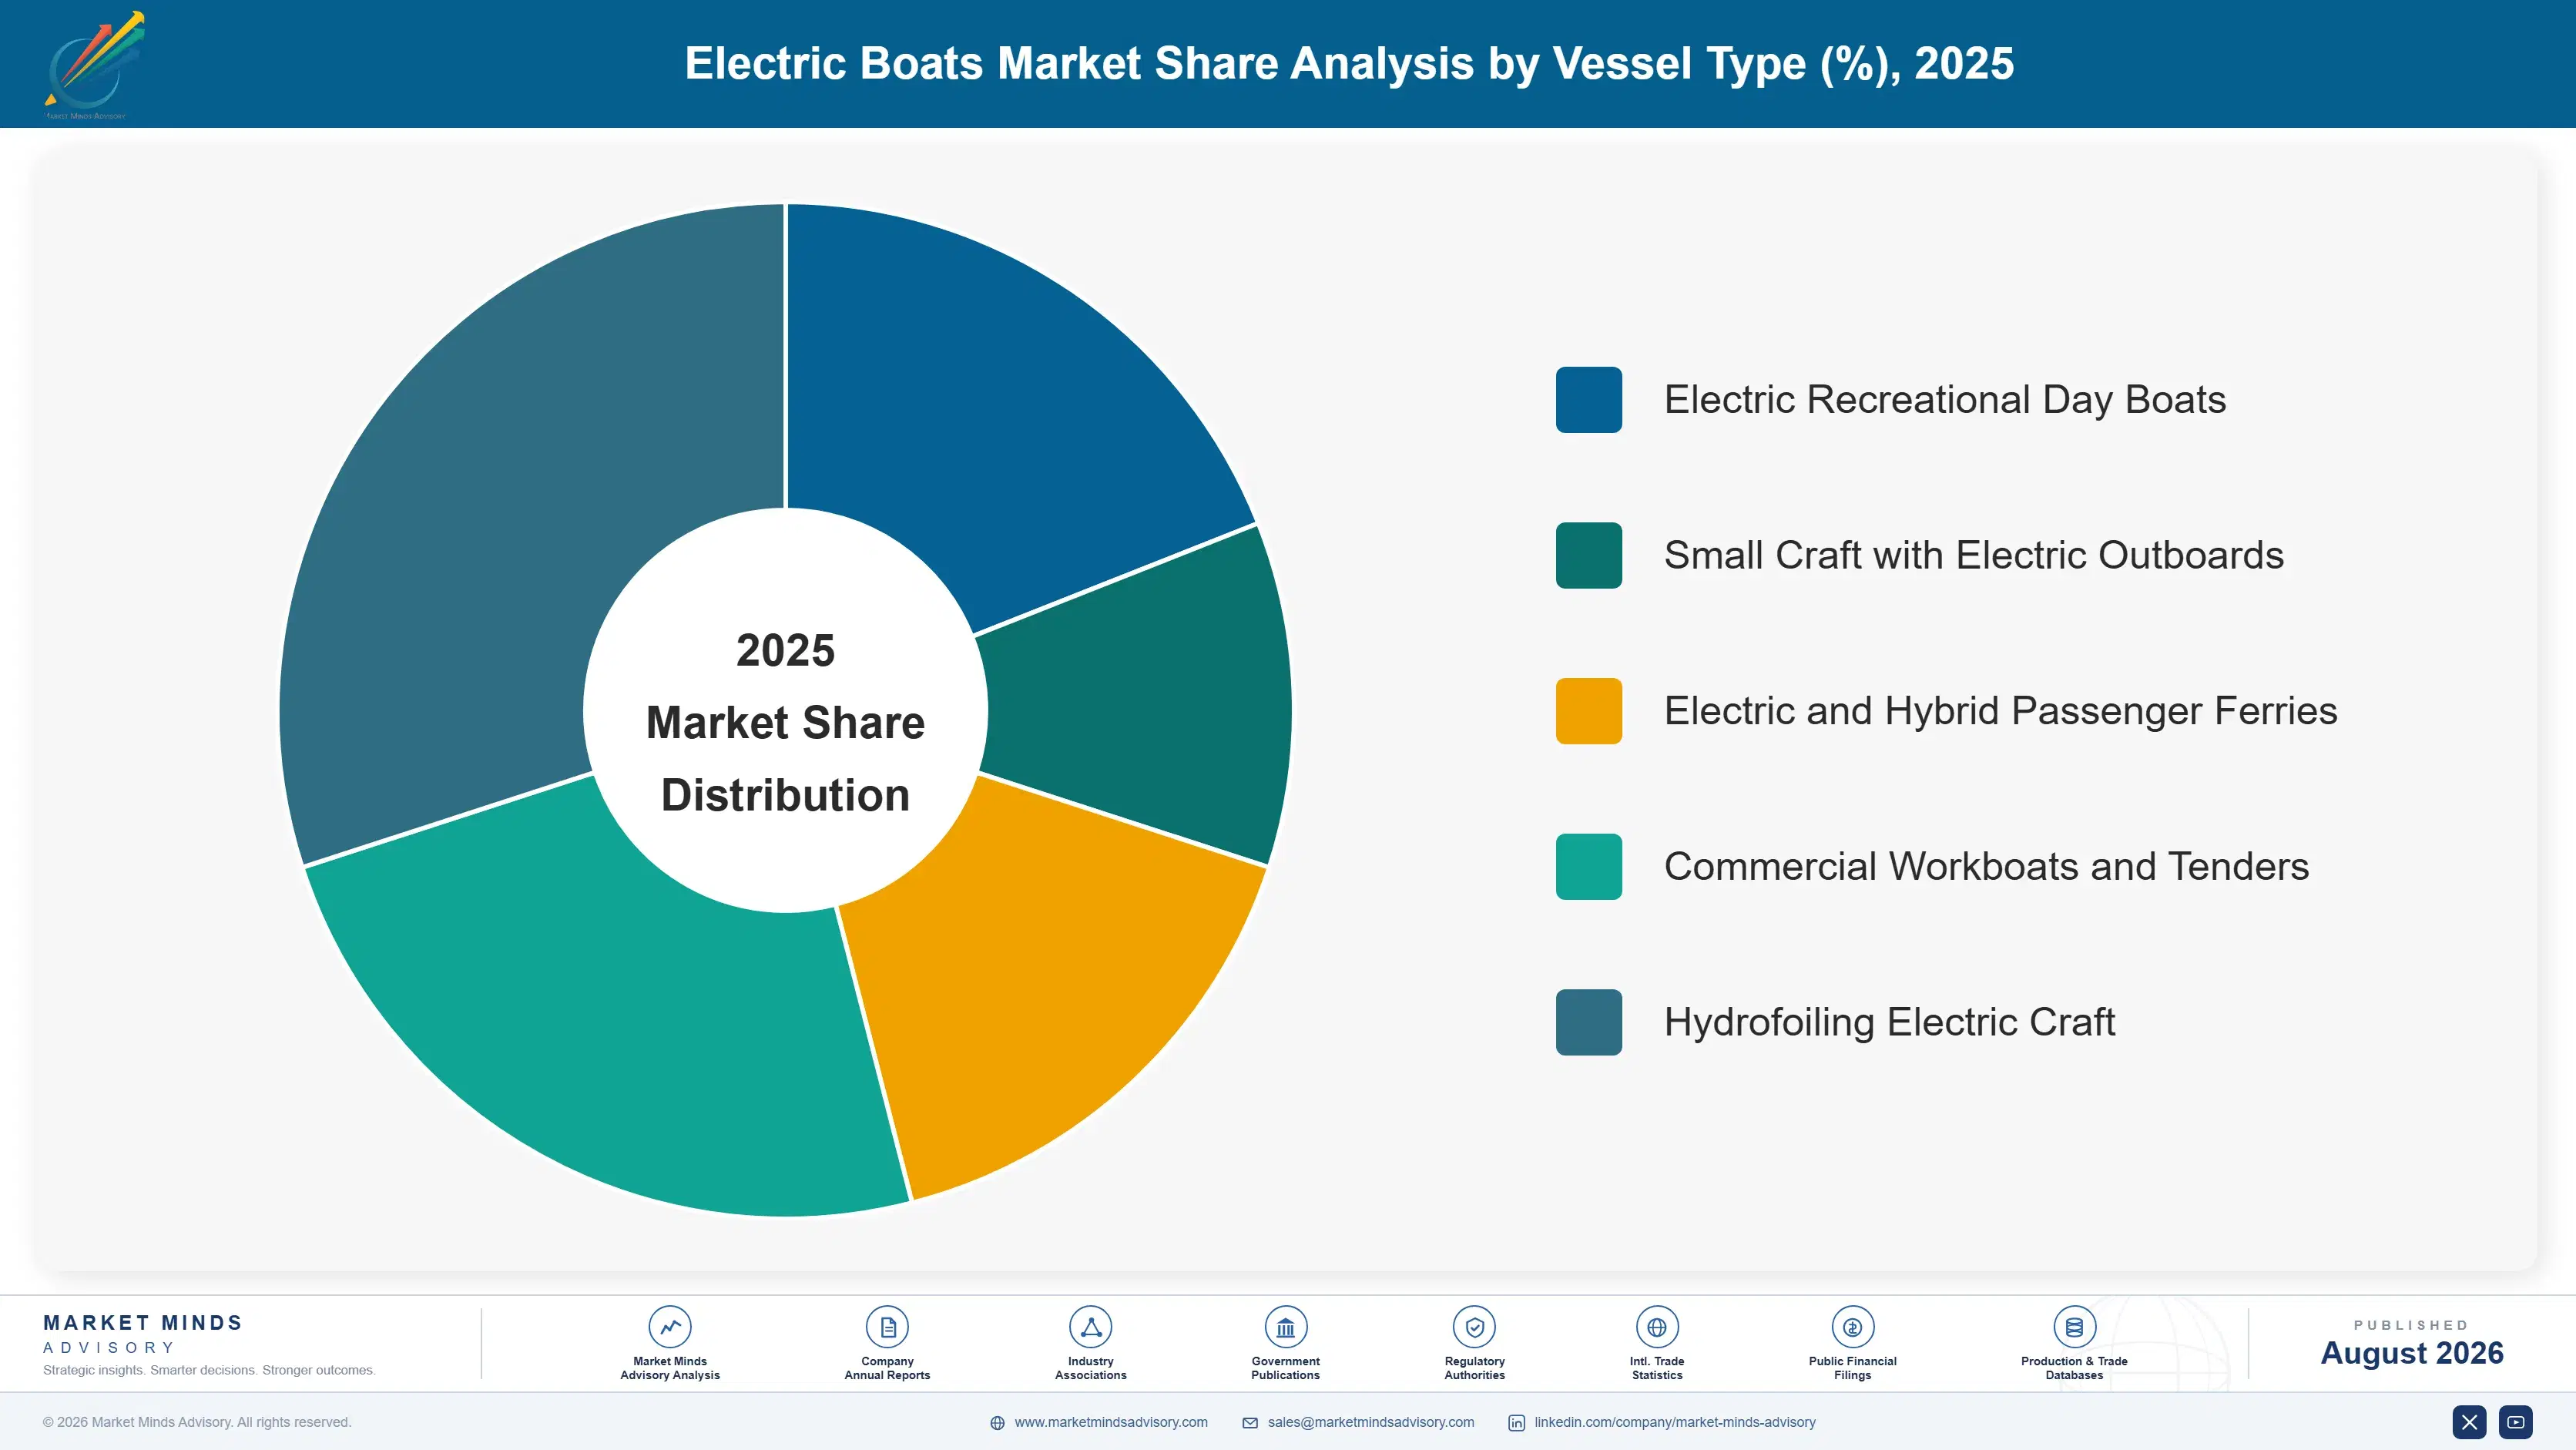
Segmentation follows vessel type, because type determines duty cycle, charging pattern, certification requirement, buyer type, and whether an economic case exists at all. Five vessel types cover commercial supply, and they share very little beyond electric propulsion, since a mandated passenger ferry and a weekend day boat are different products sold to different people entirely.
electric-boats-market-market-share-analysis-1787549335256

Hydrofoiling Electric Craft

The fastest-growing type at 24.6%, roughly 1.98 times the market, and the only one that solved the range problem rather than working around it. Lifting the hull clear of the water removes most of the drag and cuts energy consumption by roughly three quarters at cruising speed, which turns battery capacity from an impossible requirement into a design parameter. Commercial passenger operators have moved foiling craft into scheduled service on urban and coastal routes where speed matters and wake restrictions apply. Cost per vessel runs high, sea state imposes real operating limits, and control systems add complexity. The physics advantage is genuine and difficult for conventional hulls to answer. Conventional hulls have no answer to it.
CAGR 24.6%

Electric and Hybrid Passenger Ferries

Second fastest at 15.8%, and the segment where demand is mandated rather than chosen. Zero-emission requirements across Norwegian fjords and comparable commitments elsewhere have made electric propulsion a condition of operating certain routes at all, which removes price sensitivity and creates a published procurement timetable years ahead. High utilisation makes the operating economics genuinely favourable regardless of the mandate. The binding constraint is shore charging rather than the vessel, since megawatt-scale quayside power requires grid works that routinely cost more and take longer than building the boat. Builders arriving with infrastructure partners win contracts that vessel quality alone does not secure. Vessel quality alone does not secure these contracts. Several technically capable yards have discovered that expensively.
CAGR 15.8%
Full segment breakdown across 5 segments available in the complete report.

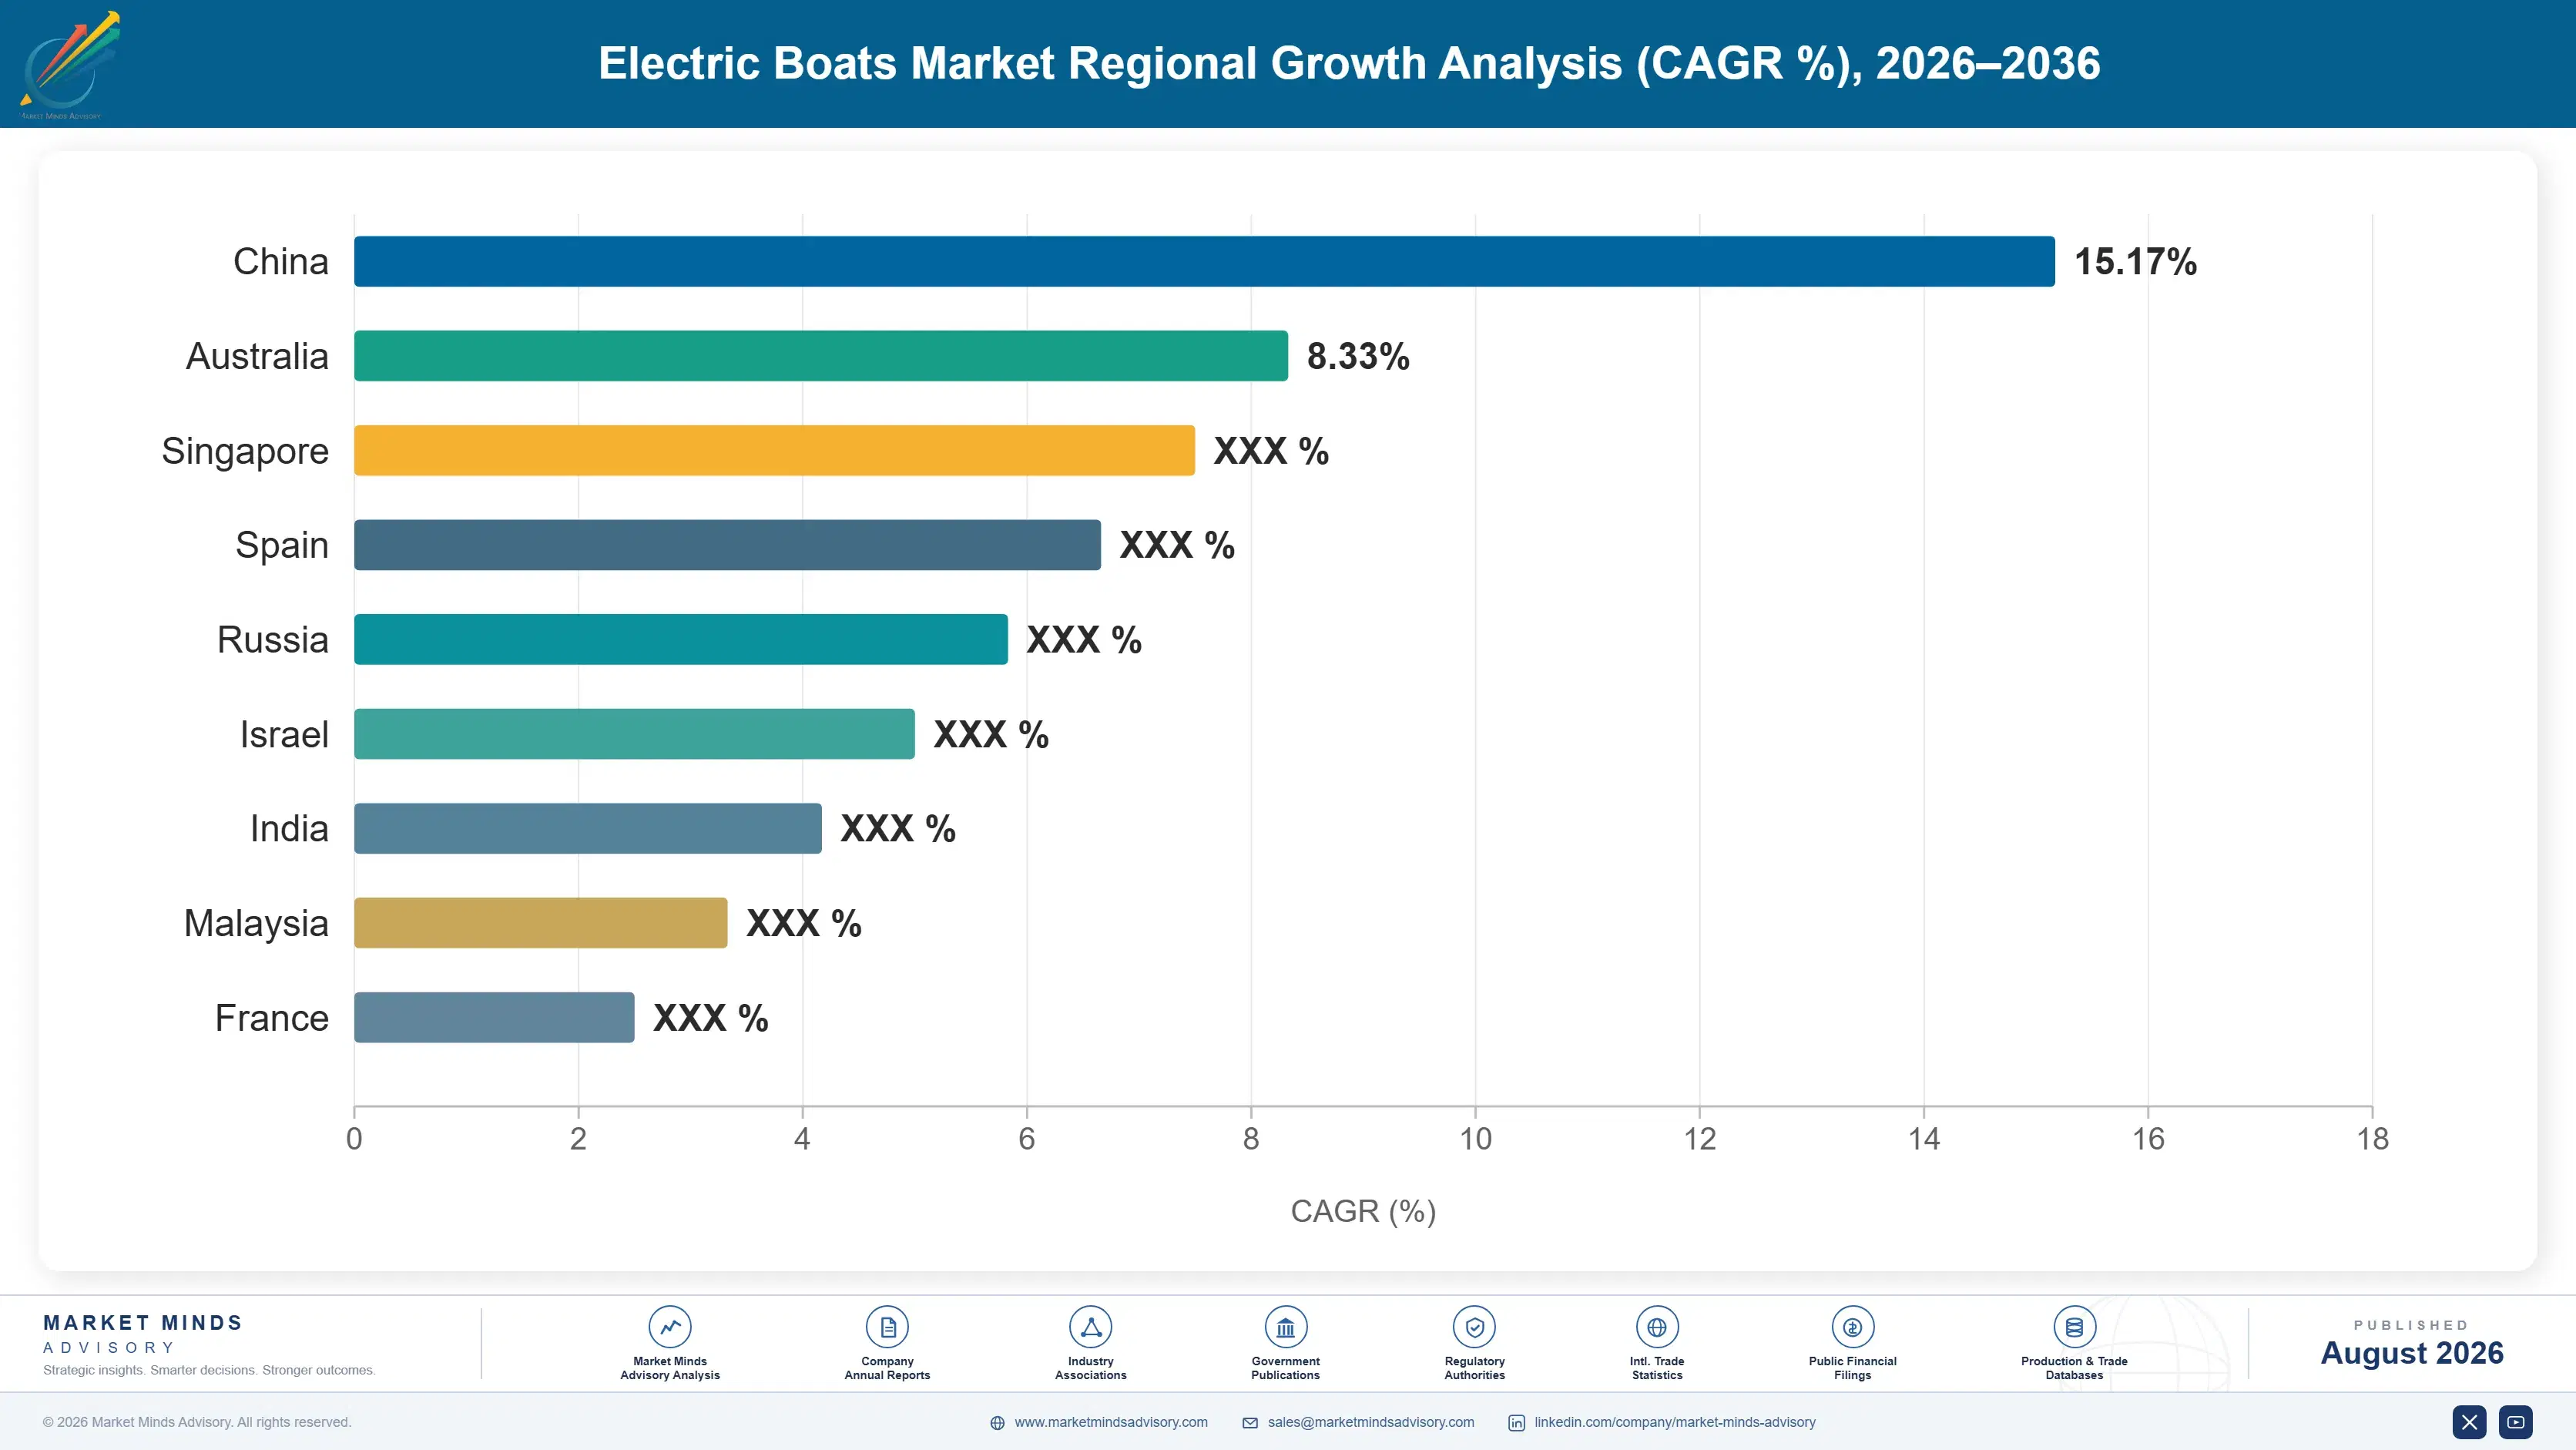
Regional Architecture and Country Demand Map

Regional shares follow regulation and boating culture rather than coastline or economic size. Ferry electrification mandates concentrate in Northern Europe, while recreational demand tracks lake and coastal leisure boating in wealthy markets with restricted waterways. Charging availability then determines whether that demand can be served.

North America

Recreational boating is larger here than anywhere and almost entirely petrol powered, which makes this the biggest available conversion opportunity and the hardest to convert. Electric outboards from Brunswick and specialist entrants have gained a foothold in small craft, tenders, and lake boats where usage patterns and noise restrictions favour them. Commercial adoption lags Europe considerably, with only a handful of ferry programmes under way in Washington State, New York, and Ontario. Freshwater lakes with combustion restrictions provide the most reliable pockets of demand. Charging infrastructure at marinas is developing slowly and unevenly. Growth of 12.0% depends on recreational conversion rather than the mandated commercial demand driving Europe. Marina charging remains patchy and uneven.
Share: 25% | CAGR: 12.0% (2026 to 2036)

Western Europe

The largest regional position at 26%, and the reason is specific rather than general: Norwegian zero-emission requirements for fjord ferry operation created the world's first mandated electric vessel market and produced the operating experience everyone else now draws on. Danish, Swedish, and Dutch operators followed, and Amsterdam requiring emission-free canal operation moved an entire local fleet at once. Swiss and Italian lake combustion restrictions add protected recreational demand. Shipyards including Fjellstrand and Damen have built genuine electric vessel capability, and Norwegian shore charging infrastructure is the most developed anywhere. Growth of 10.8% is the slowest in the report because the earliest and easiest conversions here have already happened. The easiest conversions here are already finished.
Share: 26% | CAGR: 10.8% (2026 to 2036)
Regional intelligence for 5 additional markets available in the complete report: East Asia, South Asia and Pacific, Latin America, Middle East and Africa, Eastern Europe. Contact sales@marketmindsadvisory.com.
electric-boats-market-country-cagr-analysis-1787549335771

Four Moves That Change the Economics

Advantage here comes from charging delivery, certification position, and honest segment targeting rather than from vessel design, which many builders execute competently. Four moves are worth capital and management attention across the forecast period, and the first addresses what actually delays and kills commercial projects. The other three concern which customers to pursue and how to structure the offer.

Bid the charging infrastructure alongside the vessel

Megawatt-scale shore power for a nine-minute ferry turnaround requires substations, cabling, quayside buffer batteries, and a utility connection, and those works routinely cost more than the boat while taking longer to deliver. Builders arriving with an infrastructure partner and a grid feasibility assessment win contracts that a superior vessel alone would not secure, because operators have learned that boats waiting for power are worthless. Bundled bids typically carry 15 to 25% more contract value while removing the coordination risk that operators most fear. Operators fear coordination risk more than vessel risk now.
Market Impact: Adds 15 to 25% more total contract value

Adopt pre-certified propulsion and battery packages

Classification society approval for a marine battery installation costs above $300,000 per vessel design and demands expertise most boatbuilders have never needed, since a fire at sea has nowhere to go. Using pre-certified propulsion systems transfers that burden to specialist suppliers who amortise it across many hulls. It reduces development cost and time to market substantially while limiting differentiation to the vessel itself. For all but the largest builders, engineering a battery installation independently is a cost that the resulting product cannot recover. Differentiation then rests on the vessel rather than the propulsion.
Market Impact: Avoids a $300,000 certification cost per vessel design

Target restricted waterways rather than open water buyers

A recreational buyer comparing electric against petrol on economics will not buy, since forty-two annual hours generate almost no fuel saving against a substantial price premium. A buyer who wants to use a Swiss lake, an Italian lake, or an Amsterdam canal where combustion is banned has no comparison to make at all. That demand is geographically concentrated, completely inelastic, and covers above 40 waterways already. Concentrating sales effort there converts at several times the rate of general marine retail and builds reference customers that broader marketing cannot buy. Reference customers follow that no marketing could buy.
Market Impact: Covers above 40 restricted waterways around the world

Serve charter and rental fleets before private owners

Charter and rental operators run vessels several times the forty-two hours a private owner manages, which makes the operating economics that fail for individuals work comfortably for them. They also value low maintenance and quiet operation commercially rather than emotionally, and they replace fleets on schedules that private buyers never follow. Fleet utilisation typically runs 6 to 10 times private ownership levels. Winning them requires service coverage and uptime commitments rather than showroom presence, which suits builders organised around commercial rather than retail selling. Commercial rather than retail organisation is what serves them.
Market Impact: Utilisation runs 6 to 10 times higher overall

Who Controls the Margin Pool

Concentration is very low at roughly 22% for the top five, reflecting a boat building industry that has always been fragmented and an electric transition that attracted specialist entrants rather than driving consolidation. Torqeedo leads on electric propulsion systems supplied to many builders rather than on complete vessels. Candela and X Shore built positions on distinctive complete craft, while Vision Marine and Brunswick approach from powertrain and established recreational manufacturing respectively.
Competitive activity runs on three fronts. Charging delivery capability is the first and decides commercial contracts more than vessel specification does. Certification position is the second, since pre-certified propulsion packages let small builders participate at all. Reference operating experience is the third, and operators buying mandated ferries weigh delivered vessels in service far above any technical proposal. Vessel specification decides less than any of the three.

Pressure is building from two directions. Chinese shipyards with domestic battery supply are building electric passenger vessels at costs European yards cannot approach. And established combustion boatbuilders are entering with electric variants, bringing dealer networks and service coverage that specialist entrants lack entirely. The second is the more serious threat, since dealer networks take years to build.
electric-boats-market-company-positioning-matrix-1787549336289

Competitive Moat and Risk Dimensions

TORQEEDO

Moat: Certified propulsion across many builders

Supplying pre-certified electric propulsion and battery systems to boatbuilders who could never fund classification approval themselves puts Torqeedo inside a large share of vessels regardless of whose name appears on the hull. That position earns from competitors' sales and accumulates operating data across far more installations than any single builder generates.
TORQEEDO

Risk: Builders integrating propulsion internally

As volumes grow, larger boatbuilders have both the incentive and the resources to develop or acquire propulsion capability rather than buying it, which removes the highest-value content from the supplier. Brunswick has already moved that way, and other established manufacturers entering the category will weigh the same decision as their volumes justify it.
CANDELA

Moat: Hydrofoil control and efficiency

Foiling control systems that keep a hull stable and clear of the water across real sea conditions represent genuine engineering difficulty, and the resulting three-quarters reduction in energy consumption is an advantage conventional hulls cannot match by any means. Commercial passenger operators adopting foiling craft have validated it in scheduled service rather than in demonstration.
CANDELA

Risk: Cost and operating envelope limits

Foiling craft cost substantially more than conventional hulls and face real sea state limitations that restrict where they can operate reliably throughout a year. That confines the addressable market to sheltered and coastal routes with favourable conditions, and larger builders adopting foiling technology under licence could erode the position as the control problem becomes better understood.

Players Tracked

Prominent Players

Torqeedo
Vision Marine Technologies
Candela
X Shore
Brunswick Corporation

Other Key Players

Yamaha Motor
ePropulsion
Elco Motor Yachts
Duffy Electric Boat
RAND Boats
Q-Yachts
Greenline Yachts
Damen Shipyards
Wärtsilä
Corvus Energy
Leclanché
Fjellstrand
Havyard
Incat Crowther
Artemis Technologies

Recent Developments

MARCH 2025

Foiling passenger vessel enters scheduled commercial service

An electric hydrofoiling craft began operating a scheduled urban passenger route, moving foiling technology from demonstration into revenue service with published timetables. Energy consumption at cruising speed ran far below conventional displacement vessels of comparable passenger capacity on the same route. Passenger loadings met projections.
Signal: Foiling has moved into scheduled service, which is what turns an engineering claim into a procurement option
JULY 2025

Ferry programme delayed by grid connection timetable

A European ferry electrification project reported vessel delivery ahead of shore charging availability, with the utility connection and substation works running behind the shipbuilding schedule. Operators had scoped the vessels first and treated infrastructure as a subsequent workstream rather than a parallel one. Commissioning slipped by months.
Signal: Grid works are the critical path, and programmes scoping vessels first keep discovering it too late
OCTOBER 2025

Recreational builder refocuses on restricted waterway markets

An electric boat manufacturer redirected its commercial effort toward lake and canal markets with combustion restrictions, abandoning broader recreational marketing that had converted poorly. Buyers in restricted waters were purchasing access rather than comparing running costs against petrol alternatives. Conversion rates improved sharply. Marketing spend fell too.
Signal: Selling access rather than economics is what actually converts recreational buyers across to electric propulsion instead

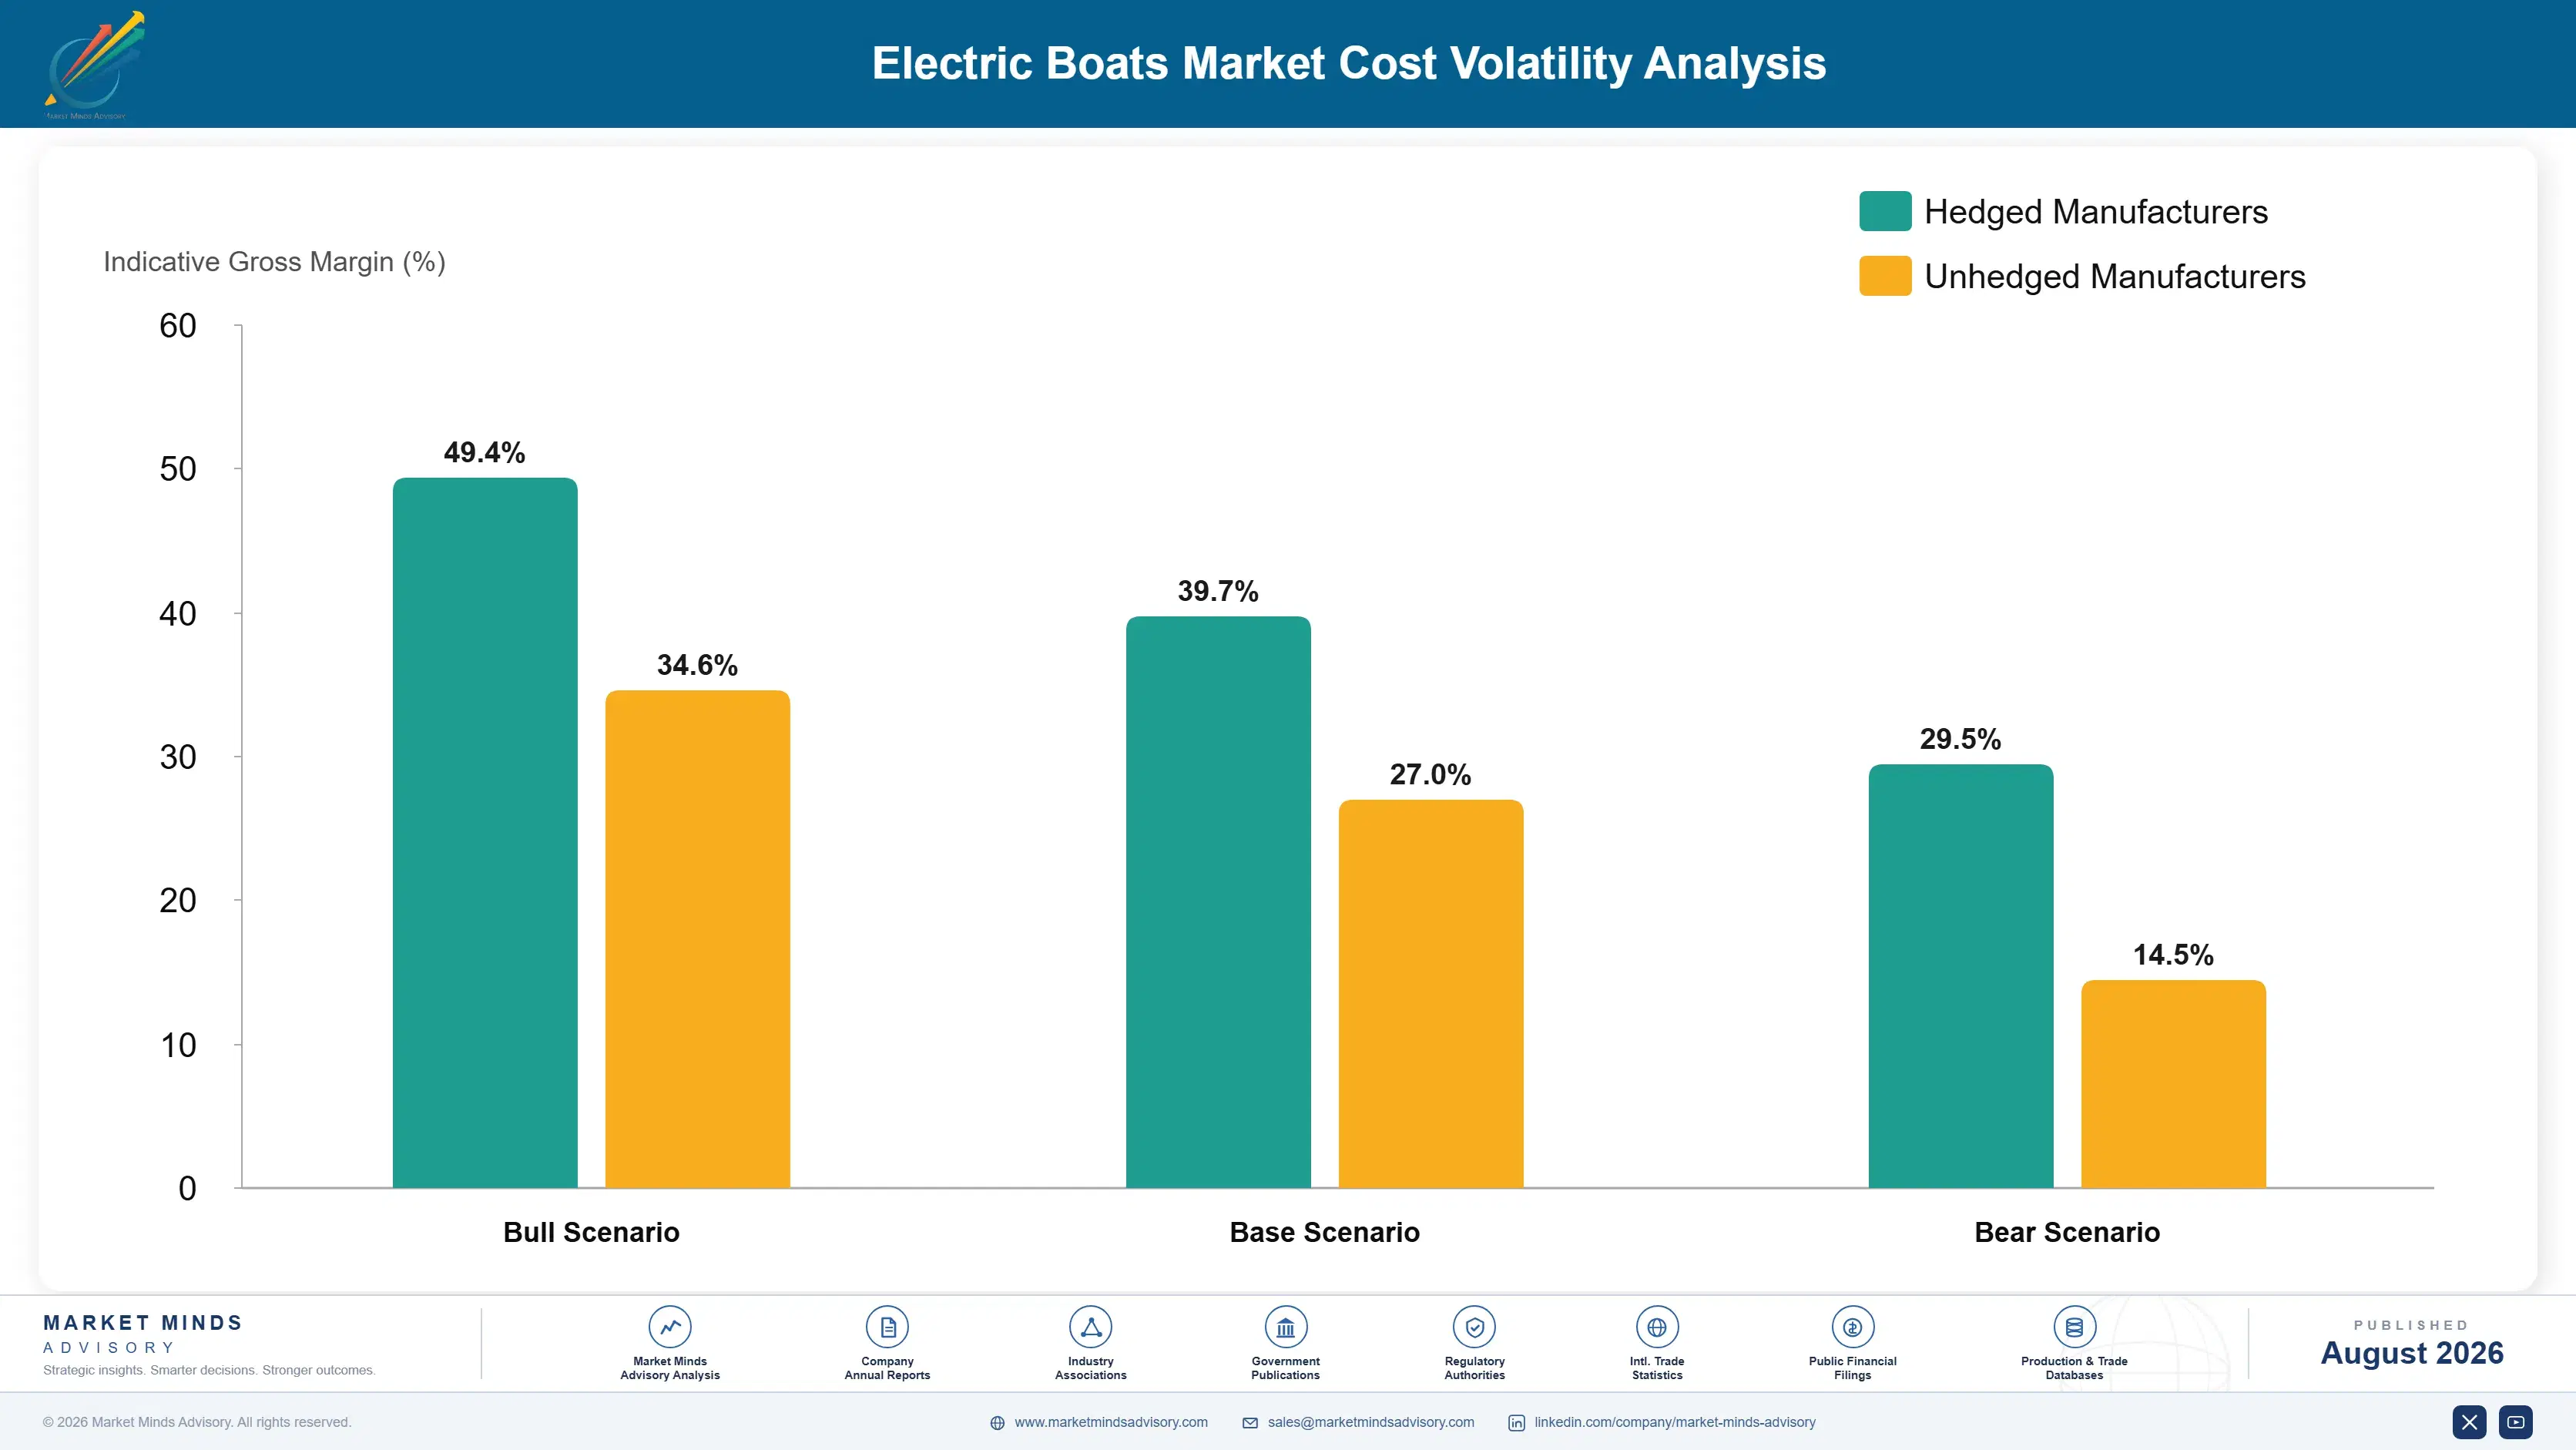
What Sets the Cost Base

The battery system dominates at roughly 38% of vessel build cost, and marine packs cost more than automotive equivalents because certification, thermal management, and enclosure requirements are considerably more demanding. Hull and structure contribute 22%, with composite construction the norm across recreational and smaller commercial craft. Electric motors, drives, and control systems take 16%. Fit-out, integration, certification, and commissioning absorb the balance.
Marine battery cell and pack costs fell substantially through 2023 and 2024 following the wider lithium price correction, which improved vessel economics without altering the certification burden at all. Composite materials and resin costs moved in the opposite direction for part of the period. Brunswick and Wärtsilä both referenced input cost movement and supply chain conditions across their reporting for those years. Marine-certified components stayed tight, since the qualified supplier base is narrow.

Exposure divides on propulsion sourcing and build volume rather than on scale alone. Builders buying pre-certified propulsion packages carry supplier margin but avoid approval cost entirely, which is the correct trade at low volumes and the wrong one at high. Certification cost amortisation is the more consequential divide, since spreading approval across many hulls of one design carries a fraction of the bespoke burden.
electric-boats-market-cost-volatility-analysis-1787549336485

Standardise around one certified battery architecture

Approval cost falls per vessel design rather than per hull, which punishes builders offering many variants. Designing a range around one certified battery and propulsion architecture, scaled by module count, spreads that cost across far more units. The trade-off is losing some optimisation on the largest and smallest vessels in a range, which builders accept after paying for approval twice.

Qualify second sources for marine-certified components

The supplier base for classification-approved marine electrical components is far narrower than automotive equivalents, and shortages during the recent period delayed deliveries rather than merely raising costs. Qualifying alternatives requires classification society acceptance and takes months of engineering attention. Builders who deferred that work found themselves waiting for single-sourced parts while competitors delivered on schedule.

Design hulls for lower power rather than larger batteries

Every kilowatt of required propulsion power adds battery cost at 38% of build value, which makes hull efficiency the cheapest available lever on total cost. Hydrofoiling is the extreme case, and conventional hull optimisation, weight discipline, and appendage design all deliver meaningful gains. Naval architecture effort is modest against the battery cost it removes.

Portfolio Architecture for Margin Defence

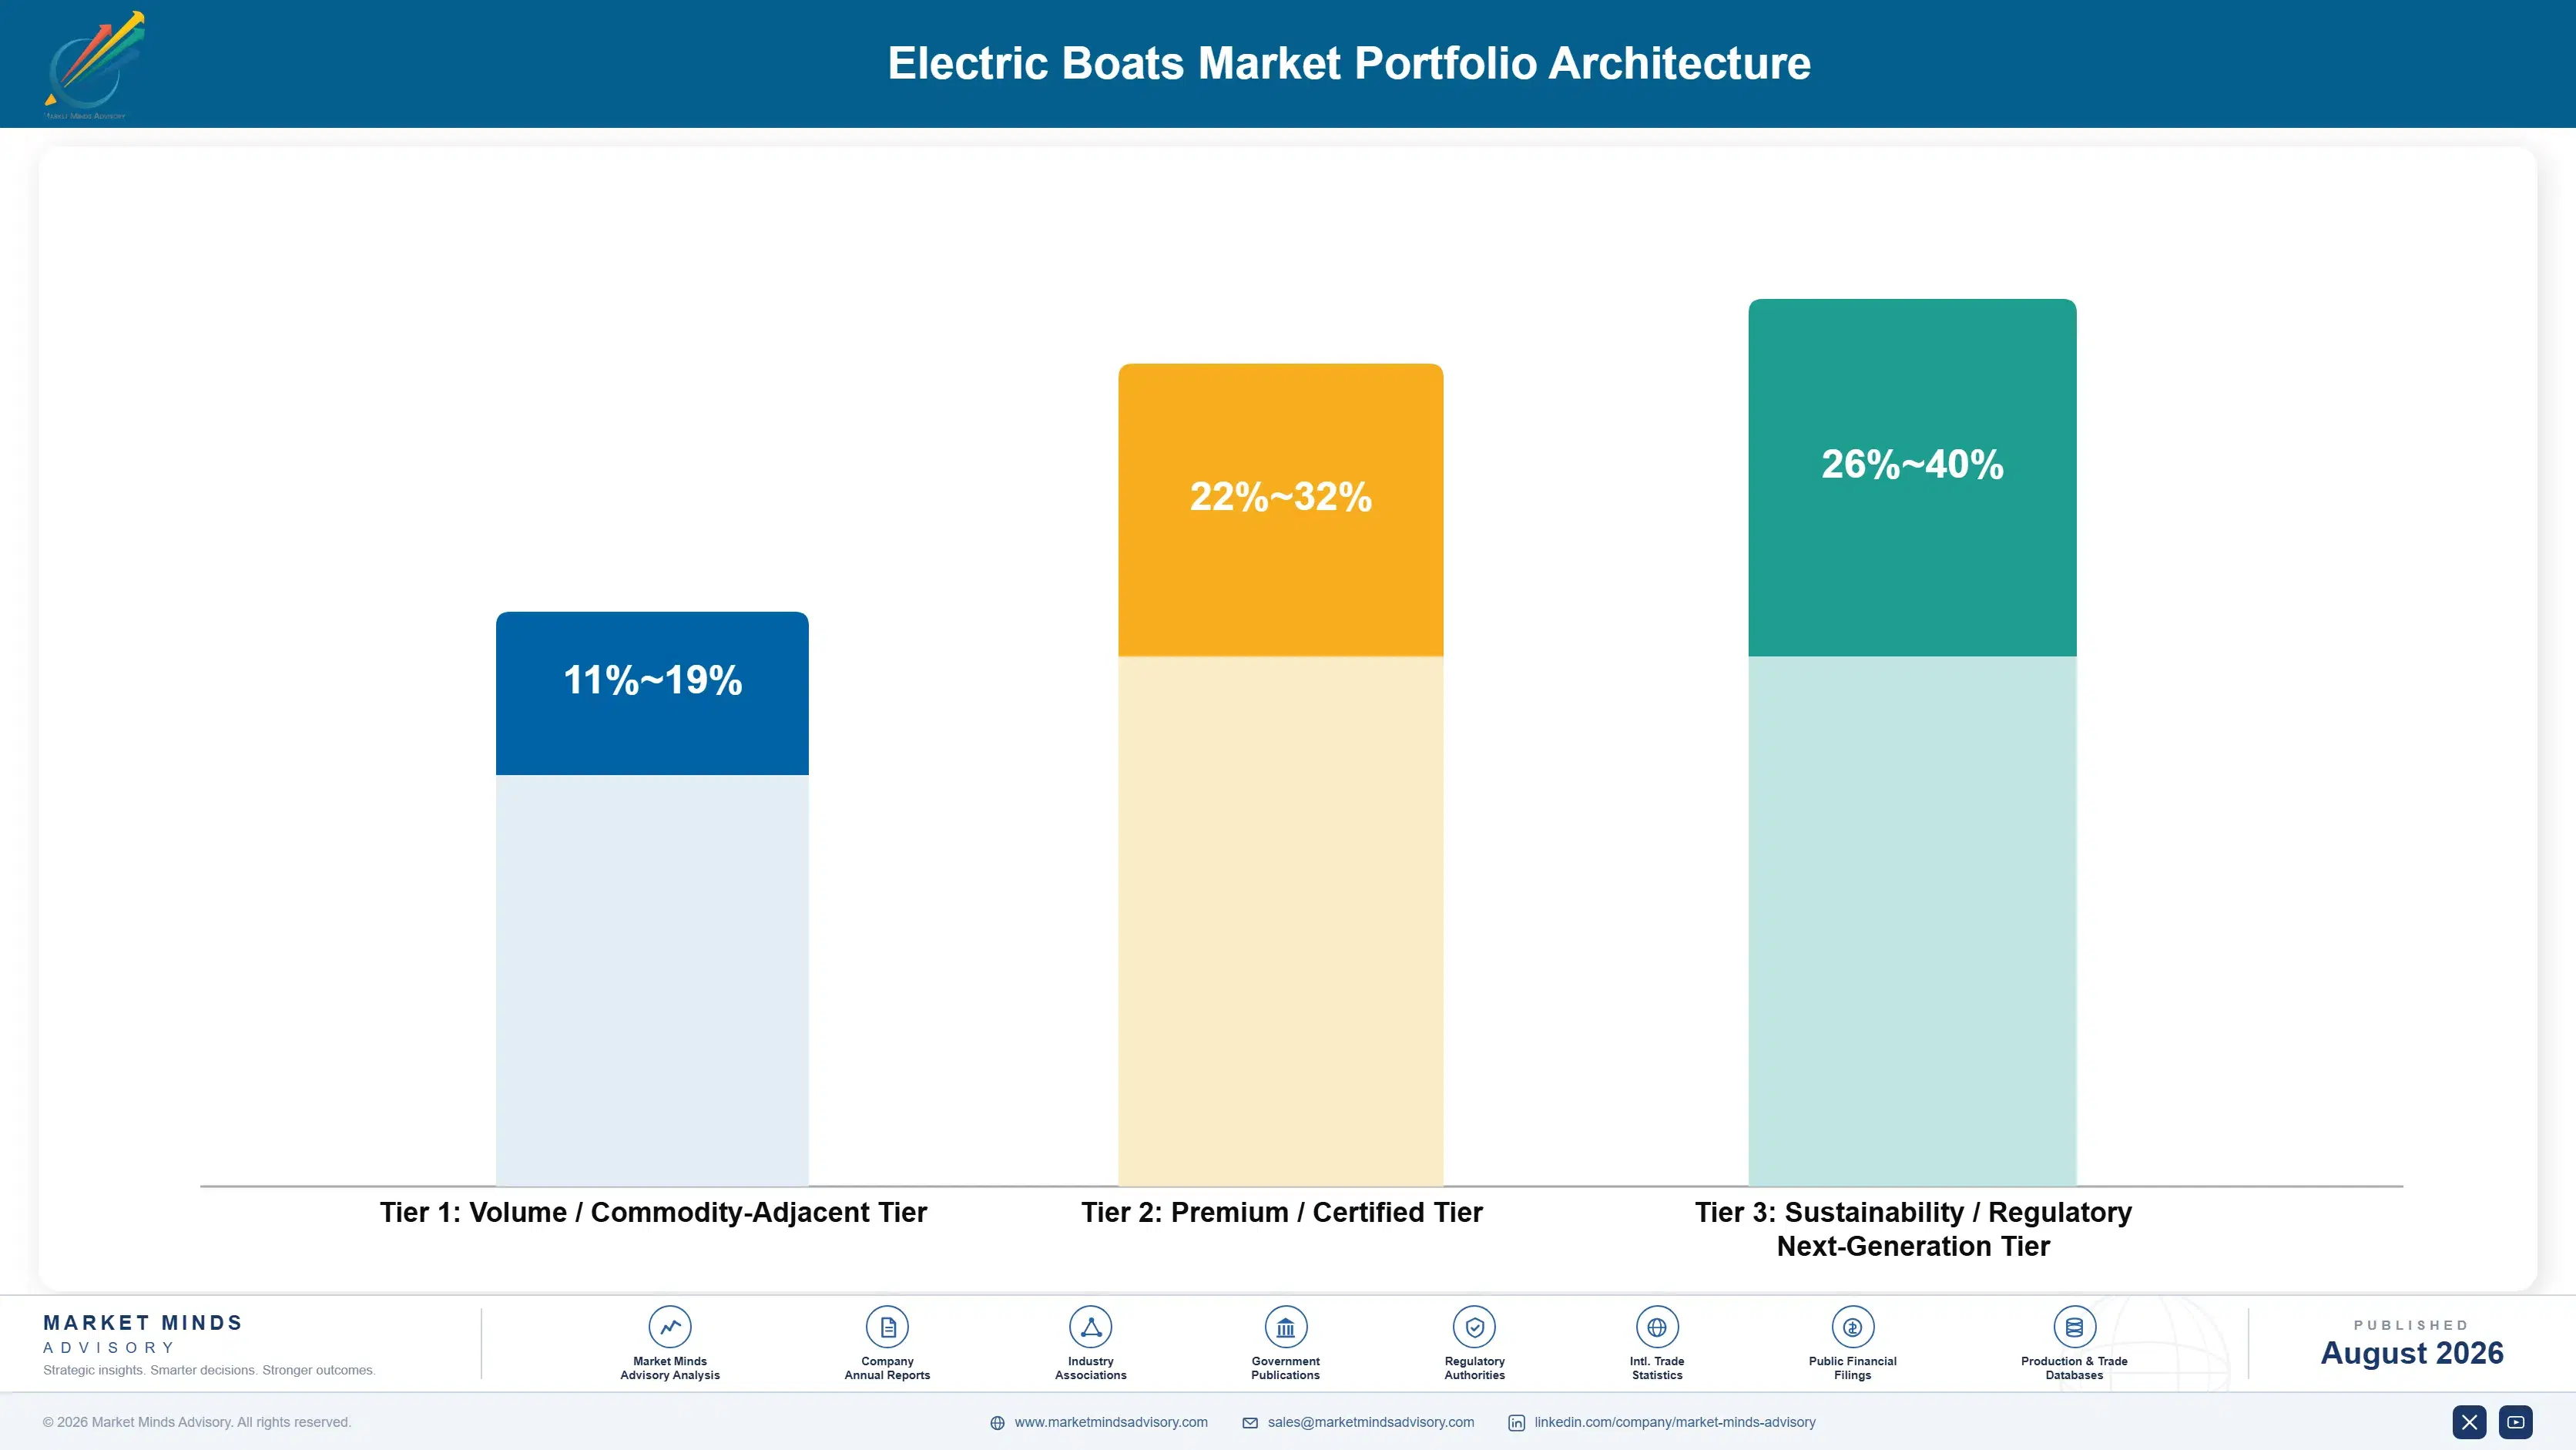
Margin follows contract structure and duty cycle rather than vessel size. Recreational day boats sold through dealers into general marine retail earn thin returns, because buyers compare against petrol equivalents on price and the electric premium has no economic justification at forty-two annual hours. Mandated ferry contracts and charter fleet supply earn considerably more, since those buyers are purchasing compliance or utilisation rather than a leisure product.
The volume and premium tension sits in certification amortisation rather than in yard capacity. Approval cost falls per design, so a builder needs volume across each certified architecture to recover it, which argues against the wide model ranges that recreational dealers request. Resisting that pressure is difficult when dealers measure a brand by how many models it offers them to sell.

High-value pools concentrate in three places: bundled ferry and charging contracts, foiling craft where the physics advantage is defensible, and charter fleet supply where utilisation makes the economics work. Each is defended by capability, engineering, or service rather than by price. Price competition arrives only when a competitor builds charging capability, masters foiling control, or establishes commercial service coverage.

Volume / Commodity-Adjacent Tier

Small electric craft and outboard-powered boats sold through marine dealers into general recreational retail. Competes against petrol equivalents on price with no economic case. The range reflects large differences in build volume and propulsion sourcing.
Gross Margin: 11%-19%

Premium / Certified Tier

Classification approved commercial vessels and ferries delivered with commissioning and service commitments. The operator purchases compliance and route availability rather than a boat, and delivery timetables are contractual. Delivery dates carry real penalties.
Gross Margin: 22%-32%

Sustainability / Regulatory / Next-Generation Tier

Hydrofoiling craft and bundled vessel plus charging infrastructure contracts addressing range and grid constraints together. Engineering scarcity drives the premium. The range is wide because foiling and infrastructure pricing have not yet settled.
Gross Margin: 26%-40%
electric-boats-market-portfolio-architecture-1787549336976

High-value Sub-segments and Strategic Watch-out

Bundled Ferry and Charging Contracts

Grid works routinely cost more than the vessel and take longer, which puts them on the critical path of every programme. Builders arriving with an infrastructure partner win contracts vessel quality alone would not secure. Contract values run materially higher. Find an infrastructure partner before bidding.
Gross Margin: 24%-34%

Hydrofoiling Commercial Craft

Cutting energy consumption by three quarters is a genuine engineering answer to range rather than an incremental gain, and conventional hulls cannot match it. Sea state limits the addressable routes. Control system capability is what defends the position. Sea state limits the addressable routes though.
Gross Margin: 28%-40%

Charter and Rental Fleet Supply

Utilisation running six to ten times private ownership makes the operating economics that fail for individuals work comfortably here. Operators buy uptime and low maintenance commercially rather than emotionally. Service coverage decides awards rather than showroom presence. Build service coverage rather than showrooms here. Move early.
Gross Margin: 20%-29%

General Recreational Dealer Retail

The strategic watch-out. Buyers compare against petrol on price, forty-two annual hours generate no fuel saving worth discussing, and the premium has no defence. It fills the yard between commercial contracts and nothing more than that. Keep it for yard loading and nothing more. Nothing else.
Gross Margin: 11%-18%

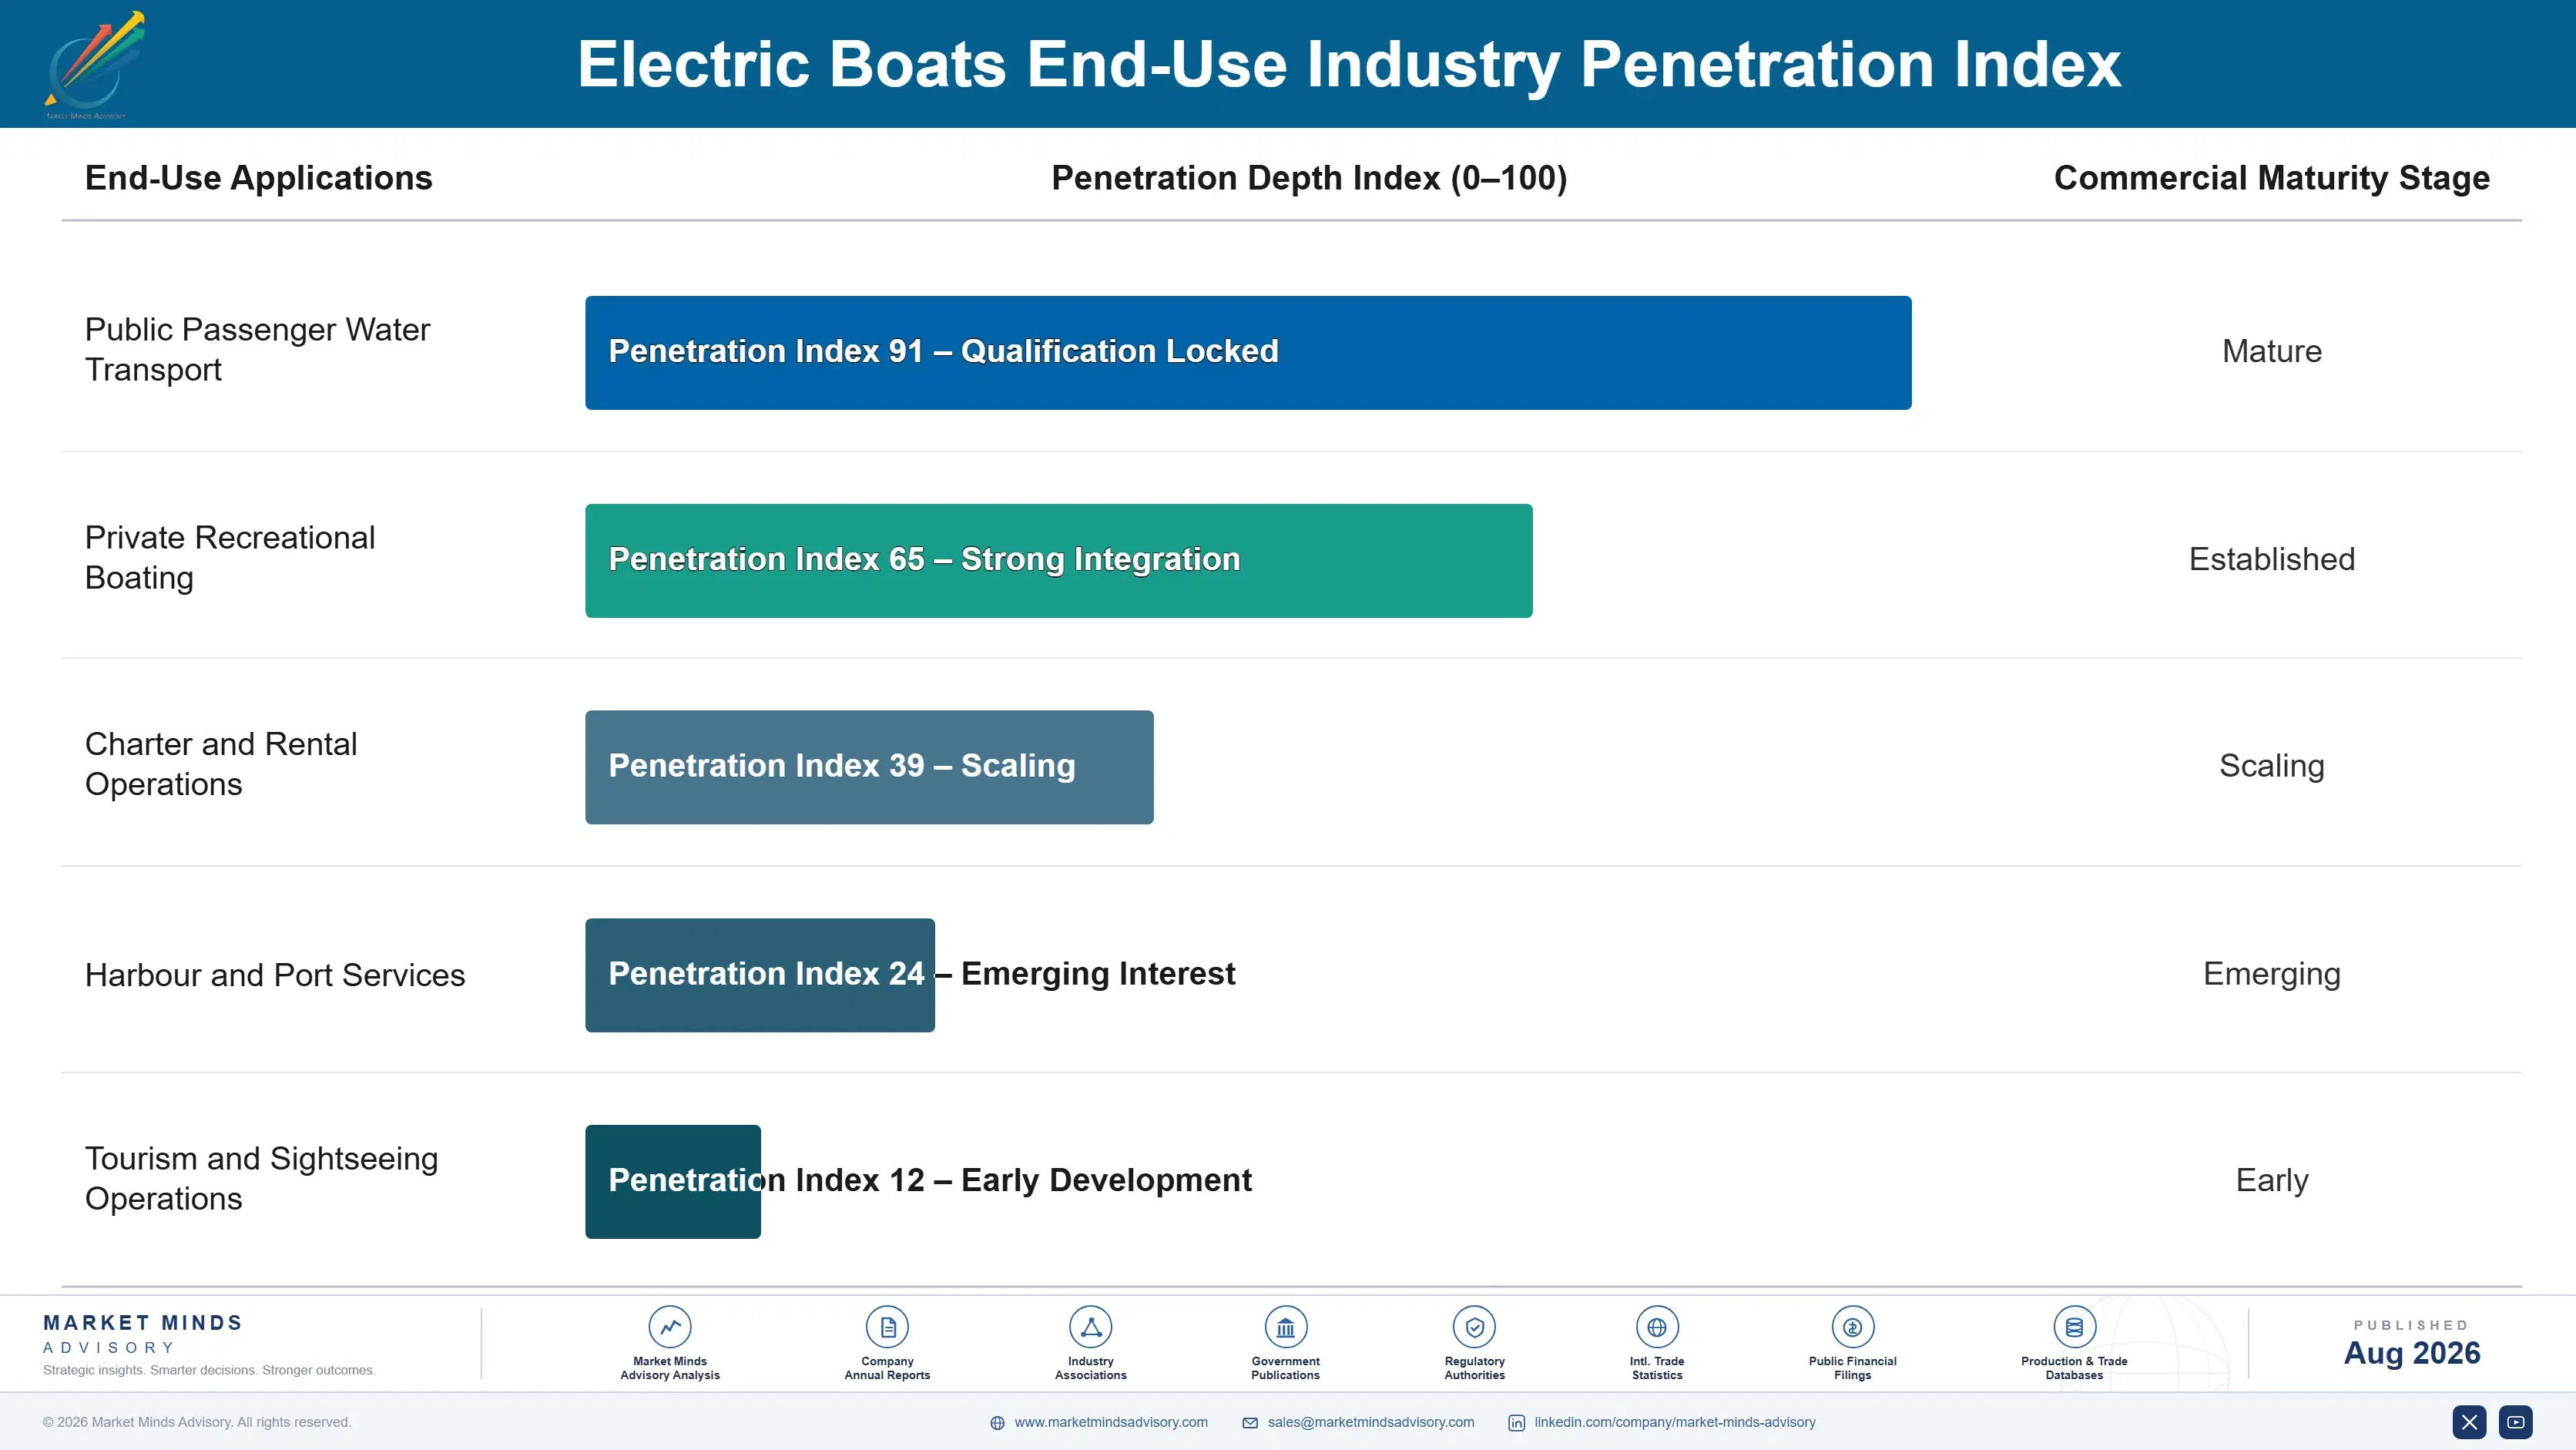
How Demand Actually Reaches Builders

Two demand patterns coexist and behave nothing alike. Commercial ferry demand arrives through published procurement timetables tied to route franchises and regulatory deadlines, which gives builders years of visibility and removes price negotiation from vessels that must simply exist by a date. Recreational demand arrives through dealers, boat shows, and word of mouth among owners who may take several seasons to decide. Builders weighted entirely toward recreational carry uncertainty that mandated commercial work would substantially reduce.
Adoption depth varies sharply by buyer type. Ferry operators under mandate specify to classification standards and cannot defer, which makes them the deepest and most reliable customers. Charter fleets buy on utilisation economics and uptime. Restricted waterway owners buy access and do not compare prices at all. General recreational buyers compare against petrol and mostly do not buy, whatever they say at a boat show.

The buyer has shifted toward transport authorities and fleet operators rather than individual owners. Those organisations evaluate delivered vessels in service, never brochures. An operator will visit a vessel already running a comparable route before shortlisting anyone, which makes the first delivered reference worth more than any amount of engineering documentation a builder can produce.
electric-boats-market-end-use-penetration-index-1787549337463

Where the Money Sits

These are among the four positions where our research anticipates prominent divergence between winners and laggards over the coming forecast period. Each is grounded in the demand model, the regulatory perimeter, and the announced capacity pipeline.
01 / CHARGING DELIVERY CAPABILITY

Bid the shore power, because the grid is the critical path

A nine-minute ferry turnaround needs megawatt-scale quayside charging, meaning substations, cabling, buffer batteries, and a utility connection that routinely costs more than the vessel and takes longer to deliver. Operators have learned that a boat waiting for power earns nothing, and builders arriving with an infrastructure partner and a grid feasibility assessment win contracts a better vessel alone would lose. Bundled bids carry 15 to 25% more contract value while removing the coordination risk that operators fear most in these programmes.
02 / CERTIFICATION COST DISCIPLINE

Buy pre-certified propulsion unless volume genuinely justifies otherwise

Classification approval for a marine battery installation costs above $300,000 per vessel design and needs expertise most boatbuilders have never had to develop, because a fire at sea has nowhere at all to go. Pre-certified propulsion packages transfer that burden to specialists who spread it across many hulls, cutting both development cost and time to market considerably in the process. For all but the largest builders, engineering a battery installation independently is a cost the resulting product simply cannot recover across realistic volumes.
03 / RESTRICTED WATER TARGETING

Sell access, because the payback calculation always fails

A recreational buyer comparing electric against petrol on running cost will not buy, since forty-two annual operating hours generate almost no fuel saving against a premium that can approach half the vessel price. A buyer who wants to use a Swiss lake or an Amsterdam canal where combustion is banned has no comparison available to make. That demand already covers above 40 restricted waterways, converts at several times general marine retail rates, and builds reference customers that no amount of marketing could otherwise buy.
04 / FLEET UTILISATION FOCUS

Chase charter operators, because their hours make it work

Charter and rental fleets run vessels at six to ten times the utilisation a private owner achieves, which makes the operating economics that fail entirely for individuals work comfortably for a commercial operator. They value quiet running and low maintenance as commercial attributes rather than emotional ones, and they replace fleets on schedules private buyers never follow. Winning them needs service coverage and uptime commitments rather than showroom presence, which suits builders organised for commercial selling rather than for retail dealer distribution.

Engagement Snapshot From the Field

A live engagement with an industry participant carrying material or product regulatory and market exposure ahead of a defining policy shift, showing how our research translates into a defensible multi-year portfolio strategy.
MARKET MINDS ADVISORY · CLIENT ENGAGEMENT SUMMARY
Electric Boats Producer Strategic Portfolio Review and Transition Roadmap 2026·Investment Scenario on Electric Boats Exposure Evaluation 2025-26
CLIENT PROFILE
A Northern European builder of recreational electric day boats selling through marine dealers across several countries, with revenue near EUR 28 million (client-reported, unverified by MMA). The business engineered its own battery installations, offered six hull models, and had never bid for a commercial passenger vessel contract of any kind. Commercial contracts had never been pursued.
STRATEGIC CHALLENGE
Dealer conversion was poor because buyers compared the vessels against petrol equivalents and could not justify the premium, while certification costs across six models were consuming most of the engineering budget. Ferry electrification contracts were being awarded in the client's home waters to builders it considered technically inferior but who arrived with charging partners.
MMA APPROACH
MMA analysed dealer conversion against buyer location and waterway restriction status, modelled certification cost amortisation across model range options, and assessed commercial contract requirements including infrastructure bundling. Forty-seven expert interviews with dealers, ferry operators, charter fleets, and classification surveyors established how each buyer type actually decides. Decision criteria differed sharply.
KEY FINDINGS
  1. Dealer conversion in restricted waterway districts ran at nearly five times the rate achieved elsewhere, and the client had never segmented its sales effort by waterway regulation at all.
  2. Certification across six hull models cost more annually than the engineering budget for new product development, and three models shared enough architecture to have been approved together.
  3. Every ferry contract lost in two years had gone to a builder bidding vessel and shore charging together, and technical vessel evaluation had never been the deciding factor in any of them.
  4. Charter operators in the client's markets ran vessels at roughly eight times private owner utilisation and had been buying petrol craft for lack of any electric supplier approaching them.
CLIENT PROFILE
A Northern European builder of recreational electric day boats selling through marine dealers across several countries, with revenue near EUR 28 million (client-reported, unverified by MMA). The business engineered its own battery installations, offered six hull models, and had never bid for a commercial passenger vessel contract of any kind. Commercial contracts had never been pursued.
STRATEGIC CHALLENGE
Dealer conversion was poor because buyers compared the vessels against petrol equivalents and could not justify the premium, while certification costs across six models were consuming most of the engineering budget. Ferry electrification contracts were being awarded in the client's home waters to builders it considered technically inferior but who arrived with charging partners.
MMA APPROACH
MMA analysed dealer conversion against buyer location and waterway restriction status, modelled certification cost amortisation across model range options, and assessed commercial contract requirements including infrastructure bundling. Forty-seven expert interviews with dealers, ferry operators, charter fleets, and classification surveyors established how each buyer type actually decides. Decision criteria differed sharply.
KEY FINDINGS
  1. Dealer conversion in restricted waterway districts ran at nearly five times the rate achieved elsewhere, and the client had never segmented its sales effort by waterway regulation at all.
  2. Certification across six hull models cost more annually than the engineering budget for new product development, and three models shared enough architecture to have been approved together.
  3. Every ferry contract lost in two years had gone to a builder bidding vessel and shore charging together, and technical vessel evaluation had never been the deciding factor in any of them.
  4. Charter operators in the client's markets ran vessels at roughly eight times private owner utilisation and had been buying petrol craft for lack of any electric supplier approaching them.
RECOMMENDED STRATEGY
Phase 1: Phase one: refocus dealer effort and marketing on restricted waterway districts where combustion bans make the purchase a matter of access rather than economics. Phase 2: Phase two: consolidate the model range around two certified architectures, freeing engineering budget currently consumed by approving variants that share most components anyway. Phase 3: Phase three: partner with a shore charging contractor and bid commercial ferry work as a combined vessel and infrastructure proposition rather than as a boat alone.
OUTCOME
The client refocused dealer coverage within four months and conversion in targeted districts rose sharply. Model range consolidation freed engineering capacity, a first bundled ferry bid was won in the second year, and charter fleet sales reached 19% of revenue with blended gross margin up 6.7 percentage points (client-reported, unverified by MMA).

Frequently Asked Questions

Foundational context covering the market sizes, CAGR, scope, country, region and competition that inform every finding below. This section is provided to cover basics and most often pre-purchase conversations, answered from the MMA Primary Research Dataset.

What is the current size of the Electric Boats Market?

The market was valued at USD 6.4 billion in 2025, rising to an estimated USD 7.19 billion in 2026. Western Europe holds the largest regional share at 26% of global value.

How large will the Electric Boats Market be by 2036?

MMA forecasts USD 23.15 billion by 2036 under the base case, an expansion multiple of 3.22 times the 2026 value. That represents USD 15.96 billion of incremental value across the forecast period.

What is the CAGR for the Electric Boats Market 2026 to 2036?

The base case CAGR is 12.4%, with a bull case of 13.7% and a bear case of 11.2%. The spread reflects uncertainty over shore charging delivery and recreational buyer acceptance.

Which segment is growing fastest?

Hydrofoiling electric craft grow fastest at 24.6%, roughly 1.98 times the market rate, because foiling cuts energy use by three quarters. Passenger ferries follow at 15.8% on regulatory mandates.

Who are the major companies in the Electric Boats Market?

Torqeedo, Vision Marine Technologies, Candela, X Shore, and Brunswick Corporation lead on electric vessel and propulsion revenue. The top five hold only 22%, since boat building remains highly fragmented.

Which country is growing fastest?

India grows fastest at 15.8%, following the Kochi Water Metro demonstrating that electric passenger ferries work at Indian cost expectations. Inland waterway programmes provide funding and route commitments.

Report Segmentation Architecture

The full report scope spans multiple orthogonal segmentation dimensions, with cross-tabulated demand data provided for each dimension pair. Coverage extends further to regional breakdowns, trend trajectories, and the competitive detail needed to support segment-level decision-making.

By Vessel Type

  • Electric Recreational Day Boats
  • Small Craft with Electric Outboards
  • Electric and Hybrid Passenger Ferries
  • Commercial Workboats and Tenders
  • Hydrofoiling Electric Craft

By End-Use Industry

  • Public Passenger Water Transport
  • Private Recreational Boating
  • Charter and Rental Operations
  • Harbour and Port Services
  • Tourism and Sightseeing Operations

By Sales Model

  • Bundled Vessel and Charging Contracts
  • Public Procurement Tender Supply
  • Marine Dealer Retail Channel
  • Fleet Direct Supply Agreements
  • Propulsion System Supply to Builders

By Region

  • North America
  • Western Europe
  • East Asia
  • South Asia and Pacific
  • Latin America
  • Middle East and Africa
  • Eastern Europe

Scope, Methodology, and Coverage

Every figure in this report is reproducible from documented input assumptions. The scope below maps the historical period, the forecast horizon, the segmentation dimensions, and the countries covered, alongside the underlying primary and qualitative methodology.
Historical Period
2020 to 2025
Forecast Period
2026 to 2036
Base Year
2025 (USD billions; MMA Primary Research Dataset, August 2026)
Market Definition
The market comprises battery-electric and hybrid-electric watercraft, covering electric recreational day boats, small craft with electric outboards, electric and hybrid passenger ferries, commercial workboats and tenders, and hydrofoiling electric craft. Value is measured at builder level and includes integrated propulsion and battery systems supplied within the vessel. Standalone outboard motors sold separately into the aftermarket, large ocean-going merchant vessels, submarines and naval craft, marine batteries sold as components, and shore charging infrastructure fall outside scope.
Quantitative Units
USD billions (current prices); vessels delivered annually by type; USD per vessel by type and passenger capacity
Segmentation Dimensions
By Vessel Type; By End-Use Industry; By Sales Model; By Region
Regions Covered
North America, Western Europe, East Asia, South Asia and Pacific, Latin America, Middle East and Africa, Eastern Europe
Countries Covered
Norway, Sweden, Denmark, Netherlands, Germany, Switzerland, Italy, France, United Kingdom, Spain, Croatia, Poland, Hungary, Romania, United States, Canada, China, Japan, South Korea, India, Australia, New Zealand, Indonesia, Philippines, Brazil, Colombia, Chile, United Arab Emirates, Egypt, Kenya
Key Companies Profiled
Torqeedo, Vision Marine Technologies, Candela, X Shore, Brunswick Corporation, Yamaha Motor, ePropulsion, Elco Motor Yachts, Duffy Electric Boat, RAND Boats, Q-Yachts, Greenline Yachts, Damen Shipyards, Wärtsilä, Corvus Energy, Leclanché, Fjellstrand, Havyard, Incat Crowther, Artemis Technologies
Quantitative Methodology
Primary survey, n=3,800 respondents, Q4 2025, six countries; demand-side model with trade association cross-validation
Qualitative Methodology
47 expert interviews, Q4 2025; applied to validate demand model assumptions, identify emerging dynamics, and assess competitive positioning
Report Format
PDF and XLSX data workbook (Word format preview document)
Publisher
Market Minds Advisory
Report Code
MMA-2026-CON-178
Published
August 2026
Contact
sales@marketmindsadvisory.com | www.marketmindsadvisory.com

Purchase the full Electric Boats Market Report (2026 to 2036).

The full report sizes electric vessel demand across five vessel types, five end-use categories, and seven regions with 2026 to 2036 forecasts under base, bull, and bear cases. It separates mandated commercial demand from discretionary recreational purchasing, since the two behave as entirely different markets. Competitive profiles cover twenty builders and propulsion suppliers assessed consistently on electric vessel revenue, certification position, and charging delivery capability. Cost analysis traces battery, hull, and certification exposure by build volume and sourcing route. Commercial guidance addresses charging delivery, certification discipline, restricted water targeting, and fleet utilisation focus.
Five vessel types sized separately by region
Mandated ferry demand separated from recreational purchasing
Shore charging grid works modelled as programme critical path
Hydrofoil energy advantage quantified against displacement hulls
Waterway combustion restrictions mapped as protected demand
Certification cost amortisation compared across model range strategies

Built For The People Who Decide

From boardroom strategy to bench-side execution, this report is read cover-to-cover by leaders shaping the next decade of their industry, turning demand scenarios, market dynamics and valuation benchmarks into decisions.
CXOs/ Presidents/ VPs/ Managers
M&A and Corporate Development
Strategy Teams and R&D Heads
Procurement and Product Directors
Regulatory and Compliance Leaders
Investor Relations and Equity Analysts