Market Minds Advisory
E-Rickshaw Market

E-Rickshaw Market: Driver Financing, the Informal Assembly Problem, and the Lead-Acid to Lithium Transition

The largest electric vehicle fleet on earth by unit count is bought by drivers earning daily wages, which makes credit availability rather than battery technology the binding constraint on adoption.

Lead Analyst

David Horsley

Published

September 2026

Make Smarter Decisions with Customized Research Insights

Request a free sample report and evaluate market opportunities, growth trends, and competitive dynamics relevant to your business needs.

2025 MARKET VALUE$3.4BMarket Size 2025
2036 FORECAST VALUE$11.4BBase Case , 2026 to 2036
CAGR 2026 TO 203611.6 %Bull 12.8% / Bear 10.4%
INCREMENTAL OPPORTUNITY$7.6BNet 10- year value creation
EXPANSION MULTIPLE3.00x2036 value over 2026 base
Strategic Levers
M&A Pipeline
Regional Outlook
Country Rankings
Competitive Intelligence
Segmental Deep-dive
Call-Us : 91 93563 13602

Executive Snapshot and Market Trajectory

More electric vehicles operate in this category than in any other worldwide, and almost nobody in the automotive industry counts them. They are bought by drivers earning daily cash income, which means the financing structure decides adoption far more than any specification does. Nothing about this market resembles conventional automotive.
Commercial power sits with manufacturers who arranged credit for their buyers rather than with anyone able to assemble a three-wheeler. L5 passenger e-autos grow fastest at 16.8%, roughly 1.45 times the market, as permitted high-speed vehicles displace compressed gas autos on city routes. South Asia and Pacific holds 52% of global value, far above any normal regional band, because this vehicle is genuinely a South Asian invention.
Concentration is low at roughly 27% for the top five, and 44% of vehicles are built by unregistered assemblers from imported kits. Lithium reaches only 38% of new vehicles despite lasting several times longer than lead-acid, because a driver who cannot borrow buys the cheaper battery and pays again within a year. Battery choice follows credit access rather than any calculation about cost per kilometre driven. Enforcement against unregistered assembly is what changes that arithmetic.
Market Definition
The market comprises battery-electric three-wheeled vehicles for passenger and goods transport, covering L3 passenger e-rickshaws, L3 cargo e-loaders, L5 passenger e-autos, L5 cargo three-wheelers, and municipal and special purpose three-wheelers. Value is measured at manufacturer level across organised and informal assembly. Two-wheelers, four-wheeled microcars, internal combustion and compressed gas three-wheelers, standalone battery and swapping infrastructure, and pedal-powered cycle rickshaws fall outside scope.
Base Year Value
$3.4B in 2025 (MMA Primary Research Dataset, August 2026)
Forecast Period
2026 to 2036, eleven discrete annual values
CAGR
11.6% base case. Bull 12.8%. Bear 10.4%.
Fastest Growth Segment
L5 Passenger E-Auto: 16.8% CAGR
Fastest Growth Country
India: 14.2% CAGR
Fastest Growth Region
South Asia and Pacific: 13.8% CAGR
Largest Region
South Asia and Pacific: 52% of 2025 global value
Market Leaders
Mahindra Last Mile Mobility, Bajaj Auto, Piaggio Vehicles, YC Electric Vehicle, and Kinetic Green lead on electric three-wheeler shipments. Source: company annual reports and MMA Analysis, July 2026.
Primary Survey
n=3,800 procurement and R&D decision-makers, Q4 2025, six countries
Methodology
Demand-side build-up, cross-validated against public data, 47 expert interviews

E-Rickshaw Market Forecast Scenarios

e-rickshaw-market-size-forecast-scenario-1787549307624
Between 2020 and 2025 this market grew faster than almost any vehicle category anywhere and did so largely outside official statistics. Informal assemblers supplied most units early on, organised manufacturers entered as volumes became impossible to ignore, and lithium began from nothing. Subsidy schemes came and went unpredictably. The 10.2% historical growth understates unit growth because average prices fell throughout.
The 11.6% base case rests on three mechanisms. Last-mile delivery demand from e-commerce and quick commerce keeps expanding the cargo three-wheeler fleet in cities where four-wheeled vehicles cannot operate economically. Homologation enforcement is shifting volume from informal assemblers toward organised manufacturers at higher unit values. And driver financing is becoming genuinely available as lenders build repayment data on a borrower class they previously could not assess. None of the three depends on any improvement in the vehicle itself.
The 12.8% bull case assumes financing access broadens and permit regimes favour electric over compressed gas autos more decisively. The 10.4% bear case reflects subsidy withdrawal, lending contraction among the non-bank financiers who serve these buyers, and lead-acid remaining dominant because drivers cannot fund the better option. Credit availability separates the two cases more than anything technical.

The Biggest Electric Fleet Nobody Counts

Three things set the commercial shape of this market. Credit access comes first, because the buyer is a driver with daily cash income and no formal financial history, and whoever solves that problem sells the vehicle. Regulatory class comes second, since low-speed vehicles below a power threshold escape registration and licensing in India while faster ones require permits. Battery choice comes third and follows directly from the first.
TOP-FIVE CONCENTRATION27%Share of global three-wheeler shipments held by leading manufacturers
AVERAGE SELLING PRICEUSD 1,640 per vehicleTypical retail pricing across mainstream passenger vehicle configurations
LITHIUM BATTERY SHARE38%Portion of new vehicles fitted with lithium chemistry packs
BATTERY COST SHARE34%Battery pack cost within total vehicle manufacturing cost
DAILY OPERATING RANGE88 kilometresTypical distance covered by a working vehicle each day
INFORMAL SECTOR SHARE44%Portion of vehicles built by unregistered small assemblers
The lead-acid problem illustrates the whole market. A lithium pack lasts several times longer and costs less per kilometre driven, and lead-acid still takes 62% of new vehicles because it costs less on the day of purchase. A driver who cannot borrow rationally chooses the option that dies in a year, and then pays for a replacement out of earnings.
Informal assembly is the industry's defining oddity. Roughly 44% of vehicles are built by small workshops from imported kits with no homologation, no warranty, and no crash structure worth the name, competing on a price organised manufacturers cannot approach. Enforcement is tightening, and that shift rather than any demand trend is what will most change this industry over the forecast period.
"Everyone analysing this market talks about battery chemistry, and the driver is not making a battery decision. He is deciding whether he can afford anything today and pay the rest from tomorrow's fares. Solve that and the chemistry question answers itself; ignore it and the best product in the market sits unsold."
Practice Director, Emerging Mobility and Commercial Vehicles · MMA Automotive and Mobility Practice · August 2026

Market Trends

Homologation Enforcement Shifts Volume Toward Organised Manufacturers

Roughly 44% of vehicles come from unregistered workshops assembling imported kits without homologation, warranty, or meaningful crash structure, and enforcement against them has tightened steadily as accident data accumulated and registration systems improved. Each enforcement step moves volume toward organised manufacturers at materially higher unit values, since a compliant vehicle costs more to build and carries a warranty behind it. That transition raises market value faster than unit growth alone would suggest. Manufacturers positioned in the price bands informal assemblers occupied are best placed to capture the volume as it moves across.
Market Impact: Financing covers above 70%

Quick Commerce Expands Cargo Three-Wheeler Fleet Demand

Grocery and parcel delivery promising arrival within minutes rather than days requires dense urban fleets, and three-wheelers reach addresses and operate at costs that vans simply cannot match in congested Indian and Southeast Asian cities. Cargo variants grow faster than passenger vehicles as a result, and fleet operators buying in volume behave quite differently from individual driver-owners. They finance conventionally, specify lithium for uptime, and negotiate service terms. That customer type barely existed five years ago and is now the most attractive segment in the market for organised manufacturers to pursue.
Market Impact: L5 autos grow at 16.8%

Market Opportunities and Growth Drivers

Driver Financing Availability Determines Who Actually Buys

The typical buyer earns daily cash income, holds no formal credit history, and cannot fund a vehicle outright, which makes lending availability the binding constraint on adoption rather than price or product. Non-bank financiers have built repayment data on this borrower class over several years and now lend against it at rates that work, and manufacturers arranging that credit alongside the vehicle convert enquiries competitors cannot. Daily or weekly collection matched to earnings patterns rather than monthly instalments is what makes the repayment structure viable for the borrower at all.
Market Impact: Lead-acid fits 62% of vehicles

Permit Regimes Favour Electric Over Compressed Gas Autos

City authorities across India have restricted new permits for compressed gas and petrol three-wheelers while issuing them freely for electric equivalents, which converts a fuel choice into a market access question. L5 passenger e-autos grow at 16.8% largely because of it, taking routes and stands that compressed gas vehicles previously held. Operating cost favours electricity heavily on urban duty cycles regardless, and the permit position removes any remaining hesitation. Drivers replacing an ageing compressed gas vehicle now face a choice where only one option comes with a permit attached. Only one option now comes with a permit.
Market Impact: Networks cover under 20% of routes

Market Restraints and Challenges

Lead-Acid Persists Because Drivers Cannot Fund the Alternative

Lithium packs last several times longer and cost less per kilometre, yet lead-acid still fits 62% of new vehicles because it costs far less on the day of purchase. The root cause is credit rather than ignorance: a driver without borrowing capacity rationally chooses the cheaper option today and funds replacement from earnings within a year. Battery-as-a-service and pack financing address it directly where lenders will participate. Informal lead-acid recycling adds a genuine environmental cost that regulation is only beginning to reach and that the market does not price at all.
Market Impact: Informal assembly holds 44% share

Battery Swapping Standards Remain Fragmented and Uninteroperable

High-utilisation duty cycles suit swapping better than charging, since a working driver cannot afford hours of downtime, and several operators have built networks around it. The root cause of slow progress is that every network uses its own pack format, connector, and software, so a driver is locked to whichever provider covers their route. That fragmentation caps network density below the level that makes swapping genuinely convenient anywhere. Manufacturers mitigate by supporting multiple formats, backing standardisation efforts, and offering fast charging as an alternative for lower-utilisation buyers. Network density stays below the level convenience actually requires.
Market Impact: Cargo variants grow above 13%
4 additional market trends, 3 additional growth drivers, and 2 additional restraints and challenges are covered in the full report. Contact sales@marketmindsadvisory.com to access the complete intelligence.

Segment CAGR and Growth Architecture

Segmentation follows vehicle class and duty, because class determines the regulatory treatment, permit requirement, speed capability, payload, and price band a vehicle occupies. Five classes cover commercial supply, and the boundary between low-speed exempt vehicles and permitted higher-speed ones matters more commercially than any technical difference between them does. Price bands differ by a factor of three across them.
e-rickshaw-market-market-share-analysis-1787549308177

L5 Passenger E-Auto

The fastest-growing class at 16.8%, roughly 1.45 times the market, and the one displacing an incumbent rather than creating new demand. Higher-speed permitted three-wheelers carry more passengers at greater speed than exempt e-rickshaws and compete directly against compressed gas autos on established city routes and stands. Permit policy favouring electric over gas has made the substitution close to one-directional. Unit prices run well above L3 vehicles, which raises value faster than unit share, and buyers are more often experienced auto drivers replacing a vehicle than first-time entrants. Organised manufacturers including Bajaj, Piaggio, and Mahindra hold most of this segment, since homologation is enforced properly here. Homologation is enforced properly in this class, which keeps informal assemblers out of it.
CAGR 16.8%

L5 Cargo Three-Wheeler

Second fastest at 15.4%, and driven by fleet buyers rather than by individual owner-drivers. Quick commerce, parcel delivery, and business-to-business distribution in congested cities all need vehicles that reach addresses vans cannot and cost far less to run than any four-wheeled alternative. Fleet operators finance conventionally, specify lithium because downtime costs them directly, and negotiate service and uptime terms that individual buyers never ask about. That makes this the most commercially attractive segment for organised manufacturers despite smaller volumes than passenger classes. Payload, load geometry, and service network reach decide awards rather than purchase price, which is unusual in this market. Purchase price decides very little here, which is genuinely unusual in this market.
CAGR 15.4%
Full segment breakdown across 5 segments available in the complete report.

Regional Architecture and Country Demand Map

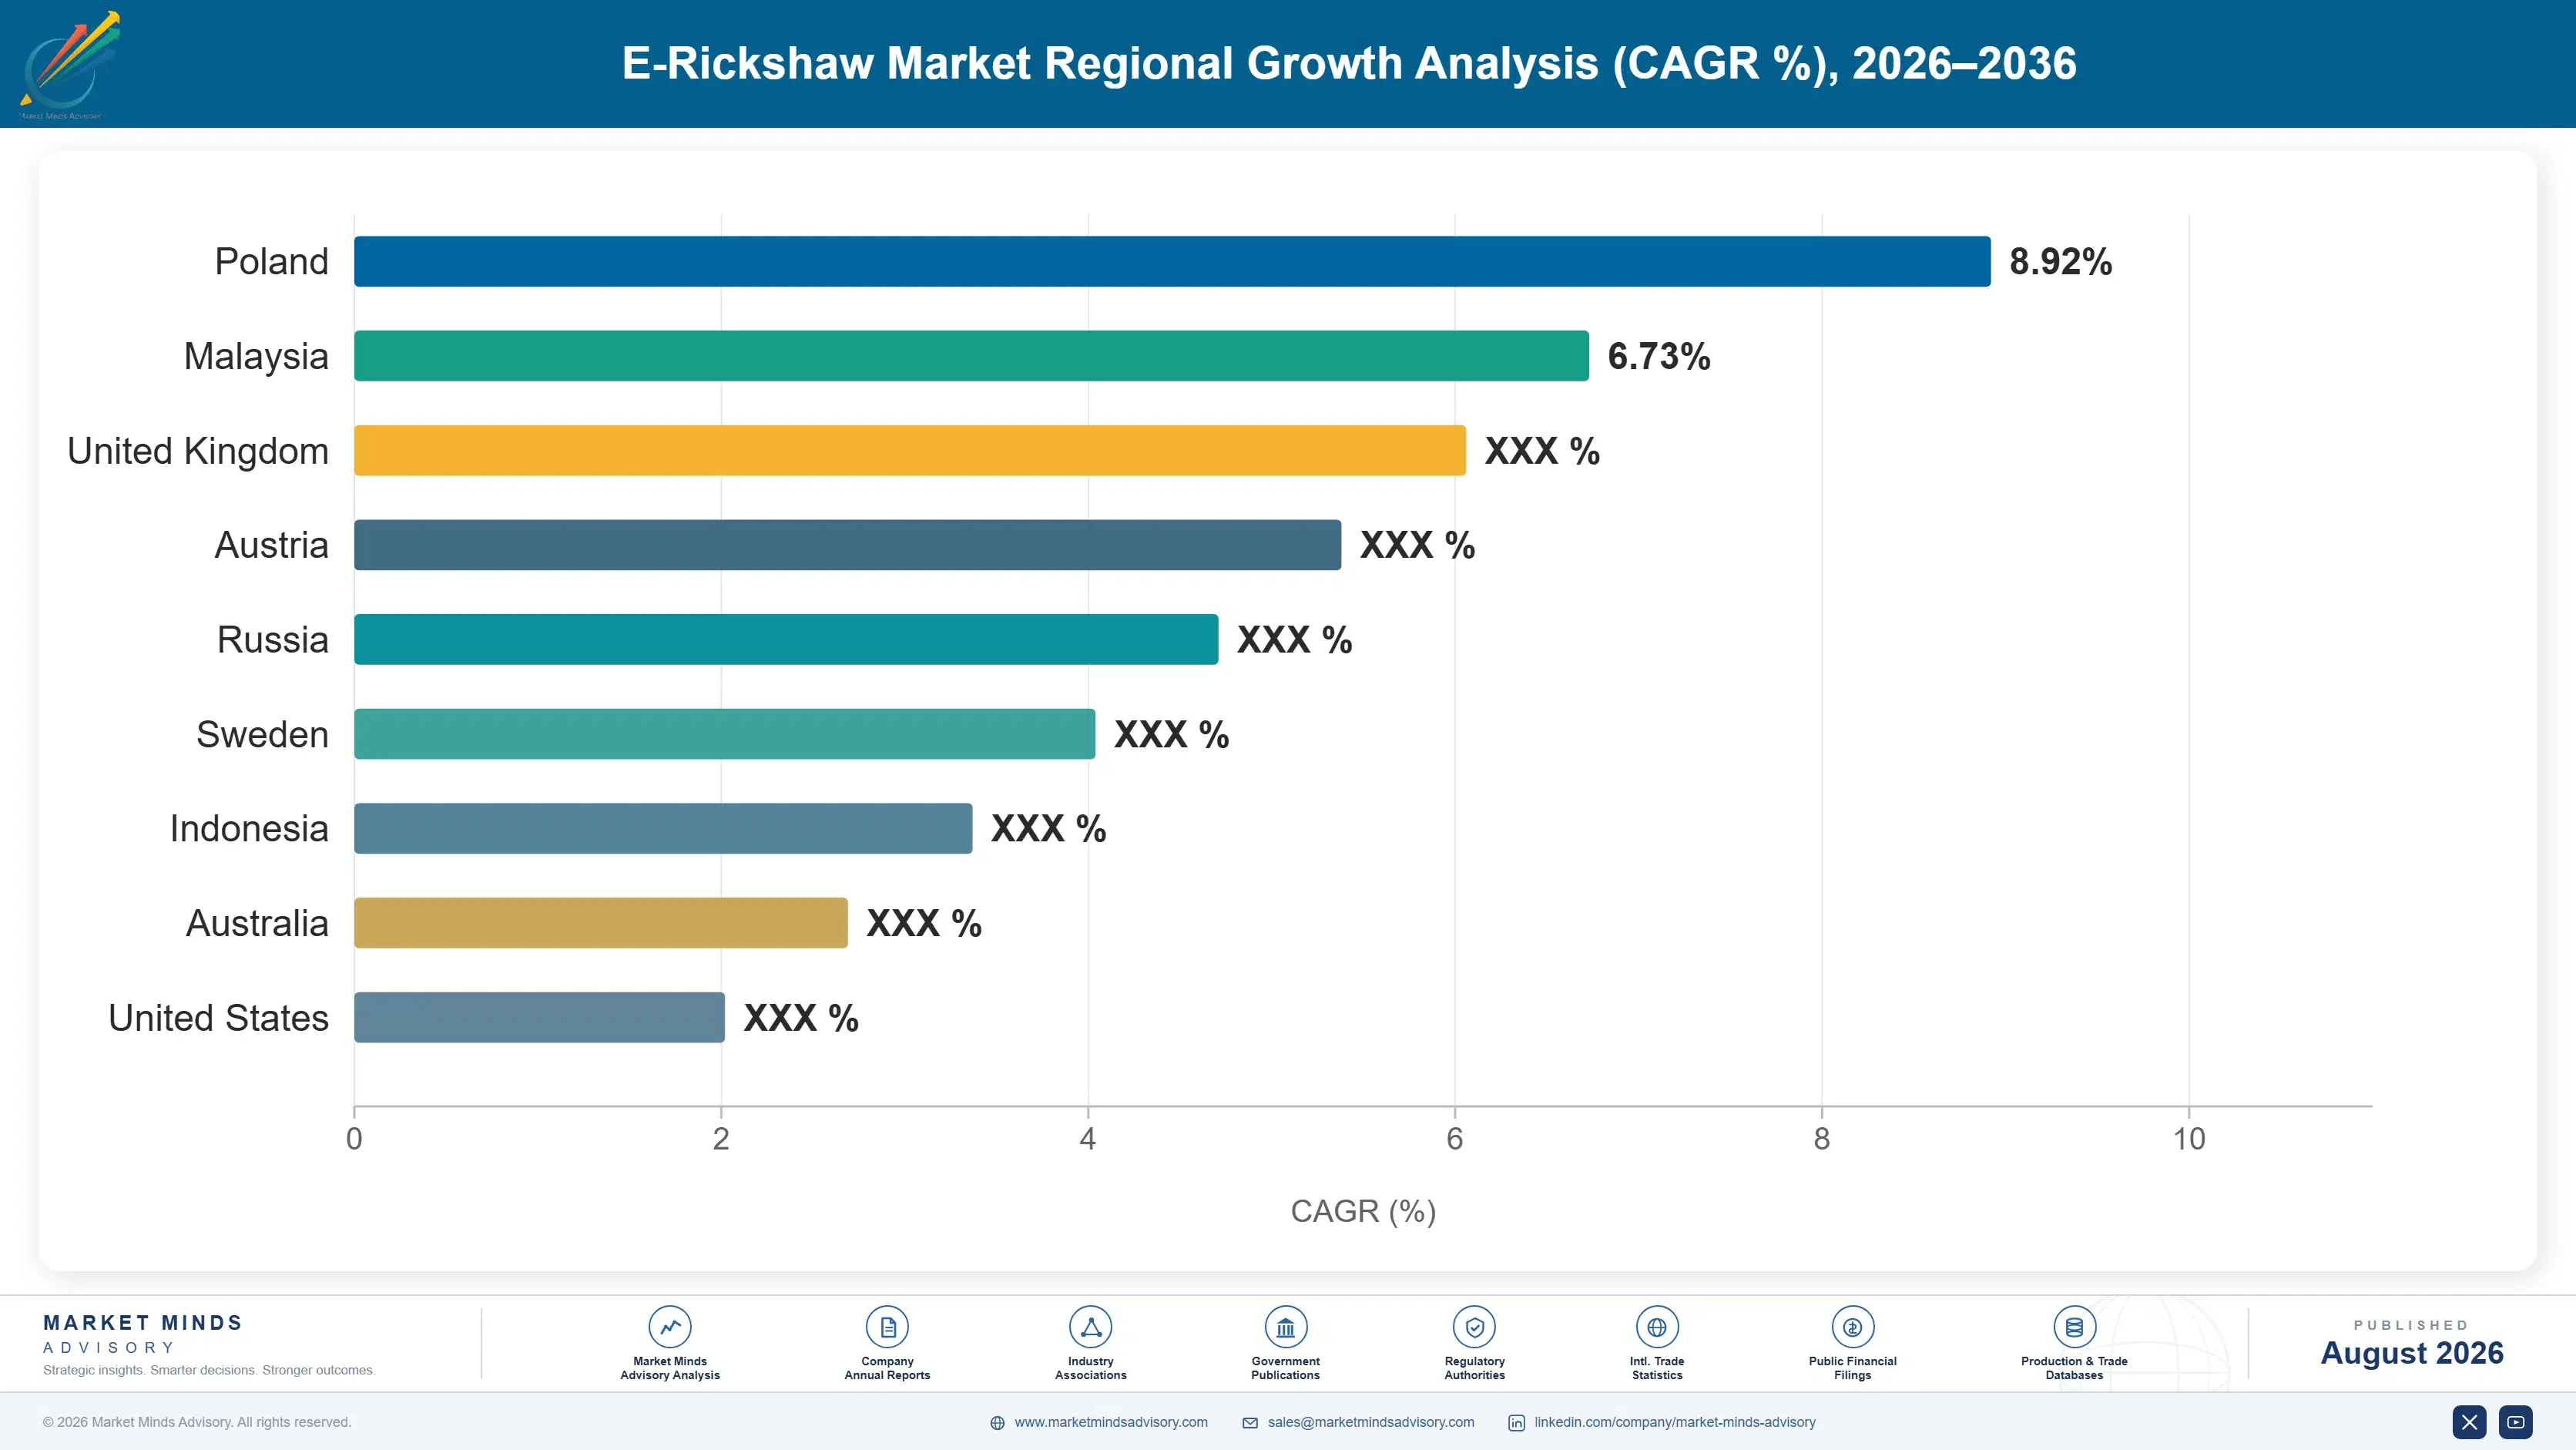
Regional shares here depart sharply from normal distribution because this vehicle class is a South Asian invention that has spread only partially elsewhere. Several regions sit well outside typical bands, and the justification for each appears in the relevant regional commentary below. Financing structures vary as much as regulation.

North America

This region sits far below its normal share band, at 3%, because electric three-wheelers of this type have almost no role in North American transport and the justification is straightforward: road design, vehicle safety regulation, and distances all rule them out for passenger use. What demand exists concentrates in campus, resort, municipal, and industrial site applications where low-speed electric vehicles operate on private roads under different rules. Some last-mile delivery pilots have run in dense city centres with mixed results, since winter operation and traffic speeds both create problems. Growth of 12.4% comes off a base small enough that individual fleet orders move it noticeably. Regulatory pathways for road use remain the fundamental obstacle.
Share: 3% | CAGR: 12.4% (2026 to 2036)

Western Europe

At 4%, this region also sits far below its normal band, and the reason is regulatory rather than commercial: European vehicle type approval has no comfortable category for a low-cost low-speed three-wheeler, and the safety and emissions framework was not written with them in mind. Cargo cycles and quadricycles occupy the niche that e-rickshaws fill elsewhere. Some cargo three-wheeler deployment has happened in Italian, Spanish, and Dutch cities where narrow streets favour small vehicles and last-mile operators need them. Tourist and municipal applications add modest volume. Growth of 10.0% is the slowest in the report and reflects a base constrained by approval rules rather than by any absence of urban logistics demand.
Share: 4% | CAGR: 10.0% (2026 to 2036)
Regional intelligence for 5 additional markets available in the complete report: East Asia, South Asia and Pacific, Latin America, Middle East and Africa, Eastern Europe. Contact sales@marketmindsadvisory.com.
e-rickshaw-market-country-cagr-analysis-1787549308691

Four Moves That Change the Economics

Advantage here comes from credit arrangement, service reach, and fleet relationships rather than from vehicle engineering, which is modest and widely copied. Four moves are worth capital and management attention across the forecast period, and the first addresses the constraint that actually decides whether a vehicle sells at all. The remaining three follow from that same constraint.

Arrange driver credit alongside every vehicle sold

The buyer earns daily cash income with no formal credit history, which makes lending availability rather than price the binding constraint on adoption. Manufacturers partnering with non-bank financiers to offer daily or weekly repayment matched to earnings convert enquiries that competitors simply lose. Financed sales typically run 2 to 3 times the conversion rate of unfinanced equivalents at the same price point. The investment is partnership structuring, dealer training, and sometimes first-loss guarantees rather than any product development, and the resulting relationship extends into replacement purchases years later. Replacement purchases follow years later from the same relationship.
Market Impact: Lifts conversion by 2 to 3 times overall

Sell lithium through a battery subscription model

Lithium costs less per kilometre and lasts several times longer, and lead-acid still fits 62% of vehicles purely because it costs less on purchase day. Separating the pack from the vehicle and charging a monthly or per-kilometre fee removes the upfront barrier entirely and captures a recurring revenue stream worth 30 to 45% of the vehicle price over its life. It requires balance sheet capacity or a financing partner to hold the asset. Manufacturers who structured this properly are selling lithium into a customer base that could not otherwise buy it.
Market Impact: Captures 30 to 45% of the vehicle price

Target fleet buyers rather than individual owner-drivers

Quick commerce and parcel operators finance conventionally, specify lithium because downtime costs them directly, negotiate service terms, and buy in volume rather than one vehicle at a time. That customer barely existed five years ago and is now the most attractive in the market, with cargo variants growing above 13%. Winning them requires uptime commitments, service network coverage, and payload engineering rather than the lowest price. Manufacturers organised around individual retail selling frequently cannot serve fleet requirements at all, which leaves the segment surprisingly open. The segment is surprisingly open as a result of that gap.
Market Impact: Cargo fleet demand now grows above 13% annually

Position deliberately for informal sector displacement

Unregistered workshops build 44% of vehicles from imported kits without homologation or warranty, and enforcement against them tightens with every accident study and registration system upgrade. That volume moves to organised manufacturers at higher unit values as it transitions, but only to those with products in the price bands informal assemblers occupied. Building a compliant entry model deliberately priced against that gap captures the shift rather than watching it pass to competitors. It requires accepting thinner margin on an entry product in exchange for volume that arrives on a regulatory timetable.
Market Impact: Targets 44% of the current total market volume

Who Controls the Margin Pool

Concentration is low at roughly 27% for the top five, which reflects a market where 44% of production comes from unregistered workshops that no market share table captures properly. Mahindra Last Mile Mobility and Bajaj Auto lead among organised manufacturers through dealer networks, service reach, and financing partnerships built over decades in three-wheelers generally. Piaggio, YC Electric, and Kinetic Green hold substantial positions with different regional and segment strengths across the Indian market.
Competitive activity runs on three fronts. Financing partnership is the first and most decisive, because a manufacturer without a credit answer loses buyers who wanted the vehicle. Service network density is the second, since a driver whose vehicle stops earns nothing that day. Fleet capability is the third, and it separates manufacturers able to serve commercial operators from those organised only for retail selling.

Pressure is building from two directions. Chinese manufacturers export at price points Indian organised producers rarely match, particularly into African and Latin American markets. And electric-native startups including Euler and Altigreen compete on purpose-built cargo platforms rather than adapted passenger designs. Both compete on ground the established Indian manufacturers built their positions on.
e-rickshaw-market-company-positioning-matrix-1787549309207

Competitive Moat and Risk Dimensions

MAHINDRA LAST MILE MOBILITY

Moat: Dealer network and financing reach

Decades of three-wheeler distribution across small Indian towns, combined with group financing capability that can lend to buyers no bank will assess, give Mahindra reach that new entrants cannot replicate at any speed. The dealer who arranges the loan, delivers the vehicle, and services it locally is the entire commercial proposition in this market.
MAHINDRA LAST MILE MOBILITY

Risk: Cost position against informal assembly

A compliant homologated vehicle carries costs that unregistered workshops assembling imported kits simply do not, and price-sensitive first-time buyers frequently choose the cheaper option regardless of warranty or safety. That gap only closes if enforcement tightens on a timetable no manufacturer controls, and progress has been uneven across states.
BAJAJ AUTO

Moat: Three-wheeler engineering and export base

Long-established three-wheeler engineering, manufacturing scale, and an export network reaching Africa, Latin America, and Southeast Asia give Bajaj a position spanning far more than the Indian market. Brand recognition among auto drivers built over generations carries directly into the electric transition without needing to be rebuilt.
BAJAJ AUTO

Risk: Late positioning in low-speed segment

Strength in permitted higher-speed autos does not extend automatically into the exempt low-speed e-rickshaw class where informal assemblers and specialist producers established themselves first. That segment carries the volume even if the higher class carries the value, and building position there means competing on a cost basis quite different from the company's traditional business.

Players Tracked

Prominent Players

Mahindra Last Mile Mobility
Bajaj Auto
Piaggio Vehicles
YC Electric Vehicle
Kinetic Green

Other Key Players

Atul Auto
TVS Motor Company
Terra Motors
Saera Electric Auto
Dilli Electric Auto
Speego Vehicles
Lohia Auto Industries
Thukral Electric Bikes
Jezza Motors
Euler Motors
Altigreen Propulsion Labs
Omega Seiki Mobility
Jiangsu Jinpeng Group
Zongshen Industrial Group
Champion Poly Plast

Recent Developments

MARCH 2025

Manufacturer launches battery subscription for driver buyers

A battery-as-a-service offer separating the pack from the vehicle was introduced, charging a monthly fee matched to typical driver earnings rather than requiring upfront lithium purchase. The structure targets buyers who would otherwise fit lead-acid packs needing replacement within a year of purchase. Uptake exceeded expectations.
Signal: Separating the battery from the vehicle is how lithium reaches buyers who cannot fund it upfront
JULY 2025

Quick commerce operator orders cargo three-wheeler fleet

A grocery delivery platform contracted a substantial fleet of lithium cargo three-wheelers with uptime and service commitments attached, rather than purchasing vehicles on price. Fleet specification emphasised payload geometry and service response over purchase cost in a way individual buyers never do. Service response times were contracted.
Signal: Fleet buyers behave nothing like driver-owners, and manufacturers organised only for retail simply cannot serve them
OCTOBER 2025

State tightens homologation enforcement on three-wheelers

Registration authorities in an Indian state began refusing plates for vehicles lacking valid type approval, affecting assemblers who had operated outside the framework for years. Organised manufacturers reported enquiry increases in the affected price bands within weeks of enforcement beginning properly. Assemblers protested the change.
Signal: Enforcement moves volume immediately, which rewards the manufacturers already holding products at informal sector price points

What Sets the Cost Base

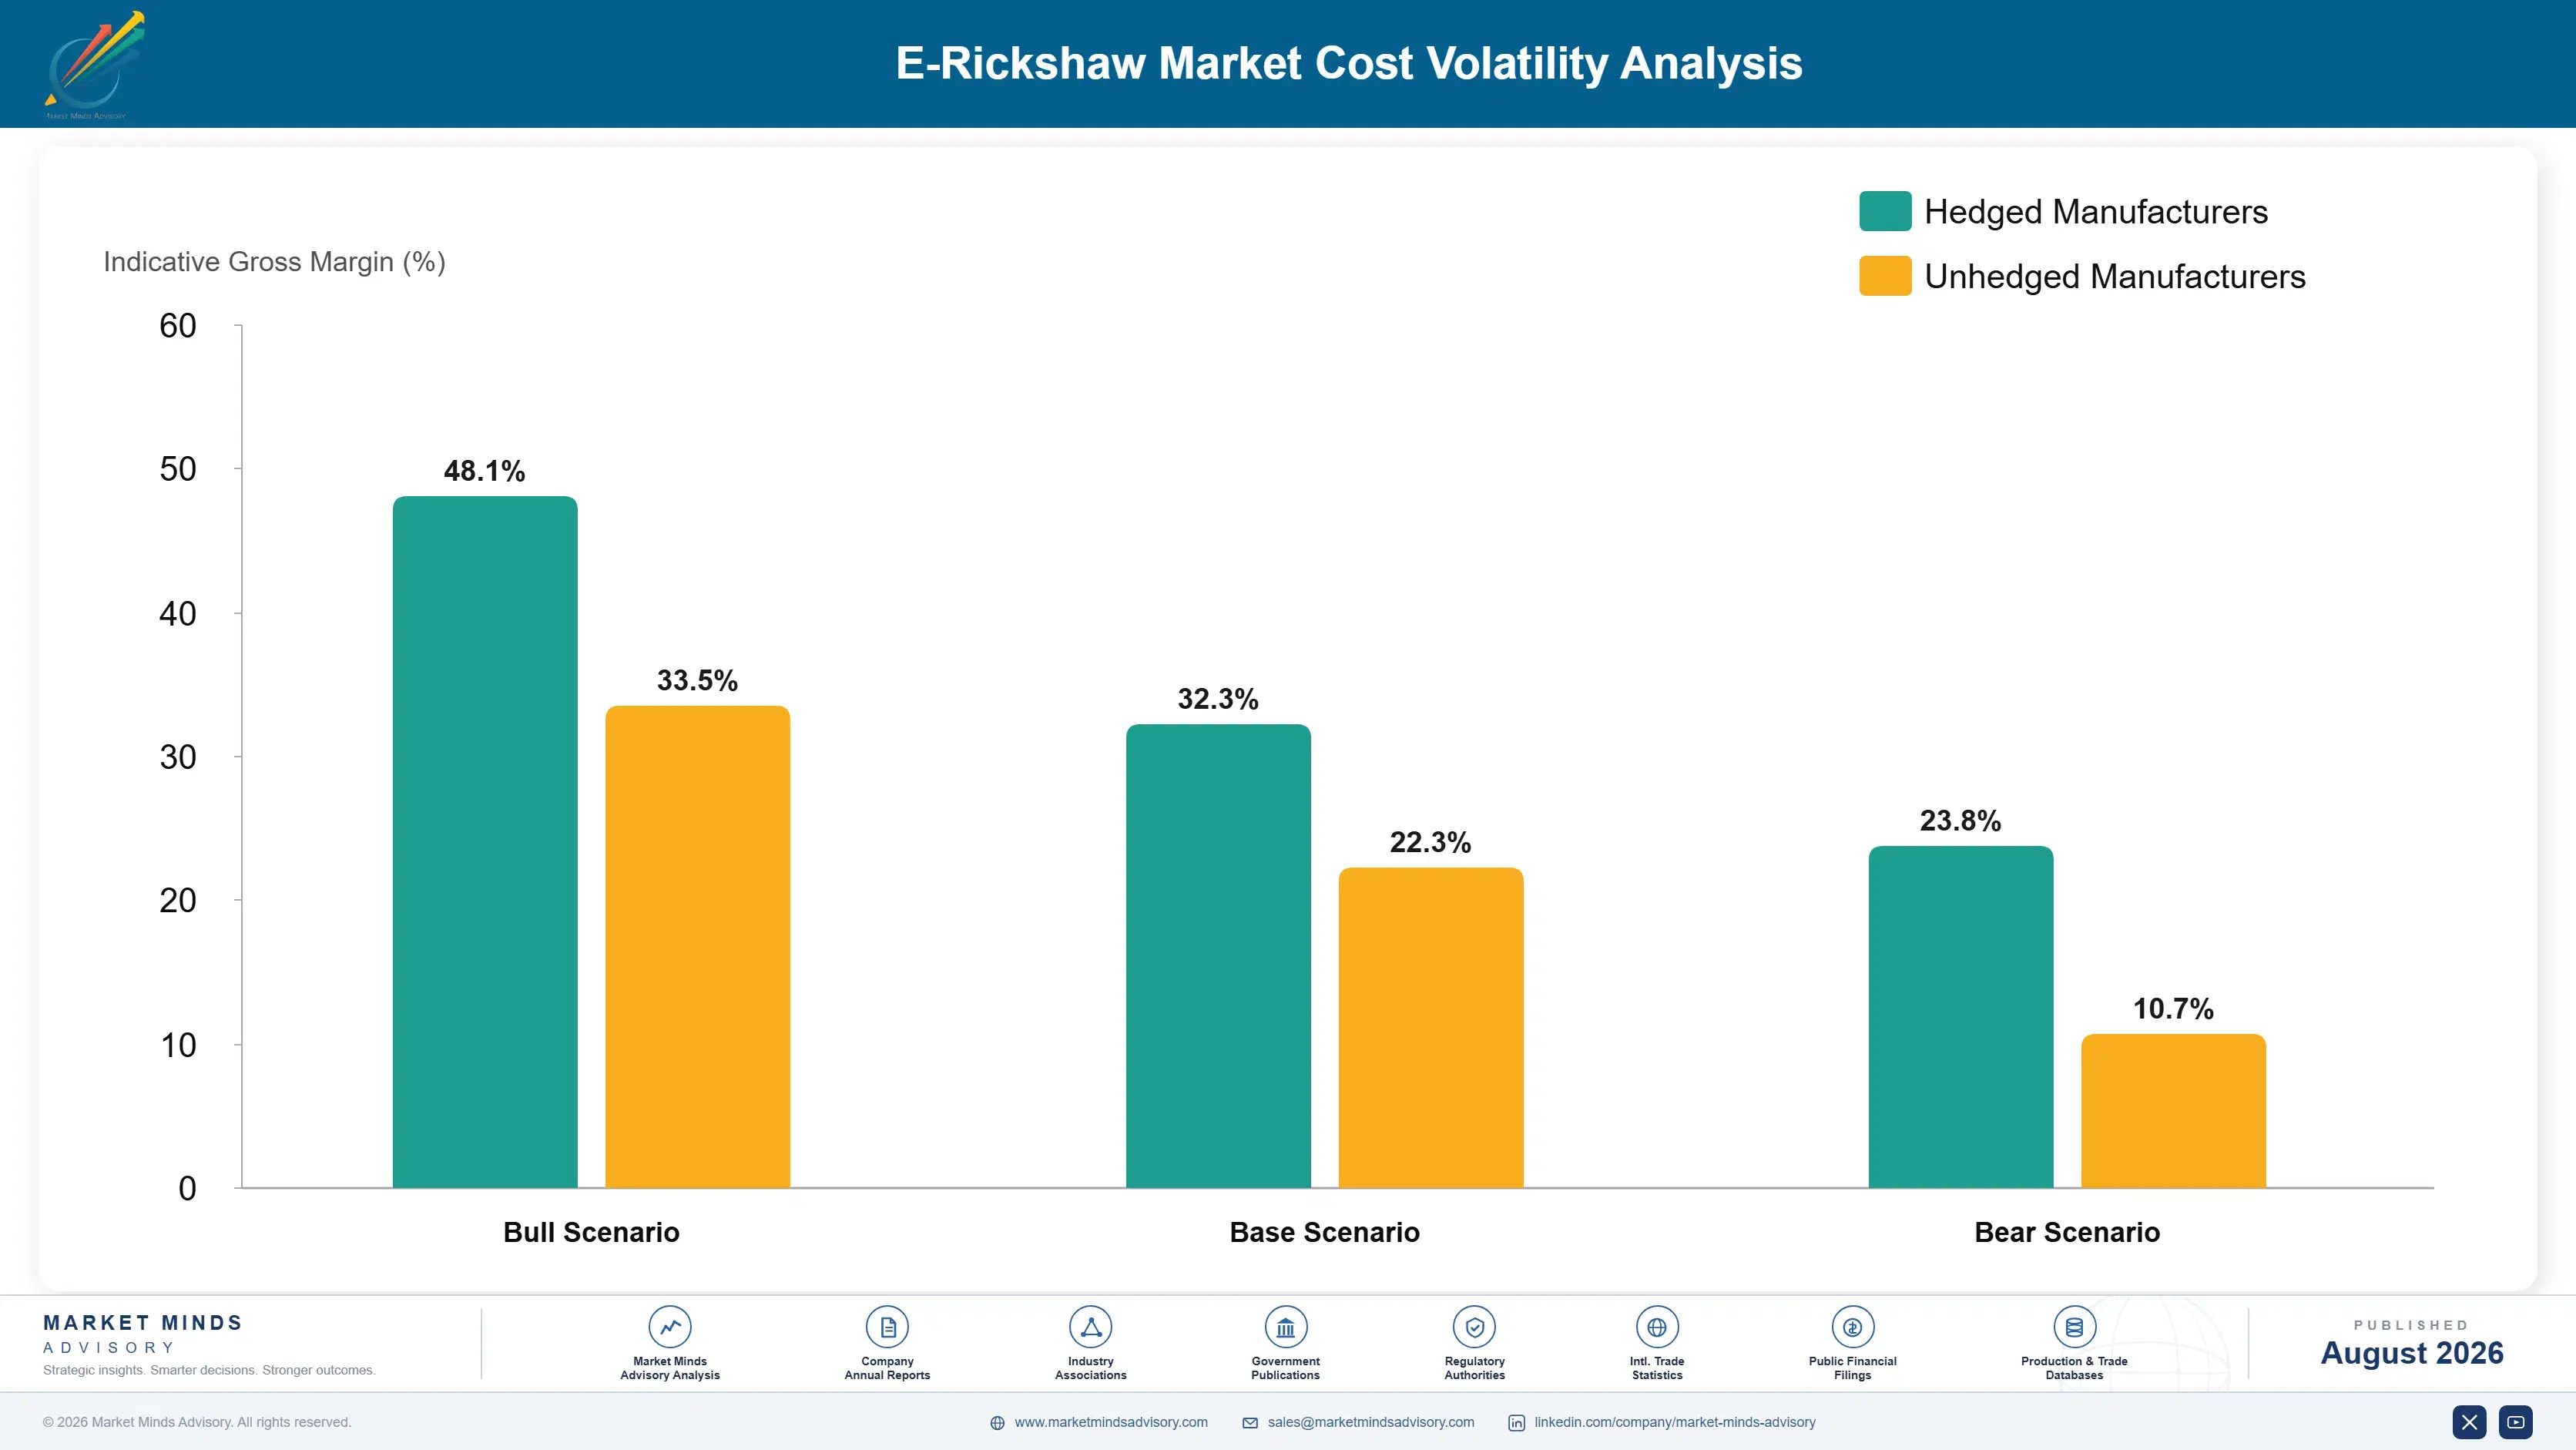
The battery pack dominates at roughly 34% of vehicle manufacturing cost, and the gap between lead-acid and lithium is what makes it the defining commercial variable rather than merely the largest line. Steel chassis, body panels, and fabrication contribute 21%. Motor, controller, and wiring take 18%, with most controllers imported. Seating, canopy, glazing, and fittings absorb the remainder.
Lithium cell pricing fell substantially through 2023 and 2024 after the extraordinary lithium carbonate spike of 2022, which improved the case for lithium packs considerably without solving the upfront affordability problem. Lead prices moved less dramatically but remain exposed to recycling supply and Chinese smelter policy. Mahindra and Bajaj both referenced input cost movement and pricing actions across their reporting for those years. Imported controller and cell supply also exposed manufacturers to currency movement throughout.

Exposure divides on battery sourcing and localisation rather than on scale. Manufacturers importing complete cells carry currency and supply risk that those buying from emerging domestic cell capacity increasingly avoid. Informal assemblers carry a quite different structure entirely, buying imported kits at prices that reflect no homologation, testing, warranty provision, or service obligation whatsoever. Compliance cost is the whole gap between the two business models.
e-rickshaw-market-cost-volatility-analysis-1787549309402

Qualify domestic cell supply as capacity commissions

Imported cells carry currency exposure, freight cost, and lead time that domestic capacity increasingly avoids as Indian and Southeast Asian plants commission. Qualifying those sources before capacity is fully committed secures allocation and pricing. Cell qualification requires testing across the pack design and thermal validation, which takes months and cannot be compressed once a supply disruption has already begun.

Standardise pack architecture across vehicle classes

Running different pack designs across L3 and L5 vehicles multiplies engineering, spares, and testing burden without delivering anything a customer values. A common architecture scaled by module count raises volume per part number and simplifies service enormously. The trade-off is accepting some weight and packaging penalty at the extremes of the range, which most manufacturers find entirely acceptable.

Localise controller and motor sourcing progressively

Controllers and motors are 18% of cost and largely imported, which exposes manufacturers to currency and shipping risk on a price-sensitive product with thin margins. Domestic supply is developing and qualification takes time and engineering attention. Manufacturers who began localisation early hold cost positions that importing competitors cannot match when currency moves against them.

Portfolio Architecture for Margin Defence

Margin follows financing attachment and customer type rather than vehicle specification. Entry-level lead-acid passenger vehicles sold to individual drivers on price earn very thin returns, because informal assemblers set the price and organised manufacturers carry compliance cost those workshops avoid entirely. Fleet cargo vehicles and financed lithium sales earn considerably more, since those buyers pay for uptime, service, and total operating cost rather than for the lowest purchase price.
The volume and premium tension shows in dealer economics rather than in factory loading. Entry vehicle volume justifies the dealer and service network that makes financed and fleet business possible, so abandoning it removes the infrastructure supporting the profitable segments. That is why manufacturers keep competing in price bands where they barely earn anything at all. Entry volume is what builds the dealer network everything else runs through.

High-value pools concentrate in three places: fleet cargo vehicles bought on uptime, battery subscription revenue across the installed base, and financed lithium sales to individual drivers. Each is defended by service capability, balance sheet, or lender relationships rather than by product. Price competition arrives only when a competitor secures a lender partnership, builds service coverage, or funds pack ownership.

Volume / Commodity-Adjacent Tier

Entry lead-acid passenger e-rickshaws sold to individual drivers competing directly against informal assembly on price. Compliance cost is carried against competitors who avoid it. The range reflects large differences in localisation and scale.
Gross Margin: 6%-13%

Premium / Certified Tier

Homologated L5 autos and fleet cargo vehicles sold with warranty, service commitments, and uptime terms. The buyer purchases earning reliability rather than a vehicle, and downtime costs them directly every day.
Gross Margin: 17%-26%

Sustainability / Regulatory / Next-Generation Tier

Lithium vehicles sold with battery subscription, swappable architectures, and connected fleet management. Recurring revenue rather than unit margin drives returns. The range is wide because subscription economics vary enormously by utilisation.
Gross Margin: 22%-38%
e-rickshaw-market-portfolio-architecture-1787549309903

High-value Sub-segments and Strategic Watch-out

Fleet Cargo Three-Wheelers

The most attractive customer in this market, financing conventionally, specifying lithium for uptime, and negotiating service rather than price. Cargo variants grow above 13% annually. Manufacturers organised for retail selling frequently cannot serve them at all. Build the fleet function deliberately and early. Start now.
Gross Margin: 19%-28%

Battery Subscription Revenue

Separating the pack from the vehicle removes the upfront barrier that keeps lead-acid at 62% of sales and captures 30 to 45% of vehicle price recurring. It requires balance sheet capacity or a financing partner willing to hold the asset. Find a partner willing to own the asset.
Gross Margin: 26%-40%

Financed Individual Driver Sales

Credit arrangement rather than product lifts conversion two to three times among buyers with daily cash income and no formal history. The relationship extends into replacement purchases years later. Lender partnerships are the whole capability required. Lender partnerships are the whole requirement here. Sign them.
Gross Margin: 14%-22%

Entry Lead-Acid Passenger Vehicles

The strategic watch-out. Informal assemblers avoiding homologation, warranty, and service obligation set the price, and organised manufacturers carry costs they do not. It funds the dealer network everything else depends on entirely. Fund the network with it and nothing beyond. Nothing beyond that at all.
Gross Margin: 6%-12%

How Demand Actually Reaches Manufacturers

The annuity here runs through the battery rather than the vehicle. A lead-acid pack lasts eight to twelve months in daily commercial use and a lithium pack several years, which means replacement demand recurs on a cycle far shorter than the vehicle's own life of five to seven years. Manufacturers who capture that replacement, through subscription or authorised supply, earn considerably more across a vehicle's life than the original sale delivered. Most currently hand it to informal battery suppliers without noticing.
Adoption depth varies sharply by buyer type. Fleet operators specify uptime, payload, and service terms and buy in volume against commercial criteria. Individual owner-drivers buy whatever they can finance, from whoever arranges it, close to where they live. Aggregator-affiliated drivers sit between the two, influenced by platform recommendations. Municipal buyers tender against specifications and rarely reorder from the same supplier.

The buyer has shifted meaningfully toward fleets and financiers. A lender approving a vehicle model effectively selects it for thousands of borrowers who never compared alternatives. That makes lender relationships a distribution channel rather than a financing arrangement, and manufacturers who understand the distinction reach buyers their competitors never meet at all.
e-rickshaw-market-end-use-penetration-index-1787549310395

Where the Money Sits

These are among the four positions where our research anticipates prominent divergence between winners and laggards over the coming forecast period. Each is grounded in the demand model, the regulatory perimeter, and the announced capacity pipeline.
01 / DRIVER CREDIT ARRANGEMENT

Sell the loan, because the vehicle is the easy part

The buyer earns daily cash income and holds no formal credit history, which makes lending availability rather than price or product the genuine constraint on whether a sale happens at all. Manufacturers partnering with non-bank financiers to offer repayment matched to daily earnings convert at 2 to 3 times the rate of unfinanced equivalents at identical pricing. The investment is partnership structuring and dealer training rather than product development, and the relationship then extends into replacement purchases several years later.
02 / BATTERY SUBSCRIPTION MODEL

Unbundle the pack, because upfront cost keeps lead-acid winning

Lithium lasts several times longer and costs less per kilometre, and lead-acid still fits 62% of new vehicles purely because it costs less on the day of purchase to a buyer with no borrowing capacity. Charging monthly or per-kilometre for the pack removes that barrier and captures recurring revenue worth 30 to 45% of vehicle price across its life. It needs balance sheet capacity or a financing partner to hold the asset, which is the real constraint rather than any technical difficulty.
03 / FLEET CUSTOMER CAPABILITY

Build for fleets, because they buy uptime rather than price

Quick commerce and parcel operators finance conventionally, specify lithium because downtime costs them money directly, negotiate service terms, and order in volume rather than individually. Cargo variants serving these operators are growing above 13% each year and they are comfortably the most commercially attractive buyers anywhere in this entire market. Winning that business requires firm uptime commitments, real service coverage, and proper payload engineering, and manufacturers organised entirely around individual retail selling frequently cannot meet any of those requirements at all.
04 / INFORMAL DISPLACEMENT POSITIONING

Price an entry model into the gap enforcement will open

Unregistered workshops build 44% of vehicles from imported kits with no homologation, no warranty, and no service obligation whatsoever, and enforcement against them keeps tightening with every accident study and registration system upgrade. That volume transfers to organised manufacturers at higher unit values, but only ever to those already holding compliant products in the price bands informal assemblers currently occupy. Capturing that shift means accepting thinner entry margin in exchange for volume arriving on a regulatory rather than a commercial timetable entirely.

Engagement Snapshot From the Field

A live engagement with an industry participant carrying material or product regulatory and market exposure ahead of a defining policy shift, showing how our research translates into a defensible multi-year portfolio strategy.
MARKET MINDS ADVISORY · CLIENT ENGAGEMENT SUMMARY
E-Rickshaw Producer Strategic Portfolio Review and Transition Roadmap 2026·Investment Scenario on E-Rickshaw Exposure Evaluation 2025-26
CLIENT PROFILE
An Indian manufacturer of L3 passenger e-rickshaws and light cargo variants selling through a dealer network across northern states, with revenue near USD 74 million (client-reported, unverified by MMA). Almost all vehicles shipped with lead-acid packs, the business held no financing partnerships, and it had never supplied a commercial fleet customer of any size. Dealer conversion had been poor.
STRATEGIC CHALLENGE
Dealers reported losing a large share of interested buyers who could not raise the purchase price, while competitors arriving with lender partnerships were converting the same walk-in traffic. Quick commerce operators in the client's markets were meanwhile buying cargo vehicles from manufacturers offering uptime terms the client could not match or even quote.
MMA APPROACH
MMA analysed dealer enquiry conversion against financing availability, sized the fleet cargo opportunity in the client's operating states, and modelled battery subscription economics against outright lithium sale. Forty-seven expert interviews with drivers, dealers, non-bank lenders, and fleet operators established what actually prevents a sale from closing. Conversion data proved decisive.
KEY FINDINGS
  1. Dealers converted roughly one interested buyer in four, and financing availability rather than price or product explained essentially all of the shortfall against better performing competitors.
  2. Buyers fitting lead-acid packs replaced them within eleven months on average and bought replacements from informal suppliers, revenue the client had never attempted to capture at all.
  3. Fleet operators in the client's states were buying several thousand cargo vehicles annually and had never received a quotation from the business, since no fleet sales function existed.
  4. Battery subscription economics worked comfortably at observed utilisation levels provided a financing partner held the asset, which two regional lenders indicated willingness to do.
CLIENT PROFILE
An Indian manufacturer of L3 passenger e-rickshaws and light cargo variants selling through a dealer network across northern states, with revenue near USD 74 million (client-reported, unverified by MMA). Almost all vehicles shipped with lead-acid packs, the business held no financing partnerships, and it had never supplied a commercial fleet customer of any size. Dealer conversion had been poor.
STRATEGIC CHALLENGE
Dealers reported losing a large share of interested buyers who could not raise the purchase price, while competitors arriving with lender partnerships were converting the same walk-in traffic. Quick commerce operators in the client's markets were meanwhile buying cargo vehicles from manufacturers offering uptime terms the client could not match or even quote.
MMA APPROACH
MMA analysed dealer enquiry conversion against financing availability, sized the fleet cargo opportunity in the client's operating states, and modelled battery subscription economics against outright lithium sale. Forty-seven expert interviews with drivers, dealers, non-bank lenders, and fleet operators established what actually prevents a sale from closing. Conversion data proved decisive.
KEY FINDINGS
  1. Dealers converted roughly one interested buyer in four, and financing availability rather than price or product explained essentially all of the shortfall against better performing competitors.
  2. Buyers fitting lead-acid packs replaced them within eleven months on average and bought replacements from informal suppliers, revenue the client had never attempted to capture at all.
  3. Fleet operators in the client's states were buying several thousand cargo vehicles annually and had never received a quotation from the business, since no fleet sales function existed.
  4. Battery subscription economics worked comfortably at observed utilisation levels provided a financing partner held the asset, which two regional lenders indicated willingness to do.
RECOMMENDED STRATEGY
Phase 1: Phase one: establish non-bank lender partnerships with daily collection structures and train the dealer network to close on financing rather than on price alone. Phase 2: Phase two: launch battery subscription with a financing partner holding the pack asset, converting replacement demand the business currently forfeits into recurring revenue. Phase 3: Phase three: build a fleet sales function with uptime commitments and service coverage, targeting the quick commerce operators already buying in the client's own states.
OUTCOME
The client signed two lender partnerships within six months and dealer conversion rose from 24% to 51%. Battery subscription reached 12,000 active packs by the second year, the first fleet contract covered 800 cargo vehicles, and blended gross margin improved 5.9 percentage points (client-reported, unverified by MMA).

Frequently Asked Questions

Foundational context covering the market sizes, CAGR, scope, country, region and competition that inform every finding below. This section is provided to cover basics and most often pre-purchase conversations, answered from the MMA Primary Research Dataset.

What is the current size of the E-Rickshaw Market?

The market was valued at USD 3.4 billion in 2025, rising to an estimated USD 3.79 billion in 2026. South Asia and Pacific holds the largest regional share at 52% of global value.

How large will the E-Rickshaw Market be by 2036?

MMA forecasts USD 11.37 billion by 2036 under the base case, an expansion multiple of 3.00 times the 2026 value. That represents USD 7.58 billion of incremental value across the forecast period.

What is the CAGR for the E-Rickshaw Market 2026 to 2036?

The base case CAGR is 11.6%, with a bull case of 12.8% and a bear case of 10.4%. The spread reflects uncertainty over driver financing availability and homologation enforcement pace.

Which segment is growing fastest?

L5 passenger e-autos grow fastest at 16.8%, roughly 1.45 times the market rate, displacing compressed gas autos on permitted routes. L5 cargo three-wheelers follow at 15.4% on quick commerce demand.

Who are the major companies in the E-Rickshaw Market?

Mahindra Last Mile Mobility, Bajaj Auto, Piaggio Vehicles, YC Electric Vehicle, and Kinetic Green lead on shipments. The top five hold only 27%, since informal assembly supplies much of the market.

Which country is growing fastest?

India grows fastest at 14.2%, driven by financing availability from non-bank lenders and permit policy favouring electric over compressed gas autos. Indian sales exceed a million units annually.

Report Segmentation Architecture

The full report scope spans multiple orthogonal segmentation dimensions, with cross-tabulated demand data provided for each dimension pair. Coverage extends further to regional breakdowns, trend trajectories, and the competitive detail needed to support segment-level decision-making.

By Vehicle Class

  • L3 Passenger E-Rickshaw
  • L3 Cargo E-Loader
  • L5 Passenger E-Auto
  • L5 Cargo Three-Wheeler
  • Municipal and Special Purpose Three-Wheelers

By End-Use Industry

  • Urban Passenger Transport
  • Last-Mile Parcel and Quick Commerce
  • Business to Business Distribution
  • Municipal and Waste Services
  • Tourism and Institutional Transport

By Sales Model

  • Financed Individual Driver Sales
  • Fleet and Corporate Direct Supply
  • Battery Subscription Bundled Sales
  • Dealer Retail Cash Sales
  • Informal Assembler Kit Supply

By Region

  • North America
  • Western Europe
  • East Asia
  • South Asia and Pacific
  • Latin America
  • Middle East and Africa
  • Eastern Europe

Scope, Methodology, and Coverage

Every figure in this report is reproducible from documented input assumptions. The scope below maps the historical period, the forecast horizon, the segmentation dimensions, and the countries covered, alongside the underlying primary and qualitative methodology.
Historical Period
2020 to 2025
Forecast Period
2026 to 2036
Base Year
2025 (USD billions; MMA Primary Research Dataset, August 2026)
Market Definition
The market comprises battery-electric three-wheeled vehicles for passenger and goods transport, covering L3 passenger e-rickshaws, L3 cargo e-loaders, L5 passenger e-autos, L5 cargo three-wheelers, and municipal and special purpose three-wheelers. Value is measured at manufacturer level and includes estimated informal assembly output. Electric two-wheelers, four-wheeled microcars and quadricycles, internal combustion and compressed natural gas three-wheelers, standalone battery packs and swapping infrastructure sold separately, and pedal-powered cycle rickshaws fall outside scope.
Quantitative Units
USD billions (current prices); vehicles shipped annually by class; USD per vehicle by class and battery chemistry
Segmentation Dimensions
By Vehicle Class; By End-Use Industry; By Sales Model; By Region
Regions Covered
North America, Western Europe, East Asia, South Asia and Pacific, Latin America, Middle East and Africa, Eastern Europe
Countries Covered
India, Bangladesh, Nepal, Sri Lanka, Pakistan, Indonesia, Philippines, Thailand, Vietnam, China, Japan, South Korea, United States, Canada, Mexico, Brazil, Peru, Colombia, Italy, Spain, Netherlands, Poland, Czechia, Kenya, Nigeria, Uganda, Rwanda, Egypt, United Arab Emirates, South Africa
Key Companies Profiled
Mahindra Last Mile Mobility, Bajaj Auto, Piaggio Vehicles, YC Electric Vehicle, Kinetic Green, Atul Auto, TVS Motor Company, Terra Motors, Saera Electric Auto, Dilli Electric Auto, Speego Vehicles, Lohia Auto Industries, Thukral Electric Bikes, Jezza Motors, Euler Motors, Altigreen Propulsion Labs, Omega Seiki Mobility, Jiangsu Jinpeng Group, Zongshen Industrial Group, Champion Poly Plast
Quantitative Methodology
Primary survey, n=3,800 respondents, Q4 2025, six countries; demand-side model with trade association cross-validation
Qualitative Methodology
47 expert interviews, Q4 2025; applied to validate demand model assumptions, identify emerging dynamics, and assess competitive positioning
Report Format
PDF and XLSX data workbook (Word format preview document)
Publisher
Market Minds Advisory
Report Code
MMA-2026-AUT-165
Published
August 2026
Contact
sales@marketmindsadvisory.com | www.marketmindsadvisory.com

Purchase the full E-Rickshaw Market Report (2026 to 2036).

The full report sizes electric three-wheeler demand across five vehicle classes, five end-use categories, and seven regions with 2026 to 2036 forecasts under base, bull, and bear cases. It estimates informal assembly output separately, since unregistered workshops supply a share that official registration data misses entirely. Competitive profiles cover twenty manufacturers assessed consistently on three-wheeler shipments, financing capability, and service network reach. Cost analysis traces battery, controller, and localisation exposure across chemistries and sourcing routes. Commercial guidance addresses driver credit arrangement, battery subscription, fleet capability, and informal displacement positioning.
Five vehicle classes sized separately by region
Informal assembly output estimated alongside registered production
Driver financing availability modelled as an adoption constraint
Lead-acid and lithium economics compared over vehicle life
Fleet and individual buyer behaviour separated throughout
Homologation enforcement mapped against volume transition

Built For The People Who Decide

From boardroom strategy to bench-side execution, this report is read cover-to-cover by leaders shaping the next decade of their industry, turning demand scenarios, market dynamics and valuation benchmarks into decisions.
CXOs/ Presidents/ VPs/ Managers
M&A and Corporate Development
Strategy Teams and R&D Heads
Procurement and Product Directors
Regulatory and Compliance Leaders
Investor Relations and Equity Analysts