Market Minds Advisory
United Kingdom E-Brokerage Market

United Kingdom E-Brokerage Market: Earning On The Cash Nobody Invested

Around 34% of platform revenue comes from interest on client cash rather than from any trading at all, and the regulator started asking about that arrangement in December 2023 for the first time.

Lead Analyst

Published

September 2026

Make Smarter Decisions with Customized Research Insights

Request a free sample report and evaluate market opportunities, growth trends, and competitive dynamics relevant to your business needs.

2025 MARKET VALUE$2.7BMarket Size 2025
2036 FORECAST VALUE$6.6BBase Case , 2026 to 2036
CAGR 2026 TO 20368.4 %Bull 9.6% / Bear 7.2%
INCREMENTAL OPPORTUNITY$3.6BNet 10- year value creation
EXPANSION MULTIPLE2.24x2036 value over 2026 base
Strategic Levers
M&A Pipeline
Regional Outlook
Country Rankings
Competitive Intelligence
Segmental Deep-dive
Call-Us : 91 93563 13602

Executive Snapshot and Market Trajectory

The business is not trading and has not been for years. Roughly 34% of platform revenue comes from interest retained on client cash that customers deposited and then simply never got round to investing anywhere. Nobody designed the business to work that way at all.
Domestic activity carries 86% of value, far above the usual regional band, because this is a single-country market whose participants earn almost entirely at home. Pension wrapper administration grows at 12.6%, half again the market rate of 8.4%, as savers consolidate old workplace pots that nobody has looked at in a decade. Those balances arrive already invested rather than sitting in cash, which is a better shape than anything a monthly savings habit produces.
Concentration reaches 61% and the product customers actually buy is the tax wrapper rather than any execution capability. Moving one takes around 21 days of paperwork, which is the entire reason platform switching stays as rare as it does despite fee differences of several times. Fee differences at larger balances run into thousands of pounds a year, and customers who know that still mostly do not move anywhere at all.
Market Definition
The market covers revenue earned by direct-to-consumer investment platforms in the United Kingdom, spanning pension wrapper administration, advice and guidance services, platform custody fees on assets, trading commissions and foreign exchange charges, fund manager rebates and distribution payments, and interest margin retained on client cash. Adviser-facing platform revenue, discretionary wealth management fees, fund management fees earned by asset managers, banking net interest income, and institutional brokerage are excluded.
Base Year Value
$2.7B in 2025 (MMA Primary Research Dataset, August 2026)
Forecast Period
2026 to 2036, eleven discrete annual values
CAGR
8.4% base case. Bull 9.6%. Bear 7.2%.
Fastest Growth Segment
Pension Wrapper Administration: 12.6% CAGR
Fastest Growth Country
India: 10.4% CAGR
Fastest Growth Region
South Asia and Pacific: 10.6% CAGR
Largest Region
Western Europe: 86% of 2025 global value
Market Leaders
Hargreaves Lansdown, interactive investor, AJ Bell, Fidelity International, Vanguard UK. Source: MMA Analysis based on disclosed direct-to-consumer investment platform revenue, company annual reports 2025.
Primary Survey
n=3,800 procurement and R&D decision-makers, Q4 2025, six countries
Methodology
Demand-side build-up, cross-validated against public data, 47 expert interviews

United Kingdom E-Brokerage Market Forecast Scenarios

e-brokerage-market-united-kingdom-size-forecast-scenario-1787917311134
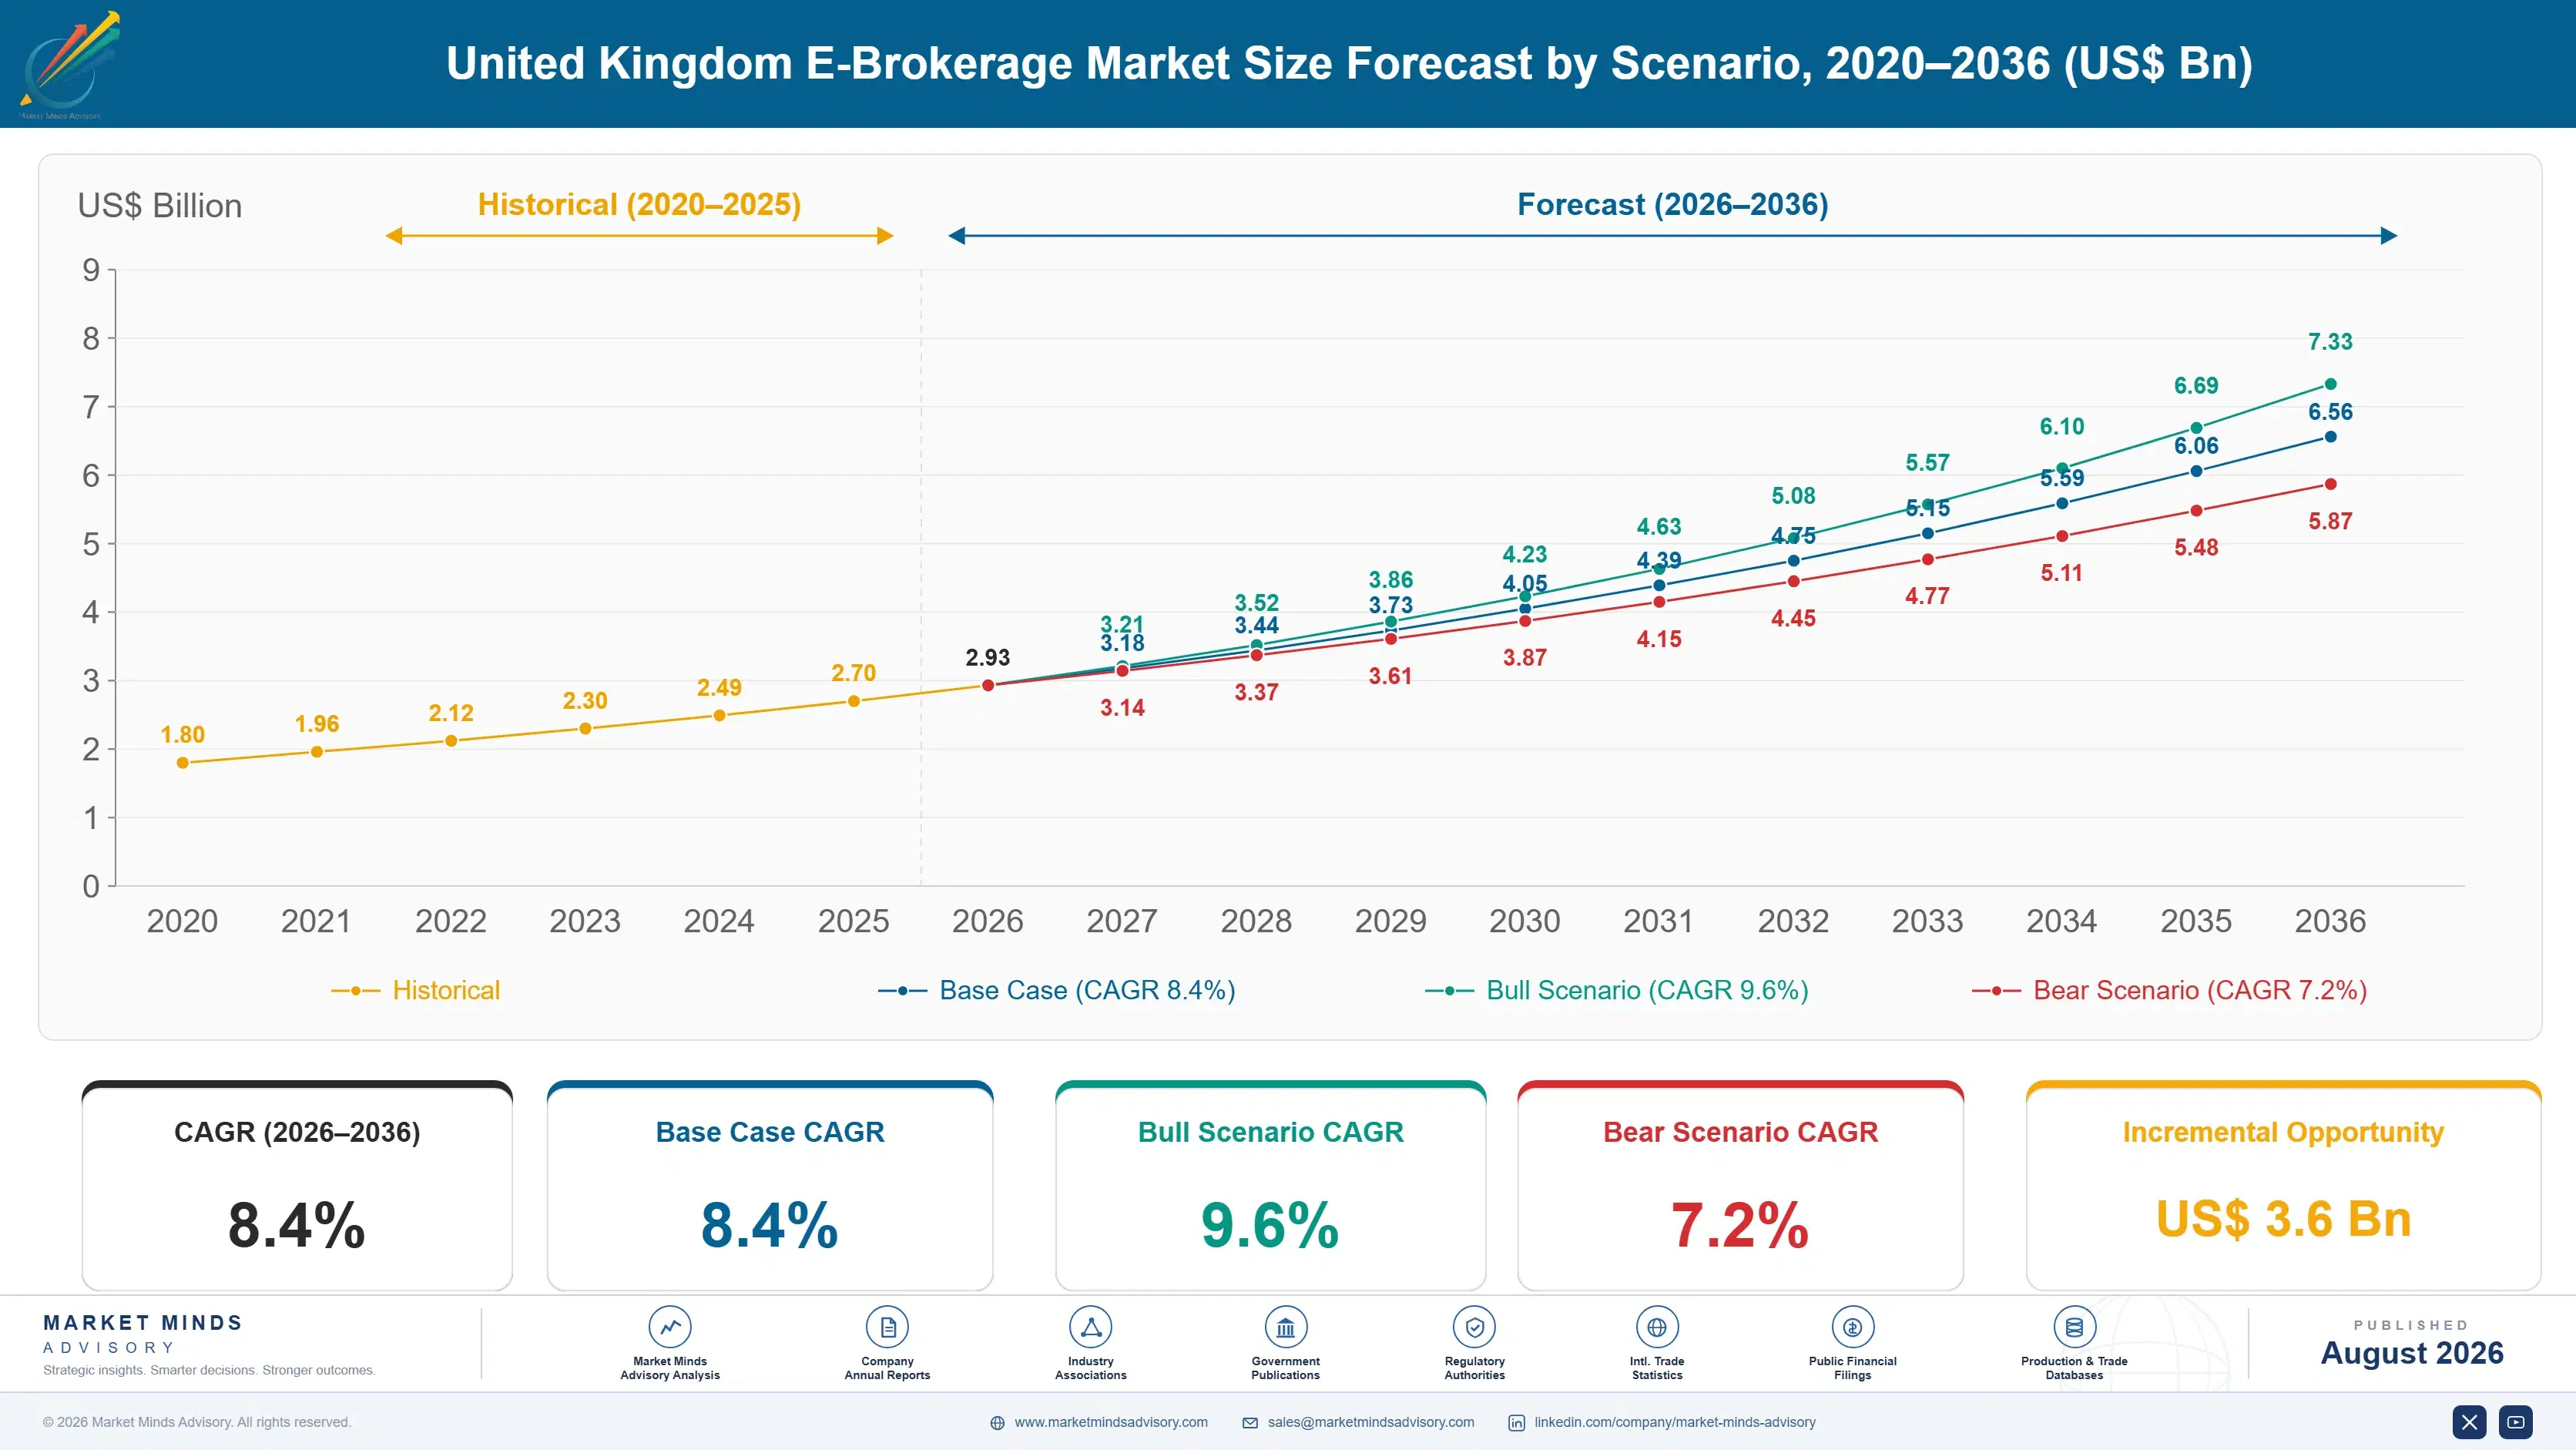
Growth from 2020 to 2025 ran at 7.2% and rates did most of the work. Account opening surged through 2020 and 2021 on very little revenue per customer. Then policy rates rose and interest retained on client cash balances became the largest single revenue line at several platforms. The regulator opened a review of exactly that in December 2023, and double charging on cash largely stopped within a few months.
The 8.4% base case rests on three mechanisms. Pension consolidation keeps growing as savers gather workplace pots accumulated across several employers into one place. Guidance services keep expanding as regulatory work opens room to help customers who will never pay for full advice. And asset-based custody revenue keeps compounding with balances, which is the line least dependent on anybody trading anything. None of the three depends on rates staying high.
The bull case at 9.6% assumes rates settle high enough to preserve meaningful cash margin while pension consolidation accelerates. The bear case at 7.2% is rates falling far enough to remove the cash line entirely, which would expose how little of this industry's revenue was ever generated by the activity its marketing describes, alongside continued migration toward flat fee competitors.

Interest, Not Execution

Customers open accounts to trade and platforms earn on the money that never gets traded. Around 34% of revenue now comes from interest retained on client cash balances, which arrived when rates rose and which the platforms had no part in creating. The regulator began examining that in December 2023, and charging a platform fee on cash while also keeping the interest largely stopped within months.
FIVE-FIRM CONCENTRATION61%Share of category revenue held by the largest platforms
CASH INTEREST REVENUE SHARE34%Portion of platform revenue earned on uninvested balances
ANNUAL WRAPPER ALLOWANCE20,000Pounds a saver may shelter from tax yearly
SHARE PURCHASE TAX0.5%Charge applied when buying domestically listed equities here
PERCENTAGE FEE RATE0.45%Annual charge on assets at the largest platform
WRAPPER TRANSFER DURATION21 daysTime to move a sheltered account between platforms
The actual product is a tax wrapper and almost nobody says so. A saver may shelter 20,000 pounds a year from tax, and the wrapper rather than the execution is what they are buying. Moving one to a competitor takes around 21 days of forms and waiting. That friction, rather than loyalty or service quality, is why customers stay on platforms charging several times what an alternative would.
Fee structures have diverged and the comparison is now public. One large platform charges 0.45% of assets annually while competitors charge a flat monthly amount, which means the same portfolio costs wildly different sums depending purely on where it sits. At larger balances the difference runs to thousands of pounds a year. Migration toward flat fee providers is steady and slower than the arithmetic would predict.
"Ask a platform chief executive about their business and you will hear about execution, research and customer engagement. Look at the revenue line and a third of it is interest on money somebody meant to invest last March and forgot about entirely."
Director, Retail Investment Practice · MMA Retail Investment Platforms Practice · August 2026

Market Trends

Pension Consolidation Became The Real Growth Engine

Savers who changed employers several times hold workplace pots scattered across providers nobody has looked at in years, and gathering them into one self-invested wrapper is now the largest source of asset inflow anywhere in this market. That segment grows at 12.6%. The balances arriving are considerably larger than anything a monthly savings habit produces, and they arrive already invested rather than sitting in cash waiting for anybody to decide. Nobody at the losing provider is competing to keep those pots, because nobody there has thought about them in years.
Market Impact: Delays switching by 21 days

Guidance Fills The Gap Advice Never Reached

Regulatory work on the boundary between guidance and advice is opening room for platforms to help customers who will never pay for a full advice relationship and currently receive nothing at all. That segment grows at 10.8%. The commercial appeal is obvious, since a customer given a sensible steer invests the cash balance the platform was earning interest on and pays asset fees instead, which is better revenue and better for them. Nobody has yet built the proposition properly, and the firm that does will convert cash balances competitors are quietly earning interest on instead.
Market Impact: Grows Indian operations at 10.4%

Market Opportunities and Growth Drivers

Wrapper Transfer Friction Keeps Customers In Place

Moving a tax sheltered account to a competitor takes around 21 days of paperwork, identity checks and waiting, during which a customer may be out of the market entirely. That friction is what retains accounts on platforms charging several times what alternatives would, since the fee saving is real and the process is tedious enough that most people never begin it. Nobody in this industry is trying very hard to reduce it. Reducing that friction would cost every incumbent more than it gained, which explains a great deal indeed here.
Market Impact: Risks 34% of total revenue

Offshore Operations Carry The Cost Base Quietly

Platform technology, client servicing and operations functions have moved substantially to lower cost locations, which is what has allowed flat fee competitors to price where they do without matching incumbent revenue per customer. India grows fastest at 10.4% on that basis. Nobody markets this and everybody does it, and the cost gap it creates is a considerable part of why the fee comparison looks the way it does. Incumbents carrying domestic cost bases and legacy systems cannot reach those price points at all, whatever they say about their service quality.
Market Impact: Costs 0.45% against flat fees

Market Restraints and Challenges

The Cash Line Disappears When Rates Do

Around 34% of revenue comes from interest retained on client balances, which exists only because policy rates rose and which will contract by the same mechanism whenever they fall. Root cause is that nobody built this line, it arrived. Commercial impact would be immediate and visible in a single reporting period. Mitigation involves converting cash balances into invested assets earning custody fees, which is better for customers and considerably harder than it sounds. A cost base sized against two strong rate years becomes uncomfortable in the third one very quickly.
Market Impact: Grows pension wrappers at 12.6%

Fee Comparison Now Runs Into Thousands Of Pounds

A percentage charge of 0.45% against a flat monthly fee produces a difference of several thousand pounds annually at larger balances, and that comparison is published, understood and repeated constantly by anybody writing about personal finance. Root cause is two incompatible pricing models competing openly. Commercial impact falls on percentage platforms holding large accounts. Mitigation runs through caps and tiering, which reduces the gap without ever closing it. The accounts most worth keeping are precisely the ones for whom the gap is largest and most obvious to anybody actually looking.
Market Impact: Grows guidance services at 10.8%
3 additional market trends, 4 additional growth drivers, and 2 additional restraints and challenges are covered in the full report. Contact sales@marketmindsadvisory.com to access the complete intelligence.

Segment CAGR and Growth Architecture

Segmentation follows revenue line, since growth driver, regulatory exposure and dependence on customer behaviour all differ by line rather than by customer segment or account type. Six categories cover the market without overlap. Customer segment, account type and acquisition channel are treated as separate commercial dimensions throughout this report rather than as segmentation logic here.
e-brokerage-market-united-kingdom-market-share-analysis-1787917311674

Pension Wrapper Administration

Pension wrapper administration grows at 12.6%, half again the market rate of 8.4%, as savers consolidate workplace pots accumulated across several employers into a single self-invested arrangement nobody had previously bothered to gather. Those balances are considerably larger than anything monthly saving produces and they arrive already invested rather than sitting in cash. Transfer friction cuts both ways here, since the same paperwork that delays a customer leaving also delays every consolidation a platform is trying to win from a competitor. Prompting a customer to gather old pots wins assets that would otherwise sit unclaimed with a provider who is not competing for them and has not thought about them in years.
CAGR 12.6%

Advice and Guidance Services

Guidance services grow at 10.8% as regulatory work opens room to help customers who will never pay for a full advice relationship and who currently receive nothing whatsoever. The commercial logic is unusually well aligned, since a customer given a sensible steer invests the cash the platform was quietly earning interest on and pays asset-based fees instead. Both sides end up better off, which is rare enough in retail financial services to be worth stating plainly. Building the capability ahead of settled rules carries genuine cost and genuine risk, which is why almost every platform is describing a proposition rather than actually operating one anywhere at the present moment. That will change.
CAGR 10.8%
Full segment breakdown across 6 segments available in the complete report.

Regional Architecture and Country Demand Map

This is a single-country market and the distribution reflects where the revenue is actually earned, with outward exposure arising through offshore operations and overseas asset holdings. Customer portfolio holdings reach considerably further around the world than any operational presence of theirs ever does here at all.

North America

Share sits at 6%, far below the standard regional band, because this is a single-country market and North American exposure arises through customer holdings rather than any operating presence. That justification is definitional rather than analytical. British retail money has flowed heavily into American index products and mega-cap equities rather than into domestically listed shares, which generates foreign exchange charges for platforms and considerable discomfort for anybody responsible for domestic capital markets policy. Foreign exchange charges on those purchases have become a meaningful revenue line in their own right, which means a platform earns more when a customer buys an American share than a domestic one and nobody involved finds that arrangement uncomfortable enough to change.
Share: 6% | CAGR: 7.2% (2026 to 2036)

Western Europe

Share sits at 86%, far above the standard regional band, because domestic activity sits within this region and a single-country market concentrates everything at home. That justification is definitional. Around 34% of revenue comes from retained cash interest, the tax wrapper rather than execution is what customers actually buy, and a purchase tax of 0.5% on domestically listed shares makes local equities more expensive to hold than foreign ones for every retail investor here. Fee models here have diverged into percentage and flat structures that produce differences of several thousand pounds annually at larger balances, and the resulting migration between them has been steady, publicised and considerably slower than the arithmetic alone would ever predict.
Share: 86% | CAGR: 6.8% (2026 to 2036)
Regional intelligence for 5 additional markets available in the complete report: East Asia, South Asia and Pacific, Latin America, Middle East and Africa, Eastern Europe. Contact sales@marketmindsadvisory.com.
e-brokerage-market-united-kingdom-country-cagr-analysis-1787917312193

Convert The Idle Cash Balance

Cash interest supplies 34% of revenue, wrappers shelter 20,000 pounds annually, transfers take 21 days and percentage fees run 0.45% against flat alternatives. Four levers here work on cash conversion, pension consolidation, transfer speed and cost base rather than on trading volume, which stopped mattering to this particular industry a good many years ago.

Turn Idle Cash Into Invested Assets Deliberately

Around 34% of revenue comes from interest on balances customers meant to invest and never did, which is a line that disappears entirely when rates fall and which serves the customer badly in the meantime. Guiding those balances into investments produces asset-based custody fees instead, at 0.45% or a flat equivalent. It earns less immediately and it earns something that survives a rate cycle, which the interest line will not. Nobody in this industry enjoys explaining that a third of revenue comes from money customers meant to invest and never did.
Market Impact: Converts away the whole 34% cash revenue base

Win Pension Consolidation Before Competitors Ask

Savers hold workplace pots scattered across providers nobody has examined in years, and consolidating them produces balances considerably larger than any monthly savings habit generates. That segment grows at 12.6%. The balances arrive already invested rather than sitting in cash. Platforms prompting customers to gather old pots capture assets that would otherwise sit unclaimed with a provider who is not competing for them at all. Nobody at the losing provider is defending those pots, since nobody there has looked at the account in years and no relationship exists to protect.
Market Impact: Captures assets within the 12.6% growth segment properly

Make Inbound Transfers Faster Than Outbound Feel

A wrapper transfer takes around 21 days and every platform benefits from that friction on the way out while suffering from it on the way in. Investing in inbound transfer speed and handholding wins accounts that competitors are passively retaining through inertia alone. Nobody in this industry has made this a priority, which is precisely why doing it produces a genuine advantage rather than merely matching what everybody else offers. Every incumbent benefits from slow transfers in one direction and suffers from them in the other, and almost nobody has separated the two.
Market Impact: Beats the standard 21 day wrapper transfer window

Price Against The Flat Fee Comparison Honestly

A percentage charge of 0.45% against a flat monthly fee produces differences running into thousands of pounds annually at larger balances, and that comparison is published constantly by anybody writing about personal finance. Capping or tiering reduces the gap without closing it. Platforms that model the comparison honestly and reprice their largest accounts keep them, while those hoping customers will not do the arithmetic lose exactly the balances worth having. The customers most worth keeping are precisely the ones for whom the comparison is largest and easiest to actually perform.
Market Impact: Defends against a published 0.45% annual fee comparison

Who Controls the Margin Pool

Measured on disclosed direct-to-consumer investment platform revenue, the five largest providers hold a CR5 of 61%, which is high and reflects how much transfer friction protects incumbent positions. Hargreaves Lansdown holds the largest asset base and was taken private during 2024, interactive investor leads the flat fee model, AJ Bell holds substantial pension and adviser-adjacent business, and Fidelity International and Vanguard UK compete on fund-led propositions. Nobody outside that group holds both meaningful scale and a pricing model competitors cannot copy.
Three contests define activity. Large balances compete on total annual cost, where flat fee models win outright. Pension consolidation competes on transfer handling and prompting. New savers compete on application experience and brand entirely. Each of those three rewards a completely different proposition, and hardly any platform wins in more than one of them.

Pressure builds from commission-free entrants who never earned trading revenue and therefore never miss it. Rankings shift toward whoever converts cash balances into invested assets rather than earning interest on them. Account numbers have stopped explaining revenue, since a customer holding cash and a customer holding investments generate entirely different economics for whoever administers them.
e-brokerage-market-united-kingdom-company-positioning-matrix-1787917312711

Competitive Moat and Risk Dimensions

HARGREAVES LANSDOWN

Moat: Asset Scale And Customer Inertia

The largest asset base in the market combined with transfer friction taking around 21 days produces retention that no service quality argument alone could ever sustain. Customers who know they are paying more still mostly do not move. Rebuilding an equivalent base means winning accounts against that same inertia.
HARGREAVES LANSDOWN

Risk: Percentage Fee Comparison Exposure

A charge of 0.45% on assets against flat fee competitors produces differences of thousands of pounds annually at larger balances, and that comparison appears in every personal finance article written on the subject. The customers most worth keeping are precisely the ones for whom the gap is largest and most obvious.
INTERACTIVE INVESTOR

Moat: Flat Fee Structure Advantage

Charging a fixed monthly amount rather than a percentage means the proposition improves as a customer's balance grows, which attracts exactly the accounts that percentage platforms most want to retain. The pricing model is simple to explain and impossible for a percentage competitor to match without abandoning its own economics entirely. Nothing about that advantage requires better service.
INTERACTIVE INVESTOR

Risk: Small Account Economics Weakness

A flat monthly fee is expensive relative to a small balance, which makes the proposition unattractive to new savers starting out and cedes that population to percentage or commission-free competitors. Those customers eventually become the large balances everybody wants. Winning them later requires overcoming the same transfer friction that protects everybody else.

Players Tracked

Prominent Players

Hargreaves Lansdown
interactive investor
AJ Bell
Fidelity International
Vanguard UK

Other Key Players

Freetrade
Trading 212
eToro
IG Group
Charles Stanley Direct
Bestinvest
Halifax Share Dealing
Barclays Smart Investor
Nutmeg
Moneybox
Wealthify
Plum
InvestEngine
Robinhood UK
Saxo

Recent Developments

FEBRUARY 2025

Platform ends charging platform fees on uninvested cash balances

An investment platform stopped applying its percentage platform charge to uninvested cash while continuing to retain interest earned on those balances. This was a pricing decision following regulatory attention rather than any product change, and competitors adopted broadly comparable positions within the same short period.
Signal: Charging twice on the very same balance stopped as soon as somebody official asked about it.
JUNE 2025

Guidance proposals open room for platforms to steer undecided customers

Regulatory proposals on the boundary between guidance and regulated advice opened scope for platforms to offer targeted support to customers who currently receive nothing. This was a consultation development rather than any implemented rule, and platforms began scoping their own propositions almost immediately afterwards regardless.
Signal: Helping these customers invest their idle cash also happens to improve the platform revenue line considerably.
OCTOBER 2025

Comparison coverage drives further migration toward flat fee platforms

Personal finance coverage comparing percentage and flat fee platform charges at larger balances prompted a further period of elevated transfer activity between providers. This was media and consumer behaviour rather than any regulatory action, and the resulting flows moved quite consistently in one single direction.
Signal: The arithmetic here has always been entirely public and customers act on it very slowly indeed.

Technology, Custody, Acquisition

Three costs consume platform revenue. Technology and platform operations, custody settlement and client money administration, and marketing with customer acquisition together account for 61 to 76% of revenue at a typical provider. Acquisition dominates for growth-stage platforms and technology dominates for incumbents, which is why the two groups behave so differently on pricing and why neither finds the other's cost structure remotely comprehensible.
Rates moved everything and regulation followed. Policy rate increases through 2022 and 2023 turned retained interest on client cash into the largest single revenue line at several platforms, which Bank of England rate data and Financial Conduct Authority review materials both document. Consumer Duty obligations then required firms to demonstrate fair value on exactly that arrangement. Hargreaves Lansdown Annual Report 2024 and AJ Bell Annual Report 2024 disclosures describe the resulting revenue mix.

Exposure divides by where the cost base sits rather than by scale. Platforms running technology and servicing from lower cost locations price flat fees that percentage competitors cannot match without abandoning their own economics. Incumbents carrying domestic cost bases and legacy systems cannot reach those price points at all. That gap explains the pricing divergence better than any service quality argument ever has.
e-brokerage-market-united-kingdom-cost-volatility-analysis-1787917312906

Convert cash balances rather than defending the interest

Around 34% of revenue rests on interest that exists only while rates are elevated and that disappears by the same mechanism that created it. Guiding customers to invest those balances earns less immediately and earns something durable instead. It also removes a line the regulator has already examined once and may well examine again.

Move operations cost before repricing becomes forced

Flat fee competitors price where they do because their technology and servicing costs sit in lower cost locations, and no argument about service quality closes a gap of that size. Relocating functions is disruptive and slow and politically uncomfortable. It is the only route to price points that competitors already occupy quite comfortably today.

Prioritise inbound transfer speed over outbound friction

A wrapper transfer takes around 21 days and every platform quietly benefits from that on the way out. Investing in inbound speed and handholding wins accounts competitors retain purely through inertia. Nobody has made this a priority, which is exactly why doing it produces a genuine advantage rather than mere parity with anybody else.

Portfolio Architecture for Margin Defence

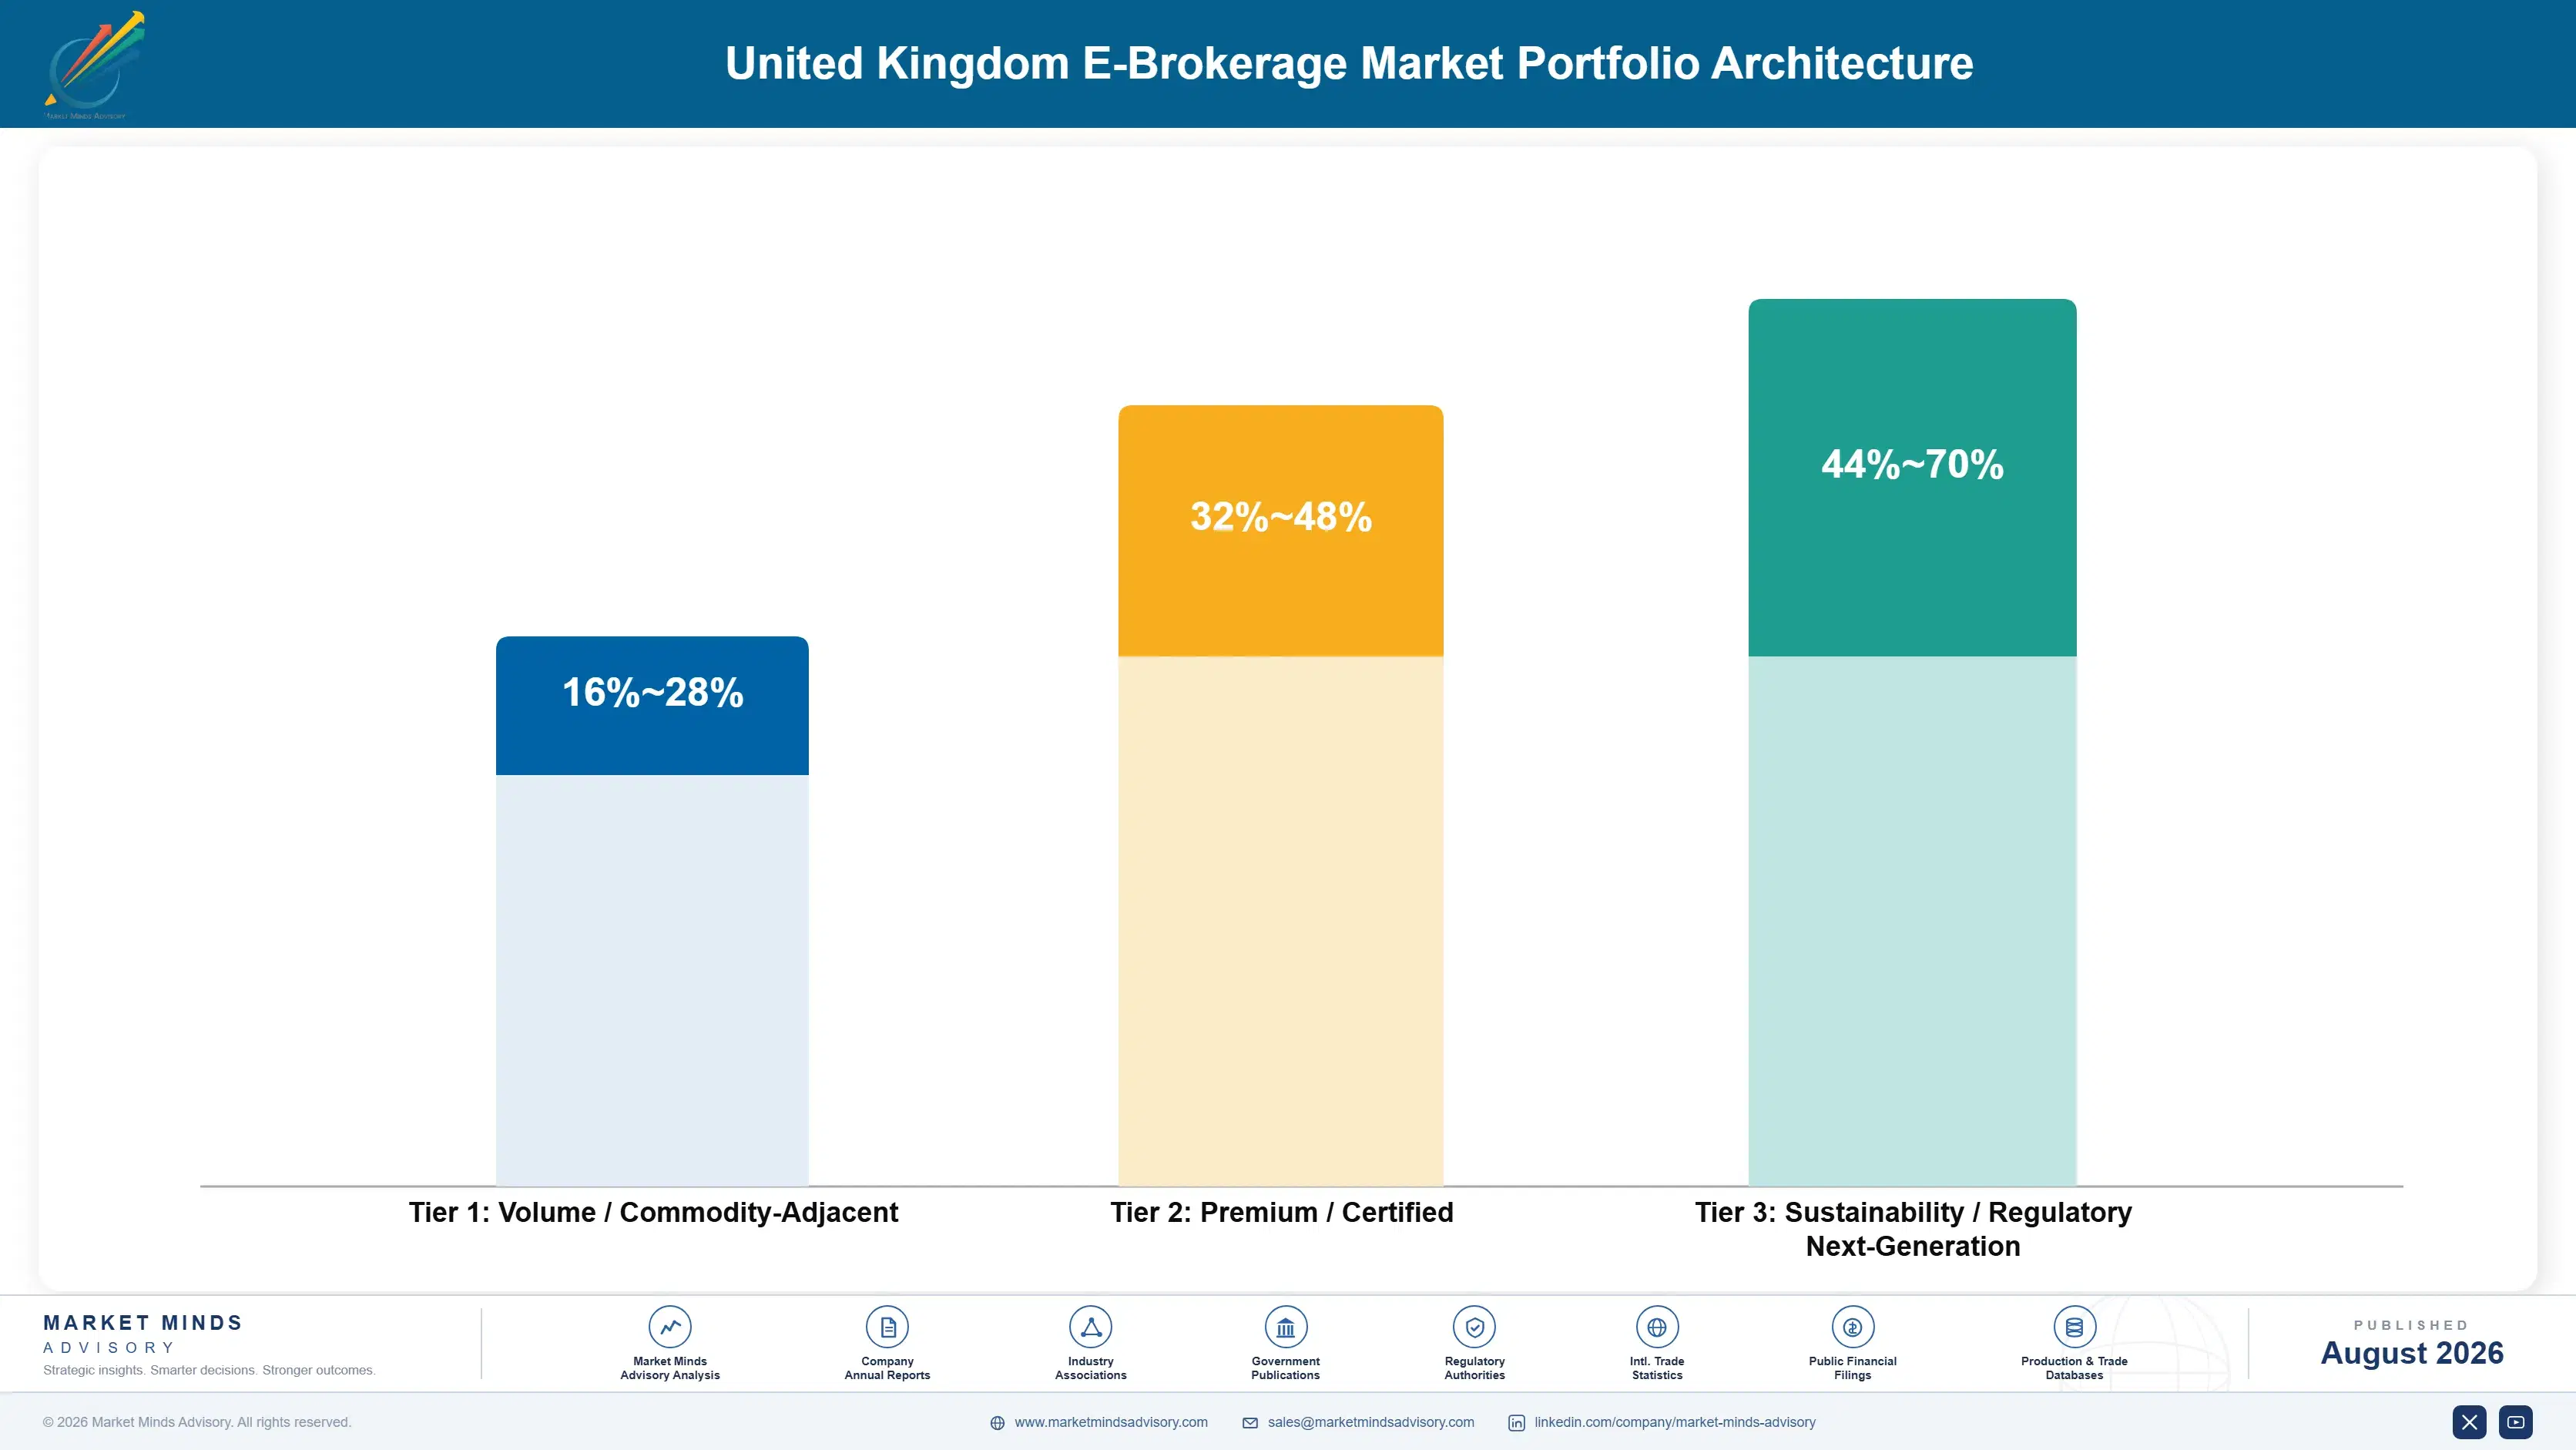
Margin follows how much customer behaviour has to change for the revenue to arrive. Trading commissions and foreign exchange charges earn modestly and depend on activity nobody can rely on. Fund rebates and distribution payments earn thinly under transparency requirements. Cash interest margin earns extremely well and rests entirely on a rate cycle. Platform custody fees earn steadily on balances. Guidance services earn better on engagement. Pension administration earns best, on the largest balances arriving.
The tension is that the most profitable line requires customers to do nothing at all. Cash interest supplies around 34% of revenue and arrives precisely because savers deposited money and never invested it, which is not a service anybody would design deliberately and not a position any platform enjoys defending publicly. Converting those balances is better over a cycle and worse this reporting period, which is why so little happens.

High-value pools sit in three places. Pension consolidation, where the balances arriving dwarf anything monthly saving produces. Guidance capability, where helping a customer invest their cash improves both sides simultaneously. And inbound transfer handling, which wins accounts that competitors are holding through inertia rather than through anything they are actually doing.

Volume / Commodity-Adjacent

Trading commissions, foreign exchange charges and fund distribution payments dependent on customer activity and transparency rules. The 12-point range separates platforms with meaningful dealing volume from those where trading is essentially incidental to the proposition.
Gross Margin: 16-28%

Premium / Certified

Platform custody fees on assets, earning steadily on balances whether or not any customer does anything at all. The 16-point spread reflects how differently percentage and flat fee models perform across the range of account sizes each holds.
Gross Margin: 32-48%

Sustainability / Regulatory / Next-Generation

Pension wrapper administration, guidance services and retained cash interest margin, all earning well on very different foundations. The 26-point range is wide because cash margin economics and pension administration economics have almost nothing in common.
Gross Margin: 44-70%
e-brokerage-market-united-kingdom-portfolio-architecture-1787917313408

High-value Sub-segments and Strategic Watch-out

Pension Consolidation Inflows

Highest margin and fastest growth at 12.6%, bringing balances considerably larger than any monthly savings habit produces and arriving already invested rather than in cash. The risk is that transfer friction delays every consolidation a platform tries to win. And every consolidation runs straight into it.
Gross Margin: 52-70%

Guidance Service Capability

Strong economics from helping customers invest cash balances, which improves the customer position and the revenue mix simultaneously. The risk is that regulatory boundaries remain unsettled and building capability ahead of final rules carries genuine cost. Nobody actually knows what the final rules say yet.
Gross Margin: 46-60%

Asset Custody Fee Base

The steady core, earning on balances regardless of whether anybody trades anything in any given period. Platforms hold it because it survives rate cycles, not because the rate on it is remotely attractive. Surviving an entire rate cycle is really the whole point of it.
Gross Margin: 34-46%

Retained Cash Interest Margin

The strategic watch-out. It supplies around 34% of revenue, nobody built it, and it disappears when rates fall. The risk is a cost base sized against a line that arrived by accident. Nobody built it at all and everybody has come to depend on it.
Gross Margin: 58-72%

Nobody Leaves, Nobody Moves

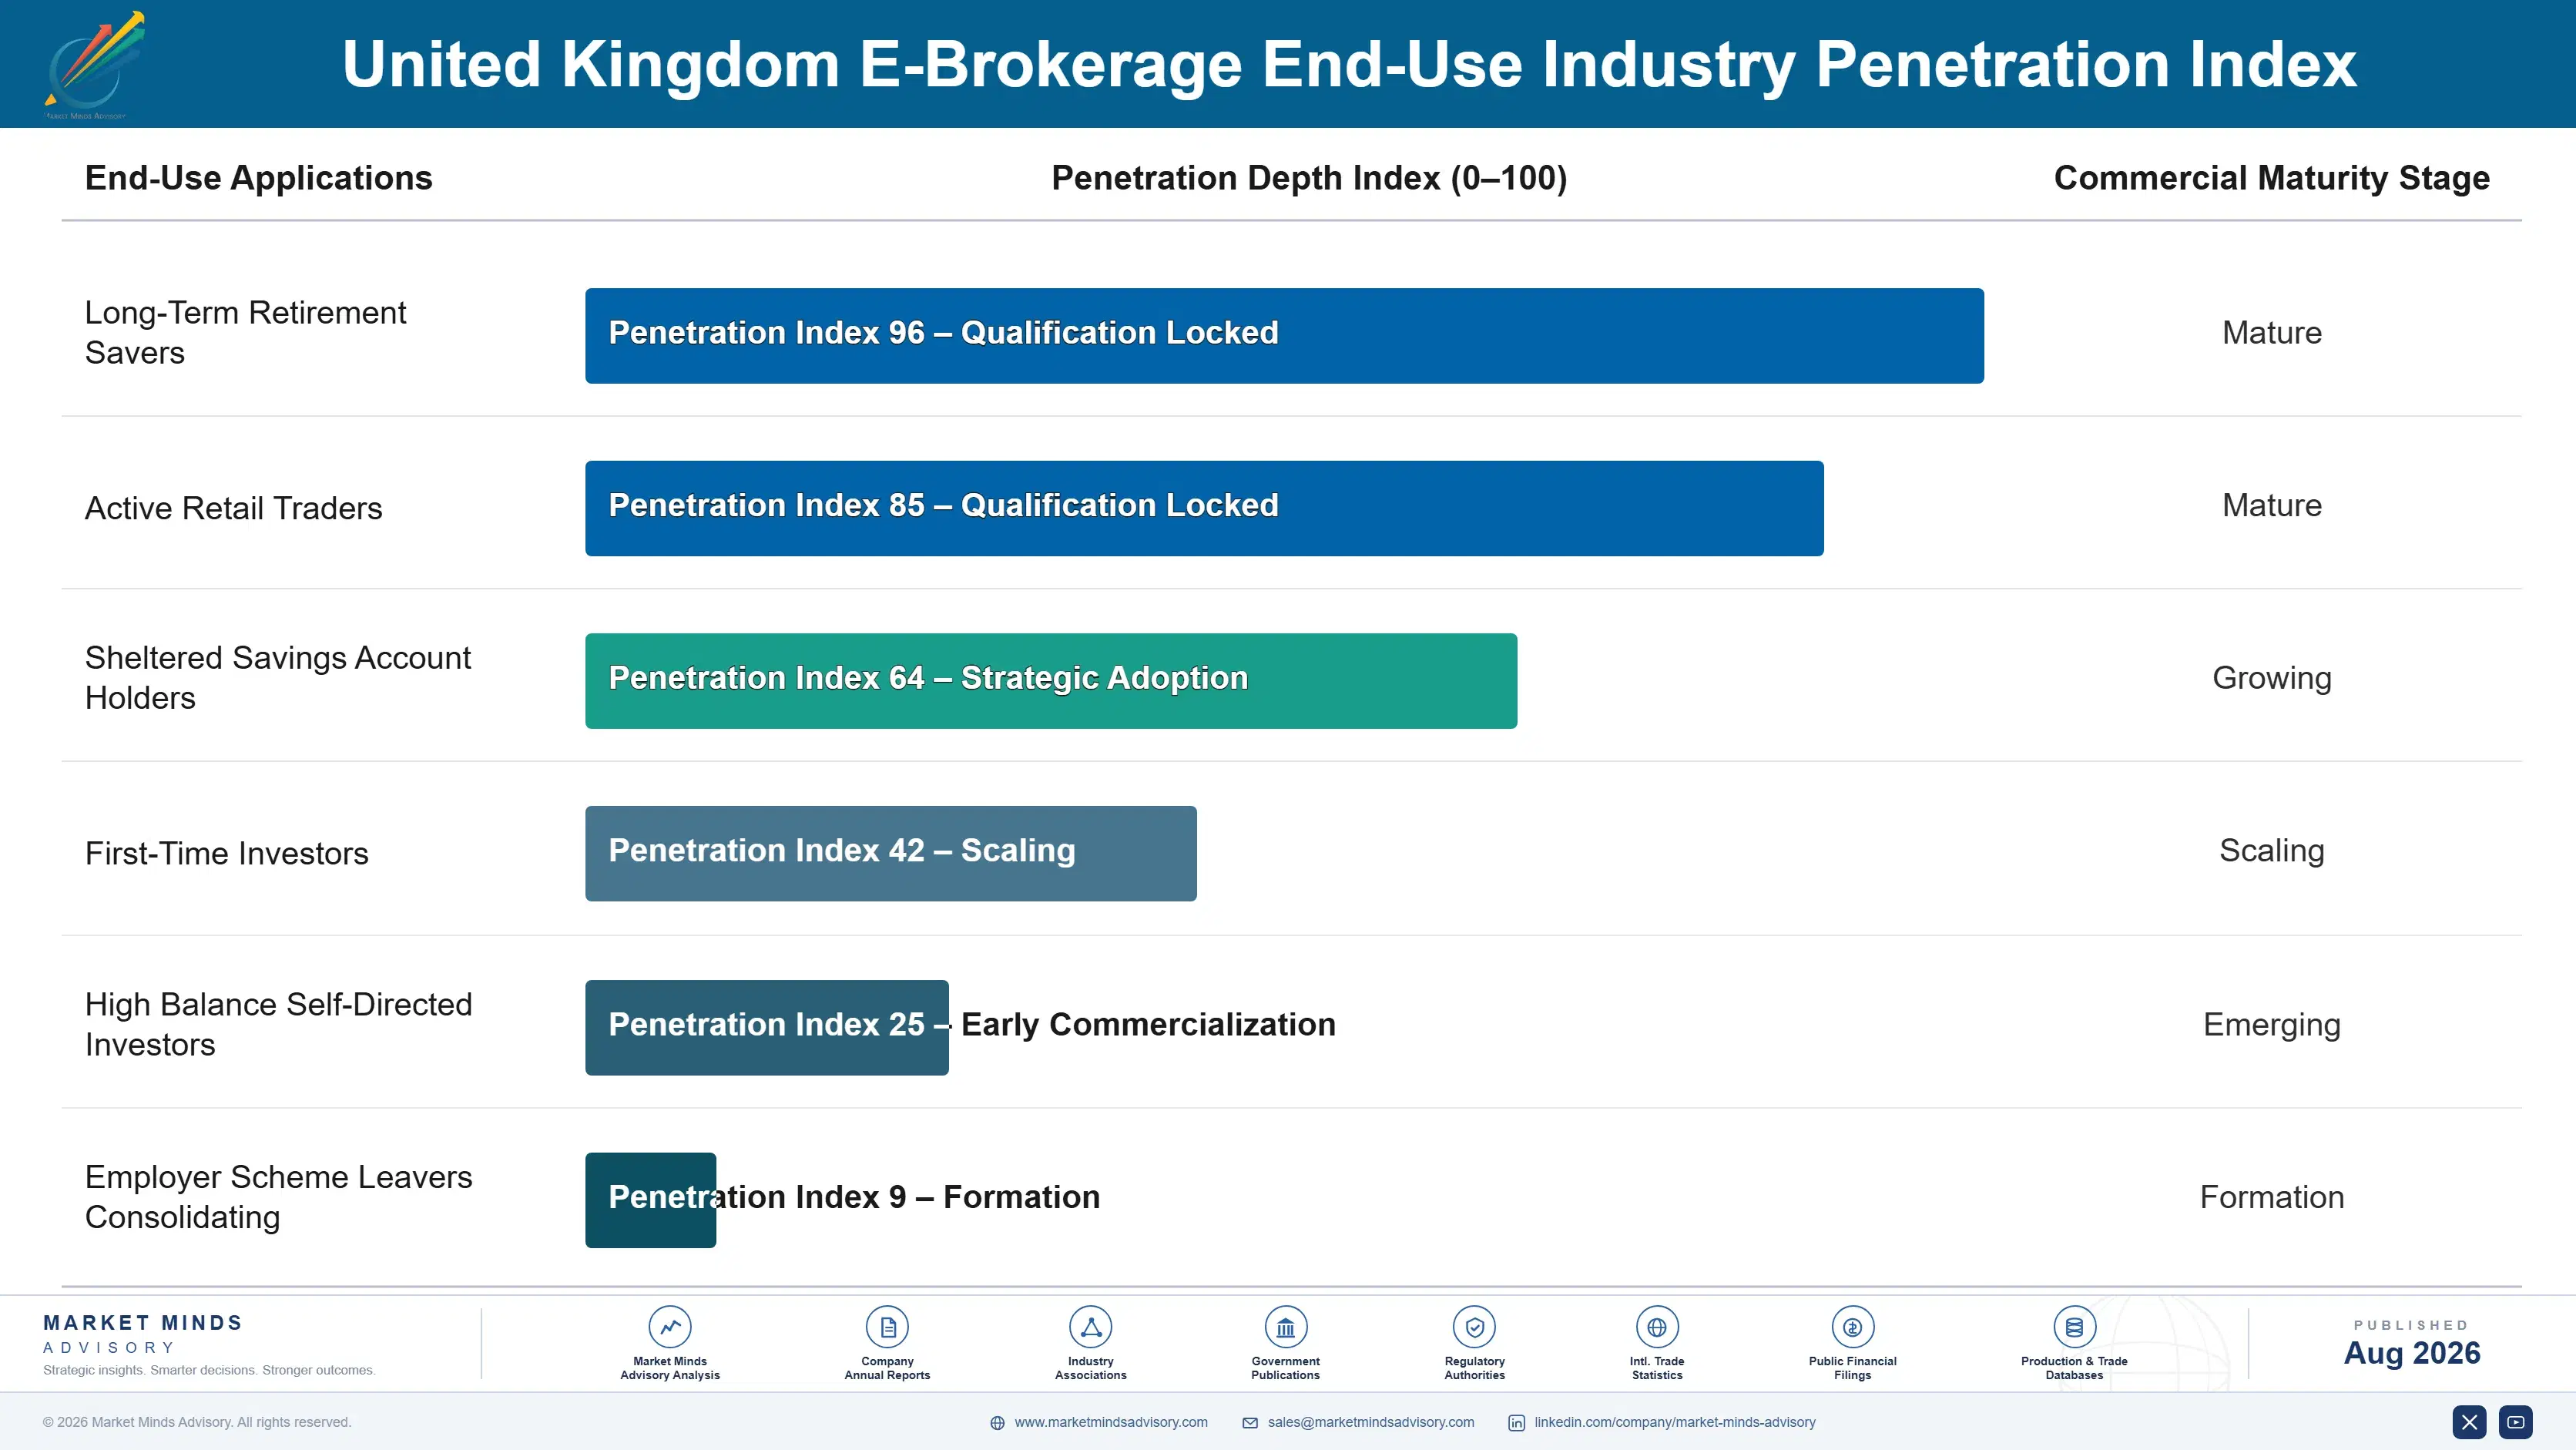
Annuity characteristics here are unusually strong and rest almost entirely on inertia rather than satisfaction. A wrapper transfer takes around 21 days of paperwork and time out of the market, which is enough friction that most customers who know they are overpaying still never begin the process. Fees accrue on balances that sit still for decades. Revenue therefore persists when nothing about the proposition justifies it to anybody examining it.
Stickiness varies by wrapper and by balance. Pension accounts are the stickiest of all, since the money cannot be accessed for years and moving it requires engaging with a process nobody enjoys. Sheltered savings accounts move somewhat more readily but still rarely. General investment accounts are the least sticky and the most price sensitive, because those customers chose deliberately and will choose again just as deliberately.

The customer has become better informed and has not become much more active. Fee comparison coverage is constant, the arithmetic at larger balances is published repeatedly, and the difference runs into thousands of pounds annually. Transfer volumes have risen and remain a fraction of what the arithmetic alone would predict. That gap between knowing and acting is every incumbent's most valuable asset.
e-brokerage-market-united-kingdom-end-use-penetration-index-1787917313897

Inertia Is The Business Model

These are among the four positions where our research anticipates prominent divergence between winners and laggards over the coming forecast period. Each is grounded in the demand model, the regulatory perimeter, and the announced capacity pipeline.
01 / CASH BALANCE CONVERSION

A third of revenue depends on customers doing nothing

Roughly 34% of all platform revenue comes from interest retained on balances that customers deposited intending to invest and then simply never got round to doing anything with at all. Nobody built that line at all and it disappears entirely by the same mechanism that created it once rates eventually fall. Guiding those balances into investments earns rather less immediately and earns something that survives a whole rate cycle, which the interest line very plainly will not do at all.
02 / PENSION CONSOLIDATION CAPTURE

Old workplace pots dwarf any monthly saving

Savers who have changed employers several times hold workplace pension pots scattered across providers that nobody has actually examined in many years, and consolidating all those pots produces balances considerably larger than any monthly savings habit could ever hope to generate. That whole segment now grows at 12.6% a year. Those balances also arrive already invested rather than sitting idle in cash, which improves the revenue mix at exactly the same time as it improves the customer's own position considerably.
03 / TRANSFER SPEED INVESTMENT

Everybody benefits from friction going the wrong way

A single wrapper transfer takes around 21 days of paperwork and waiting around, and every platform in this whole market quietly benefits from that friction on the way out while suffering badly from it on the way in without ever once saying so. Investing in inbound transfer speed and proper handholding wins accounts that competitors are currently retaining purely through inertia. Nobody in this market has yet made this a priority anywhere, which is exactly why doing it creates a genuine advantage.
04 / FEE COMPARISON HONESTY

The arithmetic is published and customers eventually read it

A percentage charge of 0.45% set directly against a flat monthly fee produces differences running into several thousand pounds every year at larger balances, and that comparison now appears in essentially every personal finance article ever written about these platforms. Capping and tiering both reduce that gap without ever closing it properly at all. Platforms that model it all honestly and reprice their own largest accounts keep them, and those hoping nobody calculates lose precisely the balances worth holding onto.

Engagement Snapshot From the Field

A live engagement with an industry participant carrying material or product regulatory and market exposure ahead of a defining policy shift, showing how our research translates into a defensible multi-year portfolio strategy.
MARKET MINDS ADVISORY · CLIENT ENGAGEMENT SUMMARY
United Kingdom E-Brokerage Producer Strategic Portfolio Review and Transition Roadmap 2026·Investment Scenario on United Kingdom E-Brokerage Exposure Evaluation 2025-26
CLIENT PROFILE
A United Kingdom direct-to-consumer investment platform with reported revenue of 190 million dollars (client-reported, unverified by MMA). Roughly 38% came from interest retained on client cash balances, percentage-based platform charges applied across all account sizes, and no guidance proposition existed for customers holding substantial uninvested cash for extended periods of a year or considerably more.
STRATEGIC CHALLENGE
Rates had begun easing and the cash interest line was already contracting while the cost base had been sized against it across two strong years. Management proposed a marketing campaign to grow account numbers. That added acquisition cost to defend a revenue line that was disappearing for reasons entirely unconnected to how many accounts the platform held.
MMA APPROACH
MMA rebuilt revenue by line separating rate-dependent from balance-dependent income, then modelled the effect of converting held cash into invested assets at prevailing charges. Twenty-two expert interviews with customers, competitor executives, transfer operations heads and former regulatory staff established what actually drives switching and investing behaviour. The analysis treated cash conversion and pension consolidation as the routes available.
KEY FINDINGS
  1. Cash balances averaging well above what customers described as intentional had sat uninvested for more than a year, and nobody had ever been prompted about them.
  2. Converting even a modest share of held cash into invested assets produced durable custody revenue exceeding what the interest line would generate once rates normalised.
  3. Inbound transfers took materially longer than competitors and no team owned the process, while outbound requests were handled promptly to avoid complaints.
  4. Larger accounts faced percentage charges several times what flat fee competitors would apply, and those accounts were leaving at a visibly faster rate than smaller ones.
CLIENT PROFILE
A United Kingdom direct-to-consumer investment platform with reported revenue of 190 million dollars (client-reported, unverified by MMA). Roughly 38% came from interest retained on client cash balances, percentage-based platform charges applied across all account sizes, and no guidance proposition existed for customers holding substantial uninvested cash for extended periods of a year or considerably more.
STRATEGIC CHALLENGE
Rates had begun easing and the cash interest line was already contracting while the cost base had been sized against it across two strong years. Management proposed a marketing campaign to grow account numbers. That added acquisition cost to defend a revenue line that was disappearing for reasons entirely unconnected to how many accounts the platform held.
MMA APPROACH
MMA rebuilt revenue by line separating rate-dependent from balance-dependent income, then modelled the effect of converting held cash into invested assets at prevailing charges. Twenty-two expert interviews with customers, competitor executives, transfer operations heads and former regulatory staff established what actually drives switching and investing behaviour. The analysis treated cash conversion and pension consolidation as the routes available.
KEY FINDINGS
  1. Cash balances averaging well above what customers described as intentional had sat uninvested for more than a year, and nobody had ever been prompted about them.
  2. Converting even a modest share of held cash into invested assets produced durable custody revenue exceeding what the interest line would generate once rates normalised.
  3. Inbound transfers took materially longer than competitors and no team owned the process, while outbound requests were handled promptly to avoid complaints.
  4. Larger accounts faced percentage charges several times what flat fee competitors would apply, and those accounts were leaving at a visibly faster rate than smaller ones.
RECOMMENDED STRATEGY
Phase 1: Phase one: prompt customers holding long-term cash balances toward investing them, since the interest line is contracting regardless of anything else. Phase 2: Phase two: assign ownership of inbound transfers and reduce handling time, since competitors retain accounts on friction rather than merit. Phase 3: Phase three: introduce a charge cap on larger accounts before they leave, since the fee comparison is published and increasingly acted upon.
OUTCOME
Cash prompting converted a meaningful share of long-held balances into invested assets within two quarters (client-reported, unverified by MMA). Inbound transfer handling time fell substantially after ownership was assigned. A charge cap was introduced on larger accounts and attrition among them slowed. The marketing campaign was deferred, having proposed buying accounts to defend revenue that account numbers never generated.

Frequently Asked Questions

Foundational context covering the market sizes, CAGR, scope, country, region and competition that inform every finding below. This section is provided to cover basics and most often pre-purchase conversations, answered from the MMA Primary Research Dataset.

What is the current size of the United Kingdom E-Brokerage Market?

The market was worth 2.7 billion dollars in platform revenue in 2025, covering pension wrappers, guidance, custody fees, dealing charges, rebates and cash interest. It reaches 2.93 billion dollars in 2026.

How large will the United Kingdom E-Brokerage Market be by 2036?

MMA forecasts 6.56 billion dollars by 2036, an increase of 3.63 billion dollars over the 2026 base. That represents an expansion multiple of 2.24 times across the forecast period.

What is the CAGR for the United Kingdom E-Brokerage Market 2026 to 2036?

The base case compounds at 8.4% annually. The bull case reaches 9.6% if rates preserve cash margin while pension consolidation accelerates, while the bear case sits at 7.2%.

Which segment is growing fastest?

Pension wrapper administration, at 12.6%, half again the market rate of 8.4%. Savers consolidating old workplace pots bring balances far larger than monthly saving produces.

Who are the major companies in the United Kingdom E-Brokerage Market?

Hargreaves Lansdown, interactive investor, AJ Bell, Fidelity International and Vanguard UK lead on disclosed platform revenue. Concentration reaches 61%, protected substantially by ordinary transfer friction alone.

Which country is growing fastest?

India at 10.4%, reflecting technology, servicing and operations functions that platforms have moved there and which underpin the cost base sitting behind flat fee pricing here.

Report Segmentation Architecture

The full report scope spans multiple orthogonal segmentation dimensions, with cross-tabulated demand data provided for each dimension pair. Coverage extends further to regional breakdowns, trend trajectories, and the competitive detail needed to support segment-level decision-making.

By Revenue Line

  • Pension Wrapper Administration
  • Advice and Guidance Services
  • Platform Custody Fees on Assets
  • Trading Commissions and Foreign Exchange Charges
  • Fund Manager Rebates and Distribution
  • Retained Cash Interest Margin

By End-Use Industry

  • Long-Term Retirement Savers
  • Active Retail Traders
  • Sheltered Savings Account Holders
  • First-Time Investors
  • High Balance Self-Directed Investors
  • Employer Scheme Leavers Consolidating

By Commercial Dimension

  • Direct Digital Acquisition
  • Wrapper Transfer Origination
  • Employer Scheme Referral
  • Comparison Site Distribution
  • Fund Partner Distribution Arrangements
  • Guidance and Support Propositions

By Region

  • North America
  • Western Europe
  • East Asia
  • South Asia and Pacific
  • Latin America
  • Middle East and Africa
  • Eastern Europe

Scope, Methodology, and Coverage

Every figure in this report is reproducible from documented input assumptions. The scope below maps the historical period, the forecast horizon, the segmentation dimensions, and the countries covered, alongside the underlying primary and qualitative methodology.
Historical Period
2020 to 2025
Forecast Period
2026 to 2036
Base Year
2025 (USD billions; MMA Primary Research Dataset, August 2026)
Market Definition
Scope covers revenue earned by direct-to-consumer investment platforms operating in the United Kingdom, spanning pension wrapper administration including self-invested arrangements, advice and guidance services delivered to platform customers, platform custody and administration fees charged on assets held, trading commissions and foreign exchange charges on customer dealing, fund manager rebates and distribution payments received, and interest margin retained on uninvested client cash balances. Adviser-facing platform revenue where an intermediary holds the client relationship, discretionary wealth management fees, fund management fees earned by asset managers on their own products, banking net interest income earned outside platform cash arrangements, institutional and professional brokerage, and spread betting or contract for difference revenue are excluded from the market size and all derived figures.
Quantitative Units
USD billions of platform revenue (current prices); assets under administration in GBP billions; cash interest share of revenue as percentage; platform charges as percentage of assets; wrapper transfer duration in days
Segmentation Dimensions
By Revenue Line; By End-Use Industry; By Commercial Dimension; By Region
Regions Covered
North America, Western Europe, East Asia, South Asia and Pacific, Latin America, Middle East and Africa, Eastern Europe
Countries Covered
United Kingdom, with customer holding and operations analysis across USA, India, Ireland, Poland, Japan, Germany, France, China, Australia, UAE, South Africa, Canada, Switzerland, Netherlands, Spain
Key Companies Profiled
Hargreaves Lansdown, interactive investor, AJ Bell, Fidelity International, Vanguard UK, Freetrade, Trading 212, eToro, IG Group, Charles Stanley Direct, Bestinvest, Halifax Share Dealing, Barclays Smart Investor, Nutmeg, Moneybox, Wealthify, Plum, InvestEngine, Robinhood UK, Saxo
Quantitative Methodology
Primary survey, n=3,800 respondents, Q4 2025, six countries; demand-side model with trade association cross-validation
Qualitative Methodology
47 expert interviews, Q4 2025; applied to validate demand model assumptions, identify emerging dynamics, and assess competitive positioning
Report Format
PDF and XLSX data workbook (Word format preview document)
Publisher
Market Minds Advisory
Report Code
MMA-2026-TEC-331
Published
August 2026
Contact
sales@marketmindsadvisory.com | www.marketmindsadvisory.com

Purchase the full United Kingdom E-Brokerage Market Report (2026 to 2036).

The full report runs to 165 pages and covers all six revenue lines, seven regions and 20 profiled platforms in detail. It includes the complete segment CAGR set, cash interest revenue modelled against a normalising rate environment, and total annual cost comparison between percentage and flat fee models across the full range of account sizes. Company profiles carry evaluation on disclosed direct-to-consumer platform revenue, with moat and risk assessment for the top five providers. The competitive section extends to 13 tracked regulatory, pricing and transfer developments across 2024 and 2025. Primary research inputs include a quantitative survey of 3,800 respondents and 47 expert interviews conducted in Q4 2025.
Six revenue lines with individual CAGR forecasts
Seven regions covering domestic revenue and offshore operations
Twenty platform profiles on consistent revenue evaluation basis
Thirteen tracked regulatory and pricing developments with commercial interpretation
Cash interest revenue modelled against a normalising rate environment
Total cost compared across percentage and flat fee pricing models

Built For The People Who Decide

From boardroom strategy to bench-side execution, this report is read cover-to-cover by leaders shaping the next decade of their industry, turning demand scenarios, market dynamics and valuation benchmarks into decisions.
CXOs/ Presidents/ VPs/ Managers
M&A and Corporate Development
Strategy Teams and R&D Heads
Procurement and Product Directors
Regulatory and Compliance Leaders
Investor Relations and Equity Analysts