Market Minds Advisory
Dynamic NFT (dNFT) Market

Dynamic NFT (dNFT) Market: Dynamic NFTs: State Management Wearing a Collectible's Clothes, and the Metadata Problem Nobody Fixed

Roughly 34% of deployed tokens already point at storage that no longer resolves, which is the same failure the collectibles market never addressed before it collapsed both publicly and expensively.

Lead Analyst

Published

September 2026

Make Smarter Decisions with Customized Research Insights

Request a free sample report and evaluate market opportunities, growth trends, and competitive dynamics relevant to your business needs.

2025 MARKET VALUE$0.6BMarket Size 2025
2036 FORECAST VALUE$3.8BBase Case , 2026 to 2036
CAGR 2026 TO 203618.4 %Bull 19.6% / Bear 17.2%
INCREMENTAL OPPORTUNITY$3.1BNet 10- year value creation
EXPANSION MULTIPLE5.41x2036 value over 2026 base
Strategic Levers
M&A Pipeline
Regional Outlook
Country Rankings
Competitive Intelligence
Segmental Deep-dive
Call-Us : 91 93563 13602

Executive Snapshot and Market Trajectory.

What survived the collectibles collapse is the token that does a job. A dynamic token holds state that changes: a membership tier, an item's progression, an asset's condition. That is infrastructure rather than a picture, and it is why gaming now carries about 58% of activity today.
Game item and progression tokens grow at 27.6%, half again the market rate of 18.4%, because a studio needs verifiable item state across a player base and blockchain happens to provide it. Loyalty and membership tiers follow at 23.0%. East Asia takes 38% of value and South Asia and Pacific 20%, since that is where the game studios actually are. Ticketing and access credentials follow at 19.8% on a similar state argument.
Concentration sits near 29% across the top five on measured infrastructure and platform revenue, the most fragmented picture in consumer technology. About 34% of deployed tokens already point at storage that no longer resolves, which is the same unaddressed failure the collectibles market carried into its collapse. Permanence costs money continuously while issuance happens exactly once, and nobody budgets that difference. It surfaces only years later.
Market Definition
This market covers infrastructure, platform and service revenue enabling tokens whose state changes after issuance, spanning game item and progression tokens, loyalty and membership tier tokens, ticketing and access credentials, physical asset provenance and condition, sports and entertainment collectibles, and identity and credential attestation. Revenue is measured as platform subscription, infrastructure usage and attributable implementation value at supplier level. Token trading and marketplace transaction value, cryptocurrency exchange revenue, static collectible issuance, blockchain network validation rewards, and general wallet software are excluded.
Base Year Value
$0.6B in 2025 (MMA Primary Research Dataset, September 2026)
Forecast Period
2026 to 2036, eleven discrete annual values
CAGR
18.4% base case. Bull 19.6%. Bear 17.2%.
Fastest Growth Segment
Game Item and Progression Tokens: 27.6% CAGR
Fastest Growth Country
Vietnam: 22.4% CAGR
Fastest Growth Region
South Asia and Pacific: 20.6% CAGR
Largest Region
East Asia: 38% of 2025 global value
Market Leaders
Immutable, Chainlink, Alchemy, Dapper Labs and Animoca Brands lead on measured infrastructure and platform revenue. Source: MMA Primary Research Dataset, July 2026.
Primary Survey
n=3,800 procurement and R&D decision-makers, Q4 2025, six countries
Methodology
Demand-side build-up, cross-validated against public data, 47 expert interviews

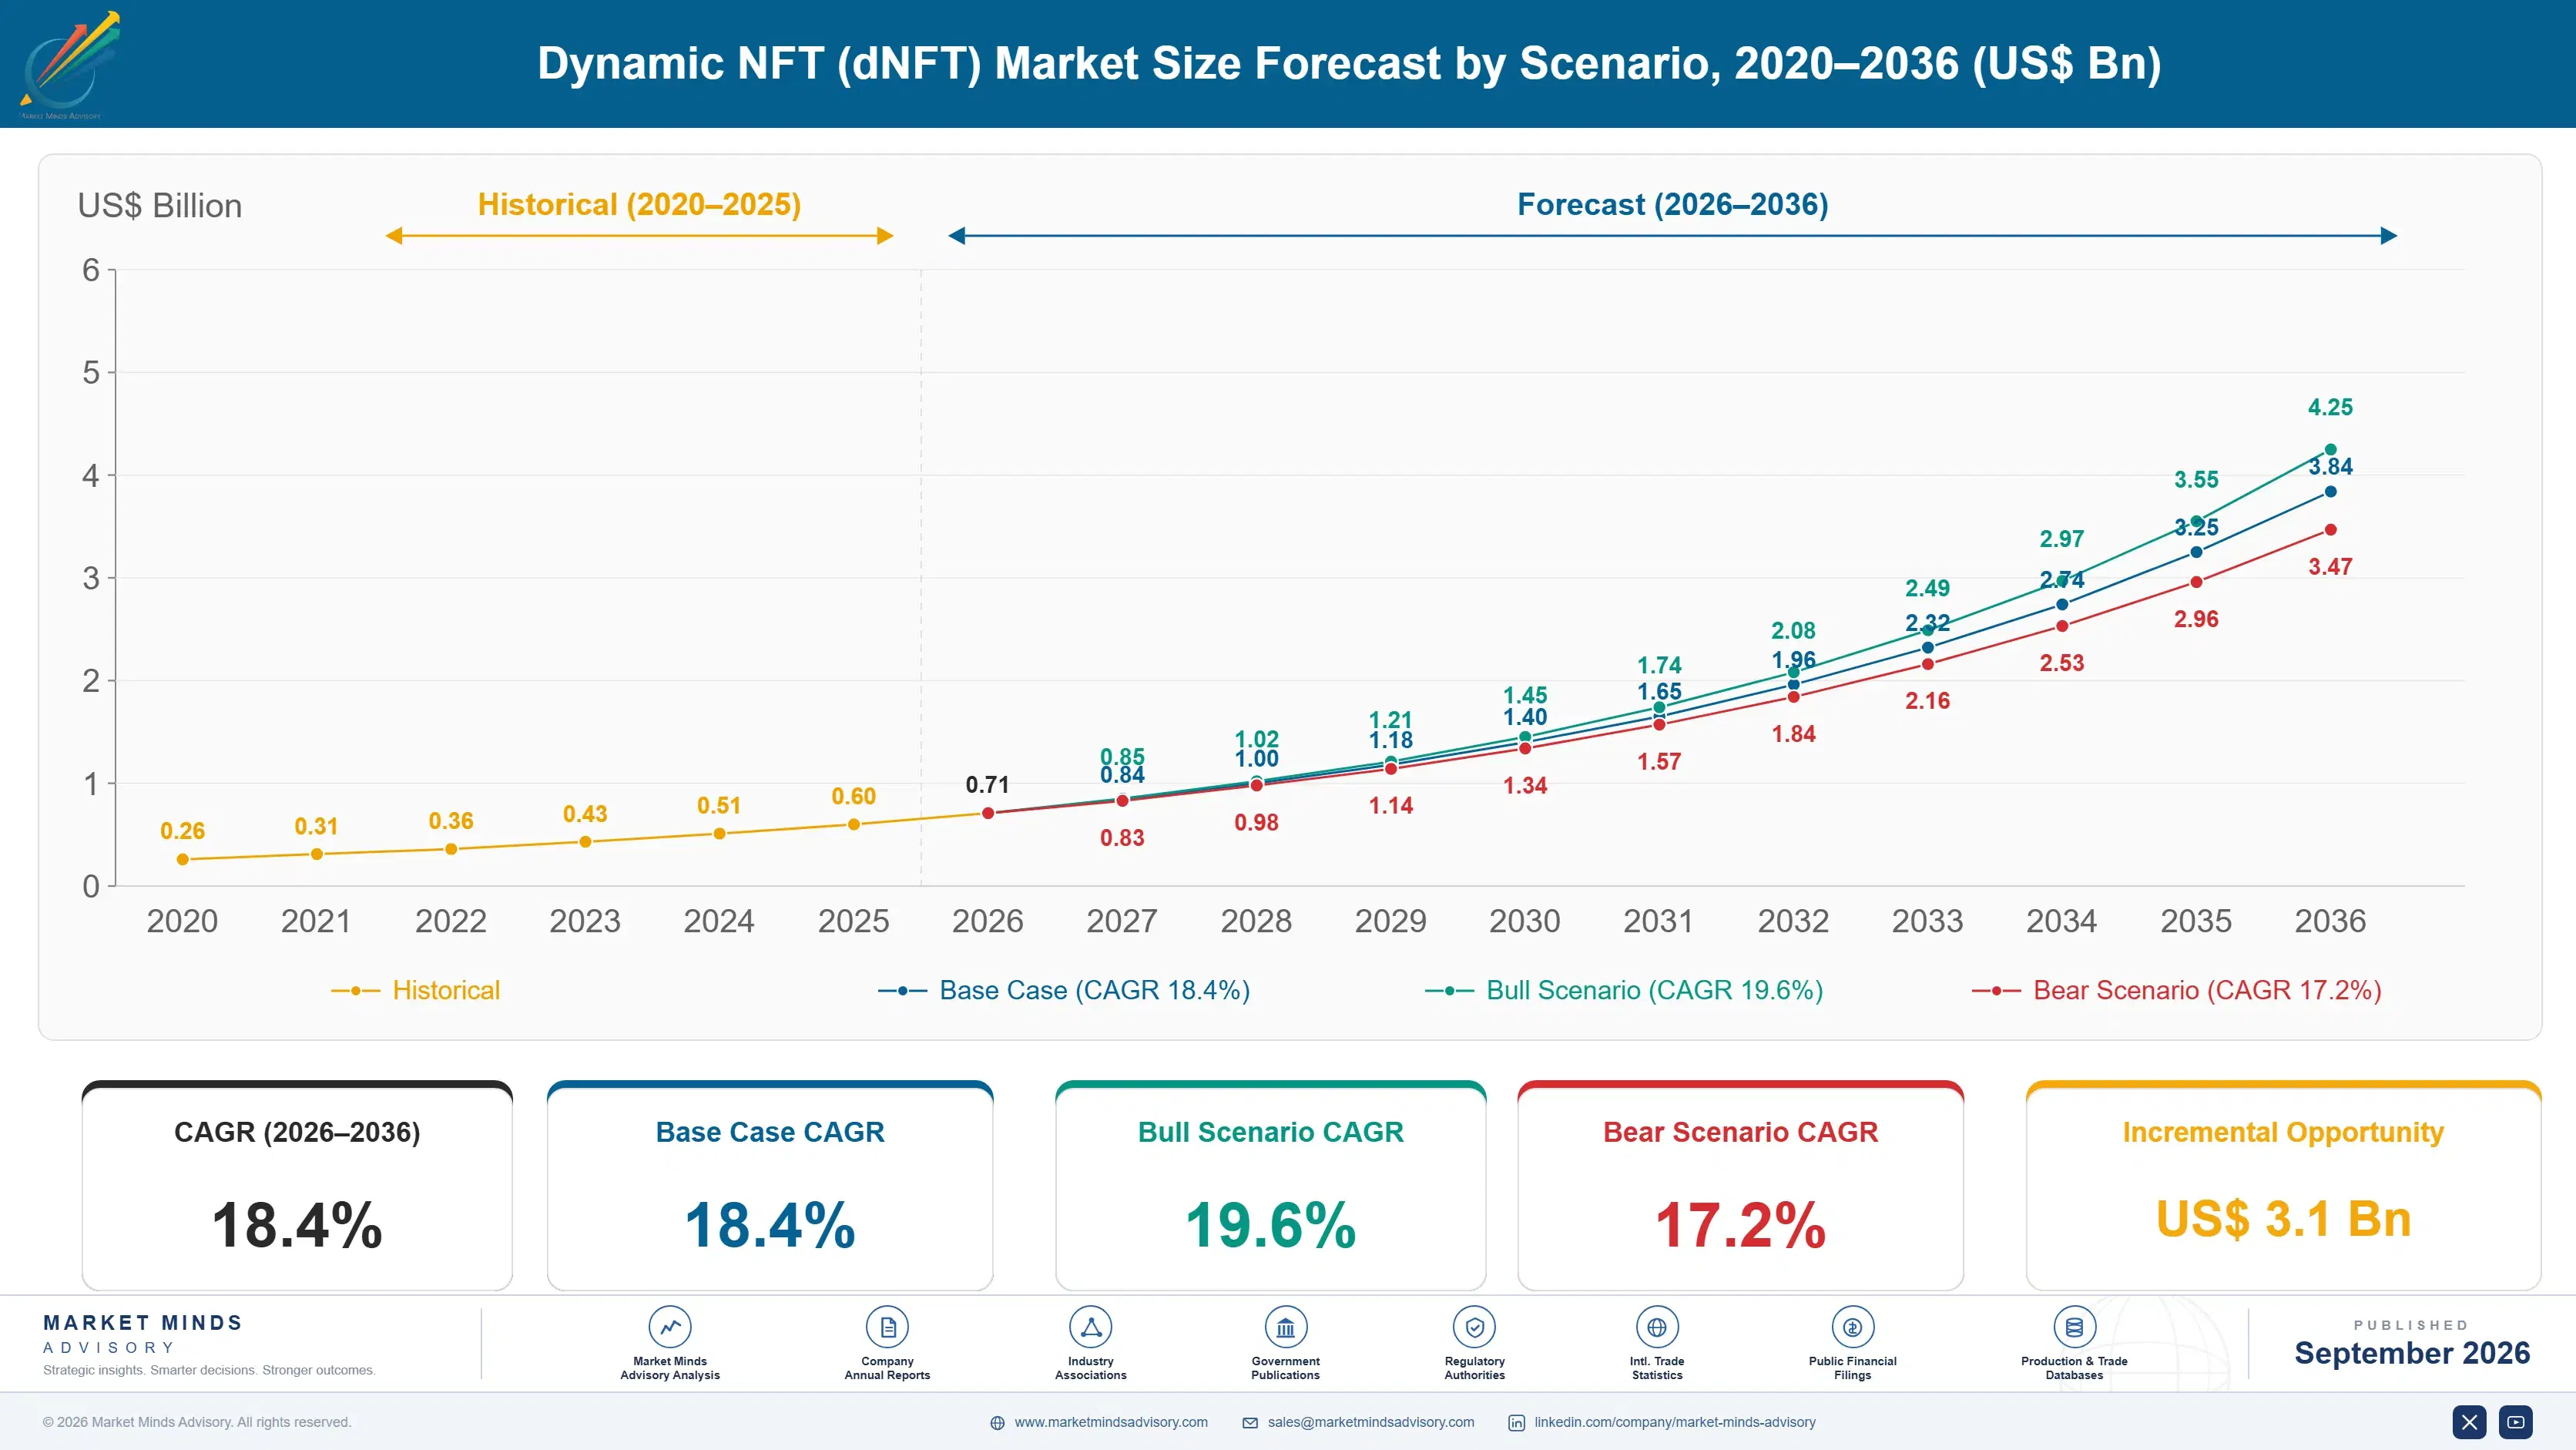
Dynamic NFT (dNFT) Market Forecast Scenarios

dynamic-nft-dnft-market-size-forecast-scenario-1788454921881
Growth ran at 17.4% from 2020 to 2025, which flatters a period containing an enormous expansion and an equally complete collapse. Static collectible issuance rose and fell within eighteen months, taking the category's reputation with it. What remained afterwards was a much smaller body of work where the token held changing state that an application actually needed, principally inside games where item ownership and progression are difficult problems.
The base case at 18.4% rests on three mechanisms. Game studios need verifiable item state across large player populations and across titles, which is a real engineering requirement that tokens address adequately, and gaming already carries about 58% of activity. Loyalty programmes use tier tokens to make status portable between partners. Third, wallet abstraction adopted in roughly 71% of consumer deployments now hides the blockchain entirely, which removes the objection that killed earlier attempts.
The bull case at 19.6% assumes abstraction continues improving until consumers never encounter a wallet, key or gas fee at all. The bear case at 17.2% is that metadata permanence remains unsolved, with about 34% of deployed tokens already pointing at dead storage, and that a visible brand programme failure repeats the reputational damage the collapse already caused.

The Token That Does a Job

The useful way to read this market is to ask what the token is for. A static collectible is a picture with a receipt, and that market found its limits publicly and expensively. A dynamic token holds state that changes after issuance, which makes it a record rather than a representation. Gaming carries about 58% of activity because item ownership across a player base is a genuine engineering problem.
TOP FIVE CONCENTRATION29%Highly fragmented across infrastructure and platform providers worldwide
DEAD METADATA SHARE34%Deployed tokens pointing at storage no longer resolving
ORACLE UPDATE COSTUSD 0.11Expense of writing one state change to a token
GAMING SHARE OF VOLUME58%Token activity originating inside interactive entertainment titles alone
WALLET ABSTRACTION ADOPTION71%Consumer deployments hiding blockchain mechanics from end users
PROGRAMME SURVIVAL RATE22%Brand token programmes still operating after two years
The unglamorous flaw is metadata permanence and almost nobody discusses it. Roughly 34% of deployed tokens point at storage that no longer resolves, which means the token exists and what it referred to does not. For a static collectible that is embarrassing. For a token representing a membership tier or an asset's condition it is broken, since the point was that state stayed accurate for years.
Consumer deployments have also stopped mentioning what they are built on. Wallet abstraction is used in roughly 71% of them, hiding keys, gas and chains entirely from the person holding the token, because the terminology repelled ordinary users during the previous cycle. Vendors still selling technology rather than capability address enthusiasts, and only 22% of brand programmes survive two years.
"The programmes that work are the ones where nobody involved says the word token to a customer. It is a loyalty tier, an item, a ticket. The moment a brand markets the mechanism instead of the benefit, the programme becomes a story about technology and it dies within eighteen months."
Director, Digital Assets and Consumer Platform Infrastructure Practice · MMA Technology Practice · September 2026

Market Trends

Wallet Abstraction Removes the Word Blockchain Entirely

Roughly 71% of consumer deployments now hide keys, gas fees and chain selection from the person holding the token, presenting a membership tier or a game item exactly as any application would. That removes the friction and the terminology that repelled ordinary users through the previous cycle, and it changes who can sell these programmes internally at a brand. The mechanism becomes an implementation detail rather than a marketing claim. Vendors still leading with the technology are selling to enthusiasts rather than to product teams. Product teams can now approve what enthusiasts never could.
Market Impact: Carries 58% of market activity

Game Studios Adopt Tokens as State Infrastructure

Verifiable item ownership and progression across large player populations, and increasingly across several titles, is a genuine engineering problem that studios previously solved with proprietary databases nobody outside the studio could verify. Tokens address it adequately and gaming now carries about 58% of activity in this market. Studios adopt for durability and interoperability rather than for any speculative reason, and they generally do not tell players what the underlying mechanism is. Game item tokens grow at 27.6%, faster than anything else here. The underlying engineering argument predates this technology by roughly two decades.
Market Impact: Updates state for USD 0.11

Market Opportunities and Growth Drivers

Item State Across Titles Is Genuinely Hard to Build

A studio operating several games wants an item earned in one to be recognised in another, and building that across separate proprietary systems requires trust arrangements between engineering teams that rarely survive a reorganisation. A token holds the state independently of any single title's database, which is why studios adopt it for durability rather than for anything speculative. Gaming carries around 58% of activity on that reasoning. The engineering argument is sound and it has nothing to do with what the previous cycle sold. Players are generally not told what sits underneath, and generally do not ask.
Market Impact: Breaks 34% of deployed tokens

Loyalty Tiers Become Portable Between Partners

A membership tier held as a token can be recognised by partner businesses without either party integrating a loyalty database, which is the arrangement that coalition programmes have always struggled to make work commercially. State updates cost around USD 0.11 each, so tier changes are economically trivial at consumer volumes. Loyalty and membership tokens grow at 23.0% on that portability. The buyers are customer marketing teams who want the outcome and would prefer never to explain the mechanism to anybody. Coalition loyalty programmes have failed commercially for decades on exactly this integration problem.
Market Impact: Survives in 22% of programmes

Market Restraints and Challenges

A Third of Deployed Tokens Already Point at Nothing

Roughly 34% of tokens in circulation reference metadata storage that no longer resolves, because the hosting was paid for once and the project ended or moved. The root cause is that permanence costs money continuously while issuance is a single event, and nobody budgets for the difference. Commercially this destroys the whole premise for anything representing state that must stay accurate for years. Mitigation runs through permanent storage arrangements paid at issuance, which several platforms now default to and most still do not. Nobody notices until several years after the programme launched. Then everybody does.
Market Impact: Hides mechanics in 71% of deployments

Brand Programmes Mostly Do Not Reach Their Third Year

Only about 22% of brand token programmes are still operating after two years, generally because they were launched as marketing statements about technology rather than as capabilities customers wanted. The root cause is that the previous cycle taught brands to announce the mechanism, which produces attention rather than usage. Commercially this makes the segment look larger than its durable base. Suppliers mitigate by refusing programmes without a customer-facing purpose, which costs revenue and improves the reference list. Attention is not usage, and the previous cycle taught brands to pursue the first one. That lesson persisted.
Market Impact: Fastest segment at 27.6% growth
4 additional market trends, 3 additional growth drivers, and 2 additional restraints and challenges are covered in the full report. Contact sales@marketmindsadvisory.com to access the complete intelligence.

Segment CAGR and Growth Architecture

Segmentation follows what the changing state actually represents, because that determines whether anybody needs it. An item's progression, a membership tier and an asset's condition are three different records with three different buyers, and only the ones where the state genuinely changes and matters have produced durable programmes so far. Very few actually qualify.
dynamic-nft-dnft-market-market-share-analysis-1788454922480

Game Item and Progression Tokens

Game item tokens grow at 27.6%, half again the market rate of 18.4%, because verifiable item state across large player populations and across several titles is a genuine engineering problem studios previously solved with databases nobody outside could verify. Adoption is for durability and interoperability rather than for anything speculative, and studios generally do not tell players what mechanism sits underneath. Gaming carries around 58% of all activity in this market. The risk is concentration: a market this dependent on one application category inherits that category's cycles entirely, and game economics move sharply. Studios also negotiate cost per update at every renewal, since item economies generate constant state changes at player population scale.
CAGR 27.6%

Loyalty and Membership Tier Tokens

Loyalty tier tokens grow at 23.0% because a status held as a token can be recognised by partner businesses without either side integrating a loyalty database, which is what coalition programmes have always struggled to achieve commercially. State changes cost around USD 0.11, so tier movement is economically trivial at consumer volumes. The buyers are customer marketing teams who want portability and would prefer never to explain the mechanism to a customer. Programme survival at roughly 22% after two years reflects how many were launched as technology announcements rather than as capabilities anybody wanted. The programmes that lasted connected to an existing loyalty record rather than duplicating one, which is a smaller claim and a far better outcome.
CAGR 23.0%
Full segment breakdown across 6 segments available in the complete report.

Regional Architecture and Country Demand Map

Value follows where game studios and consumer platforms build rather than where tokens are eventually held. Gaming concentration makes the geography look like the interactive entertainment industry rather than like any financial market. Where tokens are eventually held tells you almost nothing commercially useful at all.

East Asia

East Asia holds 38%, above the regional band, because gaming carries around 58% of activity in this market and Korean, Japanese and Chinese studios operate the largest player populations anywhere with the most developed item economies. Korean studios in particular had been running tradeable item systems for two decades before tokens existed, which made adoption a technical substitution rather than a conceptual leap. Japanese entertainment properties support collectible and membership programmes at scale. Chinese activity operates under domestic regulatory conditions that separate it substantially from the rest of the region. Metadata permanence practice is better here than elsewhere, since studios treat item records as long-lived infrastructure rather than as campaign assets that end.
Share: 38% | CAGR: 19.4% (2026 to 2036)

North America

American demand divides between game studios adopting item state infrastructure and consumer brands running loyalty and ticketing programmes, with the second group producing most of the visible failures. Programme survival near 22% after two years is lowest here, because the previous cycle taught American marketing teams to announce the mechanism rather than the benefit. Infrastructure and platform suppliers are concentrated here regardless. Growth at 19.2% runs ahead of the market on gaming adoption and on ticketing programmes where the state argument is genuinely sound. Metadata permanence is worst here, since campaign-driven programmes budgeted hosting for a marketing period rather than a decade. Oracle and platform infrastructure suppliers are nonetheless concentrated here, which is where most engineering happens.
Share: 22% | CAGR: 19.2% (2026 to 2036)
Regional intelligence for 5 additional markets available in the complete report: South Asia and Pacific, Western Europe, Middle East and Africa, Latin America, Eastern Europe. Contact sales@marketmindsadvisory.com.
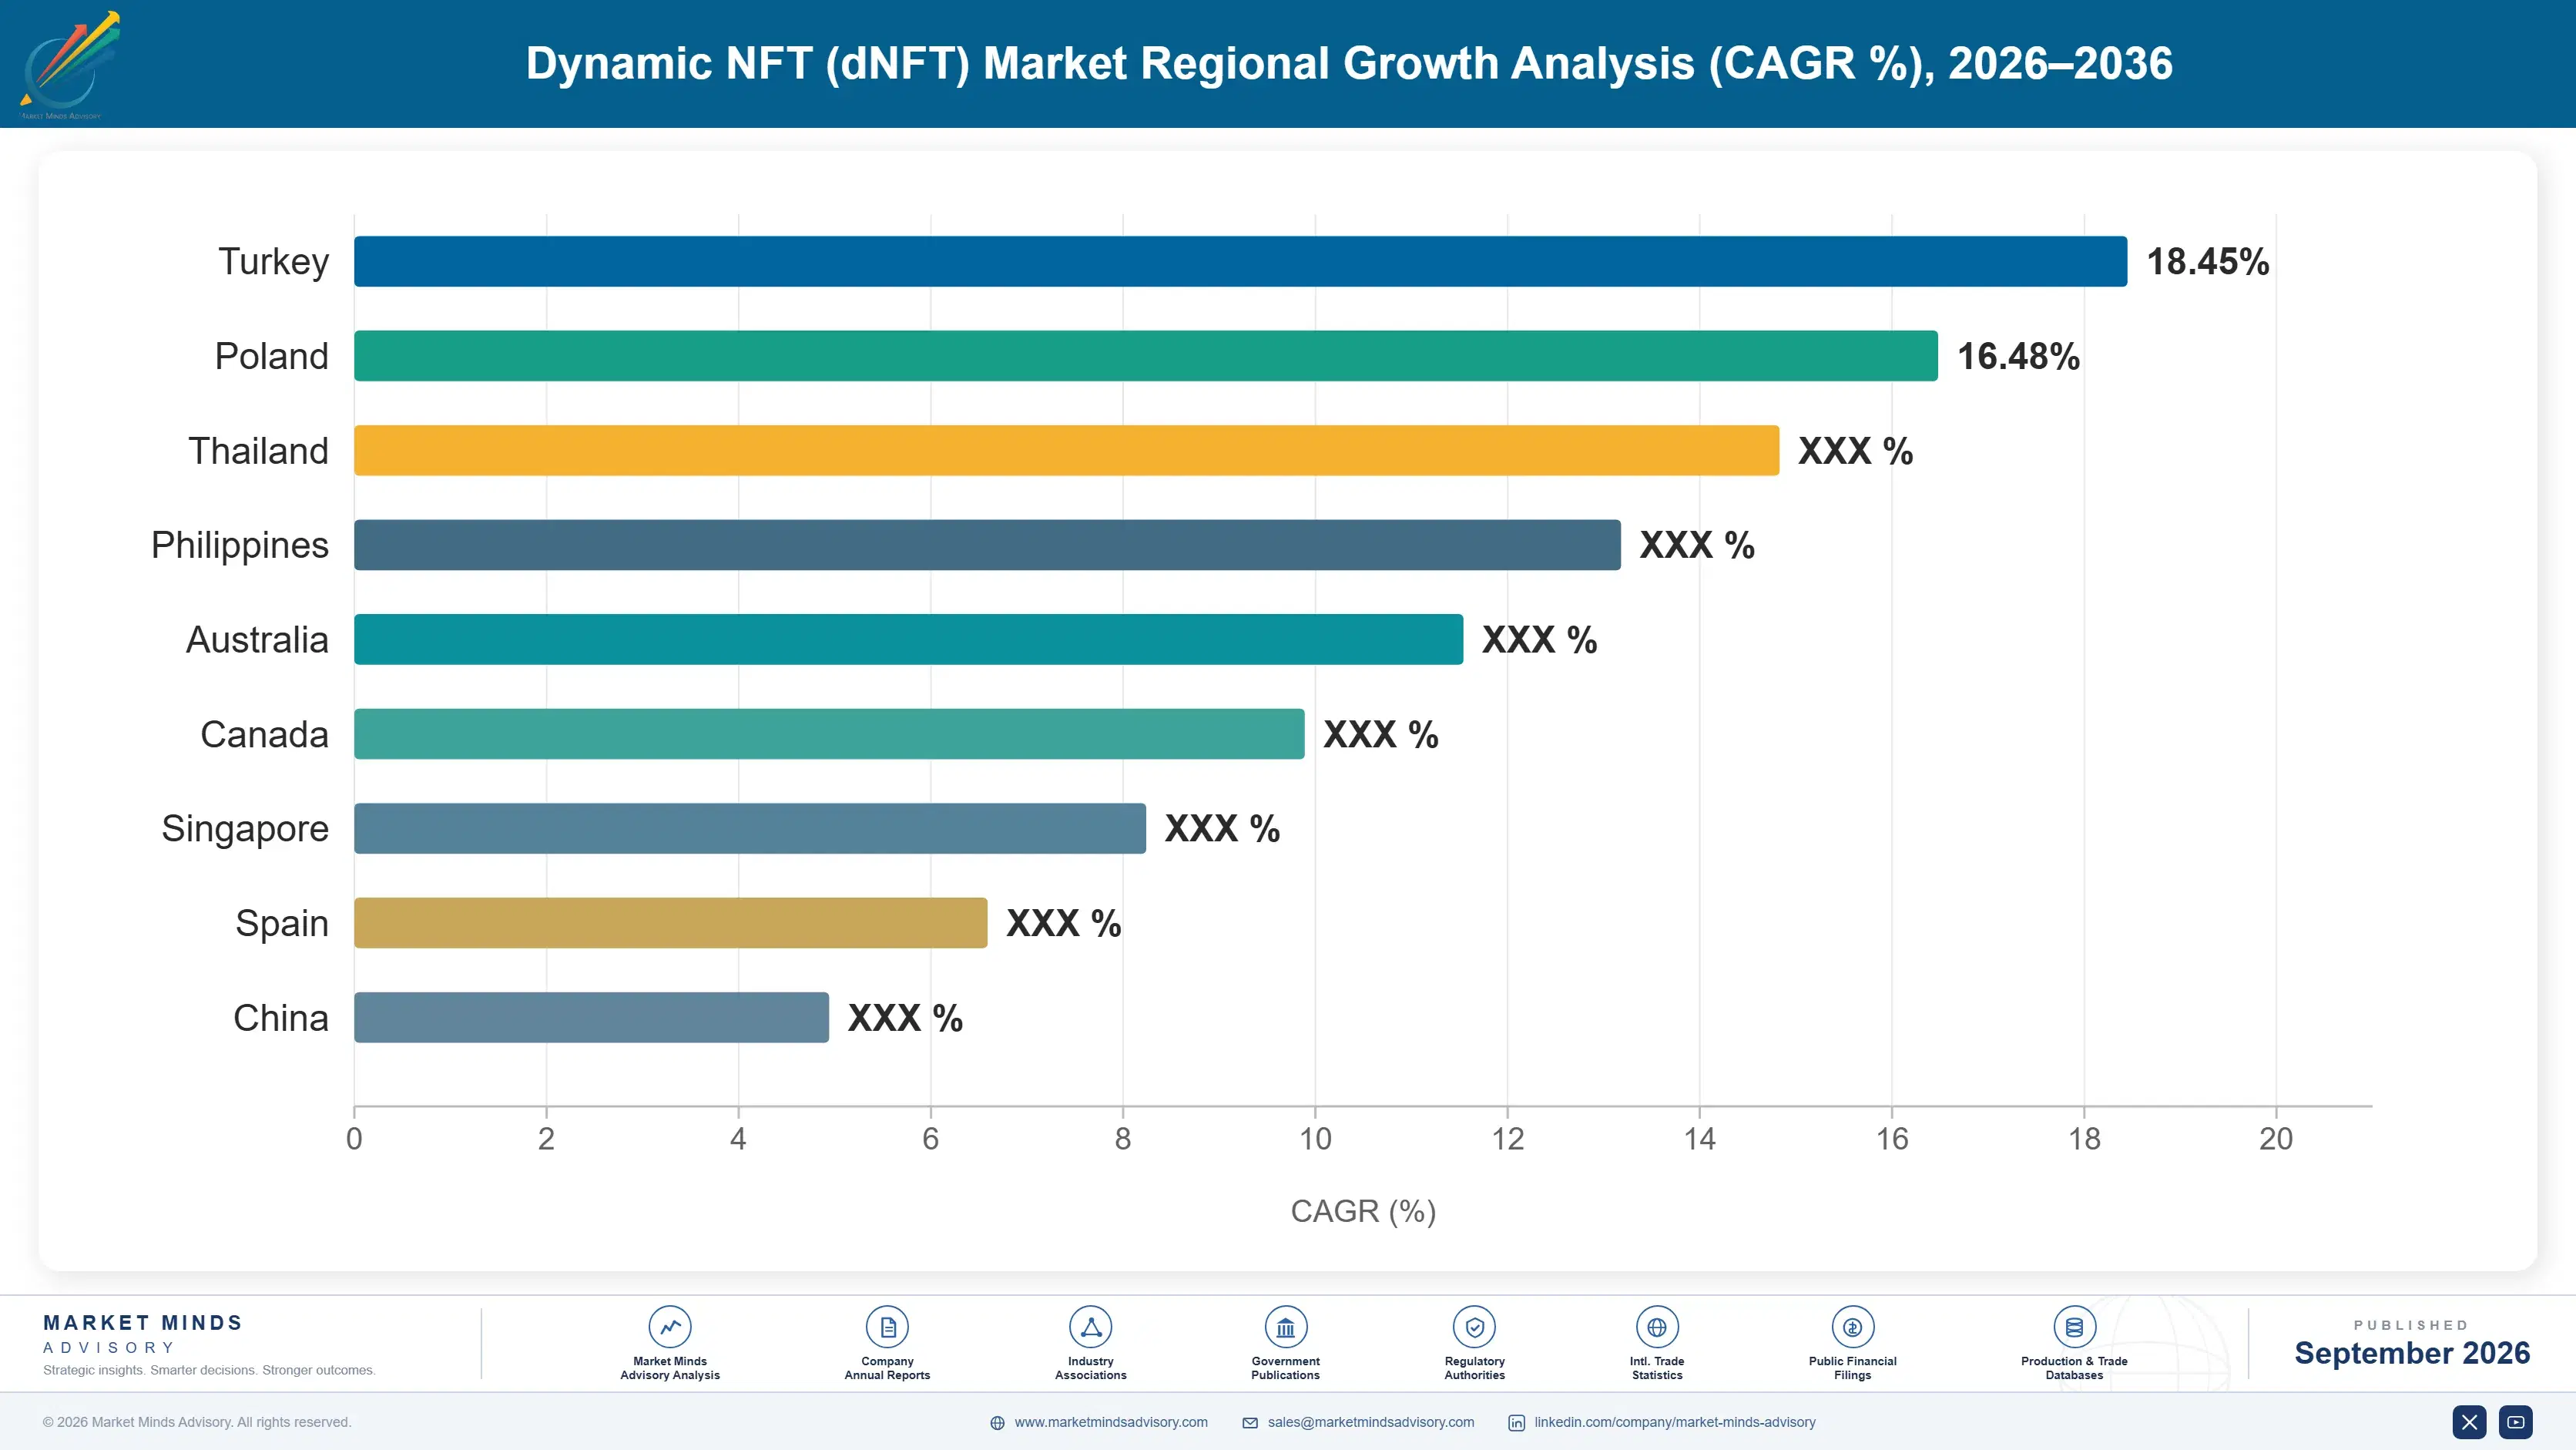
dynamic-nft-dnft-market-country-cagr-analysis-1788454923013

Selling Capability and Never Mechanism

The previous cycle established that consumers dislike the vocabulary and that programmes announcing the technology die inside two years. Everything commercially durable here hides the mechanism, solves a state problem somebody actually had, and pays for metadata permanence that nobody currently budgets for at issuance. The vocabulary itself has quietly become the commercial liability here.

Never Let a Customer See the Mechanism

Wallet abstraction is used in roughly 71% of consumer deployments precisely because keys, gas and chain names repelled ordinary users through the previous cycle, and the programmes surviving two years are the ones where nobody said the word token to a customer. Vendors leading with capability rather than technology reach product and marketing teams instead of enthusiasts, and their programmes survive at around 3 times the general rate. It requires giving up the vocabulary the industry built its identity on. Enthusiasts do not hold consumer programme budgets, which is really the commercial point.
Market Impact: Survives at around 3 times the usual rate

Charge for Metadata Permanence at Issuance

About 34% of deployed tokens point at storage that no longer resolves, because permanence costs money continuously while issuance is a single event and nobody budgets the difference. Platforms defaulting to permanent storage paid at mint add roughly 8% to issuance cost and remove the failure that destroys the entire premise for state-holding tokens. Customers accept the charge once somebody explains what happens otherwise. Most platforms still treat storage as the customer's problem, which it becomes about three years later. Three years later there is nobody left at the customer to fix it.
Market Impact: Adds roughly 8% to the total issuance cost

Follow Game Studios Rather Than Consumer Brands

Gaming carries around 58% of activity and adopts for genuine engineering reasons, while consumer brand programmes survive at roughly 22% after two years because most were announcements rather than capabilities. Suppliers concentrating on studios hold accounts that renew with title lifecycles rather than with marketing campaigns. Studio accounts run around 4 times the average retained duration of brand programmes. It means declining launch revenue from brands whose programmes will not exist in three years, which is difficult to do. Launch revenue from a programme that will not exist in three years is not revenue.
Market Impact: Retains around 4 times longer than brand programmes

Price Oracle Updates Into Predictable Subscription

State changes cost around USD 0.11 each, which is trivial per event and unpredictable in aggregate for a customer running a loyalty or item programme at consumer scale. Converting usage into a subscription band removes the budgeting problem that makes finance teams block deployments they otherwise approve. Subscription pricing raises programme approval rates by around 35% against usage billing at the same effective cost. The pricing conversation is where these deals stall, far more often than the technical one. Engineering-led suppliers are consistently surprised that pricing stops more deployments than any architecture question.
Market Impact: Raises programme approval rates by around 35% overall

Who Controls the Margin Pool

Concentration sits near 29% across the top five on measured infrastructure and platform revenue, the most fragmented picture in consumer technology, and fragmentation persists because participants sit at layers that do not substitute for one another. Chain and infrastructure providers supply the underlying capability. Oracle networks supply the state updates. Platform and studio operators build the applications, and several of the largest are game companies rather than technology vendors at all.
Competition runs on three dimensions. Abstraction quality is first among consumer deployments, since anything exposing keys or gas to an end user fails commercially regardless of technical merit. Second is gaming capability, because that is where 58% of activity sits and studios evaluate on latency, cost per update and integration into existing engines. Third is permanence engineering, which almost nobody markets and which determines whether a deployment still works in three years.

Two pressures will move positions. Gaming concentration means this market inherits interactive entertainment cycles wholesale, and a downturn in game economics would hit infrastructure providers who thought they were diversified. Meanwhile brand programme failures at roughly 78% within two years are producing a reference problem that suppliers who accepted those launches will carry into every subsequent conversation.
dynamic-nft-dnft-market-company-positioning-matrix-1788454923548

Competitive Moat and Risk Dimensions

IMMUTABLE

Moat: Game engine integration depth

Immutable built specifically for game item state rather than adapting general token infrastructure, which shows in engine integration, cost per update and the tooling studios need at scale. Gaming carries around 58% of activity, so that focus addresses the largest part of the market directly. Studio relationships renew with title lifecycles rather than with marketing campaign cycles.
IMMUTABLE

Risk: Single category concentration

Revenue depends heavily on interactive entertainment, which moves through cycles that have nothing to do with token technology and can turn sharply on studio economics. Loyalty, ticketing and credential applications require different capabilities and reach entirely different buyers. Building beyond gaming means competing against platforms that started in consumer brand work and understand marketing procurement considerably better.
CHAINLINK

Moat: Oracle network position

Chainlink supplies the external data connections that make a token dynamic at all, which places it inside every deployment where state changes in response to anything happening outside the chain. That position is genuinely difficult to replicate, since it depends on node network scale and operating history rather than software. Its infrastructure serves applications that compete directly with one another.
CHAINLINK

Risk: Update cost sensitivity

State updates costing around USD 0.11 each are trivial individually and material in aggregate for consumer scale programmes, which makes the position exposed to customers seeking cheaper update paths or reducing update frequency. Gaming applications in particular update constantly and watch that cost closely. Alternative oracle approaches and application-specific solutions both attack the same expense line directly.

Players Tracked

Prominent Players

Immutable
Chainlink
Alchemy
Dapper Labs
Animoca Brands

Other Key Players

Polygon Labs
Sky Mavis
Consensys
Thirdweb
Moralis
Crossmint
Venly
Enjin
Forte
Mythical Games
Pinata
Arweave
Ava Labs
Ledger
Coinbase

Recent Developments

MARCH 2025

Consumer deployments standardise on hidden wallet infrastructure

Brands and studios launching token programmes adopted abstraction that removes keys, gas fees and chain selection from the user experience entirely, presenting tiers and items as ordinary application features. Programmes exposing those mechanics continued showing sharply lower adoption among mainstream users. Adoption gaps had been visible for two cycles.
Signal: The vocabulary the industry built its identity on is the thing consumer programmes now systematically remove.
JULY 2025

Platforms default to permanent storage after metadata failures accumulate

Issuance platforms began paying for permanent metadata storage at mint rather than leaving hosting to project owners, following widespread reports of deployed tokens referencing storage that no longer resolved. The change added modest cost to issuance and removed a failure mode appearing years afterwards. Nobody had budgeted the difference.
Signal: Permanence costs money continuously while issuance happens once, which is why the failure took years to surface.
NOVEMBER 2025

Brand token programmes wind down as launch cohorts reach two years

Consumer brand programmes launched during the previous cycle closed in numbers as they reached their second anniversary, most having been announced as technology initiatives rather than built around a capability customers wanted. Suppliers who had accepted those launches carried the references afterwards. Supplier reference lists suffered accordingly afterwards.
Signal: Programmes announcing the mechanism rather than the benefit are reaching the end of their natural life together.

What Running Tokens Costs

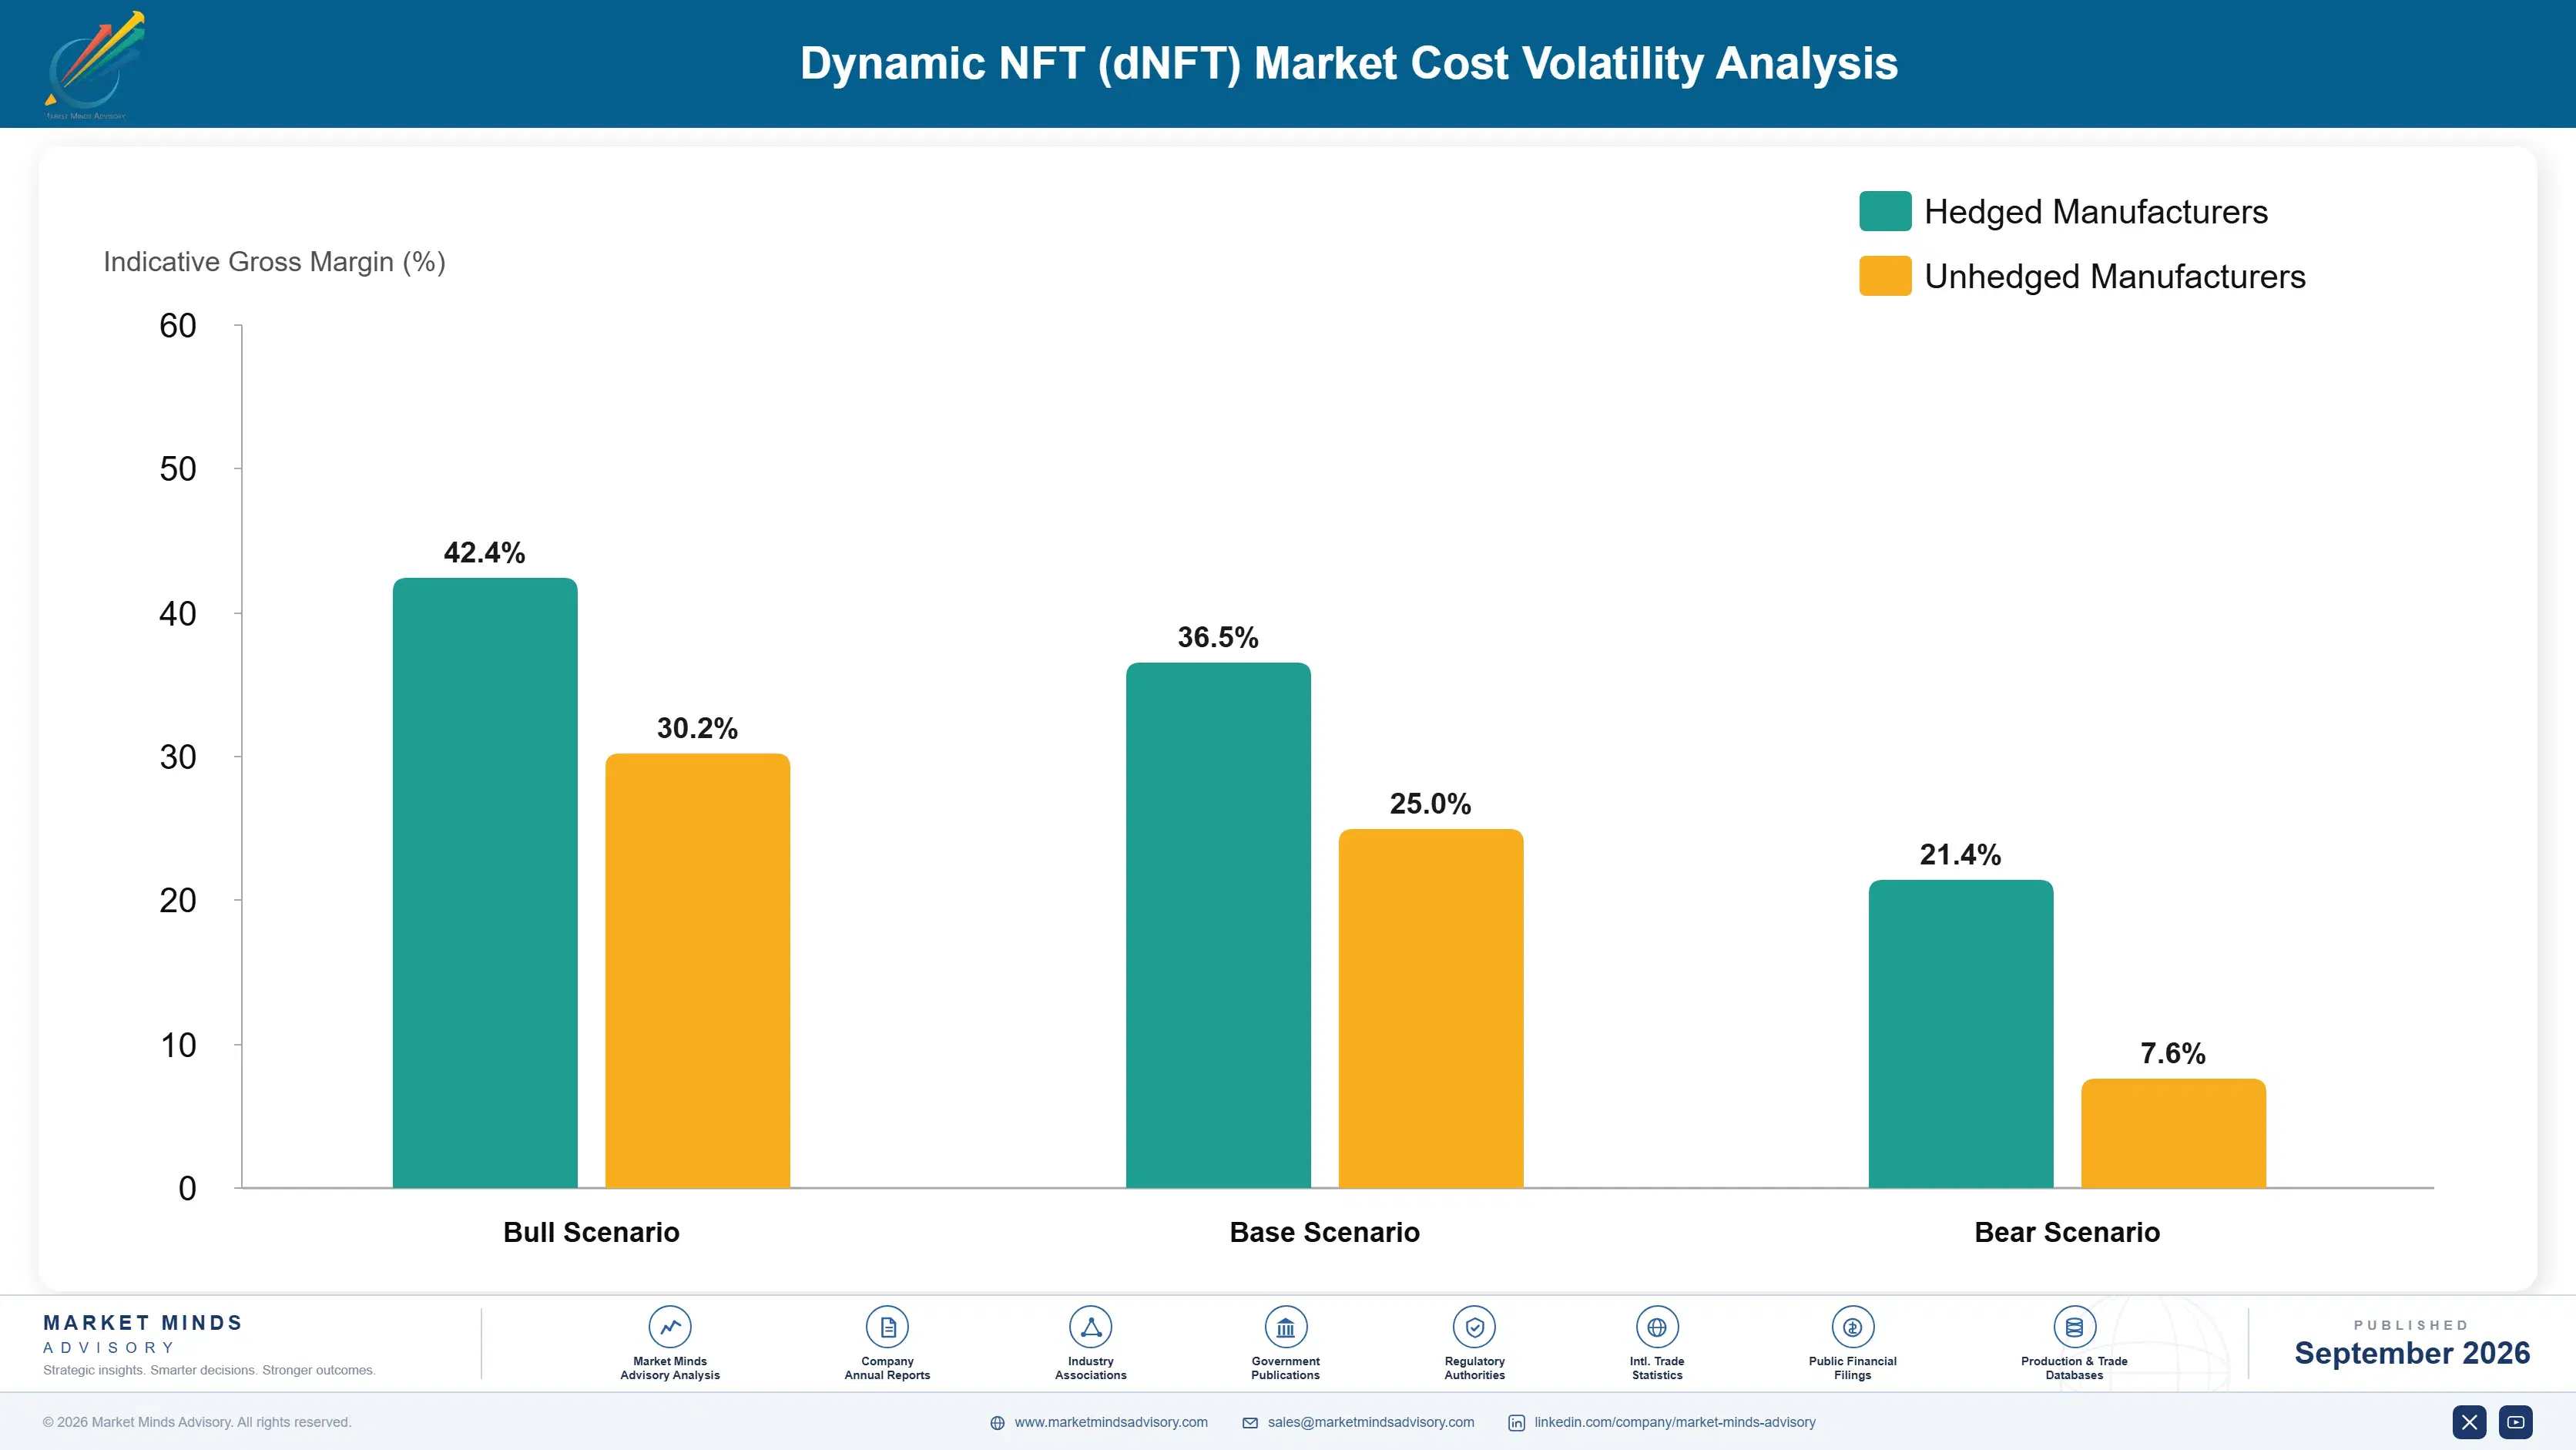
Cost structure divides between transaction costs nobody controls and engineering everybody underestimates. State updates through oracle networks cost around USD 0.11 each and scale directly with programme activity, which makes them predictable per event and hard to forecast in aggregate. Platform engineering, abstraction layers and integration with existing application infrastructure form the larger block, and abstraction work in particular is heavier than it appears.
Permanent storage has been the most consequential cost decision. Metadata hosting priced as a one-time payment at issuance costs more than a monthly arrangement in the first year and far less across a decade, which is exactly the trade nobody makes when a programme launches. Coinbase and Animoca Brands both referenced infrastructure and platform cost conditions in recent annual reporting. Platforms absorbing permanence into issuance pricing carry the cost visibly and avoid the failure entirely.

Exposure varies by customer type rather than by scale. Gaming customers update constantly and watch cost per update closely, which makes that expense the negotiated variable in every renewal. Consumer brand programmes update rarely and carry abstraction and support cost instead. Suppliers serving both carry two very different cost profiles under one platform, and pricing for one fits the other badly.
dynamic-nft-dnft-market-cost-volatility-analysis-1788454923750

Pay for permanent metadata storage at issuance

About 34% of deployed tokens point at storage that stopped resolving, because hosting was a recurring cost against a one-time event and somebody stopped paying. Permanent storage purchased at mint adds roughly 8% to issuance and removes a failure appearing years later. Customers accept it once the alternative is explained, and platforms defaulting to it never have the conversation twice.

Convert update costs into predictable subscription bands

State updates at around USD 0.11 each are trivial individually and unforecastable in aggregate, which is exactly the cost shape finance teams block regardless of total. Subscription bands remove the budgeting uncertainty at effectively the same cost and raise programme approval rates substantially. The pricing conversation stalls more deployments than any technical question does, which surprises engineering-led suppliers.

Build abstraction once rather than per deployment

Hiding keys, gas and chain mechanics is required in roughly 71% of consumer deployments and gets rebuilt per customer by suppliers treating it as integration rather than product. A packaged abstraction layer covering common wallet and payment paths removes that repetition. The investment is significant against services revenue it eliminates, which is why services-led suppliers keep deferring it.

Portfolio Architecture for Margin Defence

Margin architecture separates on whether the customer has an engineering alternative. Gaming infrastructure competes against studios building proprietary item systems, which they did for two decades before tokens existed, so pricing is disciplined by a genuine internal option. Loyalty and ticketing platforms face less internal capability and price better. Oracle and permanence infrastructure earns most, because almost nobody builds either and the alternatives are worse.
The tension runs between gaming volume and brand programme margin. Gaming carries 58% of activity, updates constantly and negotiates cost per update at every renewal, which produces substantial revenue at disciplined margins. Brand programmes pay considerably better per deployment and survive at roughly 22% after two years, which means the revenue is high margin and short lived. Suppliers weighted to brands report attractive numbers and rebuild their customer base continuously.

High-value revenue concentrates in oracle and state update infrastructure and in permanence services. Both are defended by capability almost nobody replicates internally, and both attach to programmes regardless of application category. Gaming platform revenue is the volume base, disciplined by internal alternatives and carrying the category cycles wholesale, which is a considerable exposure for anybody weighted entirely to it.

Volume / Commodity-Adjacent

Gaming platform and item infrastructure competing against proprietary systems studios built for two decades. The range reflects update cost efficiency and engine integration depth. Pricing is disciplined by an internal alternative customers genuinely understand how to build.
Gross Margin: 34-52%

Premium / Certified

Consumer loyalty, ticketing and credential platforms sold to marketing and operations teams with less internal capability. Margin depends on abstraction quality and support requirements. Programme survival rather than pricing is the commercial risk in this tier.
Gross Margin: 48-67%

Sustainability / Regulatory / Next-Generation

Oracle state update infrastructure and permanent metadata services attaching to deployments across every application category. The widest range in the portfolio, reflecting network position and storage arrangements. Highest margin and least replicated internally by anybody.
Gross Margin: 62-84%
dynamic-nft-dnft-market-portfolio-architecture-1788454924269

High-value Sub-segments and Strategic Watch-out

Oracle and State Update Infrastructure

High value with strong growth, attaching to every deployment where state changes in response to anything outside the chain and replicated internally by almost nobody. The range reflects network position and update volumes. Cost per update near USD 0.11 is the variable customers negotiate hardest at every renewal.
Gross Margin: 64-84%

Permanent Metadata Services

High value with growth arriving now that roughly 34% of deployed tokens demonstrate what happens without it. The range reflects storage arrangements and duration guarantees. It adds around 8% to issuance cost and removes the failure that destroys the premise for any state-holding token entirely. Nobody markets it.
Gross Margin: 60-80%

Gaming Platform Infrastructure

The volume core carrying around 58% of activity, disciplined in pricing by studios who built proprietary item systems for two decades and could again. The range reflects update efficiency and engine integration. It also carries interactive entertainment cycles wholesale into anybody weighted heavily toward it.
Gross Margin: 33-51%

Brand Announcement Programmes

The strategic watch-out, where roughly 78% of programmes close within two years because they were launched as technology statements rather than capabilities. Launch revenue looks attractive and the reference list afterwards does not. Suppliers accepting these programmes carry the failures into every subsequent conversation they have.
Gross Margin: 0-26%

What Makes Programmes Last

Recurrence depends entirely on whether the token does something. A game item token updates every time a player progresses, which produces continuous activity tied to engagement rather than to any purchasing decision. A loyalty tier updates when status changes, which is periodic and predictable. A programme launched as an announcement updates never, generates no recurring revenue and closes within two years.
Adoption depth varies with how far the token reaches into an application's own logic. A studio whose item ownership, trading and cross-title recognition all resolve through tokens has rebuilt part of its architecture around them and cannot readily unwind it. A brand displaying a token as a badge alongside an unchanged loyalty database can stop at any point without consequence. That distinction predicts survival far better than programme size or launch budget does.

The buyer moved from crypto-native teams to product and marketing organisations who want an outcome and would prefer not to discuss the mechanism at all. That shift is why abstraction reached roughly 71% of consumer deployments and why vendor vocabulary has become a commercial liability. Suppliers who kept the language of the previous cycle are selling to enthusiasts, and enthusiasts do not hold consumer programme budgets.
dynamic-nft-dnft-market-end-use-penetration-index-1788454924770

What Actually Survives Here

These are among the four positions where our research anticipates prominent divergence between winners and laggards over the coming forecast period. Each is grounded in the demand model, the regulatory perimeter, and the announced capacity pipeline.
01 / MECHANISM CONCEALMENT DISCIPLINE

Sell the capability and never name the technology

Roughly 71% of consumer deployments now hide keys, gas fees and chain selection entirely, because that vocabulary repelled ordinary users throughout the previous cycle and continues to do so wherever it survives. Programmes reaching their third year are consistently the ones where nobody said the word token to a customer, and vendors leading with capability rather than technology see programmes survive at around 3 times the general rate. It requires abandoning the language this industry built its whole identity upon.
02 / PERMANENCE COST OWNERSHIP

Pay for storage at mint or lose the token entirely

About 34% of deployed tokens already point at metadata storage that no longer resolves, because permanence is a continuing cost against an issuance event that happens exactly once and nobody budgets the difference between them at all. Platforms defaulting to permanent storage paid at mint add roughly 8% to issuance and remove a failure that destroys the entire premise for anything holding state over time. Most platforms still treat storage as the customer's problem, which it duly becomes about three years afterwards instead.
03 / STUDIO ACCOUNT PREFERENCE

Follow game studios rather than chasing brand launches

Gaming carries around 58% of all activity and adopts for genuine engineering reasons that predate this technology entirely, while consumer brand programmes survive at roughly 22% after two years because most were announcements rather than capabilities anybody wanted. Studio accounts renew with title lifecycles and run around 4 times the average retained duration of comparable brand programmes. It means declining attractive launch revenue from brands whose programmes will not exist in three years, which suppliers find genuinely difficult to do.
04 / UPDATE COST PREDICTABILITY

Band the usage cost before finance blocks the deployment

State updates at around USD 0.11 each are entirely trivial per event and genuinely unforecastable in aggregate for any programme running at consumer scale, which is exactly the shape of cost that a finance team blocks regardless of the total amount involved anywhere. Converting usage into subscription bands removes the budgeting uncertainty at effectively identical cost and raises programme approval rates by around 35% at effectively identical total cost. The pricing conversation stalls far more deployments than any technical question ever does in practice.

Engagement Snapshot From the Field

A live engagement with an industry participant carrying material or product regulatory and market exposure ahead of a defining policy shift, showing how our research translates into a defensible multi-year portfolio strategy.
MARKET MINDS ADVISORY · CLIENT ENGAGEMENT SUMMARY
Dynamic NFT (dNFT) Producer Strategic Portfolio Review and Transition Roadmap 2026·Investment Scenario on Dynamic NFT (dNFT) Exposure Evaluation 2025-26
CLIENT PROFILE
A global consumer brand operating a membership token programme launched two years earlier alongside a product campaign, with approximately 340,000 tokens issued (client-reported, unverified by MMA). Engagement had fallen steadily after launch, and the marketing team that commissioned it had since reorganised twice with no clear owner remaining anywhere. Nobody was accountable for it any longer.
STRATEGIC CHALLENGE
Annual platform and infrastructure cost approached USD 1.4 million and the programme was under review for closure (client-reported, unverified by MMA). Nobody could establish what holders actually did with the tokens, or whether the underlying metadata would still resolve if the current hosting arrangement lapsed at its renewal date next year.
MMA APPROACH
MMA examined what the tokens did rather than how many existed, which the client reported monthly. We traced holder activity across eighteen months, tested metadata resolution across a sample of issued tokens, interviewed 14 marketing, technology and legal staff, and compared the programme against surviving deployments elsewhere in the same category.
KEY FINDINGS
  1. About 91% of issued tokens had never changed state after issuance, because the programme had no mechanism by which anything would change them.
  2. Metadata for roughly 28% of tokens already resolved slowly or intermittently, and the hosting arrangement itself expired within eleven months of the review.
  3. The programme had been launched with the technology named prominently in campaign material, which surviving deployments elsewhere consistently avoided doing in their own material.
  4. A separate customer loyalty system already held tier status, and the token duplicated that record without connecting to it in any way.
CLIENT PROFILE
A global consumer brand operating a membership token programme launched two years earlier alongside a product campaign, with approximately 340,000 tokens issued (client-reported, unverified by MMA). Engagement had fallen steadily after launch, and the marketing team that commissioned it had since reorganised twice with no clear owner remaining anywhere. Nobody was accountable for it any longer.
STRATEGIC CHALLENGE
Annual platform and infrastructure cost approached USD 1.4 million and the programme was under review for closure (client-reported, unverified by MMA). Nobody could establish what holders actually did with the tokens, or whether the underlying metadata would still resolve if the current hosting arrangement lapsed at its renewal date next year.
MMA APPROACH
MMA examined what the tokens did rather than how many existed, which the client reported monthly. We traced holder activity across eighteen months, tested metadata resolution across a sample of issued tokens, interviewed 14 marketing, technology and legal staff, and compared the programme against surviving deployments elsewhere in the same category.
KEY FINDINGS
  1. About 91% of issued tokens had never changed state after issuance, because the programme had no mechanism by which anything would change them.
  2. Metadata for roughly 28% of tokens already resolved slowly or intermittently, and the hosting arrangement itself expired within eleven months of the review.
  3. The programme had been launched with the technology named prominently in campaign material, which surviving deployments elsewhere consistently avoided doing in their own material.
  4. A separate customer loyalty system already held tier status, and the token duplicated that record without connecting to it in any way.
RECOMMENDED STRATEGY
Phase 1: Connect the token to the existing loyalty tier record so state genuinely changes, or close the programme, since a static token serves no purpose. Phase 2: Purchase permanent metadata storage immediately, because token holders will retain nothing whatsoever once the current hosting arrangement finally lapses next year. Phase 3: Remove the technology from all customer-facing material, since surviving programmes elsewhere consistently present the capability rather than the mechanism to their customers.
OUTCOME
The programme was reconnected to the loyalty tier system and metadata moved to permanent storage at a one-time cost near USD 90,000 (client-reported, unverified by MMA). Token state changes rose from almost none to roughly 40,000 monthly, and annual platform cost fell to about USD 600,000 once speculative features were removed.

Frequently Asked Questions

Foundational context covering the market sizes, CAGR, scope, country, region and competition that inform every finding below. This section is provided to cover basics and most often pre-purchase conversations, answered from the MMA Primary Research Dataset.

What is the current size of the Dynamic NFT (dNFT) Market?

The market was worth USD 0.6 billion in 2025 and reaches USD 0.71 billion in 2026. That measures infrastructure and platform revenue rather than token trading value.

How large will the Dynamic NFT (dNFT) Market be by 2036?

MMA forecasts USD 3.84 billion by 2036, an expansion of 5.41 times over the forecast period. That represents USD 3.13 billion of incremental annual revenue against 2026.

What is the CAGR for the Dynamic NFT (dNFT) Market 2026 to 2036?

The base case is 18.4% compound annual growth, with a bull case at 19.6% and a bear case at 17.2%. Metadata permanence failures separate the scenarios most clearly.

Which segment is growing fastest?

Game item and progression tokens grow at 27.6%, half again the market rate of 18.4%. Verifiable item state across player populations is a genuine engineering problem.

Who are the major companies in the Dynamic NFT (dNFT) Market?

Immutable, Chainlink, Alchemy, Dapper Labs and Animoca Brands lead on measured infrastructure and platform revenue. Together they hold roughly 29% across several quite distinct infrastructure layers.

Which country is growing fastest?

Vietnam grows fastest at 22.4%, with studios there building token-based item economies as a default architecture rather than as an experiment worth announcing to anybody publicly.

Report Segmentation Architecture

The full report scope spans multiple orthogonal segmentation dimensions, with cross-tabulated demand data provided for each dimension pair. Coverage extends further to regional breakdowns, trend trajectories, and the competitive detail needed to support segment-level decision-making.

By Primary Market Dimension

  • Game Item and Progression Tokens
  • Loyalty and Membership Tier Tokens
  • Ticketing and Access Credentials
  • Physical Asset Provenance and Condition
  • Sports and Entertainment Collectibles
  • Identity and Credential Attestation

By End-Use Industry

  • Interactive Entertainment and Gaming
  • Retail and Consumer Brands
  • Sports Clubs and Federations
  • Live Events and Ticketing
  • Luxury Goods and Authentication
  • Financial and Professional Services

By Commercial Dimension

  • Studio Platform Agreements
  • Brand Programme Deployments
  • Oracle Usage Contracts
  • Permanent Storage Services
  • Infrastructure Subscriptions
  • Agency and Integrator Channels

By Region

  • East Asia
  • North America
  • South Asia and Pacific
  • Western Europe
  • Middle East and Africa
  • Latin America
  • Eastern Europe

Scope, Methodology, and Coverage

Every figure in this report is reproducible from documented input assumptions. The scope below maps the historical period, the forecast horizon, the segmentation dimensions, and the countries covered, alongside the underlying primary and qualitative methodology.
Historical Period
2020 to 2025
Forecast Period
2026 to 2036
Base Year
2025 (USD billions; MMA Primary Research Dataset, September 2026)
Market Definition
This market covers infrastructure, platform and service revenue enabling tokens whose state or metadata changes after issuance, spanning game item and progression tokens, loyalty and membership tier tokens, ticketing and access credentials, physical asset provenance and condition, sports and entertainment collectibles, and identity and credential attestation. Revenue is measured as platform subscription, infrastructure usage, oracle update and attributable implementation and storage value at supplier level. Token trading and marketplace transaction value, cryptocurrency exchange and custody revenue, static collectible issuance without state change, blockchain network validation rewards, and general consumer wallet software are excluded from scope.
Quantitative Units
USD billions, platform, infrastructure and attributable service revenue at supplier level
Segmentation Dimensions
Token application, end-use industry, commercial model, region
Regions Covered
East Asia, North America, South Asia and Pacific, Western Europe, Middle East and Africa, Latin America, Eastern Europe
Countries Covered
South Korea, Japan, China, Taiwan, Hong Kong, Singapore, Vietnam, Philippines, Indonesia, Thailand, India, Australia, United States, Canada, Mexico, Brazil, Argentina, Chile, United Kingdom, Germany, France, Netherlands, Switzerland, Sweden, Spain, Poland, Ukraine, Czechia, United Arab Emirates, Saudi Arabia, Nigeria, South Africa
Key Companies Profiled
Immutable, Chainlink, Alchemy, Dapper Labs, Animoca Brands, Polygon Labs, Sky Mavis, Consensys, Thirdweb, Moralis, Crossmint, Venly, Enjin, Forte, Mythical Games, Pinata, Arweave, Ava Labs, Ledger, Coinbase
Quantitative Methodology
Primary survey, n=3,800 respondents, Q4 2025, six countries; demand-side model with trade association cross-validation
Qualitative Methodology
47 expert interviews, Q4 2025; applied to validate demand model assumptions, identify emerging dynamics, and assess competitive positioning
Report Format
PDF and XLSX data workbook (Word format preview document)
Publisher
Market Minds Advisory
Report Code
MMA-2026-TEC-211
Published
September 2026
Contact
sales@marketmindsadvisory.com | www.marketmindsadvisory.com

Purchase the full Dynamic NFT (dNFT) Market Report (2026 to 2036).

The full MMA report separates the tokens that do a job from the ones that were announcements, and quantifies the metadata permanence failure that will break a third of what has already been deployed. It sizes the market to 2036 across six token applications, seven regions and 32 countries, with segment growth rates and regional demand mechanisms detailed. Competitive analysis covers 20 suppliers assessed on measured infrastructure and platform revenue, with moat and risk assessment for the two leaders. The report quantifies update and storage cost structure, programme survival economics and margin architecture across three portfolio tiers. It closes with four verdicts and an anonymised consumer brand engagement.
Six token applications sized through 2036
Seven regions with demand mechanism analysis
Twenty suppliers on consistent revenue basis
Metadata failure and programme survival benchmarks
Margin architecture across three portfolio tiers
Anonymised consumer brand token programme engagement

Built For The People Who Decide

From boardroom strategy to bench-side execution, this report is read cover-to-cover by leaders shaping the next decade of their industry, turning demand scenarios, market dynamics and valuation benchmarks into decisions.
CXOs/ Presidents/ VPs/ Managers
M&A and Corporate Development
Strategy Teams and R&D Heads
Procurement and Product Directors
Regulatory and Compliance Leaders
Investor Relations and Equity Analysts