Market Minds Advisory
Dunnage Trays Market

Dunnage Trays Market: Trip Count Economics and the Cost of Shipping Empty Trays Home

Bought as packaging, behaves like tooling. A dunnage tray is cut for one part number, dies with that part number, and earns nothing at all unless it comes back enough times to pay for itself.

Lead Analyst

Bilal Shaikh

Published

September 2026

Make Smarter Decisions with Customized Research Insights

Request a free sample report and evaluate market opportunities, growth trends, and competitive dynamics relevant to your business needs.

2025 MARKET VALUE$2.4BMarket Size 2025
2036 FORECAST VALUE$4.7BBase Case , 2026 to 2036
CAGR 2026 TO 20366.2 %Bull 7.4% / Bear 5.0%
INCREMENTAL OPPORTUNITY$2.1BNet 10- year value creation
EXPANSION MULTIPLE1.82x2036 value over 2026 base
Strategic Levers
M&A Pipeline
Regional Outlook
Country Rankings
Competitive Intelligence
Segmental Deep-dive
Call-Us : 91 93563 13602

Executive Snapshot and Market Trajectory

A dunnage tray is cut to one part geometry and becomes worthless the moment that part changes. Buyers treat it as packaging and price it accordingly, then discover it behaves like tooling: part-specific, engineering-change sensitive, and worth nothing at all once the programme ends. Nobody budgets for it that way.
Growth comes from vehicle electrification and from nearshoring rather than from more parts moving. Expanded polymer foam trays grow fastest at 9.3%, exactly 1.50 times the market rate, on battery cell and module handling that needs impact absorption, thermal tolerance, and fire-retardant grades. Moulded pulp fibre follows at 8.1% on plastic reduction commitments. East Asia holds the largest share, and Mexico is the fastest single country at 9.8% on automotive nearshoring.
Concentration is only 18% across the top five measured on annual tray unit capacity, because thousands of regional thermoformers serve customers within trucking distance. Returnable programmes average 47 trips but lose around 9% of trays per cycle in open loops, and that loss rate rather than the purchase price decides whether the economics work at all. Purchase price is rarely the number that decides it.
Market Definition
This market covers trays used to locate, separate, and protect components during transit and in-plant handling, spanning thermoformed sheet plastic, corrugated plastic twinwall, expanded polymer foam, moulded pulp fibre, expendable corrugated board, and injection moulded rigid constructions. Scope is measured at converter realised prices across returnable and expendable programmes. Pallets, stillages and racks, bulk containers, protective void fill, stretch and shrink film, and reverse logistics services are excluded.
Base Year Value
$2.4B in 2025 (MMA Primary Research Dataset, August 2026)
Forecast Period
2026 to 2036, eleven discrete annual values
CAGR
6.2% base case. Bull 7.4%. Bear 5.0%.
Fastest Growth Segment
Expanded Polymer Foam Trays: 9.3% CAGR
Fastest Growth Country
Mexico: 9.8% CAGR
Fastest Growth Region
South Asia and Pacific: 8.3% CAGR
Largest Region
East Asia: 30% of 2025 global value
Market Leaders
ORBIS Corporation. Schoeller Allibert. Nefab. Georg Utz Holding. Brentwood Industries. Source: MMA Analysis based on company annual reports.
Primary Survey
n=3,800 procurement and R&D decision-makers, Q4 2025, six countries
Methodology
Demand-side build-up, cross-validated against public data, 47 expert interviews

Dunnage Trays Market Forecast Scenarios

dunnage-trays-market-size-forecast-scenario-1787299119926
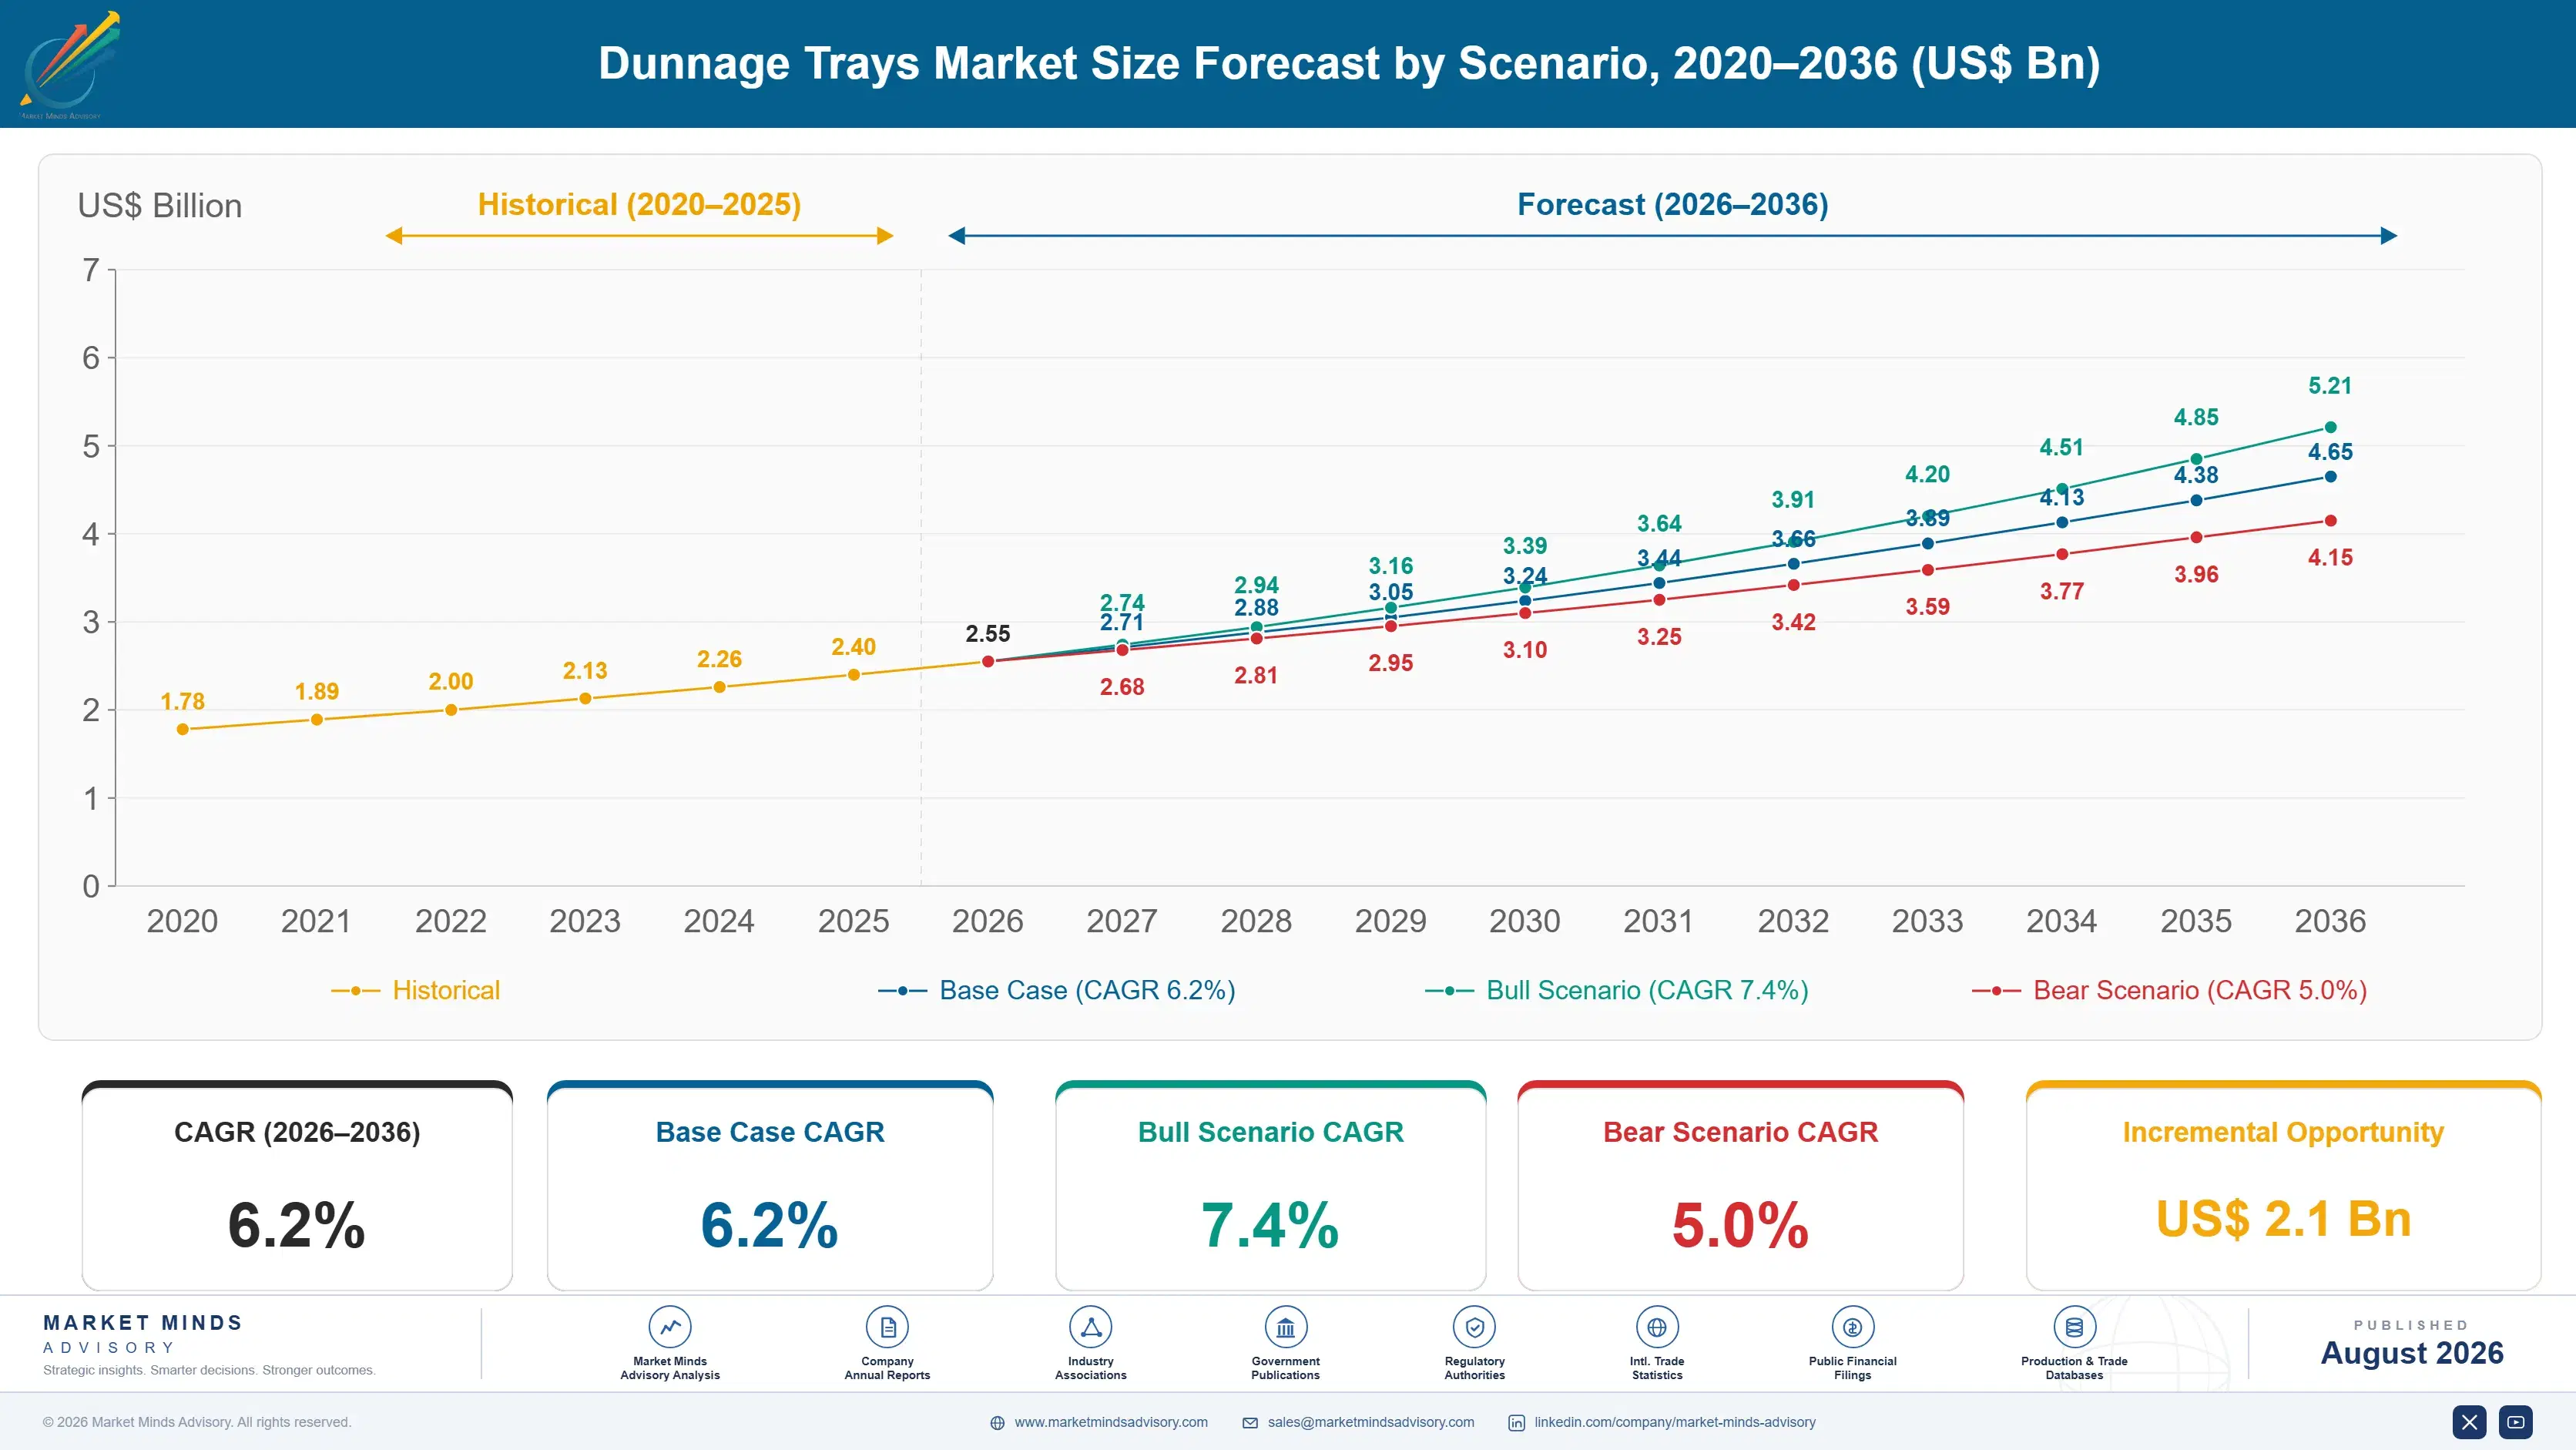
The 2020 to 2025 period was governed by whatever the automotive industry was doing. Semiconductor shortage cut vehicle build sharply through 2021 and 2022, and dunnage demand fell with it because trays are consumed against production volume, not sales. Recovery arrived alongside the first serious wave of battery platform tooling. A 4.9% historical rate averages a genuine production trough against an electrification build-out that started late in the window.
Three mechanisms carry the 6.2% base case. Battery module and cell handling is the largest, since these parts are heavy, damage-sensitive, and require tray specifications that did not previously exist in automotive. Nearshoring is the second, as North American and European supply chains relocate component manufacture and create new closed loops. And plastic reduction commitments are the third, pushing electronics and appliance customers toward moulded pulp fibre across their expendable applications.
The 7.4% bull case rests on battery platform proliferation continuing at current pace, since each new module geometry scraps the previous tray set and orders a new one. The 5.0% bear case is platform consolidation across vehicle manufacturers, which would extend tray programme life and reduce the retooling demand that currently drives much of the category's replacement revenue.

Why the Return Leg Decides Everything

Returnable dunnage is an asset with a payback calculation, and almost nobody runs the calculation properly. A tray achieving 47 trips beats an expendable alternative comfortably; the same tray achieving 15 trips does not. What destroys trip count is not wear but disappearance, and open loop programmes lose around 9% of trays per cycle to suppliers who keep them, sites that stack them outside, and trucks that never bring them back.
TOP FIVE CONCENTRATION18%Extremely fragmented across thousands of regional thermoforming operations
RETURNABLE TRIP COUNT47 tripsAverage achieved before a tray leaves service permanently
OPEN LOOP LOSS RATE9%Trays not returned per cycle outside genuinely closed loops
TOOLING LEAD TIME5 weeksFrom approved part geometry to first production tray
EMPTY NESTING RATIO6.2 to 1Compression achieved on the return leg of a cycle
RECYCLED CONTENT SHARE38%Regrind and post-industrial material in typical thermoformed trays
The second thing buyers underweight is the empty leg. A loaded tray goes out full and comes back empty, so nesting ratio determines whether reverse logistics costs a little or a fortune. A design nesting at 6.2 to one makes the return trip almost free; a design nesting at two to one means shipping air both ways and turns a sound programme into a losing one.
Two forces shape the next decade. Battery module handling has created a tray category with genuinely new requirements around mass, thermal behaviour, and fire retardancy. And plastic reduction commitments keep pushing expendable applications toward moulded fibre, which nests well and composts but handles moisture poorly. Neither force was material to this category five years ago, and both now shape it.
"Procurement compares two quotes per tray and picks the cheaper one. Nobody in the room has ever asked how many of them come back, and the answer is usually the only number that matters. We have seen programmes where the loss rate cost eleven times the price difference being argued over."
Director. Returnable Packaging and Handling Systems Practice · MMA Packaging and

Market Trends

Battery Module Handling Creates Requirements Automotive Never Had

A battery module weighs far more than the sheet metal and trim parts dunnage was designed around, carries stored energy, and cannot be dropped or crushed without consequences that go well beyond scrap cost. Trays for these parts need impact absorption, thermal tolerance, dimensional stability under load, and increasingly fire-retardant grades that conventional thermoformed sheet cannot deliver. Expanded polymer foam handles all four, which is why it grows at 9.3% against a market rate of 6.2%. Each new module geometry scraps the previous tray set entirely and orders a fresh one.
Market Impact: Retooling takes about 5 weeks

Nearshoring Rebuilds Closed Loops That Offshoring Had Broken

Returnable dunnage only works inside a loop short enough for trays to come back economically, which is why long transpacific supply chains ran on expendable packaging almost exclusively. Component manufacture relocating into Mexico. Eastern Europe, and Southeast Asia recreates the shorter loops that returnable programmes need. Mexico contributes the fastest national growth rate in this forecast at 9.8%, driven almost entirely by automotive component relocation. The shift converts expendable spend into returnable asset purchases, which raises value per programme substantially even where part volumes are unchanged. Loop length rather than trade policy decides the format.
Market Impact: Trays carry 38% recycled content

Market Opportunities and Growth Drivers

Engineering Change Frequency Forces Repeated Tray Retooling

Dunnage is cut to a specific part geometry, so any change to that part obsoletes the tray set completely. Vehicle platform revisions, component redesigns, and supplier changes all trigger retooling, and battery platforms currently revise faster than anything else in automotive. Thermoform tooling at around five weeks from approved geometry is what makes this tolerable at all. Buyers experience it as recurring cost they did not budget for; converters experience it as replacement revenue that arrives without any competitive tender, which is the more accurate reading. Battery platforms currently revise faster than anything else.
Market Impact: Loss rate reaches 9% per cycle

Regrind Absorption Makes Trays The Natural Recycled Content Home

Thermoformed dunnage tolerates recycled and post-industrial material far better than food or medical packaging can, because nothing here contacts a consumable and cosmetic appearance is irrelevant. Typical trays now run around 38% regrind and post-industrial content, and some closed loop programmes grind worn trays directly back into new ones. That gives manufacturers a genuine outlet for material they otherwise struggle to place, and it gives customers a recycled content figure for corporate reporting at effectively no cost premium. Cosmetic appearance is irrelevant on a component tray, which is exactly why regrind works here.
Market Impact: Scrap value falls below 5%

Market Restraints and Challenges

Nobody Owns The Tray. So Nobody Chases It

A returnable tray sits between the component supplier who fills it, the carrier who moves it, and the plant that empties it, and the ownership is frequently unclear in the contract. The root cause is that dunnage is bought as packaging and packaging contracts do not usually assign asset custody. Commercial impact is a loss rate near 9% per cycle in open loops, which destroys the payback that justified the programme. Participants are responding with barcode and radio tag tracking, deposit schemes, and contractual custody clauses that attribute losses to whoever held the tray last.
Market Impact: Foam grows at 9.3% annually

Late Engineering Changes Scrap Entire Tray Populations

A tray set is manufactured against approved part geometry, and a change arriving after production commences renders the whole population useless with no salvage value beyond regrind. The root cause is that packaging engineering sits downstream of product engineering and is rarely consulted before a change is released. Commercial impact falls on whoever holds the inventory, which contractually is often the converter. Mitigation runs through adjustable insert designs, late-stage differentiation using common base trays, and contract terms that trigger payment at tooling approval rather than at delivery. Packaging engineering sits downstream of product engineering everywhere.
Market Impact: Mexico grows at 9.8% annually
3 additional market trends, 2 additional growth drivers, and 4 additional restraints and challenges are covered in the full report. Contact sales@marketmindsadvisory.com to access the complete intelligence.

Segment CAGR and Growth Architecture

Segmentation follows tray construction, because construction determines tooling cost, achievable trip count, nesting behaviour on the return leg, and which part weights and geometries the tray can actually carry. End industry and returnable status both cut across every construction rather than separating them, so neither works as a primary dimension here. Six constructions result, and they nest very differently.
dunnage-trays-market-market-share-analysis-1787299120506

Expanded Polymer Foam Trays

The fastest construction at 9.3%, exactly 1.50 times the market rate, and it grew because battery modules arrived. Expanded polypropylene and comparable foams absorb impact, tolerate temperature swings, hold dimension under sustained load, and accept fire-retardant grades, which conventional thermoformed sheet cannot manage together. Battery cell and module handling demands all four simultaneously. Tooling costs more than thermoforming and lead times run longer, which matters when platform geometry changes as often as it currently does. Nesting is generally poorer than thermoformed sheet, so return leg economics need careful design work rather than being an automatic benefit of the material choice. Qualification with cell producers runs years ahead of production, and the window closes early.
CAGR 9.3%

Moulded Pulp Fibre Trays

Second fastest at 8.1%, driven almost entirely by corporate plastic reduction commitments rather than by any performance advantage. Moulded fibre nests extremely well, costs little, carries a straightforward recycling and composting story, and suits expendable electronics, appliance, and consumer goods applications where a single trip is all that is required. Moisture is the limitation, since fibre softens in humid transit and cannot be washed for reuse. Tooling is cheap and fast. The segment competes directly against expendable corrugated and thermoformed sheet rather than against returnable programmes, and it wins on the sustainability reporting line rather than on landed cost. Corporate reporting rather than landed cost drives the switch, which makes the demand unusually durable.
CAGR 8.1%
Full segment breakdown across 6 segments available in the complete report.

Regional Architecture and Country Demand Map

Dunnage demand tracks component manufacturing rather than final assembly or consumption, which puts it wherever parts are actually made. All seven regions fall inside their framework bands here, though the growth rates diverge sharply on nearshoring and electrification. Nearshoring and electrification pull in different directions here.

East Asia

Thirty percent, the largest pool, and it follows the component manufacturing base rather than any consumption pattern. China holds automotive, electronics, and appliance component production at a scale no other region approaches, and battery cell manufacture there is larger than the rest of the world combined. Japanese and Korean demand is smaller but technically exacting, with automotive suppliers running mature returnable loops and tight tray specifications. Chinese converters are numerous, regional, and generally cheaper than Western equivalents. Growth at 7.3% runs above the global rate on battery capacity expansion and on domestic electric vehicle platform proliferation forcing repeated tray retooling. Battery cell manufacture there exceeds the rest of the world, and each platform revision reorders tray demand.
Share: 30% | CAGR: 7.3% (2026 to 2036)

North America

Twenty-four percent, and the region where nearshoring is doing more to this market than electrification is. Component manufacture relocating from Asia into Mexico and the southern United States rebuilds the short loops that returnable dunnage requires, converting expendable spend into returnable asset purchases. Mexico contributes the fastest national growth rate in this forecast at 9.8%. Battery plant construction across the southern states adds a second demand stream with entirely new tray specifications. Growth at 6.6% sits above the global rate, driven by loop reconstruction rather than by any increase in the number of parts being moved. Battery plant construction adds an entirely new specification set, with requirements automotive never previously had.
Share: 24% | CAGR: 6.6% (2026 to 2036)
Regional intelligence for 5 additional markets available in the complete report: Western Europe, South Asia and Pacific, Latin America, Eastern Europe, Middle East and Africa. Contact sales@marketmindsadvisory.com.
dunnage-trays-market-country-cagr-analysis-1787299121026

Where Dunnage Converters Actually Earn

Sheet extrusion is a commodity and every thermoformer buys resin at similar prices, so nobody wins on material. Value comes from designing the return leg rather than the outbound, from making losses attributable, from building battery handling capability early, and from selling trip count instead of unit price. Four levers follow, and the first is a design decision.

Design The Empty Nest Before Designing The Loaded Tray

Engineers design dunnage around the part it carries and treat the empty return as an afterthought, which is precisely backwards for a returnable programme. Moving nesting ratio from two to one up toward six to one cuts return leg freight by roughly 70% and frequently decides whether the whole payback works. Draft angles, stacking features, and rim geometry all contribute and none of them costs anything at the design stage. Converters who lead with return leg economics win programmes that competitors quoting a lower unit price still lose. None of those features costs anything at the drawing stage.
Market Impact: Cuts return leg freight by roughly 70% overall

Make Tray Losses Attributable Through Tracking And Custody

Open loop programmes lose around 9% of trays per cycle and nobody is accountable because packaging contracts rarely assign custody. Barcode or radio tag tracking combined with contractual custody clauses attributes each loss to whoever held the tray last, and attribution alone typically halves the loss rate without any enforcement action. Tracking hardware and system costs roughly 4 dollars per tray against replacement cost several times that. Converters offering this as a managed service capture recurring revenue that a one-off tray sale never generates. Enforcement is rarely even necessary once attribution exists.
Market Impact: Tracking costs about 4 dollars per tray annually

Build Battery Module Handling Capability Before Platform Launch

Battery tray specifications demand impact absorption, thermal tolerance, load-bearing dimensional stability, and fire-retardant grades together, which most thermoformers cannot supply. Qualifying expanded polymer foam capability costs around 5 million dollars in tooling and process development and takes eighteen months. Cell and module makers qualify suppliers years before volume production, so arriving after a platform is specified means waiting for the next one. This is the fastest-growing construction in the category at 9.3% and the qualified supplier pool remains genuinely small. Most thermoformers cannot supply these grades at all, and qualification takes roughly eighteen months.
Market Impact: Foam capability costs roughly 5 million dollars total

Quote Cost Per Trip Rather Than Cost Per Tray

Procurement compares unit prices because that is the number on the quotation, and a tray achieving 47 trips at a higher price beats one achieving 20 trips at a lower one by a wide margin. Presenting cost per trip alongside expected loss rate turns a purchasing comparison into an asset calculation the customer's finance function can actually evaluate. Converters who reframed their quotations this way report winning work at prices 15 to 22% above the competing bid, because the comparison stopped being about price entirely. The comparison stops being about unit price entirely.
Market Impact: Wins work at 15 to 22% higher prices

Who Controls the Margin Pool

Concentration reaches only 18% across the top five measured on annual tray unit capacity, which makes this among the most fragmented packaging categories anywhere. The reason is freight: a thermoformed tray is mostly air and travels badly, so thousands of regional converters serve customers within trucking distance and nobody achieves global scale. The leaders are returnable systems companies rather than thermoformers, and they compete on programme management rather than on forming.
Competition runs on three fronts. Design capability on the return leg is the first and it is where most converters are genuinely weak. Tracking and loss management is the second, and it separates asset programmes from tray sales. Battery handling qualification is the third, and the qualified supplier pool is currently small enough to matter. Most converters are weak on at least two of the three.

Pressure builds from two directions. Regional thermoformers with low overheads undercut the systems companies on any straightforward tray sale. And customers who have run the trip count numbers properly are consolidating toward suppliers who manage the asset rather than merely supply it. Both pressures pull in opposite directions on the same accounts, which makes positioning genuinely difficult.
dunnage-trays-market-company-positioning-matrix-1787299121546

Competitive Moat and Risk Dimensions

ORBIS CORPORATION

Moat: Managed returnable programme capability

Running the tray population as a managed asset, including tracking, cleaning, repair, and pool management, converts a transactional sale into a service relationship a regional thermoformer cannot replicate. Customers who have suffered a loss rate problem value that far above a lower unit price. Building comparable capability means depots and field operations across regions.
ORBIS CORPORATION

Risk: Overhead against regional thermoformers

Programme management carries fixed cost that a small regional converter running two thermoformers does not have, and on any straightforward tray sale that cost appears directly in the price. Customers who have not experienced a loss problem see only the difference. Freight economics keep regional competitors close to every customer.
SCHOELLER ALLIBERT

Moat: Standardised European load carrier position

Deep involvement in the standardised returnable load carrier systems that European automotive runs on gives the company a position inside supply loops that individual tray suppliers sit outside of. Standardisation makes those loops interoperable across hundreds of suppliers, and the company's products define what interoperable means. Displacing that requires changing an industry standard rather than winning a tender.
SCHOELLER ALLIBERT

Risk: Concentrated in flat European automotive

The strongest position sits inside a European automotive industry with flat to declining production volumes and a returnable conversion that largely completed years ago. Growth is happening in Mexico. Southeast Asia, and Chinese battery manufacture, where European load carrier standards carry far less weight. Standardisation is an advantage inside its own geography and close to irrelevant outside it.

Players Tracked

Prominent Players

ORBIS Corporation
Schoeller Allibert
Nefab
Georg Utz Holding
Brentwood Industries

Other Key Players

Placon
Creative Techniques
Sonoco
DS Smith
Rehrig Pacific
Myers Industries
SSI Schaefer
Bekuplast
Craemer Group
Sanko
Gifu Plastic Industry
Supreme Industries
Nilkamal
Signode
Loscam

Recent Developments

FEBRUARY 2025

European converter qualifies fire-retardant foam trays for battery modules

A European returnable packaging manufacturer completed qualification of fire-retardant expanded polymer foam trays for lithium battery module handling with a cell producer. The work was a technical qualification programme between supplier and customer rather than any joint venture, and commercial supply follows a platform launch schedule.
Signal: Battery tray qualification runs years ahead of volume production, so arriving late means waiting for the next platform entirely
MAY 2025

Mexican converter expands capacity near automotive supplier cluster

A returnable packaging manufacturer commissioned additional thermoforming capacity in northern Mexico to serve automotive component suppliers relocating production from Asia. The expansion was organic capital investment funded internally rather than any acquisition of a local converter, and it targets returnable programmes running into the United States.
Signal: Short cross-border loops make returnable economics work where transpacific supply chains only ever supported expendable packaging
SEPTEMBER 2025

Automotive supplier deploys tray tracking across returnable pool

A tier one automotive component supplier implemented radio tag tracking across its returnable dunnage population to attribute losses between its own plants, its carriers, and customer sites. The deployment was an internal operational decision rather than any commercial arrangement with a packaging supplier or logistics provider.
Signal: Attribution alone tends to halve loss rates before any enforcement happens, which is the cheapest fix available here

Resin. Regrind, and Forming Energy

Polymer sheet dominates. Extruded high impact polystyrene, polypropylene, and recycled polyethylene terephthalate sheet together run about 52% of thermoformed tray cost, sourced from regional extruders who themselves buy resin on published indices. Forming and trim energy adds roughly 14%, tooling amortisation around 11%, and labour and inspection make up most of the remainder across a fairly labour-intensive process.
Resin was the exposure that mattered and regrind was the partial answer. Polymer sheet prices moved sharply through the recent period on feedstock and freight disruption, and EIA reporting on the underlying petrochemical markets documents the scale of those movements. Converters running high regrind absorbed less of it, since post-industrial material tracks virgin pricing loosely. Typical trays now carry around 38% recycled content, and closed loop programmes grind worn trays straight back into new ones.

The competitive disadvantage mechanism runs through regrind access rather than purchasing scale. A converter with a captive stream of worn trays and process scrap holds material well below sheet price, while one buying virgin sheet pays the index. Customers want the recycled content figure anyway, so the cheaper input is also the more saleable one. Small converters without regrind handling carry the full exposure with no offset.
dunnage-trays-market-cost-volatility-analysis-1787299121741

Install grinding and reprocessing at the converting site

Process scrap and worn returnable trays both become feedstock rather than waste once a converter can grind and reintroduce them, which cuts material cost and produces the recycled content figure customers now ask for. Payback typically runs under two years at reasonable volume, and converters without the capability pay index price on every kilogram.

Contract sheet extrusion volumes with quarterly index review

Buying sheet on spot through a volatile resin cycle exposes a converter to swings it cannot pass through inside fixed programme pricing, which is how several regional thermoformers lost money on multi-year contracts. Annual volume commitments with quarterly index-linked review convert an unmanageable exposure into a known one. Extruders offer these readily because they value the volume certainty.

Index programme pricing to published resin references directly

Dunnage programmes frequently run three to five years at fixed prices agreed when resin was stable, which works until it is not. Indexing the material content of programme pricing against a published resin reference, while holding conversion and tooling amortisation fixed, protects margin without reopening the whole agreement. Automotive customers accept this more readily than converters expect.

Portfolio Architecture for Margin Defence

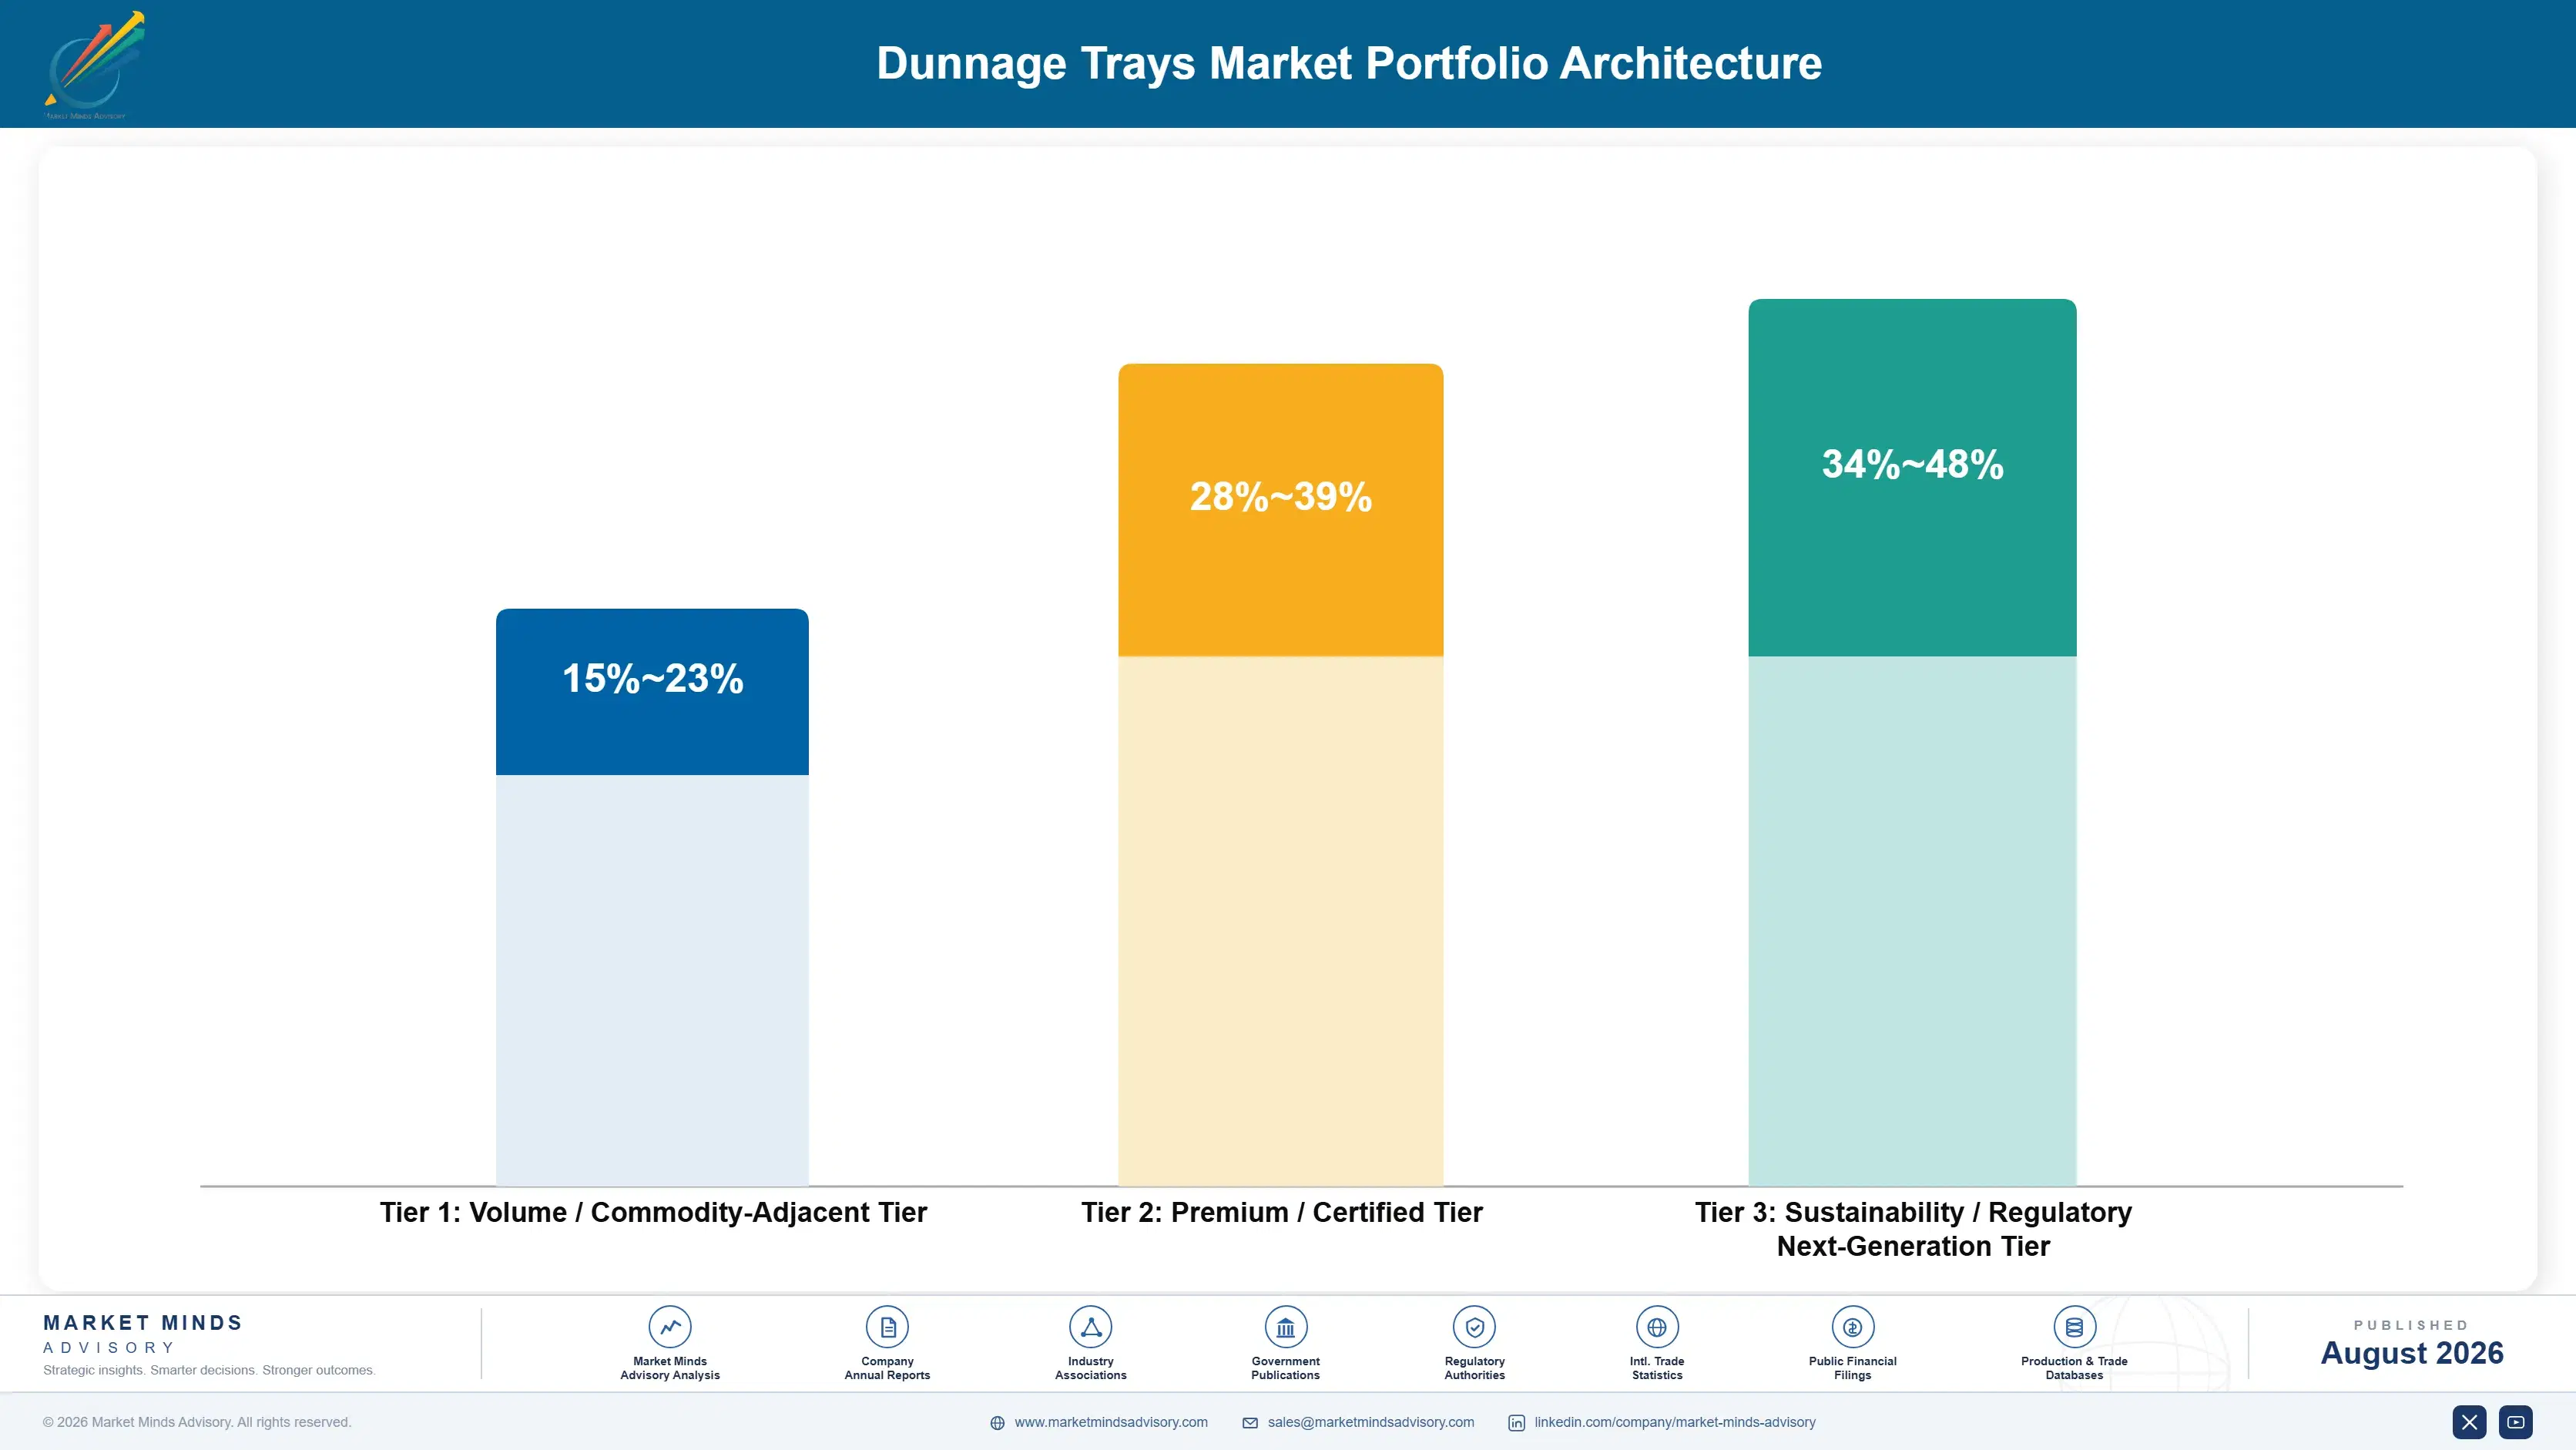
Three tiers describe this business and the margin spread reflects service content rather than material. Expendable trays sold on price into open tenders sit at the bottom, competing against every regional thermoformer within trucking distance. Engineered returnable trays with designed return leg performance and documented trip count sit considerably higher. And managed asset programmes with tracking, cleaning, repair, and pool management occupy a third tier where the converter is selling an oper
The tension is that expendable volume keeps the thermoformers running. Forming machines have limited flexibility and high fixed cost, so a converter chasing only engineered returnable work finds its assets idle between programme launches. Several converters premiumised aggressively and discovered utilisation falling faster than margin rose, which is the same mistake made repeatedly across converting industries. Forming assets have limited flexibility and high fixed cost.

High-value pools concentrate where the customer has already been burned. A buyer who lost a third of a tray population last year evaluates managed programmes very differently from one who has not. Nobody buys loss management before they have needed it, which makes the sales cycle awkward.

Volume / Commodity-Adjacent Tier

Expendable thermoformed, corrugated, and moulded fibre trays sold on delivered price into open tenders. Thin margin and constant regional competition, but the volume that keeps forming assets loaded between engineered programme launches.
Gross Margin: 15-23%

Premium / Certified Tier

Engineered returnable trays with designed nesting performance, documented trip count expectations, and qualification against specific part geometries. Margin reflects design capability and programme engineering rather than any difference in the polymer used.
Gross Margin: 28-39%

Sustainability / Regulatory / Next-Generation Tier

Managed asset programmes with tracking, custody attribution, cleaning, repair, and pool management, plus qualified battery module handling systems. Best margin because the converter supplies an operation and a risk transfer rather than a tray.
Gross Margin: 34-48%
dunnage-trays-market-portfolio-architecture-1787299122236

High-value Sub-segments and Strategic Watch-out

Managed Returnable Asset Programmes

Best margin in the category and genuinely recurring, since tracking, cleaning, and pool management generate revenue every cycle rather than at purchase. Growth depends on customers having experienced a loss problem, because nobody buys loss management before they need it. Revenue arrives every cycle rather than at purchase.
Gross Margin: 34-48%

Battery Module Handling Trays

Strong margin on a qualified supplier pool that remains small, growing at 9.3% as cell and module platforms proliferate across three continents. Qualification runs years ahead of volume production, so the window to enter any given platform closes early. Fire-retardant and thermal grades narrow the field further.
Gross Margin: 32-45%

Expendable Thermoformed Component Trays

The volume core at thin margin under constant regional competition, and it supplies the loading that makes forming asset economics work at all. Converters who abandoned this tier for engineered programme work watched utilisation fall considerably faster than their margin percentage ever managed to improve.
Gross Margin: 15-23%

Moulded Fibre Expendable Trays

The strategic watch-out, growing at 8.1% on corporate plastic reduction reporting rather than on any performance or cost advantage. Moisture sensitivity caps the applications it can serve, and the demand driver could reverse if reporting frameworks change. Moisture sensitivity caps which applications it can serve.
Gross Margin: 19-28%

How Tray Demand Actually Repeats

Dunnage demand is programme-shaped rather than continuous. A tray set is bought at platform launch, topped up against the 9% cycle loss rate, and then scrapped entirely when the part changes. That produces a lumpy revenue profile punctuated by replacement purchases nobody tenders competitively, because a mid-programme top-up must match the existing population exactly. Converters who understand this price the initial set keenly and the replacements properly. Mid-programme top-ups are never tender
Depth varies sharply by customer type. Automotive tier one suppliers run mature returnable loops, track trip counts, and specify tightly. Electronics manufacturers run shorter product lifecycles and lean expendable. Appliance producers sit between the two. Contract manufacturers are the hardest customers because their part mix changes with every client win, which makes engineered returnable programmes difficult to justify at all.

Buyer profiles are shifting as logistics and sustainability functions gain influence over a decision packaging engineers used to own alone. Recycled content and return leg freight both now appear in specifications that previously covered only part protection. Specifications that once covered only part protection now cover freight, and recycled content alongside it.
dunnage-trays-market-end-use-penetration-index-1787299122721

What We Would Tell a Board

These are among the four positions where our research anticipates prominent divergence between winners and laggards over the coming forecast period. Each is grounded in the demand model, the regulatory perimeter, and the announced capacity pipeline.
01 / RETURN LEG DESIGN PRIORITY

Design the empty tray first; the loaded one is easy

Engineers design dunnage around the part it carries and treat the empty return journey as an afterthought, which inverts the actual economics of a returnable programme entirely. Moving nesting ratio from two to one toward six to one cuts return leg freight by roughly 70%, and the design features that achieve it cost nothing at the drawing stage. Converters who lead with return leg economics routinely win programmes that competitors quoting materially lower unit prices still manage to lose outright.
02 / ASSET CUSTODY ATTRIBUTION

Attribute the losses and half of them stop

Open loop programmes lose around 9% of trays per cycle, and the reason is that packaging contracts rarely assign custody so nobody is accountable for a tray that fails to come back. Tracking hardware at roughly 4 dollars per tray combined with contractual custody clauses attributes each loss to whoever held it last, and attribution alone typically halves the rate before any enforcement is attempted. That is the cheapest available fix to the number that decides whether the programme pays.
03 / BATTERY QUALIFICATION TIMING

Qualify before the platform, or wait for the next one

Cell and module producers qualify handling suppliers years ahead of volume production, so a converter arriving after a platform is specified has missed it entirely rather than merely arriving late. Expanded foam capability costs around 5 million dollars and takes eighteen months to develop, which means the decision has to be made against platforms not yet announced. This remains the fastest-growing construction in the category at 9.3%, and the qualified supplier pool is still small enough to be worth entering now.
04 / TRIP COST QUOTATION DISCIPLINE

Quote cost per trip and stop losing on unit price

Procurement compares the price per tray because that is the only number appearing on a quotation, and a tray achieving 47 trips beats one achieving 20 at almost any plausible price difference. Presenting cost per trip alongside an expected loss rate turns a straightforward purchasing comparison into an asset calculation that the customer's finance function can evaluate properly. Converters who reframed their quotations this way consistently report winning work at prices 15 to 22% above the competing bid on the table.

Engagement Snapshot From the Field

A live engagement with an industry participant carrying material or product regulatory and market exposure ahead of a defining policy shift, showing how our research translates into a defensible multi-year portfolio strategy.
MARKET MINDS ADVISORY · CLIENT ENGAGEMENT SUMMARY
Dunnage Trays Producer Strategic Portfolio Review and Transition Roadmap 2026·Investment Scenario on Dunnage Trays Exposure Evaluation 2025-26
CLIENT PROFILE
A tier one automotive component supplier with approximately 890 million dollars in annual revenue (client-reported, unverified by MMA), operating six plants across North America and Eastern Europe and running returnable dunnage programmes into eleven customer assembly sites. The company bought trays on unit price through competitive tender, held no tracking system, and had never measured trip count or loss rate systematically across its population.
STRATEGIC CHALLENGE
Packaging spend had risen roughly 40% over three years against essentially flat production volumes, which management attributed to resin price inflation. Two customer plants had raised complaints about tray shortages causing line stoppages. The board wanted an independent view before approving a further increase to the packaging budget. Nobody had tested the resin explanation.
MMA APPROACH
We audited tray populations across all six plants against original purchase records to establish actual loss rates by loop, benchmarked nesting ratios against comparable engineered designs, and modelled cost per trip under current and redesigned specifications. Contract terms were reviewed across all eleven customer relationships to identify where asset custody sat.
KEY FINDINGS
  1. Actual loss rate averaged 14% per cycle against an industry norm near nine, and losses concentrated in three loops where no contractual custody had ever been assigned to anyone.
  2. Current tray designs nested at roughly 2.4 to one empty, against six to one achievable on comparable geometries, adding substantially to return leg freight on every cycle.
  3. Resin inflation accounted for under a third of the packaging spend increase, with replacement purchases against lost trays making up the clear majority of it.
  4. Two of the eleven customer contracts placed full replacement liability on the client for trays lost inside customer sites, which nobody in procurement had been aware of.
CLIENT PROFILE
A tier one automotive component supplier with approximately 890 million dollars in annual revenue (client-reported, unverified by MMA), operating six plants across North America and Eastern Europe and running returnable dunnage programmes into eleven customer assembly sites. The company bought trays on unit price through competitive tender, held no tracking system, and had never measured trip count or loss rate systematically across its population.
STRATEGIC CHALLENGE
Packaging spend had risen roughly 40% over three years against essentially flat production volumes, which management attributed to resin price inflation. Two customer plants had raised complaints about tray shortages causing line stoppages. The board wanted an independent view before approving a further increase to the packaging budget. Nobody had tested the resin explanation.
MMA APPROACH
We audited tray populations across all six plants against original purchase records to establish actual loss rates by loop, benchmarked nesting ratios against comparable engineered designs, and modelled cost per trip under current and redesigned specifications. Contract terms were reviewed across all eleven customer relationships to identify where asset custody sat.
KEY FINDINGS
  1. Actual loss rate averaged 14% per cycle against an industry norm near nine, and losses concentrated in three loops where no contractual custody had ever been assigned to anyone.
  2. Current tray designs nested at roughly 2.4 to one empty, against six to one achievable on comparable geometries, adding substantially to return leg freight on every cycle.
  3. Resin inflation accounted for under a third of the packaging spend increase, with replacement purchases against lost trays making up the clear majority of it.
  4. Two of the eleven customer contracts placed full replacement liability on the client for trays lost inside customer sites, which nobody in procurement had been aware of.
RECOMMENDED STRATEGY
Phase 1: Phase 1 (months one to six): renegotiate custody clauses across the three worst loops and deploy tag tracking on the highest-value tray populations. Phase 2: Phase 2 (months six to eighteen): retender tray supply on cost per trip with redesigned nesting geometry rather than on unit price alone. Phase 3: Phase 3 (months eighteen to thirty): move the two highest-volume loops onto a managed asset programme with pool management and repair.
OUTCOME
The client deployed tracking and renegotiated custody on its worst loops. Loss rate fell by more than half within three quarters and packaging spend declined despite unchanged production volumes (client-reported, unverified by MMA), with the redesigned nesting geometry reducing return freight materially on the retendered programmes.

Frequently Asked Questions

Foundational context covering the market sizes, CAGR, scope, country, region and competition that inform every finding below. This section is provided to cover basics and most often pre-purchase conversations, answered from the MMA Primary Research Dataset.

What is the current size of the Dunnage Trays Market?

The market is valued at USD 2.4 billion in 2025, rising to USD 2.55 billion in 2026. Returnable programmes average 47 trips before a tray leaves service.

How large will the Dunnage Trays Market be by 2036?

MMA forecasts USD 4.65 billion by 2036, an increase of USD 2.10 billion over the 2026 base. That represents an expansion multiple of 1.82 times.

What is the CAGR for the Dunnage Trays Market 2026 to 2036?

The base case CAGR is 6.2%, with a bull case of 7.4% and a bear case of 5.0%. The historical rate from 2020 to 2025 was 4.9%.

Which segment is growing fastest?

Expanded polymer foam trays at 9.3%, exactly 1.50 times the market rate. Battery module handling needs impact absorption, thermal tolerance, load-bearing stability, and fire-retardant grades together.

Who are the major companies in the Dunnage Trays Market?

ORBIS Corporation, Schoeller Allibert, Nefab, Georg Utz Holding, and Brentwood Industries lead on annual tray unit capacity. The top five hold only 18% of an exceptionally fragmented market.

Which country is growing fastest?

Mexico at 9.8%, driven by automotive component manufacture relocating from Asia into the northern states. Short cross-border loops make returnable programmes economic where transpacific chains never did.

Report Segmentation Architecture

The full report scope spans multiple orthogonal segmentation dimensions, with cross-tabulated demand data provided for each dimension pair. Coverage extends further to regional breakdowns, trend trajectories, and the competitive detail needed to support segment-level decision-making.

By Tray Construction

  • Thermoformed Sheet Plastic Trays
  • Corrugated Plastic Twinwall Trays
  • Expanded Polymer Foam Trays
  • Moulded Pulp Fibre Trays
  • Expendable Corrugated Board Trays
  • Injection Moulded Rigid Trays

By End-Use Industry

  • Automotive Component Manufacturing
  • Battery Cell And Module Production
  • Electronics And Semiconductor Assembly
  • Appliance And White Goods Manufacturing
  • Medical Device And Industrial Components

By Commercial Model

  • Outright Tray Purchase Programmes
  • Managed Asset And Pool Services
  • Expendable Supply On Open Tender
  • Tooling Funded Development Contracts

By Region

  • East Asia
  • North America
  • Western Europe
  • South Asia and Pacific
  • Latin America
  • Eastern Europe
  • Middle East and Africa

Scope, Methodology, and Coverage

Every figure in this report is reproducible from documented input assumptions. The scope below maps the historical period, the forecast horizon, the segmentation dimensions, and the countries covered, alongside the underlying primary and qualitative methodology.
Historical Period
2020 to 2025
Forecast Period
2026 to 2036
Base Year
2025 (USD billions; MMA Primary Research Dataset, August 2026)
Market Definition
This market comprises trays manufactured to locate, separate, and protect components during transit and in-plant handling, measured at converter realised prices across returnable and expendable programmes. Construction coverage spans thermoformed sheet plastic, corrugated plastic twinwall, expanded polymer foam, moulded pulp fibre, expendable corrugated board, and injection moulded rigid trays across all part-carrying applications. Pallets, stillages, racks and bulk containers, protective void fill and cushioning materials, stretch and shrink films, corner and edge protection, and third-party reverse logistics or pool operator services fall outside scope.
Quantitative Units
USD billions (current prices); million trays shipped; achieved cost per trip
Segmentation Dimensions
By Tray Construction; By End-Use Industry; By Commercial Model; By Region
Regions Covered
East Asia, North America, Western Europe, South Asia and Pacific, Latin America, Eastern Europe, Middle East and Africa
Countries Covered
China, Japan, South Korea, Taiwan, India, Vietnam, Thailand, Malaysia, Indonesia, USA, Canada, Mexico, Brazil, Argentina, Germany, France, Italy, Spain, UK, Sweden, Netherlands, Poland, Czechia, Slovakia, Hungary, Romania, Turkey, Morocco, South Africa, and additional markets relevant to this sector
Key Companies Profiled
ORBIS Corporation, Schoeller Allibert, Nefab, Georg Utz Holding, Brentwood Industries, Placon, Creative Techniques, Sonoco, DS Smith, Rehrig Pacific, Myers Industries, SSI Schaefer, Bekuplast, Craemer Group, Sanko, Gifu Plastic Industry, Supreme Industries, Nilkamal, Signode, Loscam
Quantitative Methodology
Primary survey, n=3,800 respondents, Q4 2025, six countries; demand-side model with trade association cross-validation
Qualitative Methodology
47 expert interviews, Q4 2025; applied to validate demand model assumptions, identify emerging dynamics, and assess competitive positioning
Report Format
PDF and XLSX data workbook (Word format preview document)
Publisher
Market Minds Advisory
Report Code
MMA-2026-PAC-266
Published
August 2026
Contact
sales@marketmindsadvisory.com | www.marketmindsadvisory.com

Purchase the full Dunnage Trays Market Report (2026 to 2036).

The full report sizes dunnage trays across six constructions, five end-use industries, four commercial models, and seven regions, with country detail for the twenty largest national markets. Returnable and expendable volumes are sized separately throughout, since their economics, buyers, and replacement cycles differ completely. Trip count and loss rate benchmarks are provided by loop type and industry, alongside nesting ratio performance across leading commercial tray geometries. Competitive profiling covers twenty companies on annual tray unit capacity. Battery module handling qualification status is tracked by supplier and by cell platform.
Returnable and expendable volumes sized separately throughout
Trip count and loss rate benchmarks by loop type
Nesting ratio performance across leading commercial tray geometries
Battery module handling qualification tracked by supplier and platform
Cost per trip modelling under redesigned nesting specifications
Regrind content and material cost offset by converter type

Built For The People Who Decide

From boardroom strategy to bench-side execution, this report is read cover-to-cover by leaders shaping the next decade of their industry, turning demand scenarios, market dynamics and valuation benchmarks into decisions.
CXOs/ Presidents/ VPs/ Managers
M&A and Corporate Development
Strategy Teams and R&D Heads
Procurement and Product Directors
Regulatory and Compliance Leaders
Investor Relations and Equity Analysts