

Market Minds Advisory
Drone Logistics And Transportation Market

Drone Logistics And Transportation Market: Drone Logistics And Transportation: Regulatory Permission, Route Economics And The Delivery That Only Works Where Roads Do Not

Delivery by drone works commercially where roads are bad, distances are awkward and the cargo is urgent, and almost nowhere else that anybody has yet demonstrated at commercial scale anywhere at all.

Lead Analyst

Published

September 2026

Make Smarter Decisions with Customized Research Insights

Request a free sample report and evaluate market opportunities, growth trends, and competitive dynamics relevant to your business needs.

2025 MARKET VALUE$1.9BMarket Size 2025
2036 FORECAST VALUE$7.7BBase Case , 2026 to 2036
CAGR 2026 TO 203613.5 %Bull 14.8% / Bear 12.2%
INCREMENTAL OPPORTUNITY$5.5BNet 10- year value creation
EXPANSION MULTIPLE3.55x2036 value over 2026 base
Strategic Levers
M&A Pipeline
Regional Outlook
Country Rankings
Competitive Intelligence
Segmental Deep-dive
Call-Us : 91 93563 13602

Executive Snapshot and Market Trajectory.

The commercial case for drone delivery is far narrower than the funding suggested. It works where roads are poor, distance is awkward and the cargo is time-critical. Everywhere else a van is cheaper, and eight years of demonstrations have not changed that. The arithmetic has not moved.
Medical and diagnostic payloads grow fastest at 20.3%, because blood, vaccines and laboratory samples are exactly the cargo whose value comes from arriving quickly rather than cheaply. Rwanda and Ghana proved the route economics before any wealthy market did. Middle-mile inventory movement between warehouses and hubs is the second real business, and it works because the route repeats daily and never crosses a crowd. Both of those cases were settled long before the funding arrived.
Regulatory permission rather than technology now sets the pace. Beyond visual line of sight authorisation is what converts a pilot programme into an operation, and the jurisdictions granting it fastest are seeing operators concentrate there. Competition is fragmented at 41% concentration, with logistics integrators, specialist operators and platform manufacturers all pursuing different parts of it. An operator without permission has no business at all, whatever its aircraft can do.
Market Definition
Revenue from commercial cargo transport by uncrewed aircraft, covering last-mile parcel delivery, medical and diagnostic payload delivery, middle-mile inventory movement, industrial and offshore resupply, agricultural input transport, and the traffic management and operations software required to conduct it. Excludes passenger carrying air taxis, aerial imaging and inspection services, defence logistics operated by armed forces, recreational use, and the manufacture of airframes sold outside a service arrangement.
Base Year Value
$1.9B in 2025 (MMA Primary Research Dataset, August 2026)
Forecast Period
2026 to 2036, eleven discrete annual values
CAGR
13.5% base case. Bull 14.8%. Bear 12.2%.
Fastest Growth Segment
Medical and Diagnostic Payload Delivery: 20.3% CAGR
Fastest Growth Country
India: 15.8% CAGR
Fastest Growth Region
South Asia and Pacific: 15.8% CAGR
Largest Region
East Asia: 27% of 2025 global value
Market Leaders
Zipline, Wing, Matternet, Manna Aero and Volocopter lead on commercial cargo flight volume flown under regulatory authorisation. Source: company annual reports and MMA Primary Research Dataset, July 2026.
Primary Survey
n=3,800 procurement and R&D decision-makers, Q4 2025, six countries
Methodology
Demand-side build-up, cross-validated against public data, 47 expert interviews

Drone Logistics And Transportation Market Forecast Scenarios

drone-logistics-and-transportation-market-size-forecast-scenario-1788023714666
The 2020 to 2025 period separated operators who flew from those who announced. Pandemic conditions produced medical delivery authorisations at speed that regulators had resisted for years, and several African and South Asian programmes moved to genuine daily operation. Consumer parcel delivery pilots meanwhile opened and closed repeatedly across wealthy markets. Revenue compounded near 12.1%, concentrated in a handful of operators actually carrying cargo rather than testing.
Three mechanisms carry the base case. Beyond visual line of sight authorisation is broadening across major jurisdictions, which converts pilot programmes into operations with route economics that finally work. Medical payload demand is expanding beyond blood supply into diagnostics and pharmacy fulfilment. And middle-mile movement between fixed points is proving commercially sound because the route repeats, the airspace is quiet and nobody has to be persuaded. None of the three needs a technical breakthrough.
The bull catalyst is a major jurisdiction granting routine authorisation for operations over populated areas, which would open consumer delivery at a scale nothing currently approaches. The bear risk is a fatal or high-profile accident involving a delivery aircraft over people, which would suspend permissions across several jurisdictions at once and set the industry back years.

Where A Van Cannot Get There

Eight years of demonstrations established something the funding never wanted to hear: drone delivery beats a van only under specific conditions. Roads must be poor or absent, the distance must be awkward for ground transport, and the cargo must be worth more for arriving quickly than for arriving cheaply. Average cost per delivery around USD 14.20 makes that arithmetic plain enough to anyone willing to look at it.
MARKET CONCENTRATION CR541%Share of commercial cargo flights flown by leading operators
COST PER DELIVERYUSD 14.20Average across commercial routes operating under current authorisation
MEDICAL PAYLOAD SHARE34%Proportion of commercial flights carrying health related cargo
EXTENDED RANGE APPROVALS62Jurisdictions granting routine authorisation for extended range operation
AVERAGE ROUTE DISTANCE38 kmTypical one-way leg across operating commercial delivery networks
PAYLOAD CAPACITY2.4 kgMedian across aircraft in commercial cargo service today
Rwanda and Ghana demonstrated the economics before any wealthy market did, which surprised people who should have expected it. Blood and diagnostic samples travelling 38 kilometres to a rural clinic over roads that flood are exactly the case the technology suits. Medical cargo accordingly represents 34% of commercial flights. Consumer parcel programmes in wealthy suburbs have opened and closed repeatedly, because a van already goes there anyway.
Permission rather than capability now governs growth. Around 62 jurisdictions grant routine beyond visual line of sight authorisation, and operators concentrate wherever it is available rather than wherever demand looks largest on paper. Median payload capacity of 2.4 kilograms constrains what can be carried at all. Aircraft able to carry considerably more exist and mostly cannot get permission to fly over anybody.
"The most instructive thing about this industry is that it worked in Rwanda years before it worked in California. Bad roads are a better business case than dense demand, and the funding took most of a decade to accept it."
Director, Autonomous Logistics Practice · MMA Aerospace and Logistics Technology Practice · August 2026

Market Trends

Beyond Visual Line Of Sight Authorisation Determines Where Operators Go

Around 62 jurisdictions now grant routine authorisation for extended range operation, and operators concentrate there regardless of where demand appears largest on paper. A permitted route with modest volume beats a large addressable market nobody may fly across. That has produced a geography of operations shaped by regulatory willingness rather than by logistics need, which is unusual in transport and will persist until authorisation becomes ordinary. Regulators granting it early have attracted operators, investment and operational experience together. Demand modelling has proved close to useless as a guide to where operations succeed.
Market Impact: Carries 34% of commercial flights

Middle Mile Movement Is Proving Sounder Than Last Mile

Moving inventory between warehouses, hubs and manufacturing sites repeats the same route daily, crosses nobody, and replaces a van journey with a driver whose time costs considerably more than the flight does. Last-mile consumer delivery does none of that, since it varies constantly, ends over people and competes with a van already visiting the street. Operators who started in consumer delivery have quietly redirected toward middle-mile work. The economics were always clearer there. Nobody funded this business expecting warehouse corridors to be the part that works, which is exactly what happened anyway.
Market Impact: Replaces 38 km road journeys

Market Opportunities and Growth Drivers

Medical Payload Value Justifies Air Transport Economics

Blood products, vaccines and diagnostic samples derive their value from arriving quickly and within temperature limits rather than from arriving cheaply, which makes a USD 14.20 delivery cost entirely acceptable against the alternative. Health systems in Rwanda, Ghana and several Indian states have contracted networks on exactly that basis. Medical cargo now represents 34% of commercial flights. This is the only payload category where the commercial case has never really been argued about seriously. Health systems buying it are comparing against a courier that takes hours or a road that floods.
Market Impact: Limits payload to 2.4 kilograms

Poor Ground Infrastructure Creates Genuine Route Advantage

Where roads flood seasonally, distances run awkward for ground transport, or terrain forces long detours, a 38 kilometre direct flight replaces a journey that takes hours by vehicle when it is possible at all. That advantage is largest precisely in markets with the least logistics capital available, which inverted the usual technology adoption pattern completely. African and South Asian networks reached genuine daily operation while wealthy market pilots were still opening and closing repeatedly. Capital scarcity turned out to matter far less here than regulatory willingness and genuine logistical need did.
Market Impact: Risks 62 jurisdiction approvals

Market Restraints and Challenges

Payload Capacity Caps What The Business Can Carry

Median payload across aircraft in commercial service runs about 2.4 kilograms, which excludes most of what logistics networks actually move every day. The root cause is that heavier aircraft need permissions that regulators grant reluctantly over anything populated, so capacity is limited by rule rather than by engineering. Commercially it confines operators to high-value low-weight cargo. Mitigation runs through fixed corridor approvals for heavier aircraft, hybrid designs improving range at weight, and operations restricted to sparsely populated routes. None of those pathways raises capacity without a regulator agreeing to it first.
Market Impact: Operations follow 62 permitting jurisdictions

Single Accident Risk Threatens Permissions Across Jurisdictions

A fatal or high-profile accident involving a delivery aircraft over people would suspend authorisations across several jurisdictions simultaneously, because regulators coordinate and none wants to be the one who did not act. The root cause is that permission rests on a safety case with very little operational history behind it. Commercially it means every operator carries risk created by every other operator. Mitigation runs through shared incident reporting, conservative route design over unpopulated ground, and detect-and-avoid investment. Nobody in this industry controls the event that would remove their own permission.
Market Impact: Repeats a route 6 times daily
4 additional market trends, 3 additional growth drivers, and 2 additional restraints and challenges are covered in the full report. Contact sales@marketmindsadvisory.com to access the complete intelligence.

Segment CAGR and Growth Architecture

Segmentation follows what the aircraft carries and why, because payload type determines route economics, regulatory treatment and whether the operation makes commercial sense at all. Six categories describe the market completely, from medical payloads where the case has never been argued through to consumer parcel delivery where it very much still is being argued today.
drone-logistics-and-transportation-market-market-share-analysis-1788023715195

Medical and Diagnostic Payload Delivery

The fastest category grows at 20.3%, half again the market rate of 13.5%, and it is the only one where the commercial argument was settled years ago. Blood products, vaccines and diagnostic samples derive value from arriving quickly and within temperature limits, so a USD 14.20 delivery cost sits comfortably against alternatives that take hours or fail entirely. Rwanda and Ghana contracted national networks on that basis before any wealthy market attempted it, and several Indian states have followed. Medical cargo now accounts for 34% of commercial flights, and demand is broadening from blood supply into routine diagnostics and pharmacy fulfilment. The argument now is about scale rather than about merit.
CAGR 20.3%

Middle Mile Inventory Movement

Middle-mile work grows at 16.9% and is the quiet commercial success of this market. Moving inventory between warehouses, hubs and manufacturing sites repeats the same route several times daily, crosses no populated ground, and displaces a van journey whose driver costs considerably more than the flight. Regulatory approval is comparatively straightforward because the corridor is fixed and nobody underneath needs persuading. Operators who began in consumer delivery have redirected toward it steadily. The volumes are unglamorous, the contracts are long, and the route economics have worked from the start without requiring any regulatory breakthrough at all. That combination is rare in this industry and nobody markets it very hard at all.
CAGR 16.9%
Full segment breakdown across 6 segments available in the complete report.

Regional Architecture and Country Demand Map

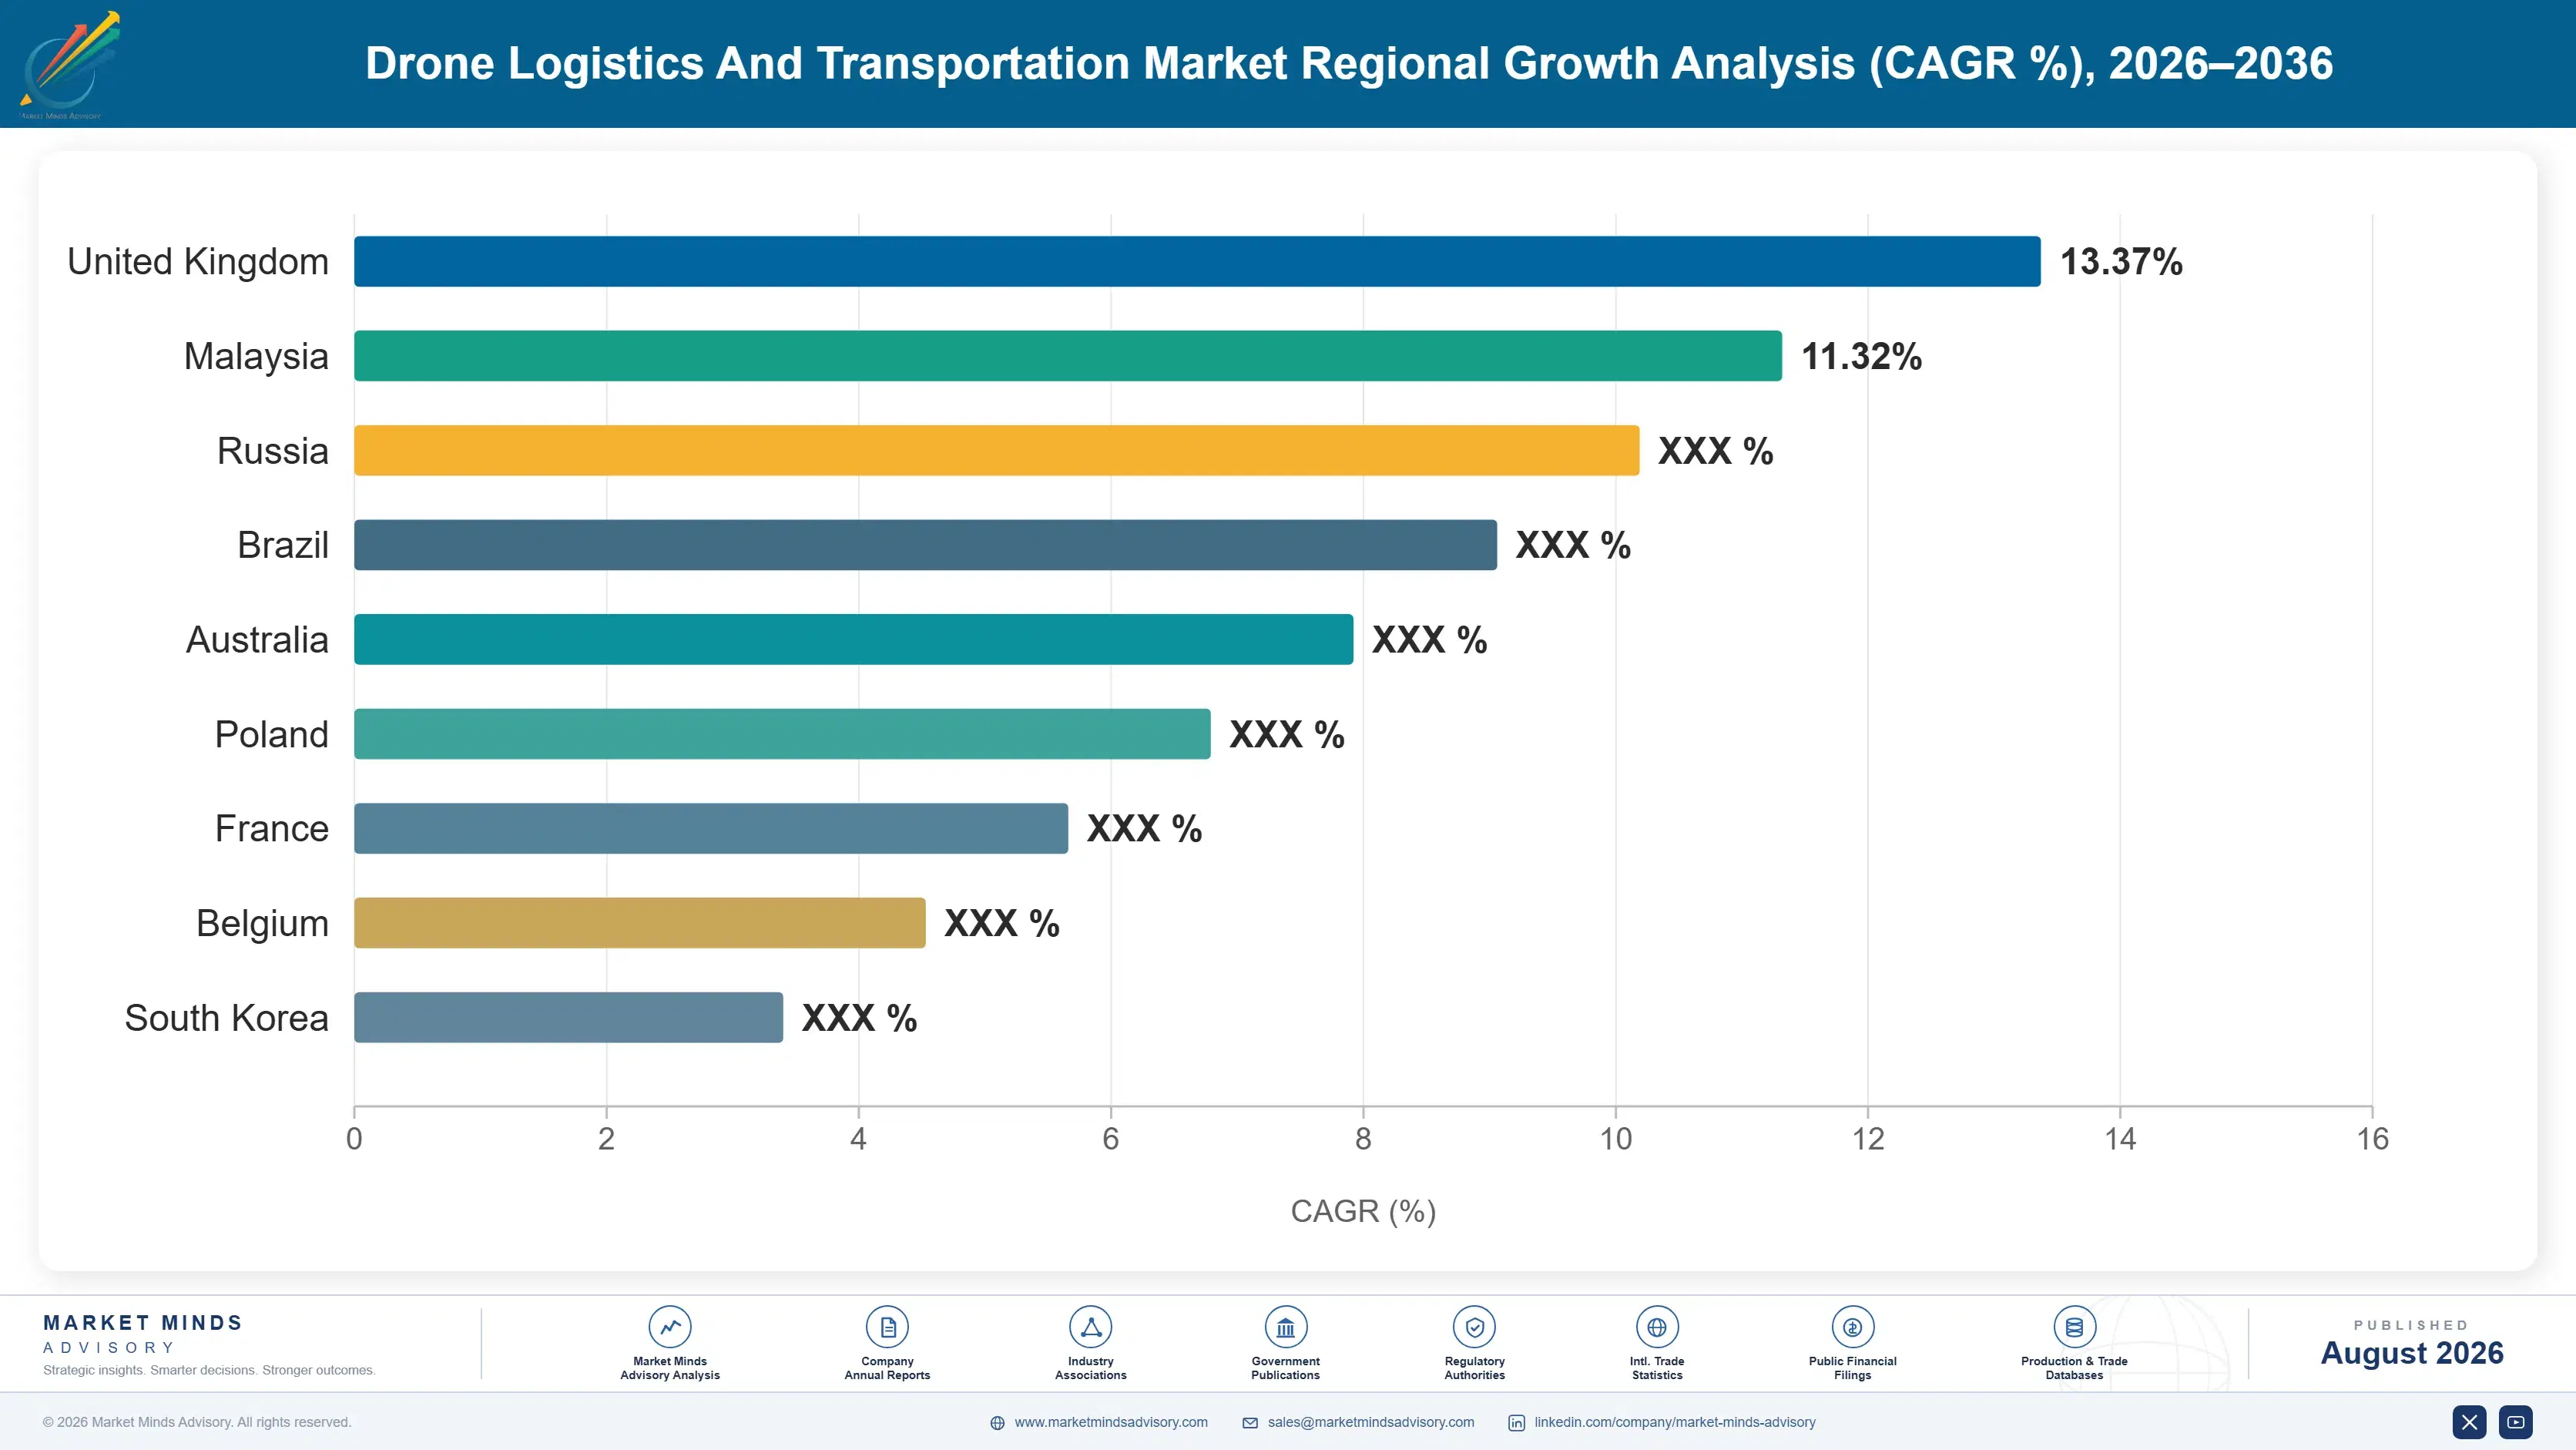
Operations follow regulatory permission rather than logistics demand, which produces an unusual geography. East Asia leads on manufacturing scale and permitted operating volume, with South Asia and Pacific growing fastest and Africa holding operational experience out of proportion to its share. The resulting pattern is genuinely unusual.

East Asia

The largest share at 27% rests on manufacturing scale and permitted operating volume together, an unusual combination. Chinese authorities have authorised routine cargo operation across defined corridors at a pace Western regulators have not approached, and domestic manufacturers supply most of the world's commercial cargo airframes. Japanese operators focus on mountainous and island resupply where ground transport is genuinely difficult. Korean logistics operators have run island delivery networks commercially rather than experimentally for several years now. The combination of permitted corridors and domestic airframe supply means operators here scale without waiting for either permission or hardware, which is a position no other region currently holds in any comparable form at present.
Share: 27% | CAGR: 14.6% (2026 to 2036)

North America

Consumer delivery attracted the capital here and middle-mile work is producing the revenue, which is not the outcome anyone funded. Regulatory authorisation for operation over populated areas has broadened slowly and deliberately, so operators have concentrated on suburban corridors and warehouse routes where permission is achievable. Medical delivery between hospital campuses has proved commercially sound. Several well-funded consumer programmes have opened, closed and reopened in a cycle that now reads as characteristic of the region. Capital availability has never been the constraint in this region, and the operators earning money here are precisely the ones who stopped pursuing the consumer proposition that attracted most of the capital originally, which is telling.
Share: 24% | CAGR: 14.4% (2026 to 2036)
Regional intelligence for 5 additional markets available in the complete report: Western Europe, South Asia and Pacific, Latin America, Middle East and Africa, Eastern Europe. Contact sales@marketmindsadvisory.com.
drone-logistics-and-transportation-market-country-cagr-analysis-1788023715718

Where Drone Logistics Margin Sits

Four levers work on route selection, regulatory position and contract structure rather than on aircraft capability, which is rarely the binding constraint anywhere. Payload focus, permission-led geography, middle-mile contracting and traffic management software each address something an operator controls directly today. None of the four requires a better aircraft, and that is rather the point.

Concentrate On Payloads Where Speed Carries Value

Cargo whose value depends on arriving quickly rather than cheaply supports a USD 14.20 delivery cost without argument, and cargo that does not simply cannot. Medical and diagnostic payloads represent 34% of commercial flights for exactly this reason. Operators pursuing general parcel delivery compete against a van that is already visiting the street and lose on cost every time. Payload selection determines profitability far more decisively than aircraft performance, route density or any operational improvement available to an operator. Nothing else on the cost sheet moves the outcome by comparison.
Market Impact: Supports a USD 14.20 cost per delivery comfortably

Site Operations Where Permission Already Exists

Around 62 jurisdictions grant routine extended range authorisation, and a permitted route carrying modest volume earns more than a large addressable market nobody may fly across. Operators who chose geography by demand modelling have spent years waiting for permission that never arrived. Authorisation timelines run 18 to 30 months where regulators are willing and indefinitely where they are not. Choosing the jurisdiction first and the market second reverses conventional expansion logic and is clearly correct here. The 62 permitting jurisdictions are a map worth reading before any expansion plan is written.
Market Impact: Avoids authorisation delays running 30 months or longer

Contract Middle Mile Routes On Long Terms

Warehouse and hub routes repeat 6 times daily on fixed corridors over unpopulated ground, which makes them approvable, predictable and genuinely cheaper than the van they replace once driver cost is counted properly. Customers will sign multi-year agreements for that, which consumer delivery never produces. The work is unglamorous and the contracts are long. Operators still marketing themselves on consumer delivery are underselling the part of their business that actually earns money. A 3 year contracted corridor is worth considerably more than a year of unattached flight volume ever was.
Market Impact: Secures route contracts running 3 years or longer

Sell Traffic Management Capability Beyond Your Own Flights

Operators building airspace management, route deconfliction and regulatory reporting software for their own use hold capability that later entrants need and regulators increasingly expect. Licensing it produces revenue at margins no flight operation approaches, typically 3 to 4 times the margin on delivery itself. It also positions the operator inside regulatory conversations that shape permission for everyone. Most operators treat this software as internal cost rather than as the asset it demonstrably is. The 3 to 4 times margin difference is available immediately and requires no new flying at all.
Market Impact: Earns roughly 3 times the delivery flight margin

Who Controls the Margin Pool

Concentration is low at around 41% across the five largest participants measured on commercial cargo flights flown under authorisation, which reflects an industry where regulatory permission rather than scale determines position. The leaders are operators who secured authorisation early and built operating history, not the best-funded entrants. Several heavily capitalised consumer delivery programmes hold negligible flight volume despite considerable visibility.
Competition runs on three dimensions. Regulatory position comes first, since an operator without authorisation has no business regardless of technology. Operating history comes second, because safety case evidence accumulates only through flights actually flown and cannot be bought. Payload and route fit comes third, determining whether an operation earns money or merely runs. Aircraft capability barely features, since the constraint is almost never the airframe.

Pressure is arriving from logistics integrators rather than from new operators. Established parcel and healthcare logistics firms have begun contracting drone capacity rather than building it, which turns operators into subcontractors and compresses margin. Manufacturers meanwhile are integrating forward into operations. Rankings will shift toward operators holding both authorisation breadth and long-term contracted routes, since flight volume without contracts has repeatedly proved worthless.
drone-logistics-and-transportation-market-company-positioning-matrix-1788023716242

Competitive Moat and Risk Dimensions

ZIPLINE

Moat: Operating history and safety evidence

Zipline accumulated more commercial delivery flight hours than anyone through national medical networks operating daily for years, and that operating history is the evidence regulators actually want when granting authorisation elsewhere. It cannot be purchased or accelerated, only flown. The company entered wealthy markets carrying a safety case built where the commercial need was genuine rather than demonstrative.
ZIPLINE

Risk: Concentration in health system contracts

Revenue concentrated in government health system contracts carries renewal risk tied to political change, budget cycles and donor funding rather than to service performance. A contract lost for reasons unconnected with operations removes substantial volume at once. Diversifying into commercial payloads means competing where the value case is considerably weaker than medical delivery.
WING

Moat: Parent capital and airspace software

Wing operates with parent company funding that removes the financing pressure every independent operator faces, and its airspace management software has become a reference point in regulatory discussions across several jurisdictions. That software position shapes permission frameworks other operators must then work within. Long-duration funding has allowed it to persist through regulatory delays that closed competitors.
WING

Risk: Consumer delivery economics remain unproven

The consumer parcel proposition it has pursued hardest is the one where a van already visits the street and wins on cost, which eight years of operation has not resolved. Programmes have opened and closed repeatedly across several markets. Parent patience is not unlimited, and the middle-mile pivot others made arrived here later.

Players Tracked

Prominent Players

Zipline
Wing
Matternet
Manna Aero
Volocopter

Other Key Players

Wingcopter
Flytrex
DroneUp
Swoop Aero
Skyports Drone Services
Meituan Drone Delivery
SF Technology
EHang
A2Z Drone Delivery
Speedbird Aero
Terra Drone
Skyfarer
Jedsy
ANRA Technologies
Elsight

Recent Developments

MAY 2024

Aviation authority granted routine authorisation over defined populated corridors

A national aviation authority granted routine beyond visual line of sight authorisation covering defined corridors including limited populated areas, replacing case-by-case exemptions that had constrained commercial operation. This was a regulatory decision rather than any commercial arrangement, acquisition or joint venture between any operators in this market.
Signal: Routine authorisation replacing individual exemptions is what turns a pilot programme into an actual commercial operation.
NOVEMBER 2024

Logistics integrator contracted drone capacity rather than building it

A major parcel and healthcare logistics firm contracted delivery capacity from an established drone operator across several routes, choosing procurement over building its own capability. This was a commercial service agreement rather than an acquisition, merger or equity investment in the drone operator concerned in this case.
Signal: Integrators contracting capacity turns operators into subcontractors and compresses margin across the whole industry rather quickly.
MARCH 2025

State health department expanded contracted medical delivery network

An Indian state health department expanded a contracted medical and diagnostic delivery network to additional districts following results across an initial operating period, adding routes into areas where road access fails during monsoon conditions. This was a contract expansion rather than any corporate transaction between parties.
Signal: Health system contracts renewing on results is the clearest commercial validation this industry has produced anywhere yet.

What A Drone Delivery Actually Costs

Delivery cost divides four ways and the aircraft is the smallest part of it. Ground operations and staffing absorb roughly 38% of cost per delivery, regulatory compliance and airspace coordination near 24%, aircraft amortisation and maintenance near 22%, and battery replacement with energy the remaining 16%. Most operators discover that a technology business turns out to be a ground handling business with an aircraft attached.
Battery cell pricing has moved sharply across recent years and moved delivery economics with it, since cells degrade on a cycle count that high-frequency operations reach quickly. Public data from the IEA on battery cell pricing tracks the decline that improved operator economics through the period. Aircraft written off in incidents also carry cost that insurance prices unpredictably, given how little actuarial history this industry has generated.

Exposure varies by operating model rather than by geography. Operators running high-frequency fixed routes reach battery replacement cycles fastest and carry that cost heaviest. Those flying occasional long routes carry regulatory compliance cost against far fewer deliveries, which is why low-volume operations rarely reach profitability. Operators in permissive jurisdictions carry considerably lighter compliance burden than those flying under case-by-case exemption.
drone-logistics-and-transportation-market-cost-volatility-analysis-1788023716439

Battery cycle management extending replacement intervals

Cells degrade on cycle count rather than calendar age, so high-frequency operations reach replacement fastest and carry that cost hardest against every delivery flown. Charge rate discipline, thermal management and depth-of-discharge limits extend usable life materially at modest operational cost. Operators treating batteries as consumables rather than as managed assets pay considerably more than they need to.

Route density spreading fixed compliance cost properly

Regulatory compliance and airspace coordination absorb roughly 24% of cost per delivery and barely vary with flight count, which means low-volume operations carry an impossible burden per delivery. Concentrating flights on fewer routes at higher frequency spreads that cost properly. Operators spread thinly across many demonstration routes are paying compliance cost against volumes that cannot support it.

Ground operations automation reducing staffing intensity

Ground operations and staffing absorb roughly 38% of delivery cost, which surprises operators who thought they were building an aircraft business rather than a logistics one. Automated loading, launch and recovery reduces staffing per site considerably where flight volume justifies the equipment. Below a certain daily flight count the automation costs more than the staff it replaces.

Portfolio Architecture for Margin Defence

The portfolio separates by whether the payload's value depends on speed. Consumer parcel delivery is the volume ambition and the margin problem: high visibility, heavy capital, and competing against a van already visiting the street. It has absorbed most of the industry's funding and produced the least of its revenue, which is now well enough understood that several operators have quietly stopped talking about it.
Margin concentrates in medical and diagnostic payloads and in industrial resupply, where the alternative is slow, expensive or impossible rather than merely less convenient. Health system contracts run long, renew on results and price against outcomes rather than against parcel rates. Industrial and offshore resupply competes with helicopters, which sets a comparison any drone operator wins comfortably on cost. The comparison is not close.

The overlooked pool is traffic management software. Operators built airspace deconfliction and regulatory reporting capability for their own use and treat it as internal cost, when later entrants need it and regulators increasingly expect it. Licensing it earns roughly 3 to 4 times the margin of flying, and positions the licensor inside the regulatory conversation shaping everyone's permission. Almost nobody licenses it.

Volume / Commodity-Adjacent

Consumer parcel delivery and general last-mile cargo competing directly against ground transport. Range spans eight points because route density and drop concentration determine outcomes entirely, and most operations sit at the lower end.
Gross Margin: 6-14%

Premium / Certified

Middle-mile inventory movement, industrial resupply and agricultural transport on contracted fixed routes. Range spans ten points because contract length and route frequency vary enormously between customers and operators alike. Contract length decides it.
Gross Margin: 20-30%

Sustainability / Regulatory / Next-Generation

Medical and diagnostic delivery plus traffic management software licensing. Range spans sixteen points because software margins and flight operation margins are barely comparable businesses sharing one tier. Software licensing changes the arithmetic entirely.
Gross Margin: 30-46%
drone-logistics-and-transportation-market-portfolio-architecture-1788023716937

High-value Sub-segments and Strategic Watch-out

Medical and Diagnostic Payload Delivery

High value and high growth at 20.3%, contracted by health systems on outcomes rather than parcel rates. The twelve point range separates established national networks from operators running district-level pilots at volumes that cannot yet spread compliance cost. Contract renewal on results is the validation that matters.
Gross Margin: 32-44%

Middle Mile Inventory Movement

High value with moderate growth at 16.9%, on fixed corridors that repeat daily and cross nobody. The eight point range reflects contract length differences, since multi-year agreements price very differently from route-by-route arrangements. The corridor approval is specific and the customer's own planning depends on it.
Gross Margin: 22-30%

Consumer Parcel Delivery

The volume ambition that absorbed most funding and produced least revenue, competing against a van already visiting the street. Range reflects route density, and the honest observation is that few operations clear their cost of capital. Most funding in this industry went here and stayed there.
Gross Margin: 6-14%

Traffic Management Software

The strategic watch-out and the most undervalued asset here. Operators built it for internal use, later entrants need it, regulators expect it, and licensing earns multiples of flight margin that almost nobody is currently collecting. Almost nobody in this industry has priced it as an asset yet.
Gross Margin: Variable

Why Routes Outlast Contracts

Contracted route operations produce annuity economics that resemble utility supply more than parcel delivery. A health system network flying the same districts daily generates predictable revenue for years, and the safety case, route approvals and ground infrastructure supporting it transfer to no competitor. Switching operator means repeating regulatory approval, rebuilding ground sites and accepting an unproven safety record, which customers avoid unless service actually fails.
Stickiness varies enormously by payload. Medical networks are close to permanent once contracted, since approval, clinical integration and staff training all sit behind them. Middle-mile industrial routes persist because the corridor approval is specific and the customer's own logistics planning depends on it. Consumer delivery has no stickiness at all, because the customer is choosing a delivery option rather than an operator and will not notice a change.

The buyer profile is shifting away from innovation budgets. Early contracts were signed by technology and transformation functions willing to fund demonstration. Renewals now sit with logistics and procurement staff comparing cost per delivery against ground alternatives without any interest in the technology involved. Operators whose commercial approach was built for the first buyer are finding the second considerably less receptive to it.
drone-logistics-and-transportation-market-end-use-penetration-index-1788023717426

Where Operators Should Commit Now

These are among the four positions where our research anticipates prominent divergence between winners and laggards over the coming forecast period. Each is grounded in the demand model, the regulatory perimeter, and the announced capacity pipeline.
01 / PAYLOAD VALUE SELECTION

Carry cargo whose value depends on arriving fast

Cargo whose worth depends on speed and temperature supports a USD 14.20 delivery cost without any real argument from the customer at all, and cargo that does not simply cannot support it under any route density. Medical and diagnostic payloads represent 34% of commercial flights for precisely this reason and grow fastest at 20.3% annually across the whole market. Operators pursuing general parcel work compete against a van already visiting the street and lose on cost every single time they try it.
02 / REGULATORY GEOGRAPHY CHOICE

Choose the jurisdiction before choosing the market

Around 62 jurisdictions now grant routine extended range authorisation for cargo, and a permitted route carrying modest volume earns considerably more than a large addressable market that nobody may legally fly across at any point. Operators who selected their geography by demand modelling alone have spent years waiting for permission that has still not arrived anywhere at all. Authorisation runs 18 to 30 months where regulators are willing and remains effectively indefinite wherever they are not willing to engage at all.
03 / CONTRACTED ROUTE DISCIPLINE

Long contracts beat flight volume every time

Middle-mile corridors repeating six times daily over unpopulated ground are approvable, predictable and genuinely cheaper than the van they replace on any honest accounting once driver cost is properly counted against them in the comparison. Customers will sign multi-year agreements for that particular work, which consumer delivery has never once produced anywhere in this industry across eight years. Flight volume without contracted revenue behind it has repeatedly proved worthless, and several well-funded operators have demonstrated exactly that at considerable expense to their investors.
04 / AIRSPACE SOFTWARE LICENSING

The internal software is the undervalued asset

Airspace deconfliction, route management and regulatory reporting capability built for internal use is precisely what later entrants now require and what regulators increasingly expect every serious operator to hold going forward. Licensing it earns roughly three to four times the margin available on flying, and positions the licensor inside regulatory conversations that shape permission for everybody else in the industry. Most operators still carry this capability as internal cost rather than recognising the asset sitting on their own balance sheet.

Engagement Snapshot From the Field

A live engagement with an industry participant carrying material or product regulatory and market exposure ahead of a defining policy shift, showing how our research translates into a defensible multi-year portfolio strategy.
MARKET MINDS ADVISORY · CLIENT ENGAGEMENT SUMMARY
Drone Logistics And Transportation Producer Strategic Portfolio Review and Transition Roadmap 2026·Investment Scenario on Drone Logistics And Transportation Exposure Evaluation 2025-26
CLIENT PROFILE
A drone logistics operator running consumer parcel delivery across two wealthy market suburbs alongside a contracted medical delivery network in a third jurisdiction, funded through venture capital and approaching a further raise. Flight volume was growing steadily while gross margin remained negative, and the board could not establish which parts of the operation were responsible for that.
STRATEGIC CHALLENGE
Investors valued the consumer programme most highly while the medical network generated nearly all the contracted revenue, and management was reluctant to redirect toward work that presented less well in funding materials. It also needed to decide whether internally built airspace management software should be licensed externally or retained as competitive advantage.
MMA APPROACH
MMA rebuilt cost per delivery by route and payload type, separating compliance, ground operations, aircraft and battery cost properly for the first time. It modelled contracted versus transactional revenue durability across renewal scenarios. Expert interviews with health system buyers, logistics integrators, regulators and competing operators established what customers actually value and what permission genuinely requires.
KEY FINDINGS
  1. Consumer parcel routes lost money on every delivery once compliance and ground staffing were allocated properly, and no achievable route density reversed that outcome.
  2. The medical network carried the entire business, generating contracted revenue at gross margin above 30% while representing under a third of total flight volume.
  3. Ground operations and staffing absorbed 38% of delivery cost, considerably more than management believed, and automation was uneconomic below current per-site flight volumes.
  4. The internal airspace software had commercial value to three identified later entrants, and retaining it exclusively protected nothing that competitors could not build themselves.
CLIENT PROFILE
A drone logistics operator running consumer parcel delivery across two wealthy market suburbs alongside a contracted medical delivery network in a third jurisdiction, funded through venture capital and approaching a further raise. Flight volume was growing steadily while gross margin remained negative, and the board could not establish which parts of the operation were responsible for that.
STRATEGIC CHALLENGE
Investors valued the consumer programme most highly while the medical network generated nearly all the contracted revenue, and management was reluctant to redirect toward work that presented less well in funding materials. It also needed to decide whether internally built airspace management software should be licensed externally or retained as competitive advantage.
MMA APPROACH
MMA rebuilt cost per delivery by route and payload type, separating compliance, ground operations, aircraft and battery cost properly for the first time. It modelled contracted versus transactional revenue durability across renewal scenarios. Expert interviews with health system buyers, logistics integrators, regulators and competing operators established what customers actually value and what permission genuinely requires.
KEY FINDINGS
  1. Consumer parcel routes lost money on every delivery once compliance and ground staffing were allocated properly, and no achievable route density reversed that outcome.
  2. The medical network carried the entire business, generating contracted revenue at gross margin above 30% while representing under a third of total flight volume.
  3. Ground operations and staffing absorbed 38% of delivery cost, considerably more than management believed, and automation was uneconomic below current per-site flight volumes.
  4. The internal airspace software had commercial value to three identified later entrants, and retaining it exclusively protected nothing that competitors could not build themselves.
RECOMMENDED STRATEGY
Phase 1: Phase one: close the loss-making consumer routes and redirect aircraft and staff toward contracted medical and middle-mile work without further delay. Phase 2: Phase two: pursue authorisation in two additional permissive jurisdictions selected on regulatory willingness rather than on modelled market size or forecast demand. Phase 3: Phase three: license the airspace management software to later entrants and position it within the active regulatory framework discussions now underway.
OUTCOME
The client reported gross margin turning positive within four quarters and contracted revenue rising to 78% of the total (client-reported, unverified by MMA). Consumer routes closed entirely. Software licensing produced its first revenue, and the subsequent raise priced on contracted revenue rather than flight volume.

Frequently Asked Questions

Foundational context covering the market sizes, CAGR, scope, country, region and competition that inform every finding below. This section is provided to cover basics and most often pre-purchase conversations, answered from the MMA Primary Research Dataset.

What is the current size of the Drone Logistics And Transportation Market?

The market is valued at USD 1.9 billion in 2025, measured as commercial revenue from cargo transport by uncrewed aircraft and the operations software supporting it.

How large will the Drone Logistics And Transportation Market be by 2036?

MMA forecasts USD 7.65 billion by 2036, up from USD 2.16 billion in 2026. That represents incremental revenue of USD 5.49 billion and an expansion multiple of 3.55 times.

What is the CAGR for the Drone Logistics And Transportation Market 2026 to 2036?

The base case CAGR is 13.5%, with a bull case of 14.8% and a bear case of 12.2%. Regulatory authorisation rather than technology sets the pace of that growth.

Which segment is growing fastest?

Medical and diagnostic payload delivery grows at 20.3%, half again the market rate of 13.5%, because that cargo derives its value from arriving quickly rather than cheaply.

Who are the major companies in the Drone Logistics And Transportation Market?

Zipline, Wing, Matternet, Manna Aero and Volocopter lead on commercial cargo flights flown under authorisation, holding around 41% between them across a notably fragmented industry with many participants.

Which country is growing fastest?

India grows fastest at 15.8%, driven by state health departments contracting medical delivery networks across terrain where road access fails seasonally every year during the monsoon period.

Report Segmentation Architecture

The full report scope spans multiple orthogonal segmentation dimensions, with cross-tabulated demand data provided for each dimension pair. Coverage extends further to regional breakdowns, trend trajectories, and the competitive detail needed to support segment-level decision-making.

By Payload Application

  • Medical and Diagnostic Payload Delivery
  • Middle Mile Inventory Movement
  • Consumer Parcel Delivery
  • Industrial and Offshore Resupply
  • Agricultural Input Transport
  • Traffic Management and Operations Software

By End-Use Industry

  • Healthcare and Public Health Systems
  • Retail and Commerce
  • Manufacturing and Industrial
  • Energy and Mining
  • Agriculture
  • Humanitarian and Government Services

By Commercial Dimension

  • Contracted Network Operation
  • Transactional Delivery Services
  • Logistics Integrator Subcontracting
  • Software Licensing
  • Aircraft Leasing and Operation
  • Public Sector Procurement

By Region

  • North America
  • Western Europe
  • East Asia
  • South Asia and Pacific
  • Latin America
  • Middle East and Africa
  • Eastern Europe

Scope, Methodology, and Coverage

Every figure in this report is reproducible from documented input assumptions. The scope below maps the historical period, the forecast horizon, the segmentation dimensions, and the countries covered, alongside the underlying primary and qualitative methodology.
Historical Period
2020 to 2025
Forecast Period
2026 to 2036
Base Year
2025 (USD billions; MMA Primary Research Dataset, August 2026)
Market Definition
Revenue from commercial cargo transport by uncrewed aircraft, spanning medical and diagnostic payload delivery, middle-mile inventory movement, consumer parcel delivery, industrial and offshore resupply, agricultural input transport, and the traffic management and operations software required to conduct such flights. Contracted network operation, transactional services, integrator subcontracting, software licensing and public sector procurement are all included. Passenger carrying air taxis, aerial imaging and inspection, defence logistics operated by armed forces, recreational operation, and airframe manufacture sold outside a service arrangement are excluded.
Quantitative Units
USD billions, commercial cargo transport and operations software revenue
Segmentation Dimensions
Payload application, end-use industry, commercial model, region
Regions Covered
North America, Western Europe, East Asia, South Asia and Pacific, Latin America, Middle East and Africa, Eastern Europe
Countries Covered
United States, United Kingdom, Germany, Switzerland, Norway, China, Japan, South Korea, India, Australia, Brazil, Rwanda, Ghana, Poland
Key Companies Profiled
Zipline, Wing, Matternet, Manna Aero, Volocopter, Wingcopter, Meituan Drone Delivery, Swoop Aero, Flytrex, ANRA Technologies
Quantitative Methodology
Primary survey, n=3,800 respondents, Q4 2025, six countries; demand-side model with trade association cross-validation
Qualitative Methodology
47 expert interviews, Q4 2025; applied to validate demand model assumptions, identify emerging dynamics, and assess competitive positioning
Report Format
PDF and XLSX data workbook (Word format preview document)
Publisher
Market Minds Advisory
Report Code
MMA-2026-CON-361
Published
August 2026
Contact
sales@marketmindsadvisory.com | www.marketmindsadvisory.com

Purchase the full Drone Logistics And Transportation Market Report (2026 to 2036).

The full report addresses the question this industry has spent eight years avoiding, which is where drone delivery beats a van and where it plainly does not. It quantifies cost per delivery by payload and route type, maps the 62 jurisdictions granting routine authorisation against where operators actually fly, and separates contracted revenue from flight volume in assessing operator position. Segment analysis covers all six payload categories, with particular attention to medical delivery and middle-mile movement where the commercial case is settled. Competitive assessment ranks twenty participants on authorised commercial cargo flight volume.
Six payload segmentation with growth rates
Cost per delivery broken down by route
Twenty operator assessment on authorised flight volume
Regulatory authorisation mapped across permitting jurisdictions
Contracted revenue separated from total flight volume
Traffic management software licensing value assessed

Built For The People Who Decide

From boardroom strategy to bench-side execution, this report is read cover-to-cover by leaders shaping the next decade of their industry, turning demand scenarios, market dynamics and valuation benchmarks into decisions.
CXOs/ Presidents/ VPs/ Managers
M&A and Corporate Development
Strategy Teams and R&D Heads
Procurement and Product Directors
Regulatory and Compliance Leaders
Investor Relations and Equity Analysts