Market Minds Advisory
Drone Analytics Market

Drone Analytics Market: Drone Analytics Market. AI-Powered Inspection Software Redefines Infrastructure Monitoring Economics

Utility crews once spent days climbing towers to inspect for corrosion, but AI models now scan thousands of drone-captured images overnight, turning aerial data into a subscription software business rather than a flight service.

Lead Analyst

Published

September 2026

Make Smarter Decisions with Customized Research Insights

Request a free sample report and evaluate market opportunities, growth trends, and competitive dynamics relevant to your business needs.

2025 MARKET VALUE$3.1BMarket Size 2025
2036 FORECAST VALUE$17.8BBase Case , 2026 to 2036
CAGR 2026 TO 203617.2 %Bull 18.5% / Bear 15.9%
INCREMENTAL OPPORTUNITY$14.1BNet 10- year value creation
EXPANSION MULTIPLE4.89x2036 value over 2026 base
Strategic Levers
M&A Pipeline
Regional Outlook
Country Rankings
Competitive Intelligence
Segmental Deep-dive
Call-Us : 91 93563 13602

Executive Snapshot and Market Trajectory.

Drone analytics has moved from raw image capture services to AI-powered inspection software, as infrastructure operators discover that the real value sits in automated defect detection rather than the flight itself across nearly every inspection program launched by operators worldwide today. No operator wants to lag behind on automation.
AI-powered infrastructure inspection platforms are pulling capital fastest among utilities and construction firms seeking to reduce manual inspection labor costs, while agricultural analytics vendors race to add computer vision capability before losing customers entirely to more automated competitors moving faster. Deployment is concentrated heavily among infrastructure operators across North America and increasingly across fast-growing East Asian construction markets. Order volume keeps climbing steadily. Vendors offering the deepest computer vision accuracy are winning the largest contracts.
Competitive intensity centers on a fragmented field of specialized analytics vendors rather than a handful of dominant incumbents, since defect detection accuracy across different infrastructure types requires years of accumulated training data specific to each industry vertical served today. Drone hardware commoditization is reshaping competitive dynamics, pushing value further into the analytics software layer. Rankings could shift as margins expand further.
Market Definition
This report defines the Drone Analytics Market as software platforms that process and analyze drone-captured imagery and sensor data for infrastructure inspection, agricultural monitoring, and construction site analysis. It excludes drone hardware manufacturing, flight control software, and general aerial photography services without analytical processing components.
Base Year Value
$3.1B in 2025 (MMA Primary Research Dataset, September 2026)
Forecast Period
2026 to 2036, eleven discrete annual values
CAGR
17.2% base case. Bull 18.5%. Bear 15.9%.
Fastest Growth Segment
AI-Powered Infrastructure Inspection Analytics: 26.7% CAGR
Fastest Growth Country
India: 23.0% CAGR
Fastest Growth Region
South Asia and Pacific: 19.2% CAGR
Largest Region
North America: 31% of 2025 global value
Market Leaders
DroneDeploy, Skydio, PrecisionHawk, Kespry, and Pix4D. Source: MMA Analysis based on company disclosures and platform deployment estimates.
Primary Survey
n=3,800 procurement and R&D decision-makers, Q4 2025, six countries
Methodology
Demand-side build-up, cross-validated against public data, 47 expert interviews

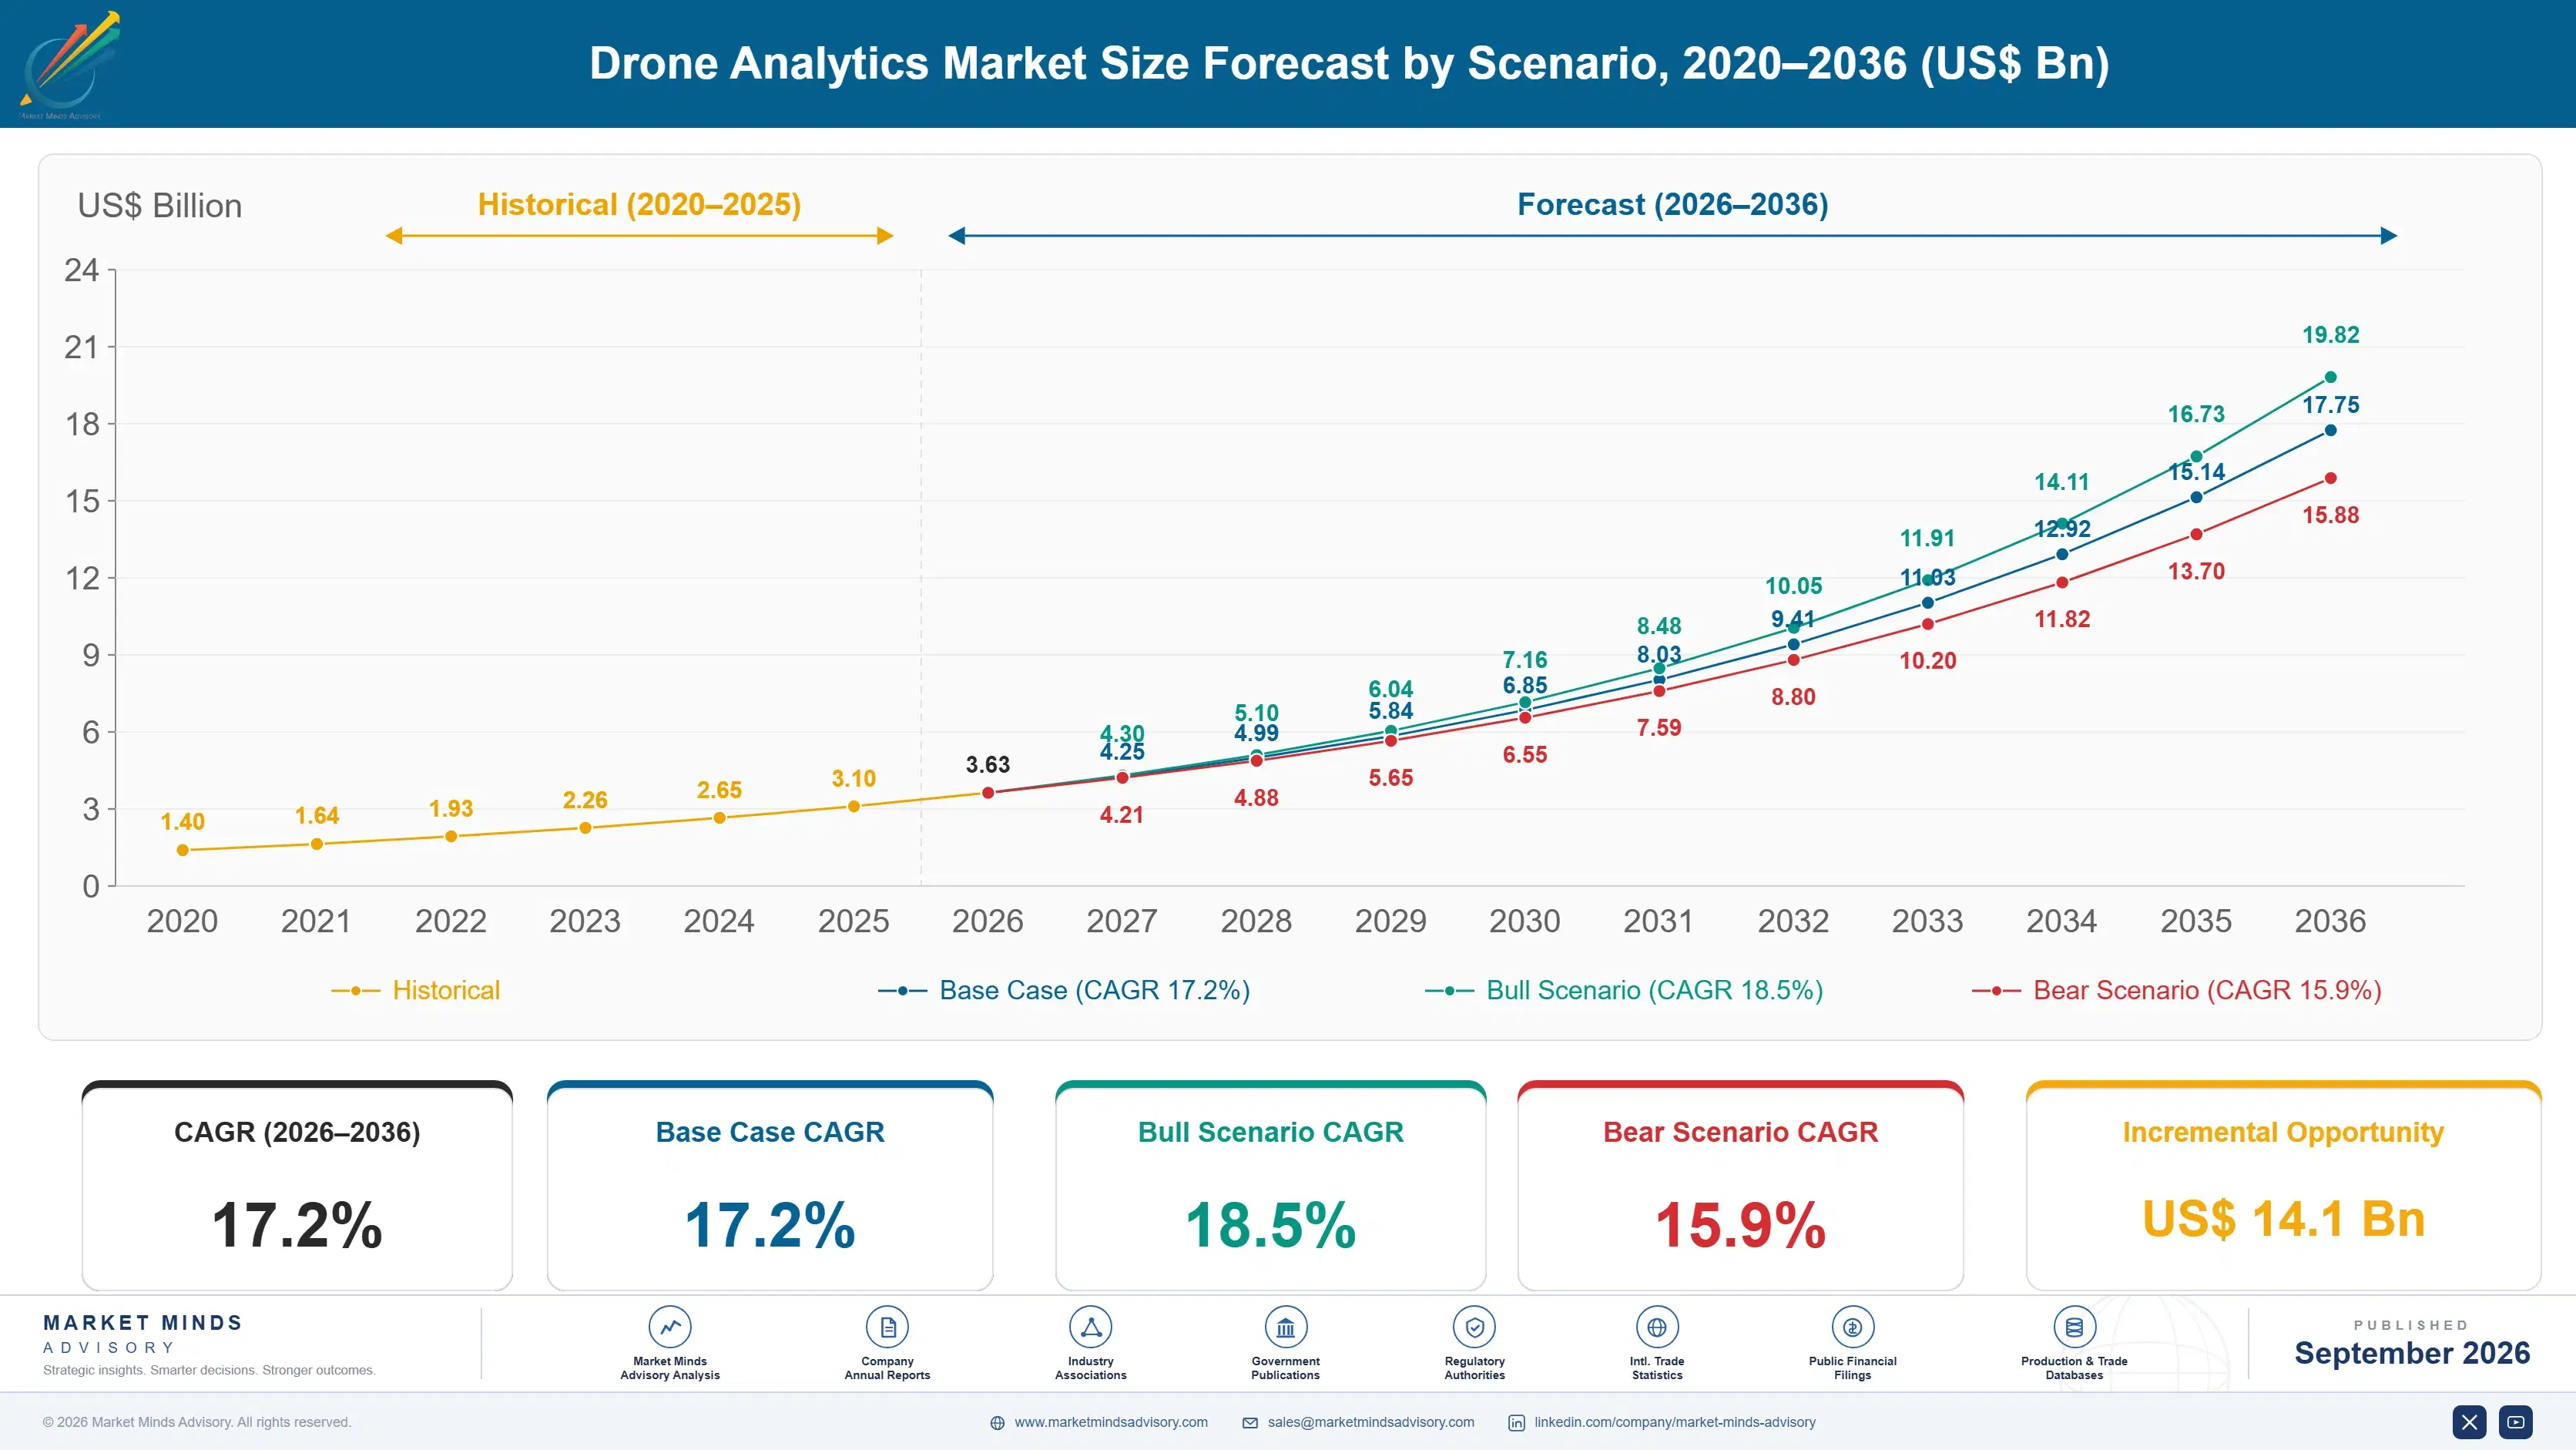
Drone Analytics Market Forecast Scenarios

drone-analytics-market-size-forecast-scenario-1789996321083
Between 2020 and 2025, drone analytics grew steadily as drone hardware costs declined and infrastructure operators began experimenting with aerial inspection pilots across multiple asset categories, though most analysis still relied on manual image review by trained engineers. The category posted a historical CAGR of roughly 15.9% as AI-powered defect detection had barely begun replacing manual review workflows.
The base case rests on three commercial mechanisms: utilities and infrastructure operators adopting AI-powered defect detection to replace manual image review, construction firms standardizing on drone analytics for progress monitoring and safety compliance, and agricultural operations scaling computer vision capability across larger acreage than manual scouting could ever cover. Together these mechanisms support a forecast CAGR of 17.2% through 2036, with infrastructure inspection analytics growing considerably faster than agricultural monitoring applications.
The bull case centers on accelerated utility and infrastructure modernization spending that pulls forward AI-powered inspection adoption across multiple asset categories simultaneously. The bear case centers on drone hardware commoditization compressing overall market value even as software adoption continues expanding, since declining hardware prices could pressure bundled pricing models across the industry. That pressure keeps intensifying steadily.

From Aerial Photography to Automated Defect Detection

Drone analytics has moved from a flight logistics service to a software-defined inspection discipline, since the analytics layer now captures more commercial value than the underlying flight operations that were once the entire product. No operator wants to pay flight fees for data nobody actually analyzes properly. That gap keeps widening steadily.
MARKET CONCENTRATION36% CR5Top five vendors hold combined global platform deployment share
AVERAGE SUBSCRIPTION PRICE$2,400 per monthTypical monthly fee for enterprise inspection platform accounts
TOP PRODUCING COUNTRY SHARE28%United States share of global drone analytics revenue generated
AI DEFECT DETECTION ACCURACY94%Average detection accuracy across leading vendor inspection platforms
MANUAL REVIEW TIME SAVINGS68%Typical reduction in inspection review hours after AI deployment
TRAINING DATA COST SHARE24% of COGSShare of platform cost tied to annotated training data acquisition
AI defect detection accuracy has become the primary competitive differentiator among vendors, since infrastructure operators increasingly select platforms based on documented detection rates for their specific asset types rather than flight capability alone. Vendors lacking vertical-specific training data are steadily losing enterprise accounts to more specialized competitors. That gap keeps widening every fiscal quarter across the vendor landscape. Order volume for specialized inspection platform licenses keeps climbing steadily.
Training data acquisition has become a significant cost and competitive barrier, since building accurate defect detection models requires years of annotated imagery specific to each infrastructure type that new entrants cannot easily replicate quickly. That barrier is reinforcing incumbent advantage even as drone hardware itself becomes increasingly commoditized across the industry. Few smaller vendors can realistically close that training data gap quickly. Few can close it quickly.
"Everyone assumed drone analytics was about better cameras. Then operators realized the real product was the AI model that could spot a hairline crack in a wind turbine blade nobody would ever notice manually."
Director, Industrial Inspection and Aerial Analytics Practice · MMA Technology Practice · September 2026

Market Trends

AI Defect Detection Replaces Manual Image Review Entirely

Infrastructure operators are increasingly trusting AI models to flag defects automatically rather than requiring trained engineers to manually review every captured image, treating automated detection as production-ready rather than a supplementary tool. Roughly 41% of enterprise inspection programs now rely primarily on AI-flagged results with only spot-check human verification, up sharply from a low share just two years ago, and vendors are extending detection accuracy guarantees to win the largest infrastructure operator contracts. Vendors that built adequate detection accuracy early now hold a meaningful advantage over slower-moving competitors still validating models against real-world infrastructure data.
Market Impact: utility inspection spending grew 33% yearly
Cross-Industry Training Data Partnerships Expand Coverage

Analytics vendors are forming data-sharing partnerships across utility, construction, and agricultural customers to build broader, more accurate training datasets than any single customer relationship could provide alone. This collaborative approach has pulled roughly 26% of enterprise customers into shared data partnership programs over the past two years, reshaping how vendors compete for exclusive versus shared training data access across their customer base. Vendors offering the most inclusive data-sharing terms are capturing disproportionate share of this collaboration-driven demand as customers seek faster model accuracy gains. That trend is expected to continue as vendors seek broader coverage.
Market Impact: construction analytics adoption grew 27%

Market Opportunities and Growth Drivers

Aging Utility Infrastructure Drives Inspection Demand

Utilities managing aging transmission and distribution infrastructure are increasingly adopting drone analytics to identify deterioration before it causes outages or safety incidents, replacing costly and dangerous manual climbing inspections. Utility inspection spending on drone analytics grew roughly 33% year over year as regulators increasingly required documented inspection cadences that manual crews alone could not economically sustain across expanding infrastructure footprints. That trajectory is expected to continue as regulatory scrutiny remains elevated across multiple utility categories over the coming several years ahead for most infrastructure operators. Margins for premium inspection contracts remain elevated.
Market Impact: extends maturity by 18 months

Construction Firms Adopt Analytics for Progress Verification

Construction firms facing pressure to document project progress accurately for lenders and insurers are adopting drone analytics platforms that provide verifiable, timestamped site documentation rather than relying on manual progress reports alone. Construction analytics adoption grew roughly 27% year over year as firms found documented aerial verification reduced payment disputes and insurance claim processing time across large commercial projects. Vendors offering the most detailed, auditable documentation are capturing disproportionate share of this verification-driven demand as project financing standards continue tightening. That competitive gap continues widening every fiscal quarter across the sector.
Market Impact: delays rollout by 6 months

Market Restraints and Challenges

Vertical-Specific Training Data Scarcity Limits New Entrants

The core friction point is that building accurate defect detection models requires years of annotated imagery specific to each infrastructure type, rooted in the reality that generic computer vision models trained on consumer imagery transfer poorly to specialized industrial defect categories. The commercial impact is direct: new entrants face years of accuracy disadvantage against incumbents with established data pipelines. Several smaller vendors are responding by pursuing data-sharing partnerships as a mitigation pathway that accelerates model accuracy improvement. Smaller vendors without existing customer relationships find themselves further constrained in accessing the annotated imagery volume needed to close this accuracy gap quickly.
Market Impact: 41% of programs use AI-first review

Airspace Regulation Complicates Commercial Drone Operations

The core friction point is that commercial drone operations remain subject to complex airspace regulation that varies considerably across jurisdictions, a constraint rooted in aviation safety authorities' cautious approach to beyond-visual-line-of-sight flight approval. The commercial impact falls hardest on operators seeking to scale inspection programs across large geographic territories requiring multiple regulatory approvals. Several operators are mitigating exposure by partnering with certified drone service providers holding existing regulatory waivers. This partnership approach adds meaningful revenue sharing cost but has proven effective at helping smaller operators scale programs faster than pursuing independent regulatory approval alone.
Market Impact: 26% of customers join data partnerships
4 additional market trends, 4 additional growth drivers, and 3 additional restraints and challenges are covered in the full report. Contact sales@marketmindsadvisory.com to access the complete intelligence.

Segment CAGR and Growth Architecture

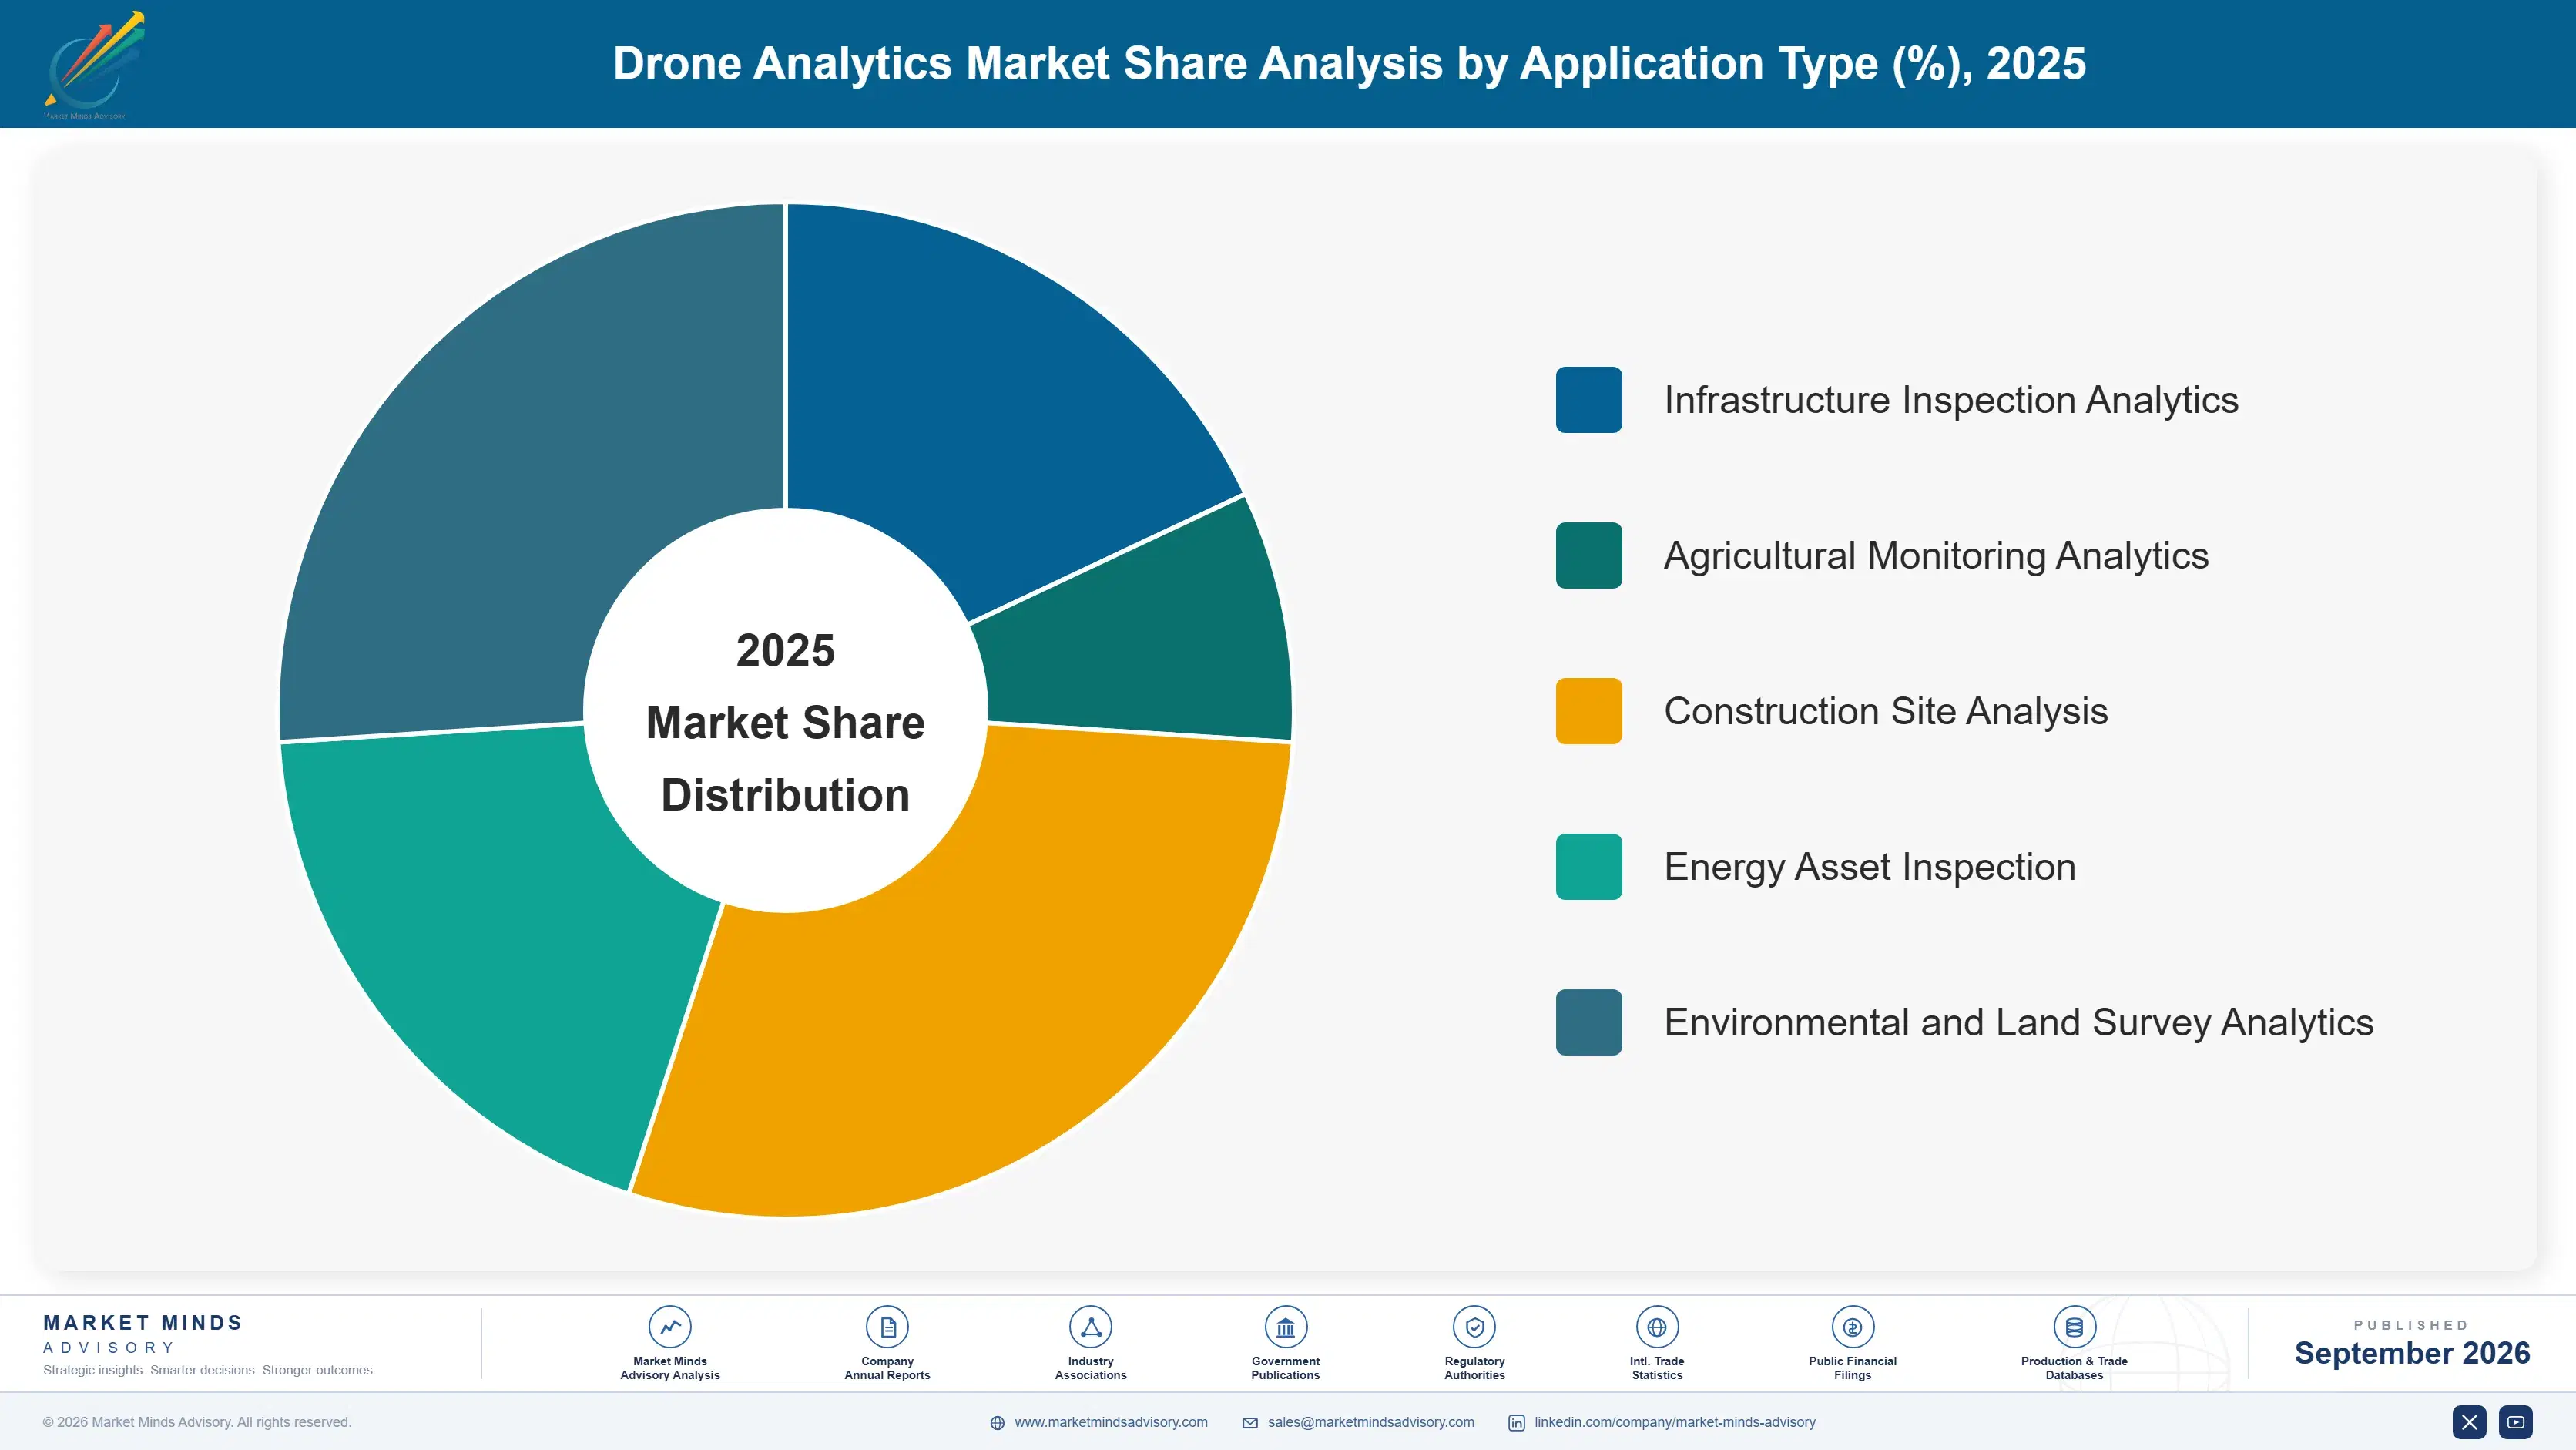
Drone analytics segments by core end-use application rather than by drone hardware type, since the same underlying computer vision and data processing architecture serves infrastructure inspection, agricultural monitoring, and construction site analysis with vertical-specific model training layered on top for each particular customer segment, geographic region, or overall company size ultimately being served today.
drone-analytics-market-market-share-analysis-1789996321662

AI-Powered Infrastructure Inspection Analytics

AI-powered infrastructure inspection analytics identifies corrosion, cracking, and structural deterioration across utility towers, pipelines, bridges, and wind turbines through automated computer vision models trained on vertical-specific defect categories. Demand is concentrated among utilities and infrastructure operators who can justify the platform investment required to replace costly, dangerous manual climbing inspections at meaningful scale. Growth here runs meaningfully ahead of the broader market as regulatory inspection requirements and aging infrastructure increasingly favor automated, documented inspection cadences over manual alternatives. Vendors offering the deepest vertical-specific accuracy are winning the largest utility contracts as this segment continues to outgrow the broader analytics category considerably. Order backlogs there now extend well past six months.
CAGR 26.7%

Agricultural and Construction Site Monitoring Analytics

Agricultural and construction site monitoring analytics tracks crop health, irrigation efficiency, and construction progress through aerial imagery processed for vegetation indices, volumetric measurement, and timeline documentation rather than structural defect detection specifically. Demand is concentrated among large-scale farming operations and commercial construction firms seeking documentation and efficiency gains across acreage or project scope that manual monitoring cannot economically cover. Vendors offering the most accurate measurement and documentation capability are capturing disproportionate share of this application-specific demand. That measurement advantage compounds as model accuracy continues improving generation over generation across the broader agricultural technology sector. Farmers switching to these advanced platforms report meaningfully higher yield gains than those still relying on manual field scouting methods alone.
CAGR 12.4%
Full segment breakdown across 7 segments available in the complete report.

Regional Architecture and Country Demand Map

Deployment concentrates where infrastructure inspection spending and utility modernization budgets are deepest, favoring North America, followed closely by East Asian and Western European markets scaling their own inspection infrastructure across expanding utility networks and secondary construction hubs both nationwide and internationally throughout this current cycle.

North America

The United States dominates North American demand through its concentration of utilities with aging transmission infrastructure and the headquarters of leading analytics vendors like DroneDeploy and Skydio. Canada contributes a smaller but growing share as domestic utilities extend similar inspection programs across their own transmission networks. Competition here is the most intense globally, with several vendors locked in aggressive detection accuracy races to win the largest utility and infrastructure contracts. Mexico's growing infrastructure sector is beginning to adopt similar inspection structures as nearshoring investment continues expanding across the country's industrial base. Order backlogs for top-tier inspection platform implementations there now extend several months given surging utility demand. Vendor consolidation through acquisition remains an active theme.
Share: 31% | CAGR: 18.3% (2026 to 2036)

East Asia

China's massive infrastructure base, spanning extensive power transmission networks and rapid construction activity, drives substantial demand for domestic analytics platforms built to reduce reliance on Western vendors. Japan and South Korea favor established industrial technology vendors given their mature infrastructure maintenance sectors and existing supplier relationships built over years. Rapid renewable energy infrastructure expansion across major East Asian markets is pushing operators toward increasingly sophisticated inspection technology. Taiwan and Hong Kong contribute smaller but sophisticated demand tied to their dense infrastructure networks and high-value technology sector requirements. South Korea's chaebol-backed infrastructure arms are building proprietary analytics capability rather than relying entirely on third-party vendors. That proprietary approach limits third-party vendor penetration somewhat.
Share: 23% | CAGR: 18.2% (2026 to 2036)
Regional intelligence for 5 additional markets available in the complete report: Western Europe, South Asia and Pacific, Latin America, Middle East and Africa, Eastern Europe. Contact sales@marketmindsadvisory.com.
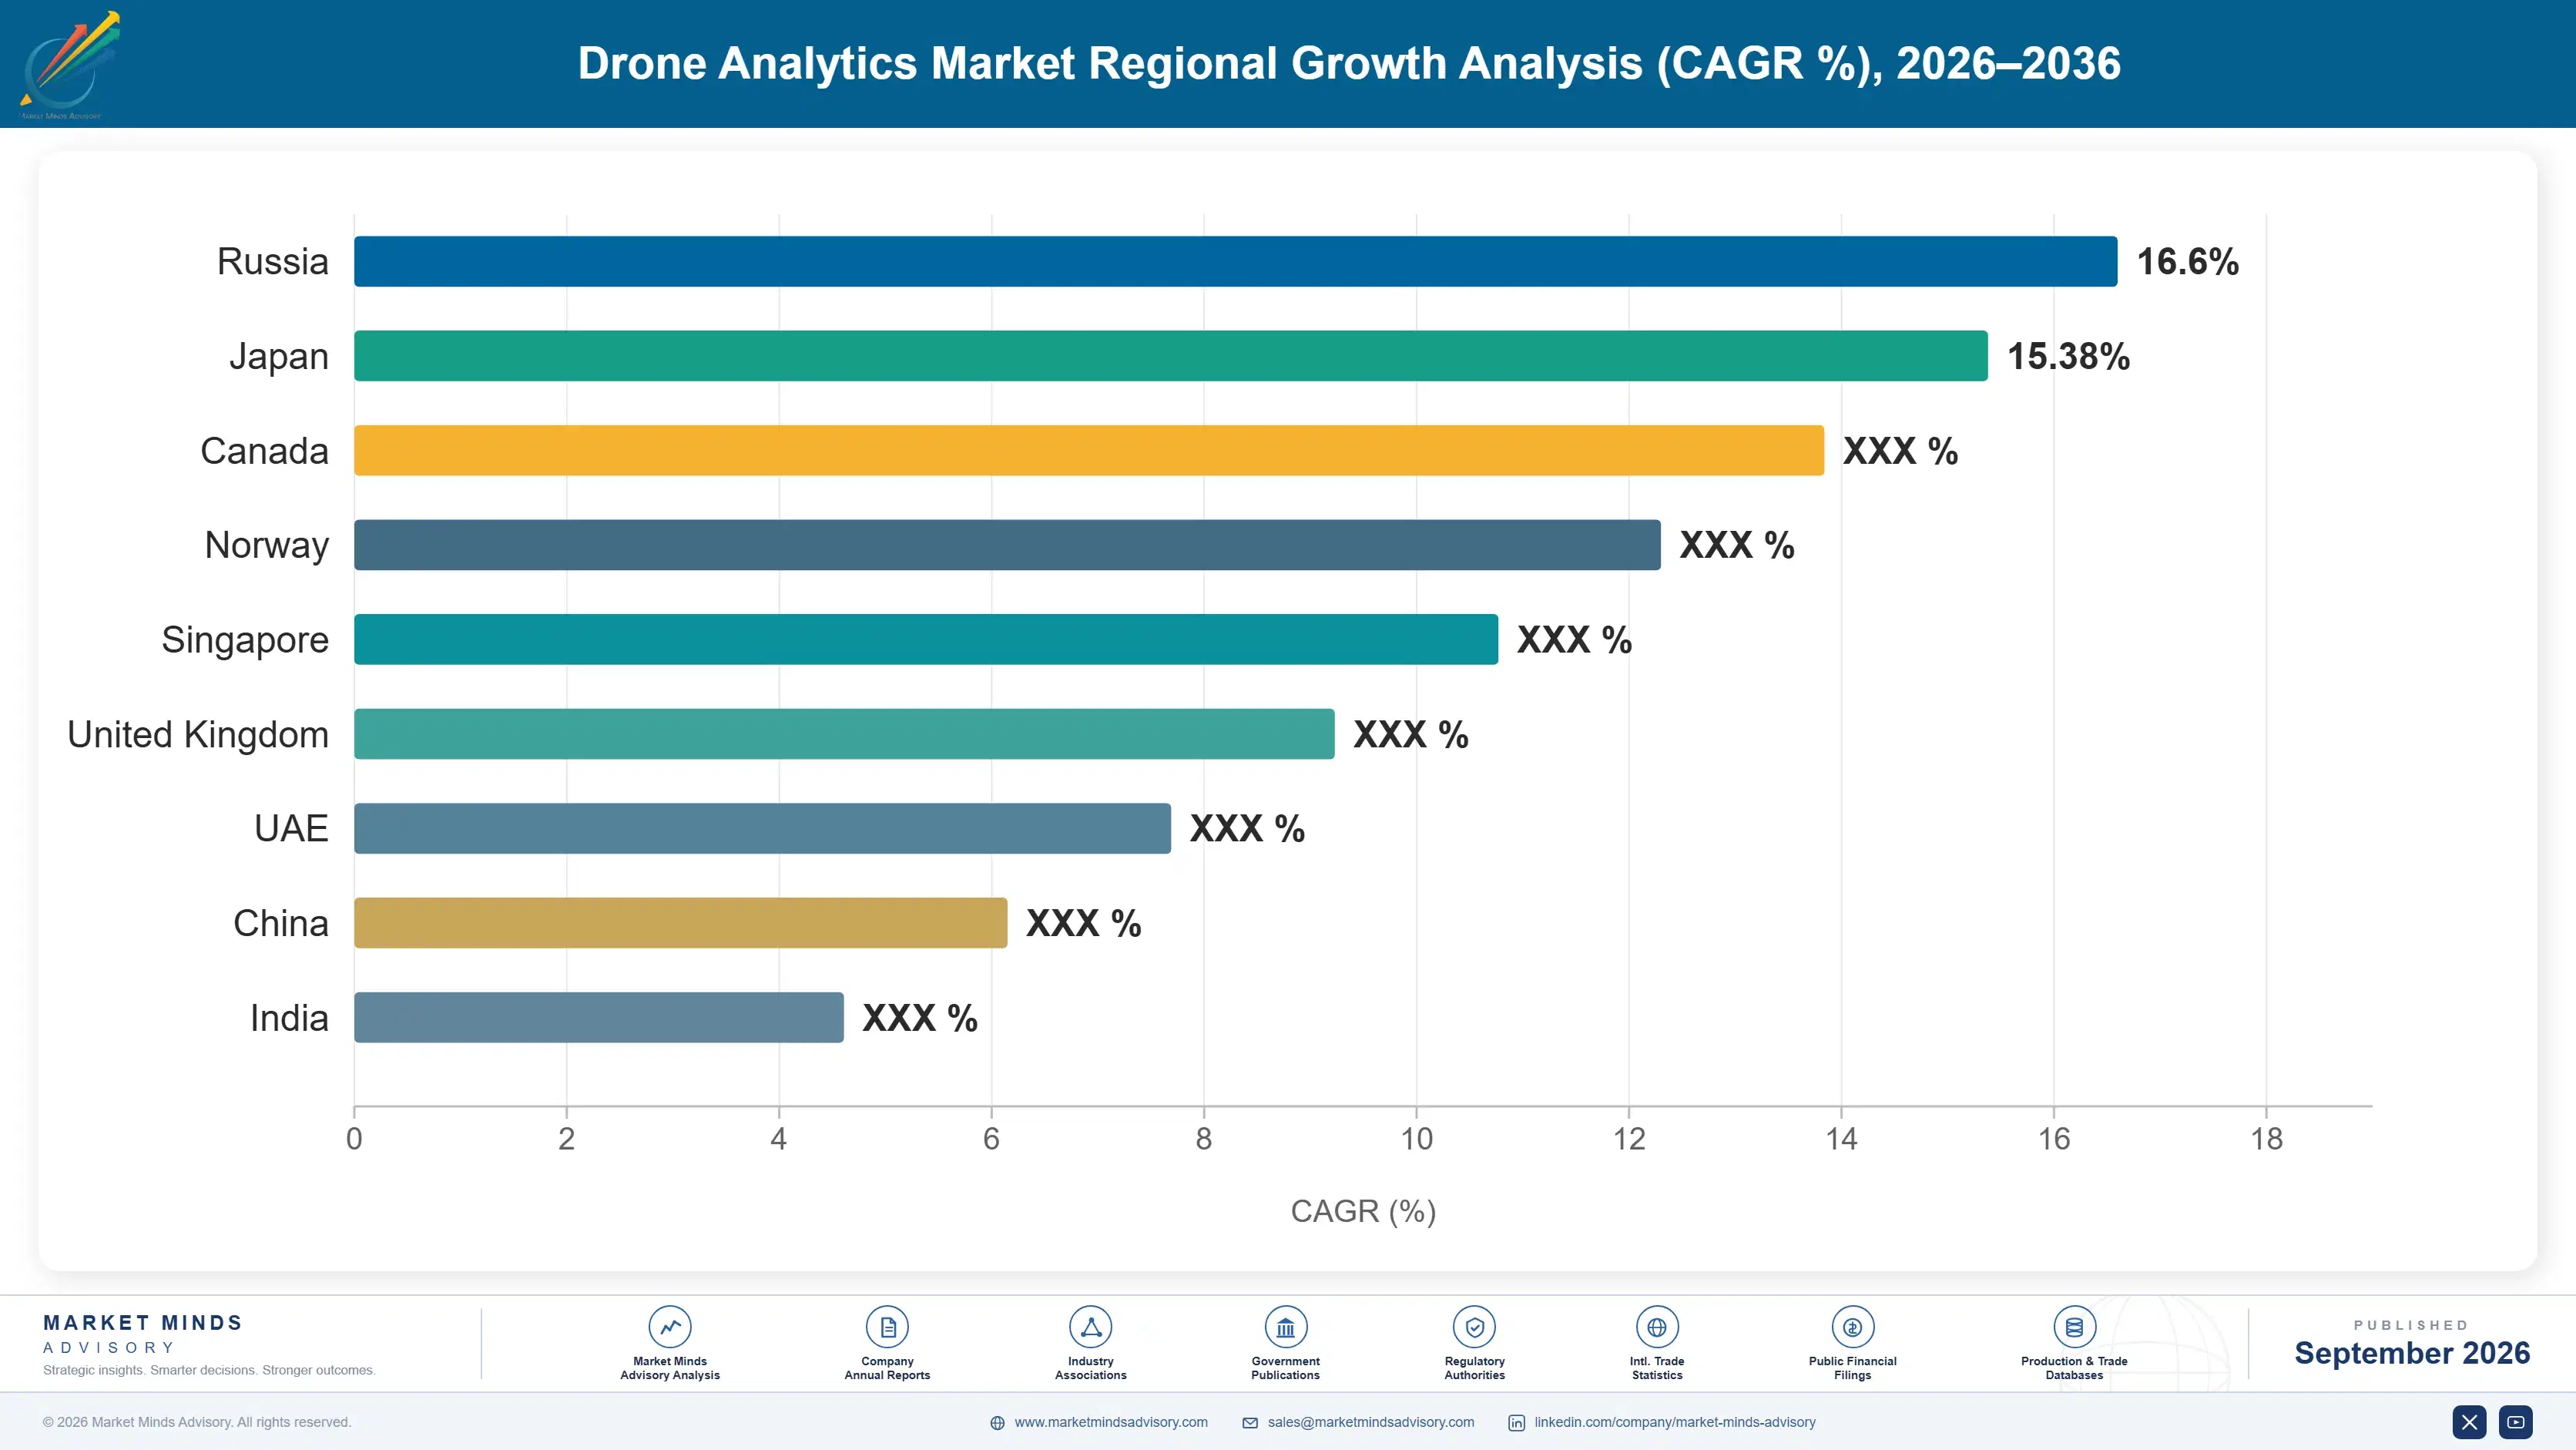
drone-analytics-market-country-cagr-analysis-1789996322187

Where Analytics Vendors Capture More Recurring Revenue

Vendors capture disproportionate margin where vertical-specific training data justifies premium detection accuracy pricing and where compliance documentation lets platforms serve regulated infrastructure customers that thinner, less-specialized competitors cannot support across the broader inspection market today, tomorrow, and well into the several years ahead for most competing vendors operating currently across the entire global industry.

Vertical-Specific Detection Accuracy Premium Programs Overall

Vendors that develop deep, vertical-specific defect detection accuracy for particular infrastructure types can sustain higher subscription pricing than vendors offering generic computer vision capability across multiple use cases. Vertical-specific platforms now command roughly 36% higher subscription revenue than generic detection platforms, letting vendors capture premium pricing from infrastructure operators willing to pay for documented accuracy guarantees at meaningful scale. Vendors without this vertical-specific capability increasingly find themselves competing on price alone within the shrinking generic detection segment of the market. That competitive dynamic keeps widening every fiscal quarter. Margins for premium accuracy tiers remain elevated.
Market Impact: vertical platforms now earn roughly 36% more value

Regulatory Compliance Documentation Premium Programs Overall

Vendors offering pre-built regulatory compliance documentation and audit trail capability are capturing larger utility and infrastructure contracts than vendors requiring customers to build compliance reporting independently. Compliance-certified platforms now command roughly 28% higher pricing than standard analytics offerings, and demand for this capability continues growing as regulatory inspection documentation requirements tighten across jurisdictions. Smaller vendors without dedicated compliance engineering increasingly find themselves excluded from these premium regulated infrastructure contracts entirely. Contract renewal rates for certified accounts run considerably higher. Smaller vendors without dedicated compliance teams increasingly find themselves excluded from these regulated contracts entirely across the industry.
Market Impact: compliance platforms now cost roughly 28% more value

Multi-Site Enterprise Rollout Conversion Programs Overall

Vendors that convert single-site pilot programs into multi-site enterprise rollouts are capturing considerably larger long-term contract value than vendors focused purely on isolated pilot engagements. Conversion programs that guide customers from pilot to enterprise-wide deployment now generate roughly 31% higher customer lifetime value, and vendors continue investing in dedicated enterprise expansion support teams to protect this pipeline. Smaller vendors without dedicated enterprise transition support increasingly find themselves excluded from these larger, more lucrative rollout opportunities entirely. That gap keeps compounding as enterprise expansion demand continues growing. Retention rates for converted accounts run considerably higher.
Market Impact: conversion programs now generate roughly 31% more value

Multi-Year Infrastructure Monitoring Contract Programs Overall

Vendors that negotiate multi-year monitoring contracts covering recurring inspection cycles are securing considerably more predictable recurring revenue than vendors relying on project-by-project engagement subject to competitive rebidding each cycle. Multi-year monitoring contracts increase average customer lifetime value by roughly 34% relative to comparable project-based arrangements, giving vendors meaningfully better visibility into future capacity planning needs. Vendors without the relationship depth to negotiate multi-year terms increasingly find themselves losing enterprise accounts to competitors offering greater pricing certainty. That certainty has become genuinely valuable enough to justify meaningfully higher pricing. Margins for these accounts remain elevated.
Market Impact: multi-year contracts now add roughly 34% more value

Who Controls the Margin Pool

The Drone Analytics Market is fragmented, with a CR5 of 36% reflecting platform deployment share among the top five analytics vendors. DroneDeploy holds a leading position given its broad cross-industry platform reach, though the gap between it and mid-tier challengers remains narrow, since vertical-specific specialists in utility inspection and agriculture compete effectively within their respective niches. Only a handful of vendors can realistically match that cross-industry breadth.
Current competitive activity centers on vertical-specific accuracy investment and compliance certification rather than pricing alone, since infrastructure operators increasingly evaluate vendors on documented detection performance for their specific asset types. Leading vendors are pursuing partnerships with utilities to secure exclusive training data access while simultaneously acquiring smaller specialized computer vision firms to fill vertical capability gaps faster than internal development would allow.

Emerging pressure is coming from drone hardware manufacturers building in-house analytics capability rather than partnering with third-party software vendors, threatening to bundle analytics directly into hardware sales and bypass standalone software vendors entirely. Rankings could shift meaningfully if enough hardware manufacturers continue this vertical integration trend, since it removes them from the addressable third-party analytics market once bundled offerings mature.
drone-analytics-market-company-positioning-matrix-1789996322718

Competitive Moat and Risk Dimensions

DRONEDEPLOY

Moat: Broad Cross-Industry Platform Reach

DroneDeploy's platform spans agriculture, construction, and infrastructure inspection use cases, giving it cross-selling reach that vertical-only specialists cannot easily replicate, letting it serve customers with diverse aerial data needs. That breadth advantage compounds as enterprises increasingly prefer consolidated vendor relationships over managing multiple point solutions.
DRONEDEPLOY

Risk: Narrower Vertical-Specific Accuracy

DroneDeploy's broad platform approach can mean less specialized detection accuracy in any single vertical compared to focused competitors that concentrate entirely on one infrastructure type. If vertical specialists continue closing the accuracy gap while maintaining broader coverage, DroneDeploy risks losing the most demanding enterprise accounts.
SKYDIO

Moat: Integrated Hardware and Software Advantage

Skydio's integration of proprietary drone hardware with its own analytics software gives it performance and reliability advantages that pure-software vendors dependent on third-party hardware cannot fully replicate, since it controls the entire data capture pipeline. That vertical integration advantage matters most in demanding autonomous flight scenarios.
SKYDIO

Risk: Premium Pricing Vulnerability Exposure

Skydio's integrated hardware-software model commands premium pricing that leaves room for software-only vendors to undercut it on analytics-specific value. If customers begin decoupling hardware and software purchasing decisions, Skydio risks losing accounts to vendors offering hardware-agnostic analytics flexibility. That scenario becomes more plausible each year as flexible, hardware-agnostic analytics vendors expand their platform coverage.

Players Tracked

Prominent Players

DroneDeploy
Skydio
PrecisionHawk
Kespry
Pix4D

Other Key Players

Percepto
Airobotics
Terra Drone
Sentera
Delair
Sensefly
Identified Technologies
Skycatch
AgEagle Aerial Systems
Measure
Nearmap
EagleView
Cape Analytics
Betterview
Zeitview

Recent Developments

JANUARY 2026

DroneDeploy acquired a smaller specialized utility inspection analytics startup to accelerate its vertical-specific detection accuracy roadmap ahead of competitors still developing comparable capability internally. The acquisition brings proprietary defect classification technology and an engineering team with relevant utility inspection experience. Terms of the transaction were not fully disclosed publicly.
Signal: Signals DroneDeploy is filling a utility-specific accuracy gap through acquisition rather than through slower internal development.
SEPTEMBER 2025

Skydio signed a multi-year data partnership agreement with a major utility company to integrate verified inspection imagery directly into the utility's asset management system. The partnership grants Skydio priority access to expanded training data opportunities ahead of competing vendors. Financial terms of the partnership were not disclosed.
Signal: Signals utilities increasingly favor hardware-integrated analytics vendors given the strong operational value of shared training data.
MAY 2025

Pix4D expanded its agricultural analytics coverage through an organic engineering investment aimed at reducing onboarding time for farming operations adding new crop monitoring capability across expanding acreage. The expansion adds support for additional crop types previously unsupported. The company plans further crop coverage expansion into additional regions next year.
Signal: Signals mid-tier vendors are now prioritizing agricultural breadth over premium enterprise-only features given quite rising demand.

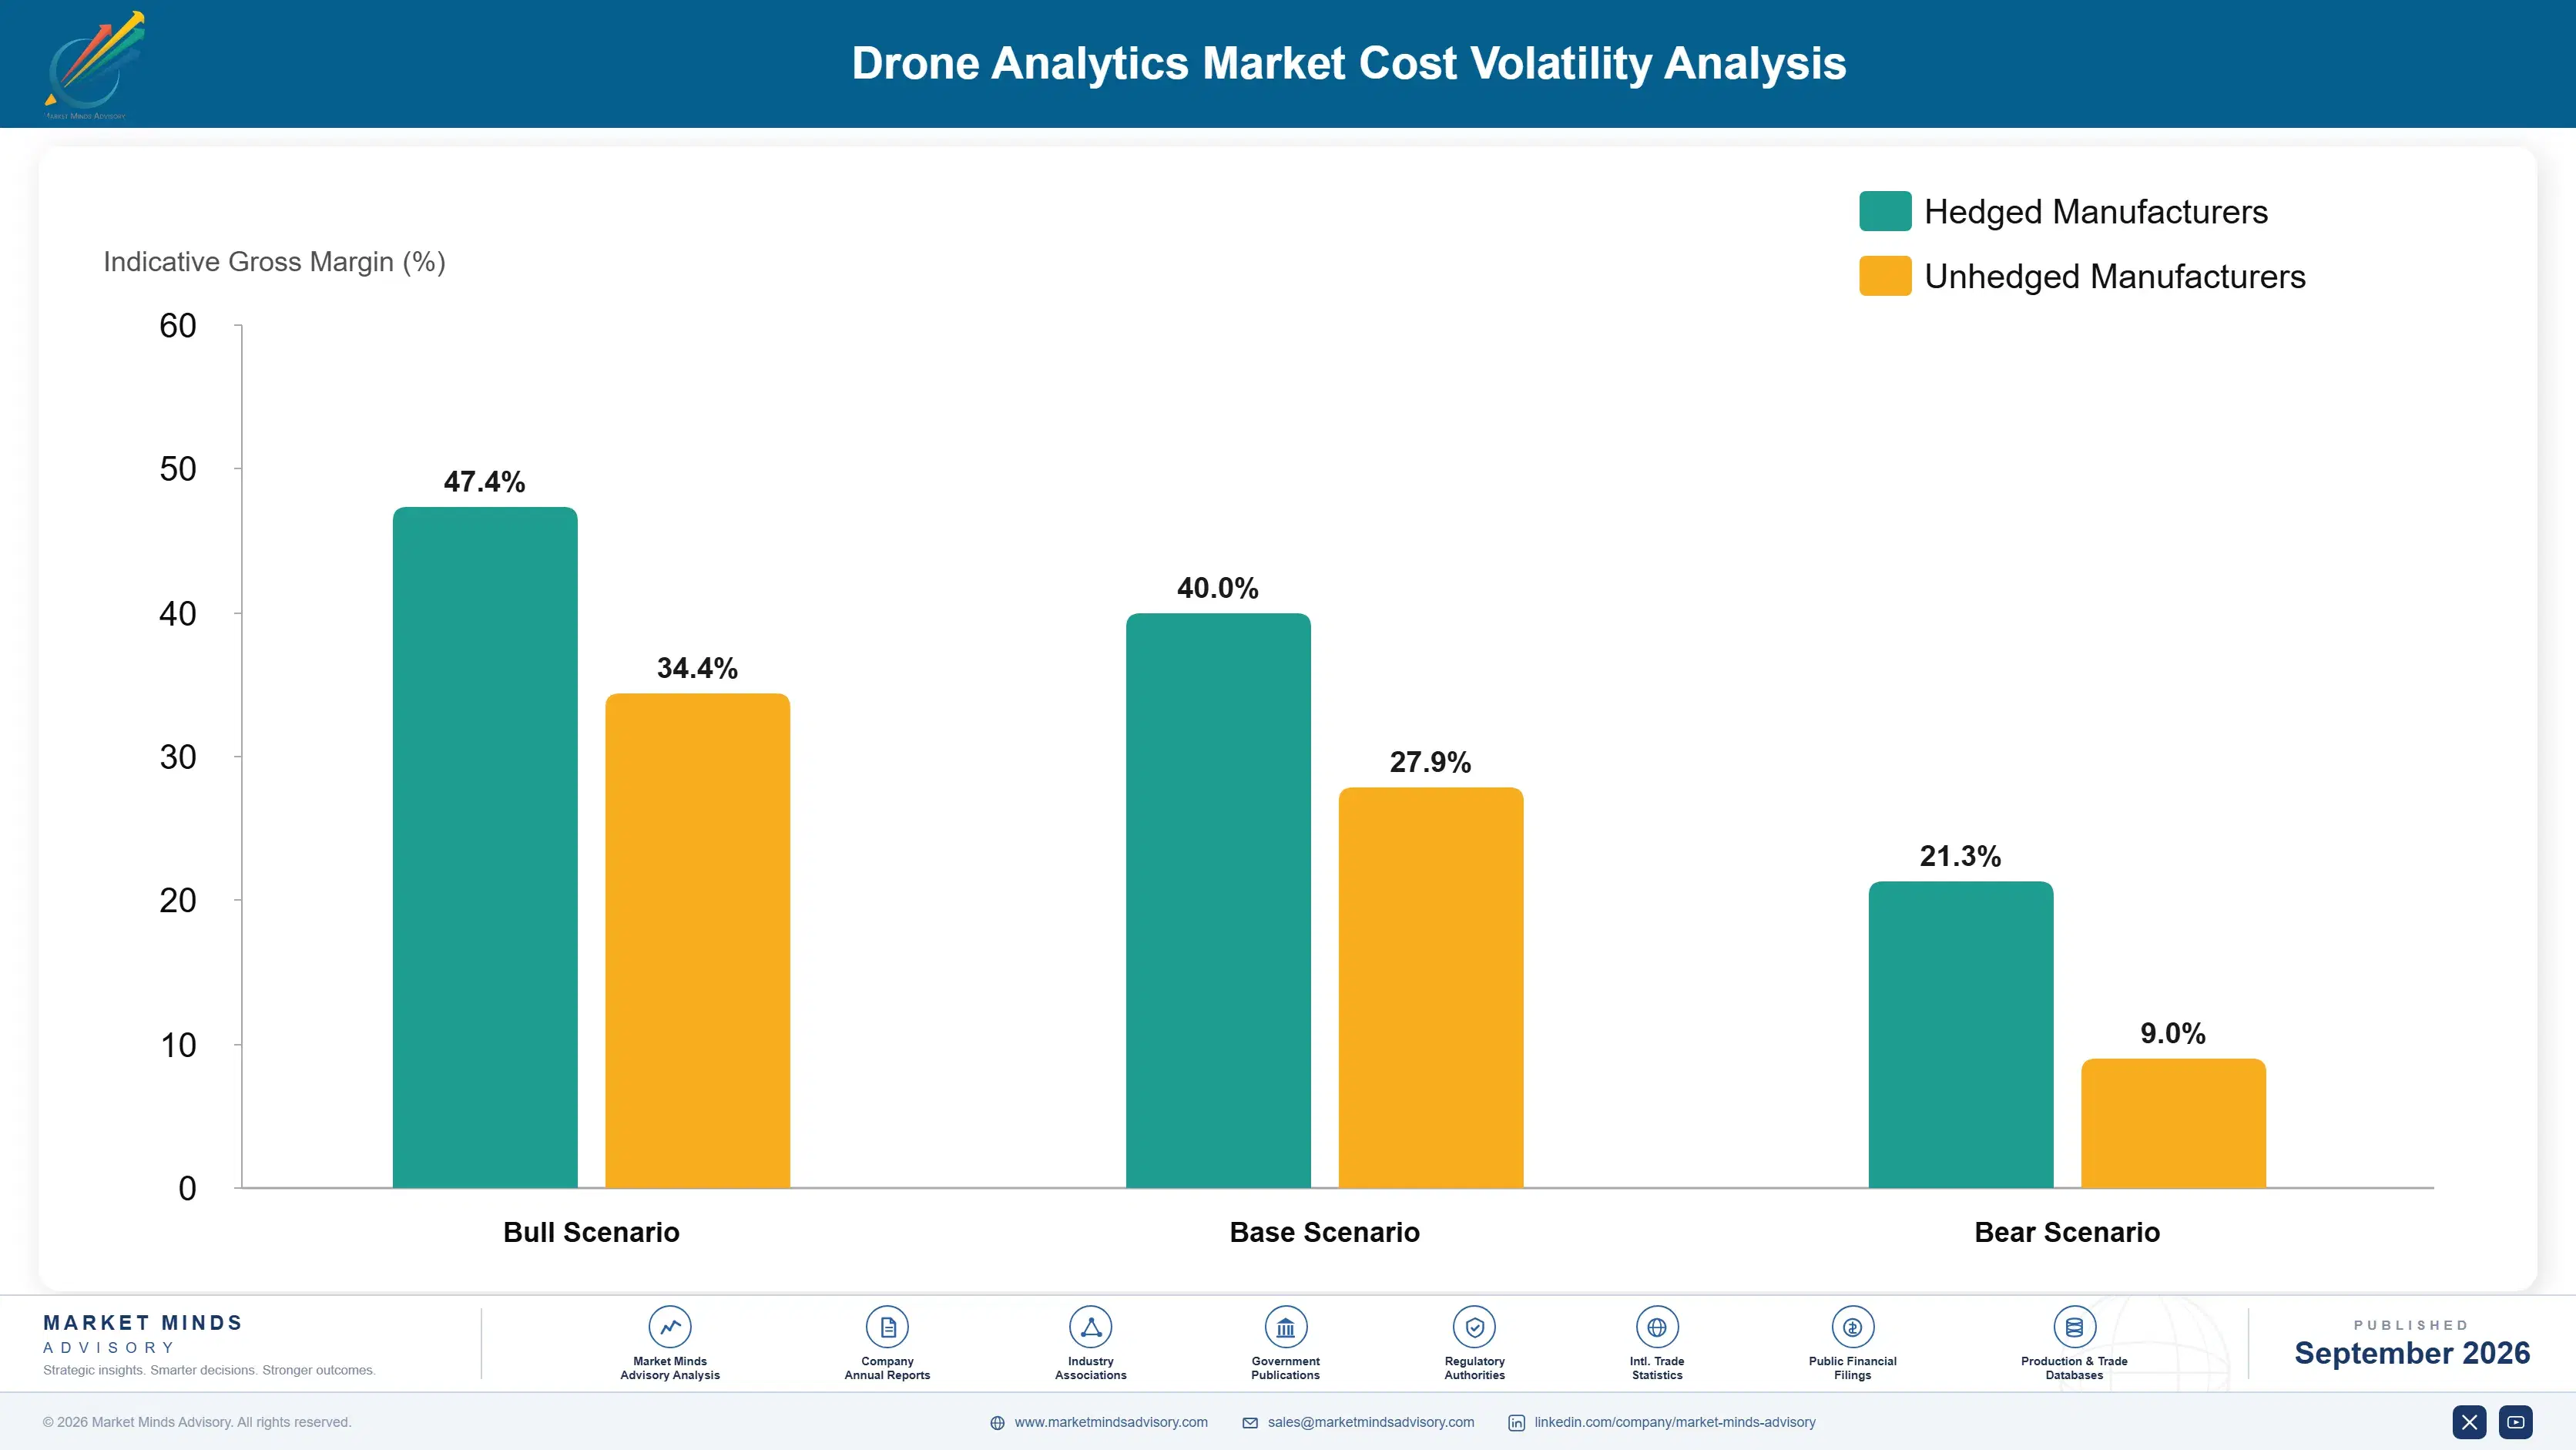
Cloud Compute and Training Data Cost Exposure

Cloud compute infrastructure and annotated training data acquisition together represent roughly 24% of platform cost of goods sold, with compute costs concentrated among a small number of major cloud providers while training data annotation costs vary depending on the specialization required for each infrastructure vertical served across the industry. Specialized human annotation labor adds a further layer of variable cost exposure at scale.
Cloud compute pricing rose meaningfully through 2025 as computer vision model training demand scaled alongside growing imagery volume, according to disclosures in a major cloud provider's FY2025 Annual Report. Several analytics vendors reported margin compression in quarterly filings tied directly to rising compute costs during that period of sustained model training growth, with some citing double-digit percentage cost increases on advanced product lines. on their newest inspection product lines.

Smaller regional vendors lacking committed cloud spending agreements face a genuine competitive disadvantage against larger platforms like DroneDeploy and Skydio, which can negotiate volume discounts through scale purchasing relationships with major cloud providers. This exposure varies by business model too, since vendors charging per-flight fees absorb compute cost volatility quite differently than vendors operating on flat subscription pricing.
drone-analytics-market-cost-volatility-analysis-1789996322913

Committed Cloud Spending Discount Agreements

Leading vendors are negotiating committed cloud spending agreements directly with major providers to secure volume discounts during periods of rising compute demand. This approach has measurably reduced cost variance for vendors with the transaction scale to negotiate favorable multi-year terms. Several vendors have extended these agreements to cover multiple years, locking in predictable infrastructure costs across successive product releases.

Shared Training Data Partnership Programs

Some vendors are forming shared training data partnerships with enterprise customers to reduce the annotation cost burden of building vertical-specific models independently, insulating margins from volatility that smaller competitors lacking this leverage cannot access as easily. Several vendors now maintain both proprietary and shared model options to preserve flexibility across different customer verticals served.

Usage-Based Compute Cost Pass-Through Pricing

Several vendors are shifting toward pricing models that pass a portion of variable compute costs directly to enterprise customers rather than absorbing volatility entirely within fixed subscription fees. This approach reduces margin risk though it requires careful customer communication. Several vendors report this shift has actually improved customer retention by aligning pricing more closely with realized inspection value.

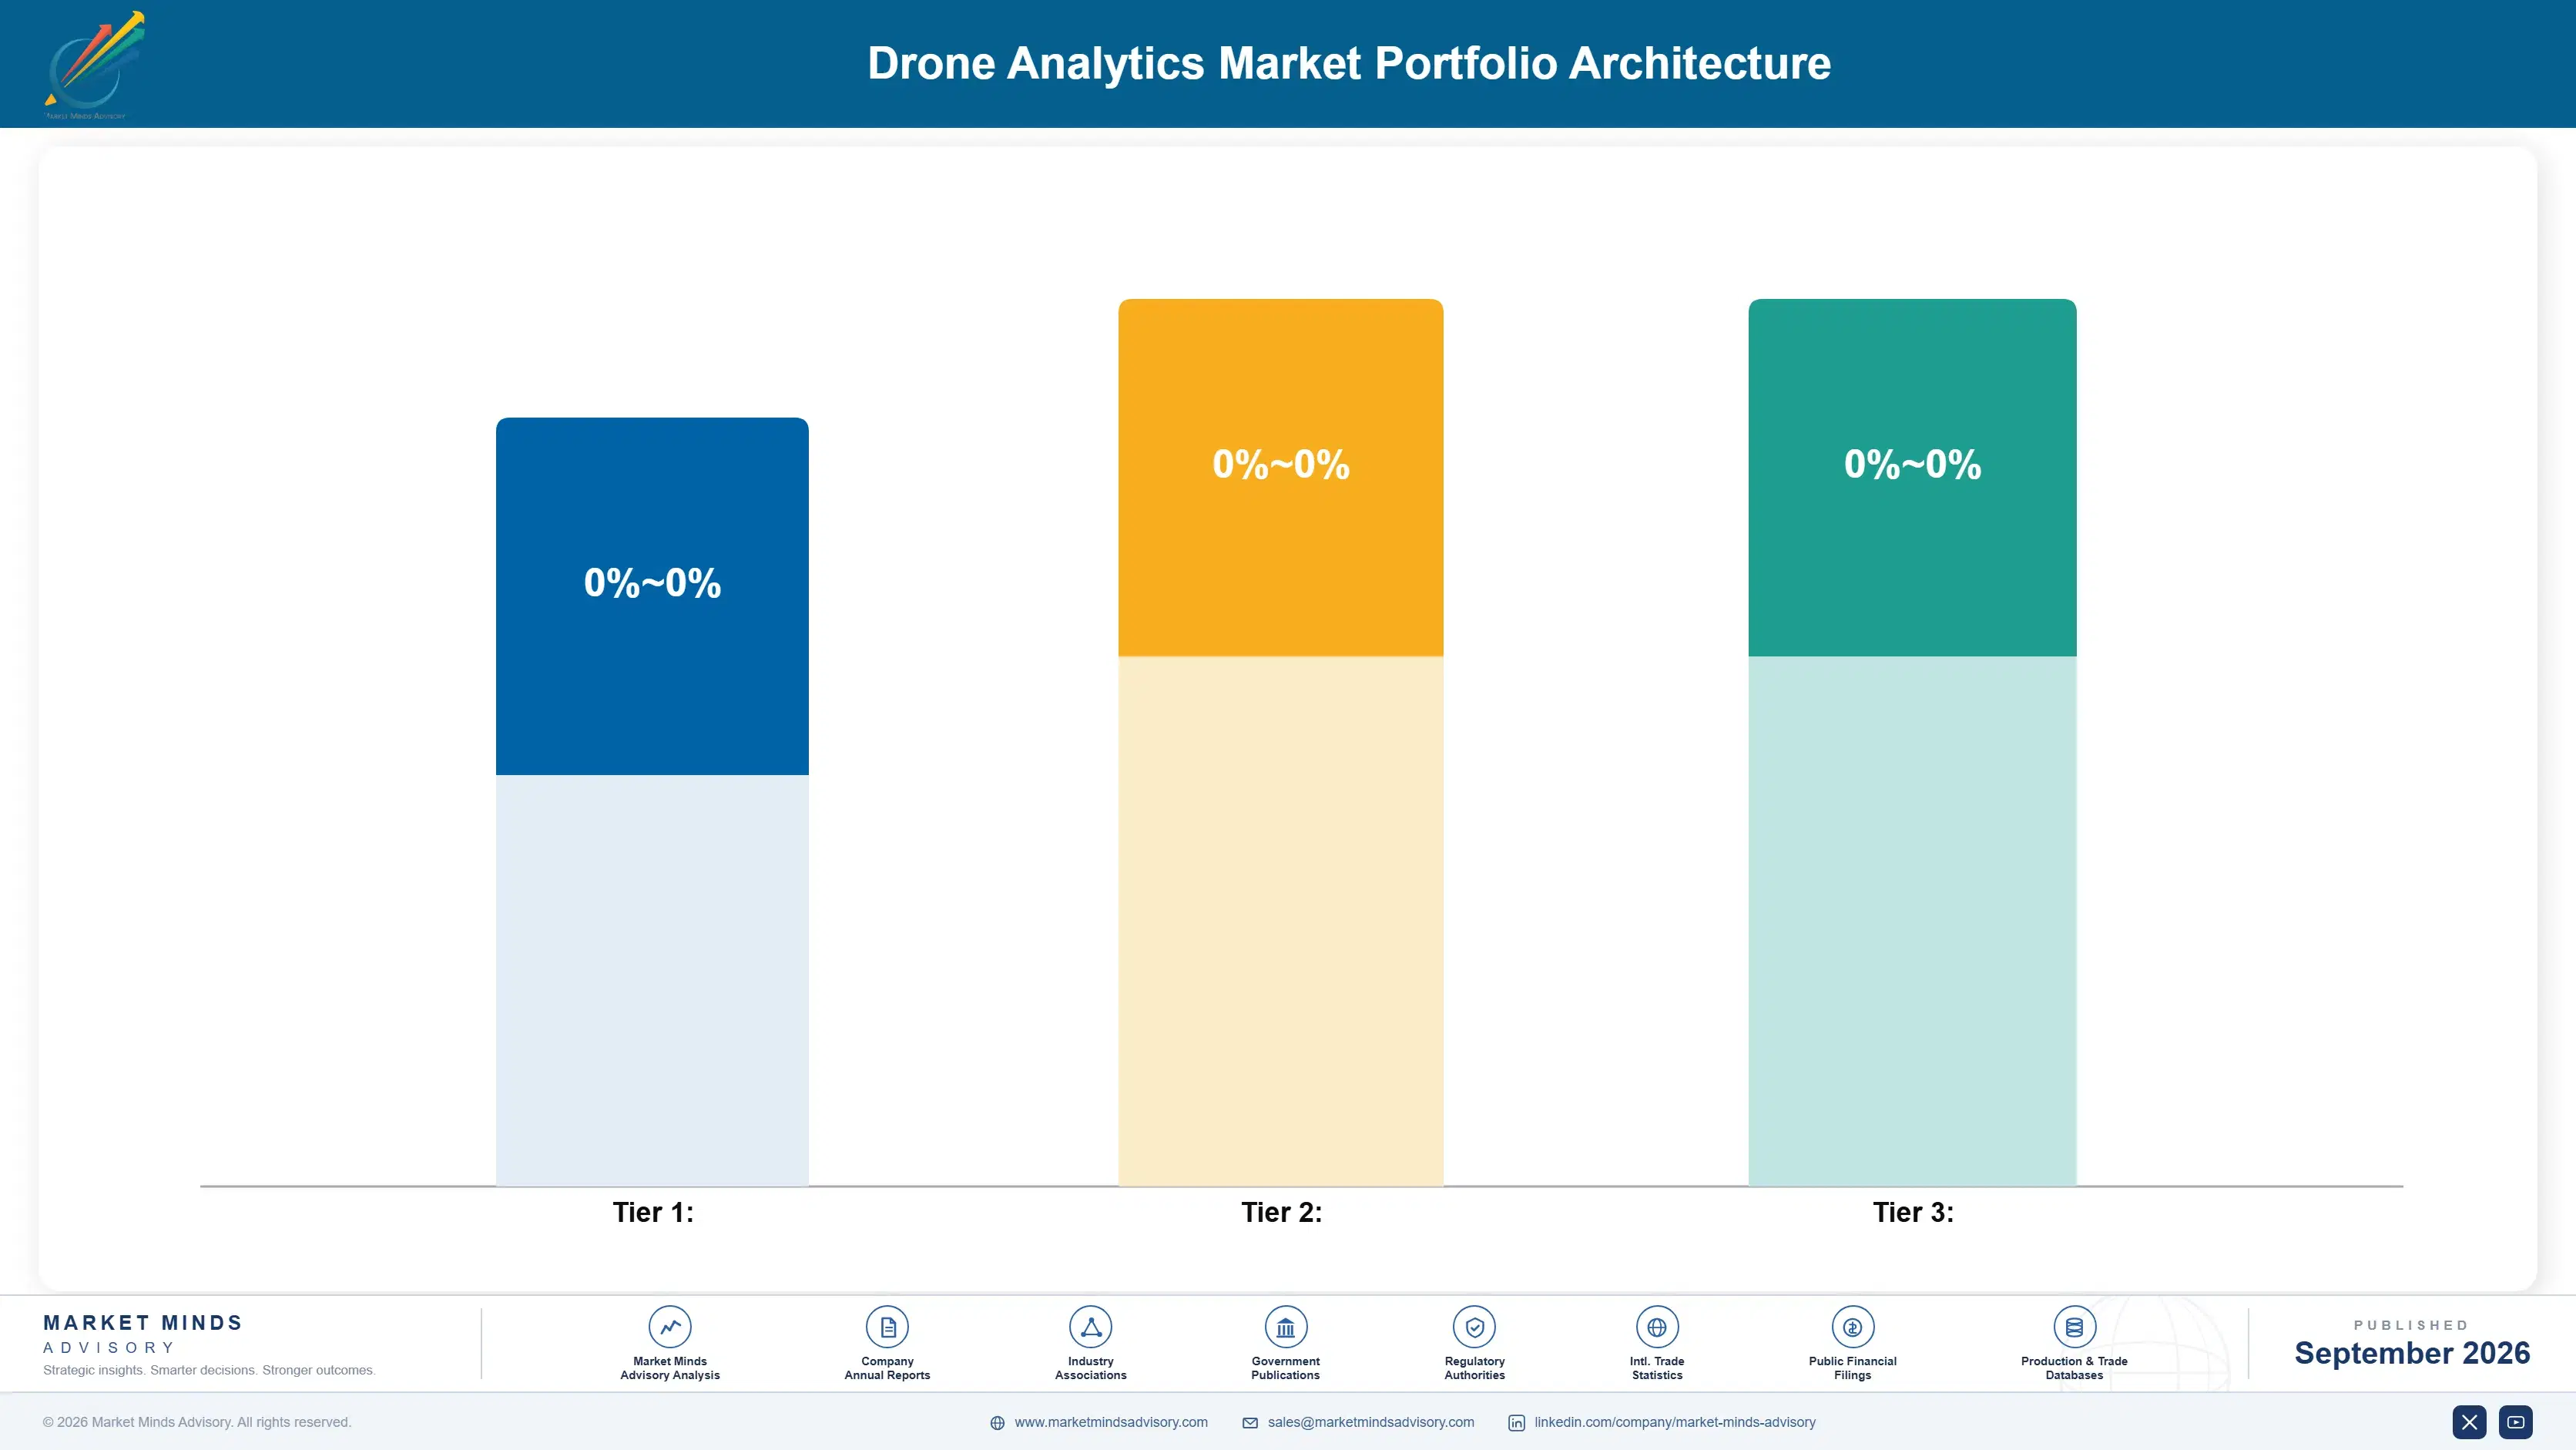
Portfolio Architecture for Margin Defence

Analytics economics split sharply between generic image processing tools with margins in the low twenties percent range and vertical-specific inspection platforms commanding margins well above fifty percent given specialized training data and detection accuracy. That gap continues widening as infrastructure operators pay premiums for documented, reliable defect detection. Vendors unable to differentiate beyond generic tools face persistently lower long-term returns.
The tension between generic and specialized capability runs through nearly every vendor's product roadmap right now, since smaller customers still need affordable basic processing tools even as the fastest-growing revenue pool sits squarely in vertical-specific infrastructure inspection. Vendors that chase generic volume exclusively risk ceding the higher-margin segment entirely to focused specialists. That risk compounds each year infrastructure inspection demand continues accelerating.

High-value pools concentrate around vertical-specific detection accuracy, compliance documentation, and enterprise rollout conversion, all of which carry meaningfully better margins than generic image processing sales. Vendors positioning early in these pools are capturing outsized profitability relative to their flight volume, a pattern MMA expects to persist through the current infrastructure modernization cycle. Watch this dynamic closely over the coming several years. Margins remain solid.

Generic image processing and basic mapping tools sold largely on price and ease of setup, carrying margins in the low twenties percent range across most vendors. Renewal decisions here typically depend on price competition rather than accuracy differentiation.
Gross Margin

Vertical-specific infrastructure inspection platforms engineered for utility and construction customers, commanding margins above fifty percent given specialized training data. Contract commitments here typically span multiple years of utility relationship depth.
Gross Margin

Compliance-certified documentation platforms and emerging predictive maintenance analytics carrying the highest margins but still limited adoption scale. Adoption is expanding steadily as vendors add new predictive capability to their platforms.
Gross Margin
drone-analytics-market-portfolio-architecture-1789996323417

High-value Sub-segments and Strategic Watch-out

AI-Powered Infrastructure Inspection Analytics

High-value, high-growth segment where demand consistently outpaces vendor training data capacity, commanding premium pricing and the fastest revenue growth of any category tracked in this report. Order backlogs continue extending well past six months for most leading vendors. Capacity remains the binding constraint on further growth.

Agricultural and Construction Site Monitoring Analytics

High-value, moderate-growth segment benefiting from steady documentation demand, though growth trails infrastructure inspection given a comparatively larger installed base. Margins there remain thinner than in infrastructure-focused categories. Diversification demand keeps growing steadily each quarter here. Vendors here increasingly bundle documentation tools to defend against slower relative growth here.

Generic Image Processing and Mapping Tools

Volume core segment generating steady, predictable revenue across nearly every smaller customer account, though margins remain persistently compressed relative to premium categories. Price competition here remains intense across nearly every vendor segment. Consolidation among smaller vendors appears increasingly likely soon. Volume remains stable overall. Growth remains steady.

Drone Hardware Manufacturer In-House Analytics

Strategic watch-out segment where hardware manufacturers building bundled analytics are absorbing revenue historically owned by standalone software vendors, a shift that could reshape competitive rankings over time. Established vendors increasingly seek partnerships to defend against this exact trend. Watch this competitive dynamic closely over coming years.

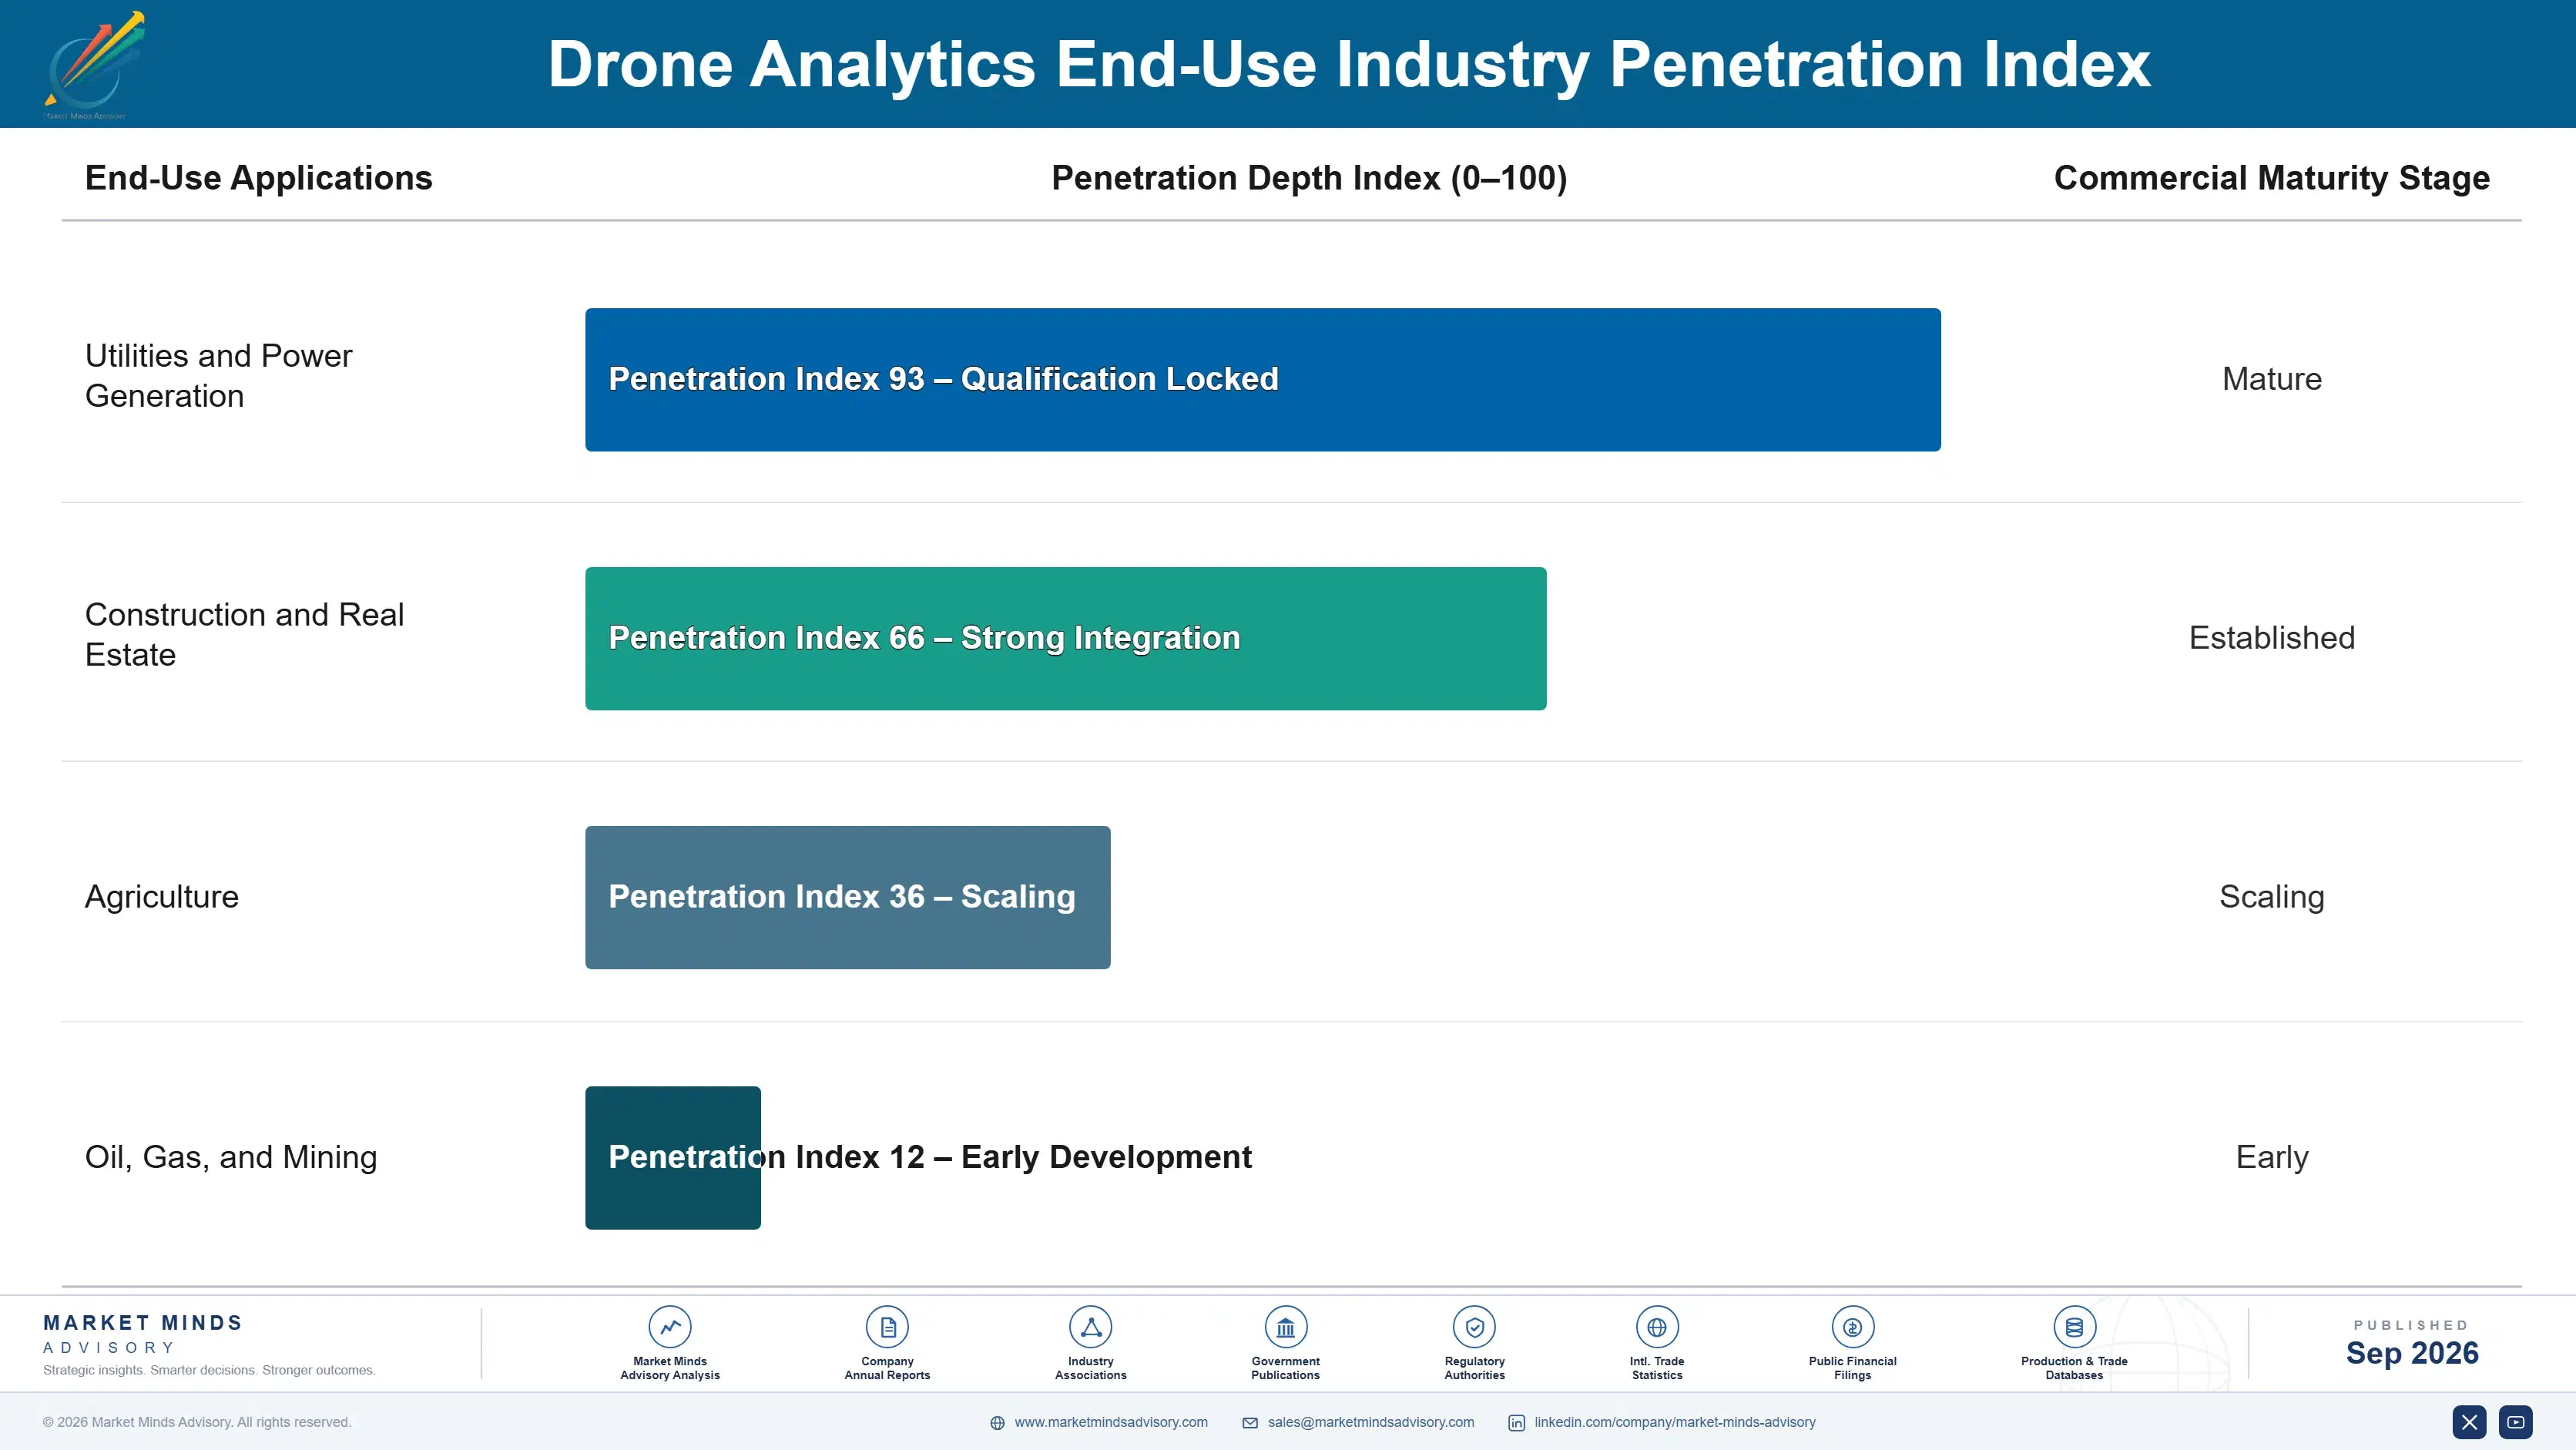
Inspection Cycles as a Recurring Annuity

Drone analytics relationships behave like annuities once an inspection program is established, since defect detection models improve with each additional inspection cycle as they accumulate site-specific training data over time. Switching vendors mid-program means starting model accuracy over from a lower baseline, a cost that keeps operators committed to their initial platform choice across successive inspection cycles even when competitors offer meaningfully lower subscription pricing.
Adoption depth varies considerably by end-use vertical. Utilities with mandated regulatory inspection cadences show the deepest platform dependency, since their compliance requirements demand consistent, documented inspection records across every asset. Construction firms adopt more gradually but at meaningful per-project value once documentation reliability proves out, where audit trail quality matters more than raw image resolution, giving vendors a long runway of incremental feature adoption over successive projects.

Buyer profiles are shifting generationally as facilities managers who once treated aerial inspection as an occasional specialty service give way to a cohort that budgets for continuous, AI-powered monitoring from early in their careers managing infrastructure assets. That newer generation increasingly evaluates analytics vendors more like strategic asset management partners than one-time service providers, weighing detection accuracy and data continuity alongside traditional cost criteria.
drone-analytics-market-end-use-penetration-index-1789996323902

Where MMA Sees the Advantage

These are among the four positions where our research anticipates prominent divergence between winners and laggards over the coming forecast period. Each is grounded in the demand model, the regulatory perimeter, and the announced capacity pipeline.
01 / VERTICAL ACCURACY INVESTMENT

Build vertical-specific detection accuracy before rivals catch up

Vendors that invest early in vertical-specific defect detection accuracy hold a durable edge as infrastructure operators increasingly select platforms based on documented performance for their specific asset types and regulatory requirements. This capability is genuinely difficult to build quickly, which is exactly why vendors without it are steadily losing enterprise accounts to more specialized competitors today. MMA expects this gap to widen considerably further before it narrows meaningfully, rewarding vendors willing to invest in vertical accuracy now rather than waiting.
02 / COMPLIANCE DOCUMENTATION PACKAGING

Bundle regulatory audit trail capability as a premium tier

Utility and infrastructure operators pay considerably more for vendors that provide pre-built compliance documentation than for vendors offering raw analytics alone, and that pricing gap is only growing wider with each passing quarter across the industry. That willingness to pay is not yet fully priced into most vendors' current product lineups across the category today. Real margin is being left squarely on the table for any vendor willing to formalize this compliance documentation into a distinct, clearly marketed tier going forward.
03 / ENTERPRISE ROLLOUT EXPANSION

Convert single-site pilots into multi-site enterprise programs

Enterprises operating pilot programs across a single site represent the highest-value expansion opportunity in the entire category, since few competitors have built genuinely convincing multi-site rollout consistency at truly meaningful scale today across every region they currently serve worldwide. This complexity is exactly why enterprise rollout conversion commands considerably higher contract values than isolated pilot engagements ever could achieve on their own. MMA sees this segment as considerably underserved relative to its genuine commercial value going forward, and expects competition to intensify.
04 / HARDWARE BUNDLING RISK

Watch drone manufacturers bundle analytics into hardware sales

Drone hardware manufacturers building in-house analytics capability pose the clearest competitive threat to standalone software vendors relying on independent licensing revenue as a durable business model over the coming several years ahead. Vendors that fail to demonstrate accuracy advantages beyond what bundled hardware offerings provide risk losing exactly the price-sensitive accounts that fund considerable volume growth today and well into the future. MMA expects this competitive pressure to intensify rather than fade anytime soon across most major markets worldwide today.

Engagement Snapshot From the Field

A live engagement with an industry participant carrying material or product regulatory and market exposure ahead of a defining policy shift, showing how our research translates into a defensible multi-year portfolio strategy.
MARKET MINDS ADVISORY · CLIENT ENGAGEMENT SUMMARY
Drone Analytics Producer Strategic Portfolio Review and Transition Roadmap 2026·Investment Scenario on Drone Analytics Exposure Evaluation 2025-26
CLIENT PROFILE
The client is a regional electric utility operating transmission infrastructure across a three-state service territory, managing thousands of towers and miles of power lines requiring regular inspection to meet regulatory compliance requirements. Facing rising manual inspection costs and mounting regulatory pressure to document inspection findings more rigorously, leadership sought an independent assessment of which drone analytics platform would best support a transition away from manual climbing inspections.
STRATEGIC CHALLENGE
The client's engineering team had received competing pitches from three analytics vendors, each claiming superior defect detection accuracy without a consistent basis for comparison against the utility's specific tower and line configurations. Internal stakeholders disagreed on whether to fully replace manual inspections immediately or run a phased transition validating AI accuracy against experienced human inspectors first.
MMA APPROACH
MMA benchmarked three analytics vendors against the client's specific tower and transmission line configurations, running a parallel comparison between AI-flagged defects and findings from the utility's experienced human inspection team across a sample of towers throughout the territory. The engagement combined vendor technical assessments, inspector interviews, and a detection accuracy comparison study.
KEY FINDINGS
  1. The leading vendor's AI detection matched or exceeded human inspector findings on eighty-nine percent of identified defects, with several catches the human inspection team had initially missed entirely.
  2. Two of three evaluated vendors showed meaningfully lower detection accuracy on the utility's specific older tower designs, a gap not evident in vendor marketing materials focused on newer infrastructure.
  3. A phased transition validating AI accuracy over two inspection cycles before fully replacing manual climbing inspections reduced regulatory risk considerably relative to immediate full replacement.
  4. Total inspection cost using the recommended vendor's platform was meaningfully lower than continuing manual climbing inspections, even after accounting for the phased validation period's added cost.
CLIENT PROFILE
The client is a regional electric utility operating transmission infrastructure across a three-state service territory, managing thousands of towers and miles of power lines requiring regular inspection to meet regulatory compliance requirements. Facing rising manual inspection costs and mounting regulatory pressure to document inspection findings more rigorously, leadership sought an independent assessment of which drone analytics platform would best support a transition away from manual climbing inspections.
STRATEGIC CHALLENGE
The client's engineering team had received competing pitches from three analytics vendors, each claiming superior defect detection accuracy without a consistent basis for comparison against the utility's specific tower and line configurations. Internal stakeholders disagreed on whether to fully replace manual inspections immediately or run a phased transition validating AI accuracy against experienced human inspectors first.
MMA APPROACH
MMA benchmarked three analytics vendors against the client's specific tower and transmission line configurations, running a parallel comparison between AI-flagged defects and findings from the utility's experienced human inspection team across a sample of towers throughout the territory. The engagement combined vendor technical assessments, inspector interviews, and a detection accuracy comparison study.
KEY FINDINGS
  1. The leading vendor's AI detection matched or exceeded human inspector findings on eighty-nine percent of identified defects, with several catches the human inspection team had initially missed entirely.
  2. Two of three evaluated vendors showed meaningfully lower detection accuracy on the utility's specific older tower designs, a gap not evident in vendor marketing materials focused on newer infrastructure.
  3. A phased transition validating AI accuracy over two inspection cycles before fully replacing manual climbing inspections reduced regulatory risk considerably relative to immediate full replacement.
  4. Total inspection cost using the recommended vendor's platform was meaningfully lower than continuing manual climbing inspections, even after accounting for the phased validation period's added cost.
RECOMMENDED STRATEGY
Phase 1: Phase one runs a two-cycle validation period comparing AI-flagged defects against human inspector findings across a representative tower sample. to establish a reliable accuracy baseline. Phase 2: Phase two expands AI-primary inspection across the full three-state territory once validation confirms accuracy parity with human inspectors. across every remaining service territory segment. Phase 3: Phase three retires manual climbing inspections entirely, redirecting that operational budget toward expanded AI inspection frequency. while reallocating staff to higher-value engineering tasks.
OUTCOME
The client approved the recommended platform with a projected annual inspection cost savings of approximately $6 million (client-reported, unverified by MMA) relative to continued manual climbing inspections. Internal reporting credited the standardized accuracy comparison with resolving engineering team skepticism, and the two-cycle validation period began on schedule.

Frequently Asked Questions

Foundational context covering the market sizes, CAGR, scope, country, region and competition that inform every finding below. This section is provided to cover basics and most often pre-purchase conversations, answered from the MMA Primary Research Dataset.

What is the current size of the Drone Analytics Market?

The Drone Analytics Market was valued at approximately $3.1 billion in 2025. That figure covers software platforms for infrastructure inspection, agricultural monitoring, and construction site analysis.

How large will the Drone Analytics Market be by 2036?

MMA projects the market will reach approximately $17.77 billion by 2036. Growth is driven primarily by aging utility infrastructure and AI-powered defect detection adoption worldwide.

What is the CAGR for the Drone Analytics Market 2026 to 2036?

The market is forecast to grow at a 17.2% compound annual rate between 2026 and 2036. Bull and bear scenarios range from 18.5% down to 15.9% depending on training data availability.

Which segment is growing fastest?

AI-Powered Infrastructure Inspection Analytics is the fastest-growing segment, expanding at roughly 26.7% annually, about 1.55 times the overall market rate. Utility modernization demand is the primary driver.

Who are the major companies in the Drone Analytics Market?

DroneDeploy, Skydio, PrecisionHawk, Kespry, and Pix4D lead the category on disclosed platform deployment estimates today. Combined, the top five hold roughly 36% of the market.

Which country is growing fastest?

India is the fastest-growing country at approximately 23.0% annually, ahead of the broader South Asia and Pacific region. Rapidly expanding power transmission infrastructure is the primary factor.

Report Segmentation Architecture

The full report scope spans multiple orthogonal segmentation dimensions, with cross-tabulated demand data provided for each dimension pair. Coverage extends further to regional breakdowns, trend trajectories, and the competitive detail needed to support segment-level decision-making.

By Application Type

  • Infrastructure Inspection Analytics
  • Agricultural Monitoring Analytics
  • Construction Site Analysis
  • Energy Asset Inspection
  • Environmental and Land Survey Analytics

By End-Use Industry

  • Utilities and Power Generation
  • Construction and Real Estate
  • Agriculture
  • Oil, Gas, and Mining

By Commercial Dimension

  • Direct Enterprise Subscription Contracts
  • Multi-Site Enterprise Rollout Agreements
  • Data Partnership Programs
  • Reseller and Integration Partner Channels

By Region

  • North America
  • East Asia
  • Western Europe
  • South Asia and Pacific
  • Latin America
  • Middle East and Africa
  • Eastern Europe

Scope, Methodology, and Coverage

Every figure in this report is reproducible from documented input assumptions. The scope below maps the historical period, the forecast horizon, the segmentation dimensions, and the countries covered, alongside the underlying primary and qualitative methodology.
Historical Period
2020 to 2025
Forecast Period
2026 to 2036
Base Year
2025 (USD billions; MMA Primary Research Dataset, September 2026)
Market Definition
This report defines the Drone Analytics Market as software platforms that process and analyze drone-captured imagery and sensor data for infrastructure inspection, agricultural monitoring, and construction site analysis. It excludes drone hardware manufacturing, flight control software, and general aerial photography services without analytical processing components.
Quantitative Units
USD Billion, CAGR (%), Active Platform Subscriptions
Segmentation Dimensions
Application Type, End-Use Industry, Commercial Dimension, Region
Regions Covered
North America, East Asia, Western Europe, South Asia and Pacific, Latin America, Middle East and Africa, Eastern Europe
Countries Covered
United States, China, Germany, India, Brazil, United Kingdom, Japan, and 13 additional countries
Key Companies Profiled
DroneDeploy, Skydio, PrecisionHawk, Kespry, Pix4D, and 15 additional companies
Quantitative Methodology
Primary survey, n=3,800 respondents, Q4 2025, six countries; demand-side model with trade association cross-validation
Qualitative Methodology
47 expert interviews, Q4 2025; applied to validate demand model assumptions, identify emerging dynamics, and assess competitive positioning
Report Format
PDF and XLSX data workbook (Word format preview document)
Publisher
Market Minds Advisory
Report Code
MMA-2026-TEC-258
Published
September 2026
Contact
sales@marketmindsadvisory.com | www.marketmindsadvisory.com

Purchase the full Drone Analytics Market Report (2026 to 2036).

The full Drone Analytics Market report delivers a complete analysis of segment-level growth, regional demand patterns, and competitive positioning across all major analytics vendors worldwide. It includes detailed profiles of the twenty leading companies, quantified trend and driver analysis, and a full regional breakdown across all seven world regions with country-level detail where relevant. Buyers receive input cost exposure modeling and portfolio margin benchmarking that go well beyond what the executive summary alone can provide. The report also includes a proprietary MMA revenue-lever framework identifying where vendors can capture incremental margin.
Full seven-region demand and pricing breakdown
Twenty-company competitive profiles and moat analysis
Segment-level CAGR and market share detail
Input cost exposure and mitigation strategy analysis
Portfolio margin tiering across product categories
Primary survey and expert interview data tables

Built For The People Who Decide

From boardroom strategy to bench-side execution, this report is read cover-to-cover by leaders shaping the next decade of their industry, turning demand scenarios, market dynamics and valuation benchmarks into decisions.
CXOs/ Presidents/ VPs/ Managers
M&A and Corporate Development
Strategy Teams and R&D Heads
Procurement and Product Directors
Regulatory and Compliance Leaders
Investor Relations and Equity Analysts